Study and Characterization of the Dielectric Behavior of Low Linear Density Polyethylene Composites Mixed with Ground Tire Rubber Particles

 ,
,  ,
, 

Abstract
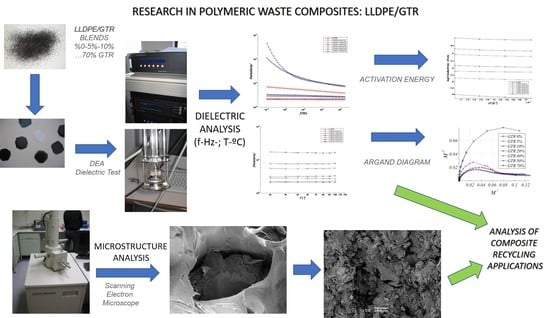
1. Introduction
Featured Application
2. Materials and Methods
2.1. Materials
2.1.1. Preparation of the Compound
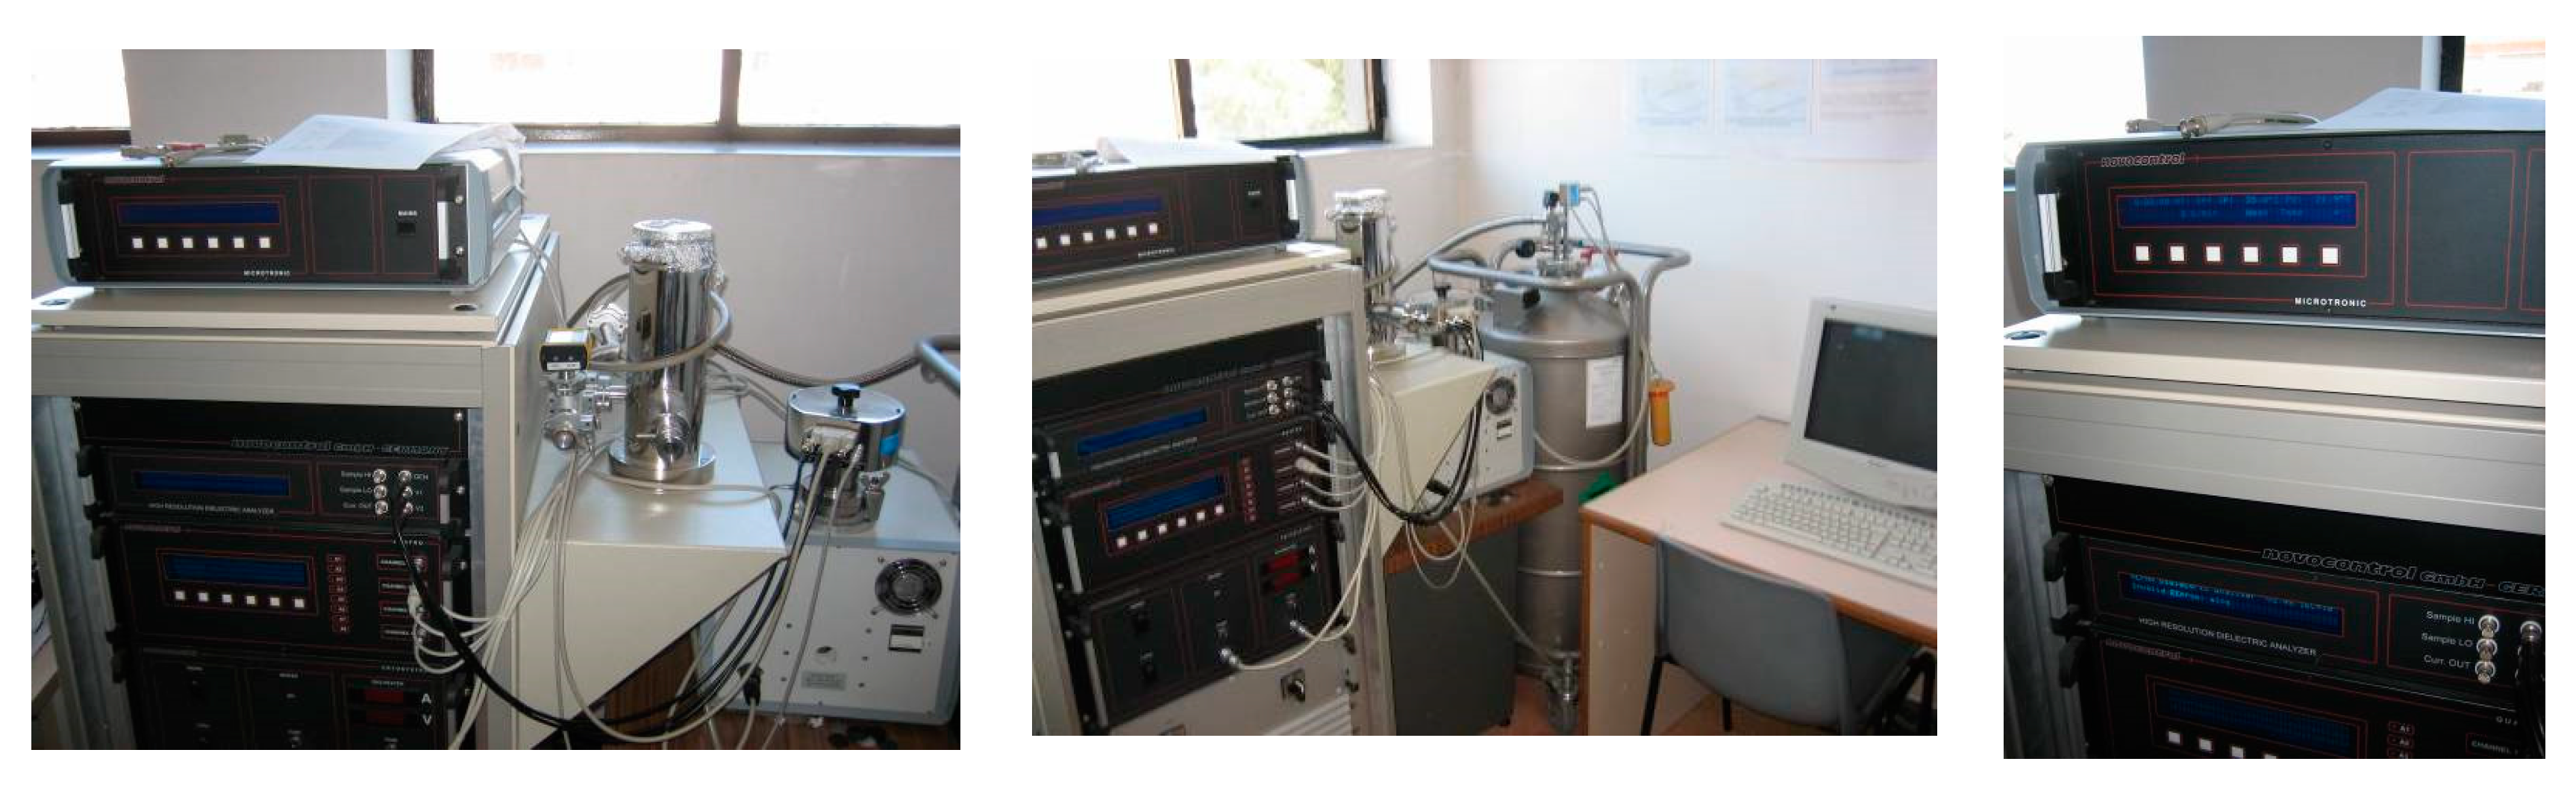
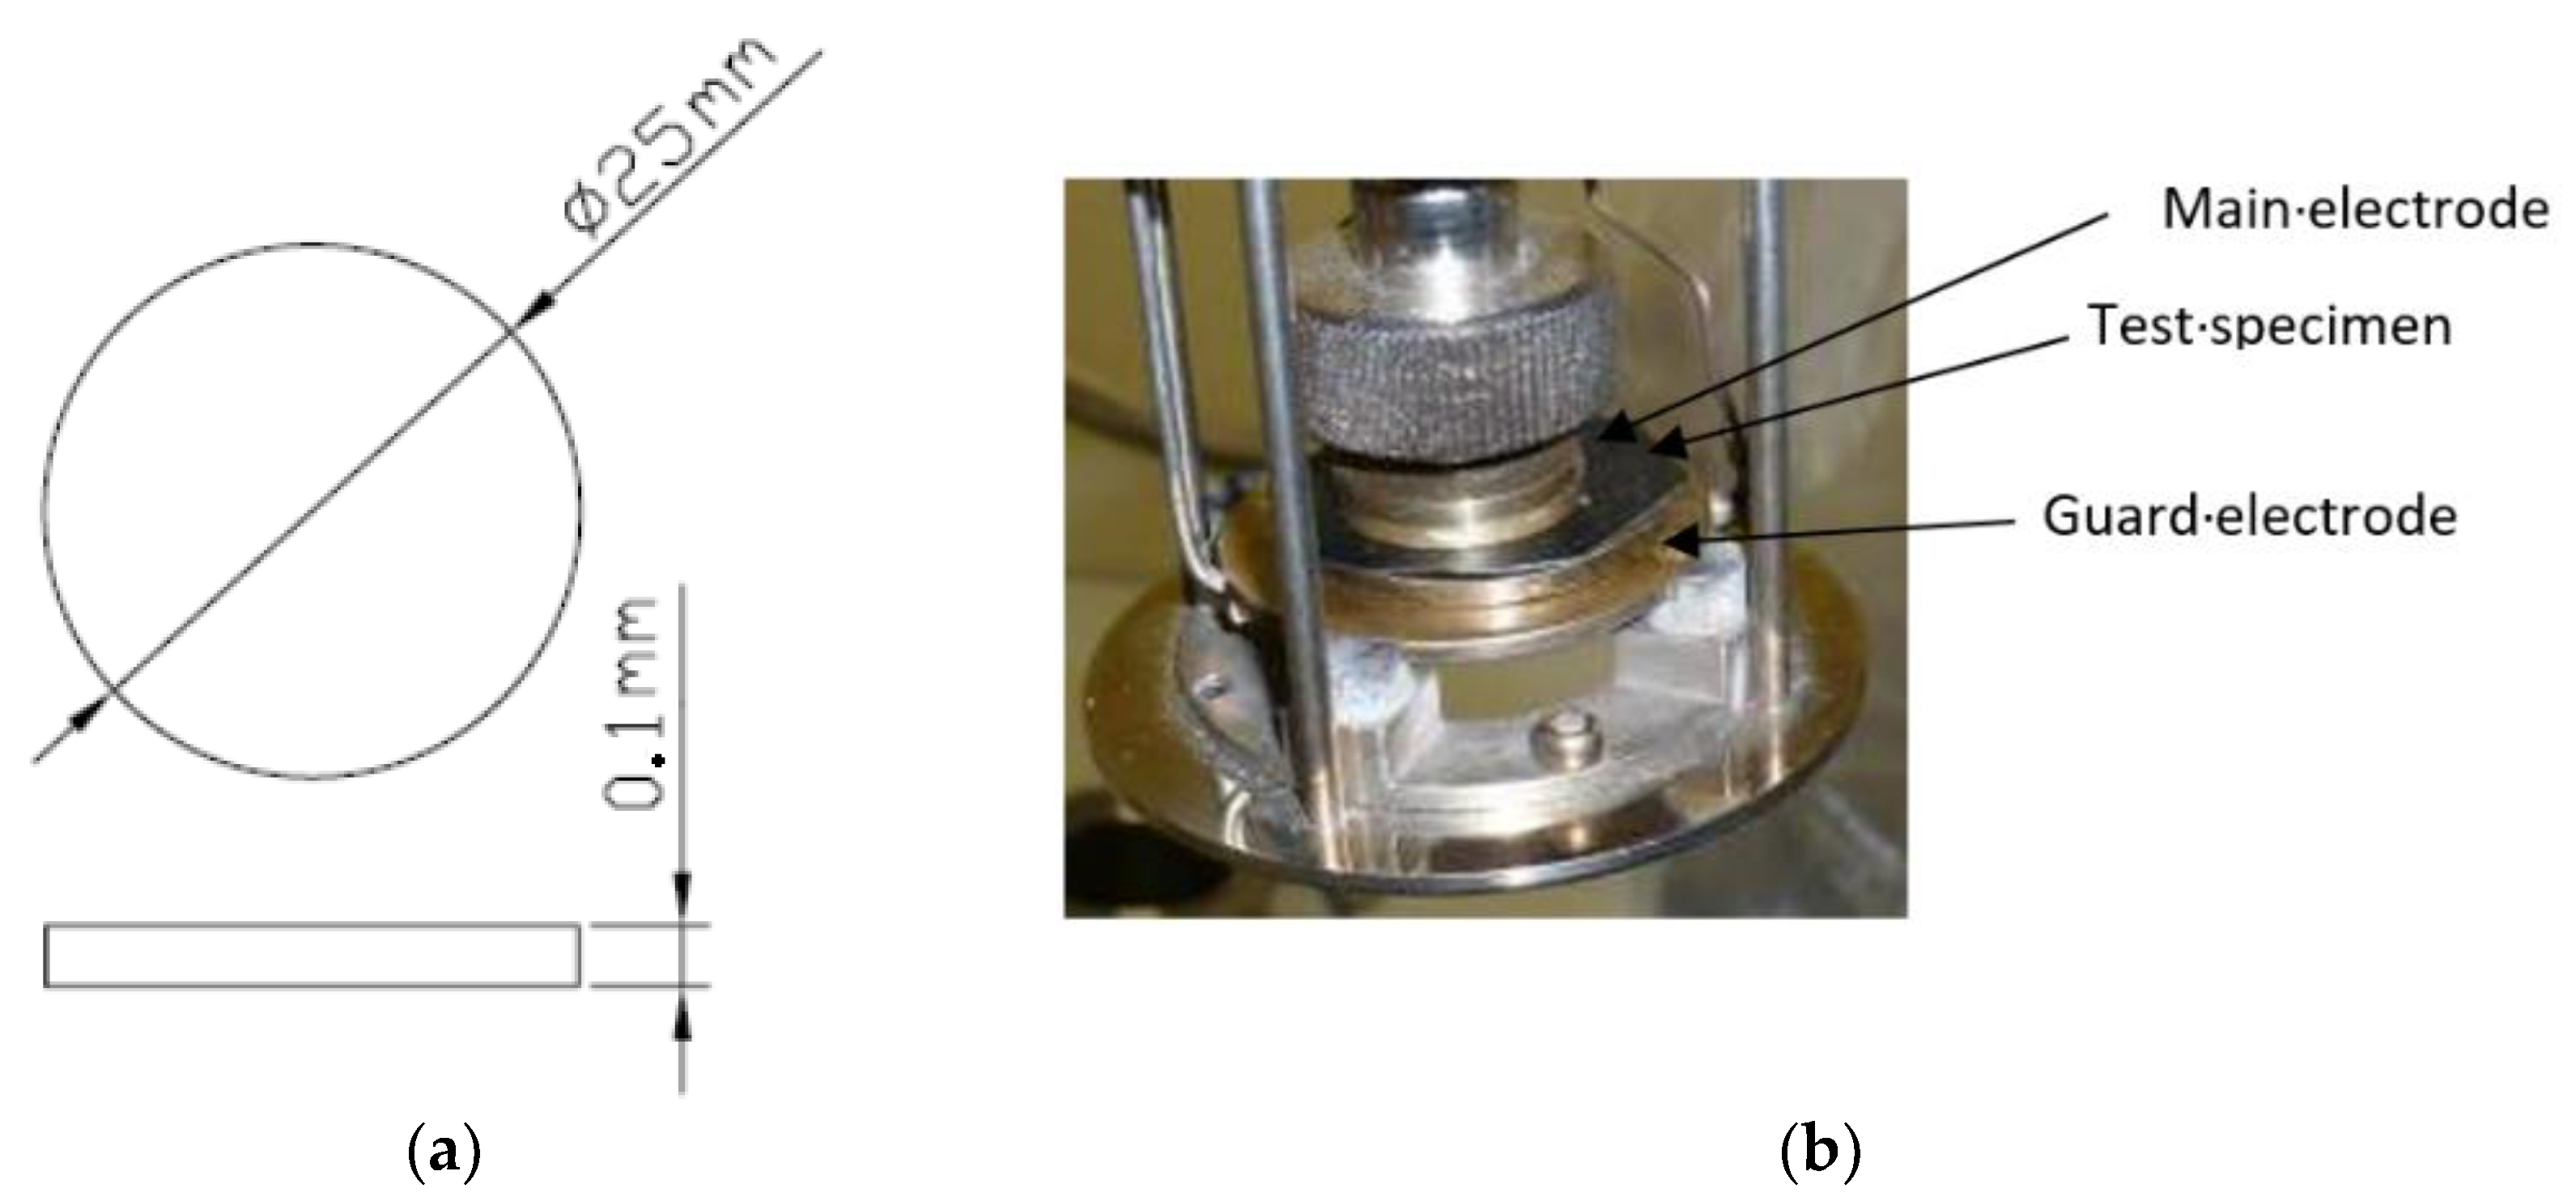
2.1.2. Dielectric Analysis
2.1.3. Samples
3. Microstructural and Electrical Characterization Results
3.1. Microstructural Analysis of the Compounds LLDPE/GTR
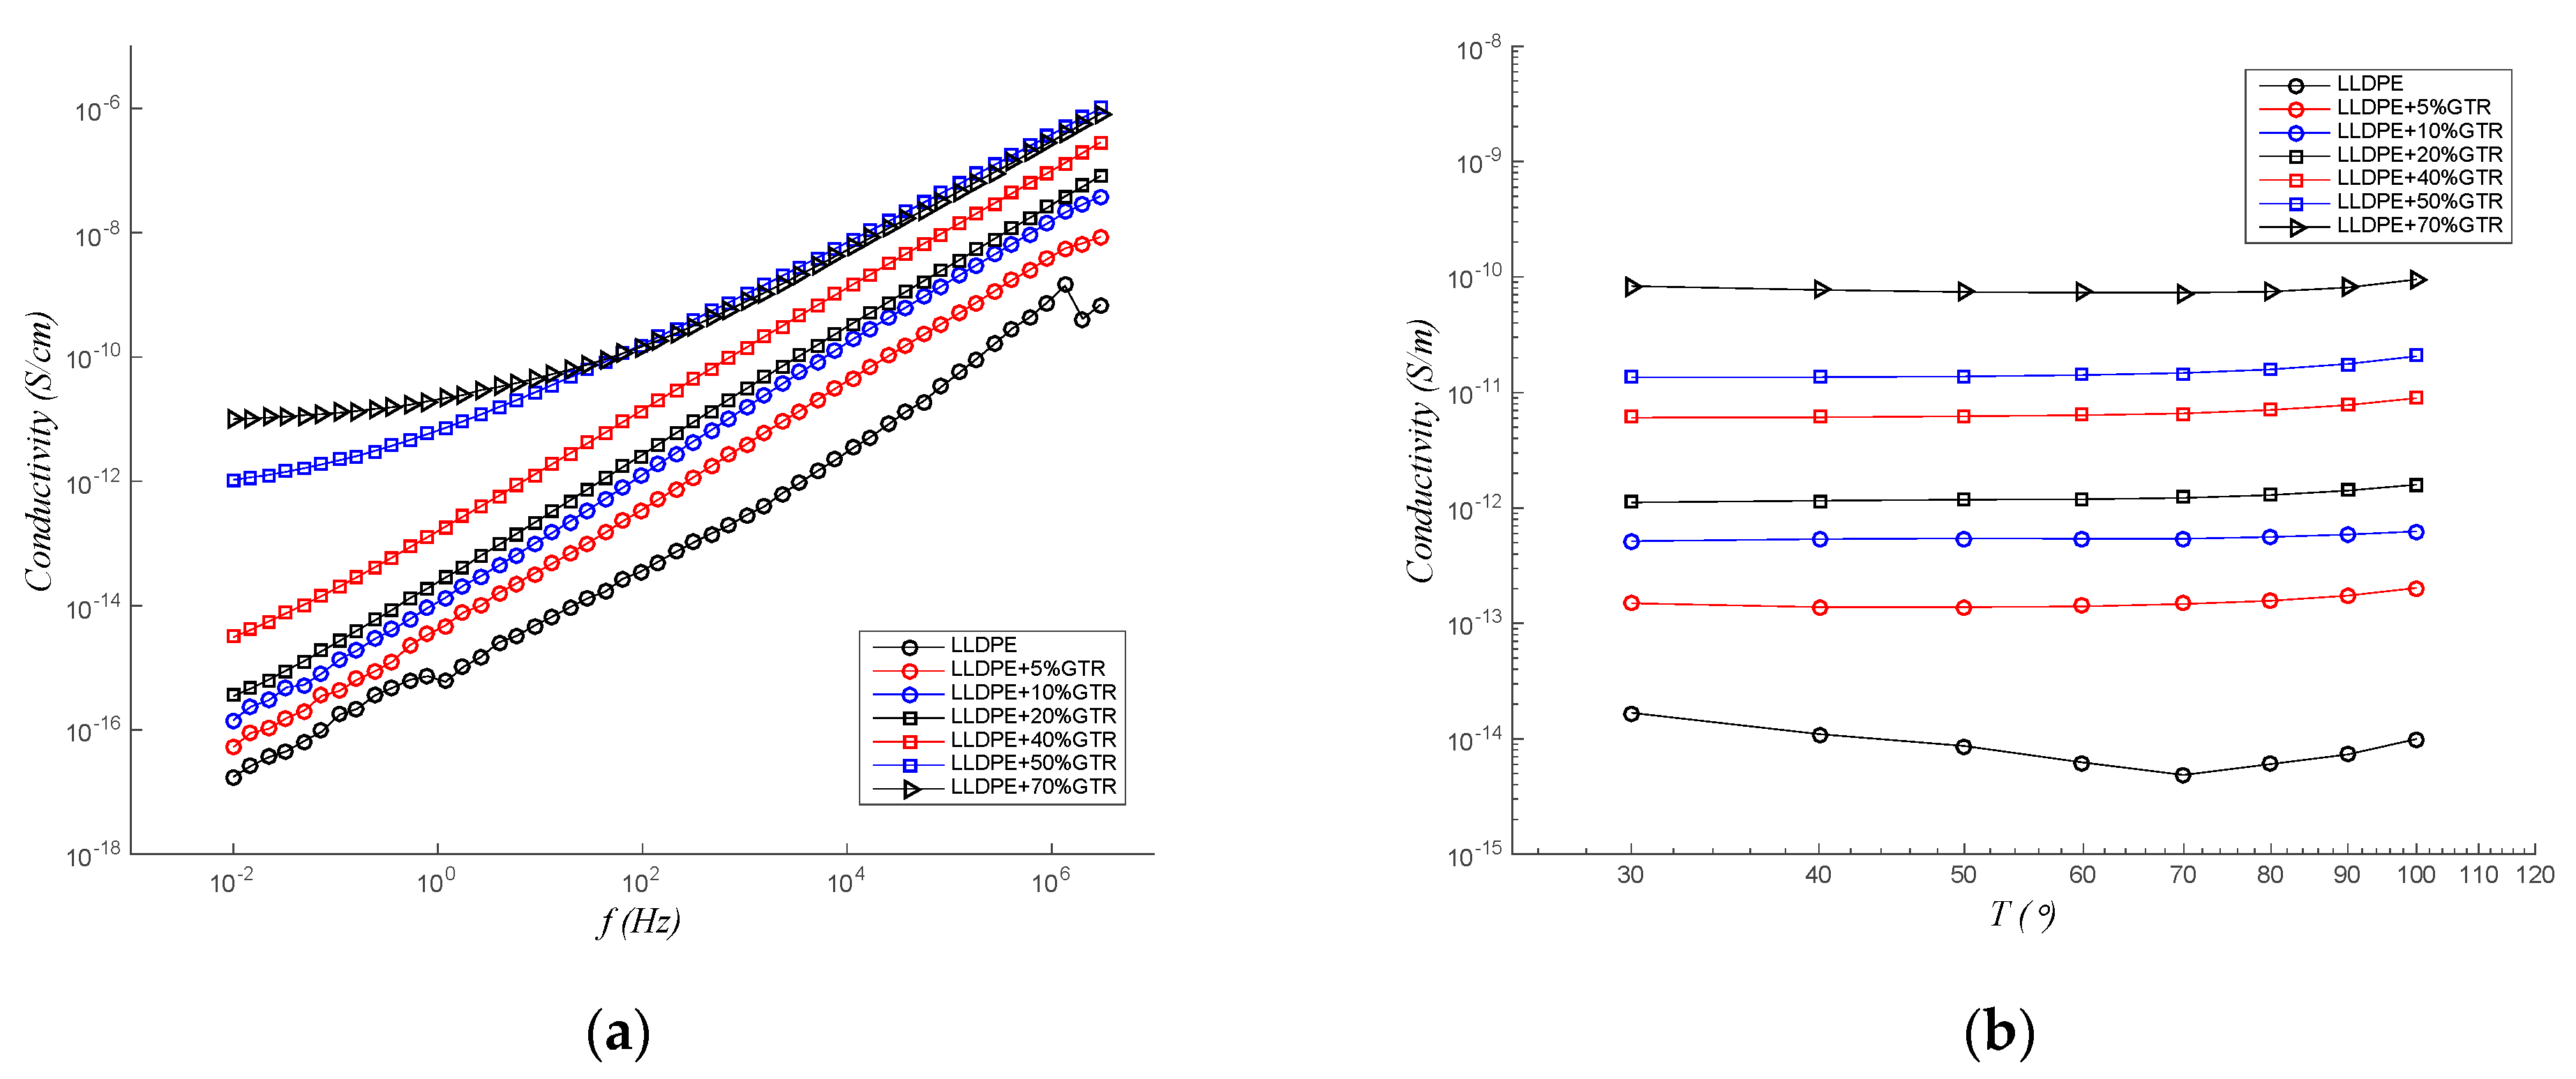
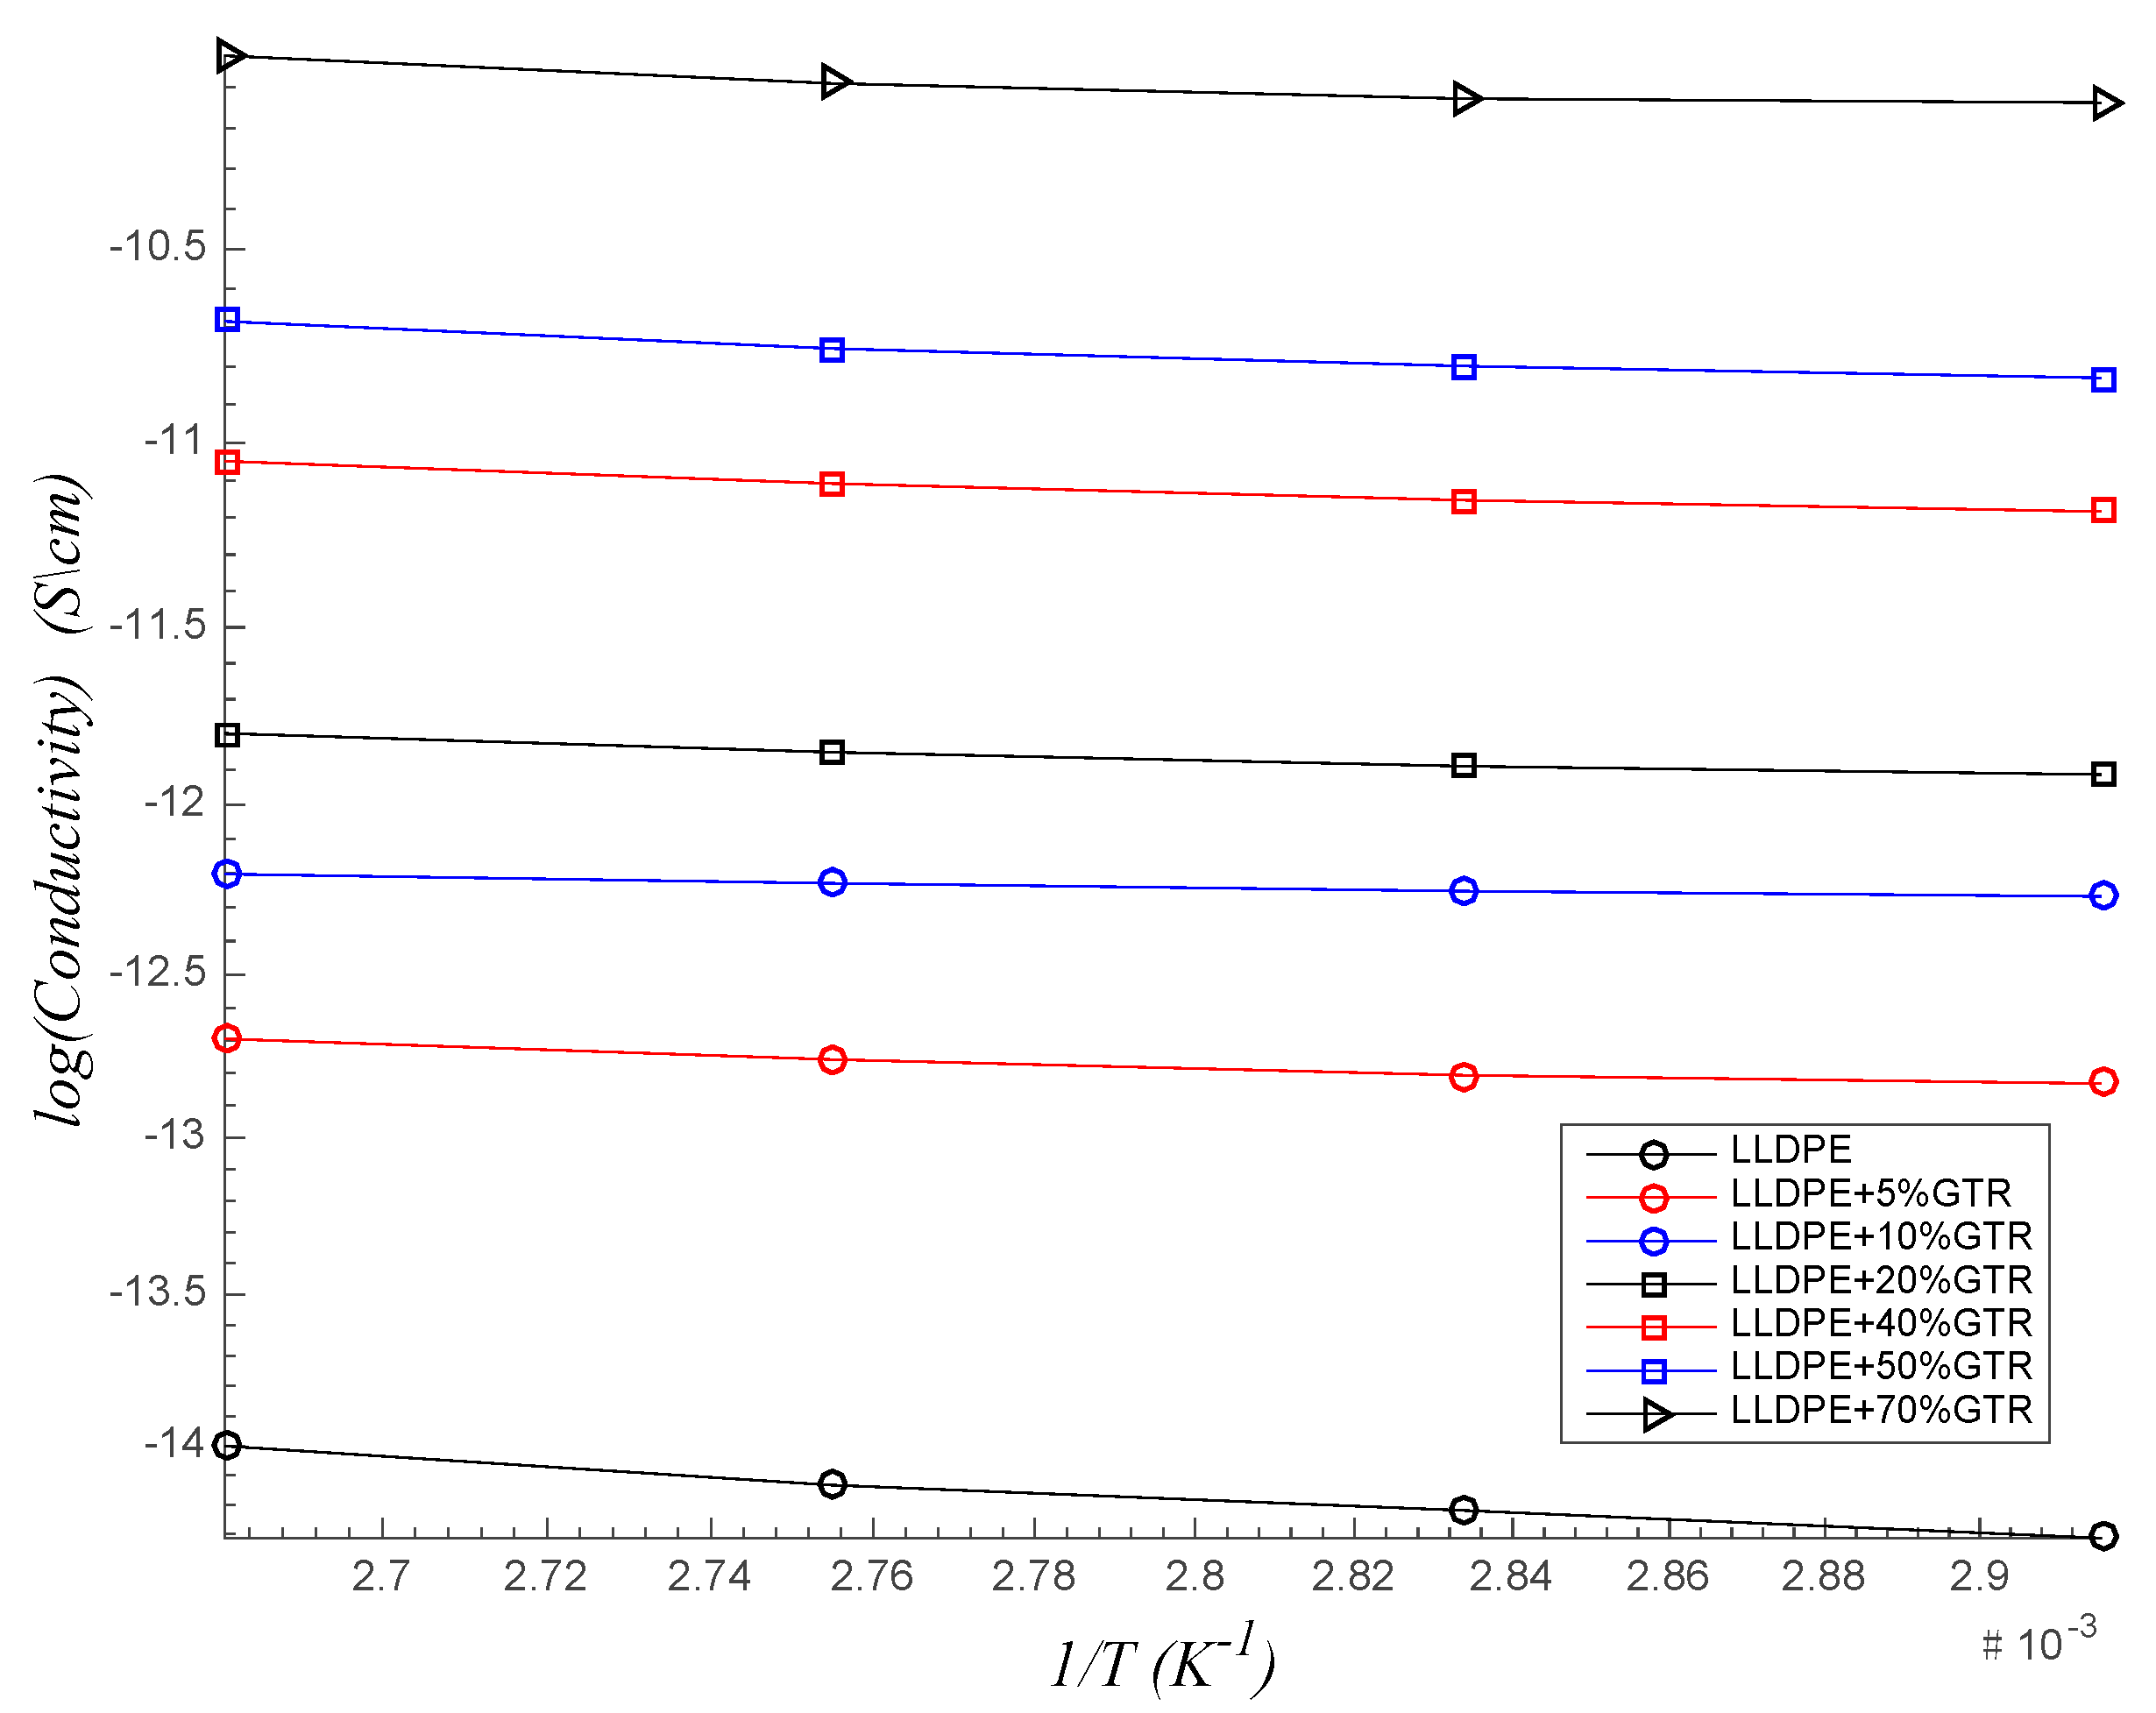
3.2. Conductivity
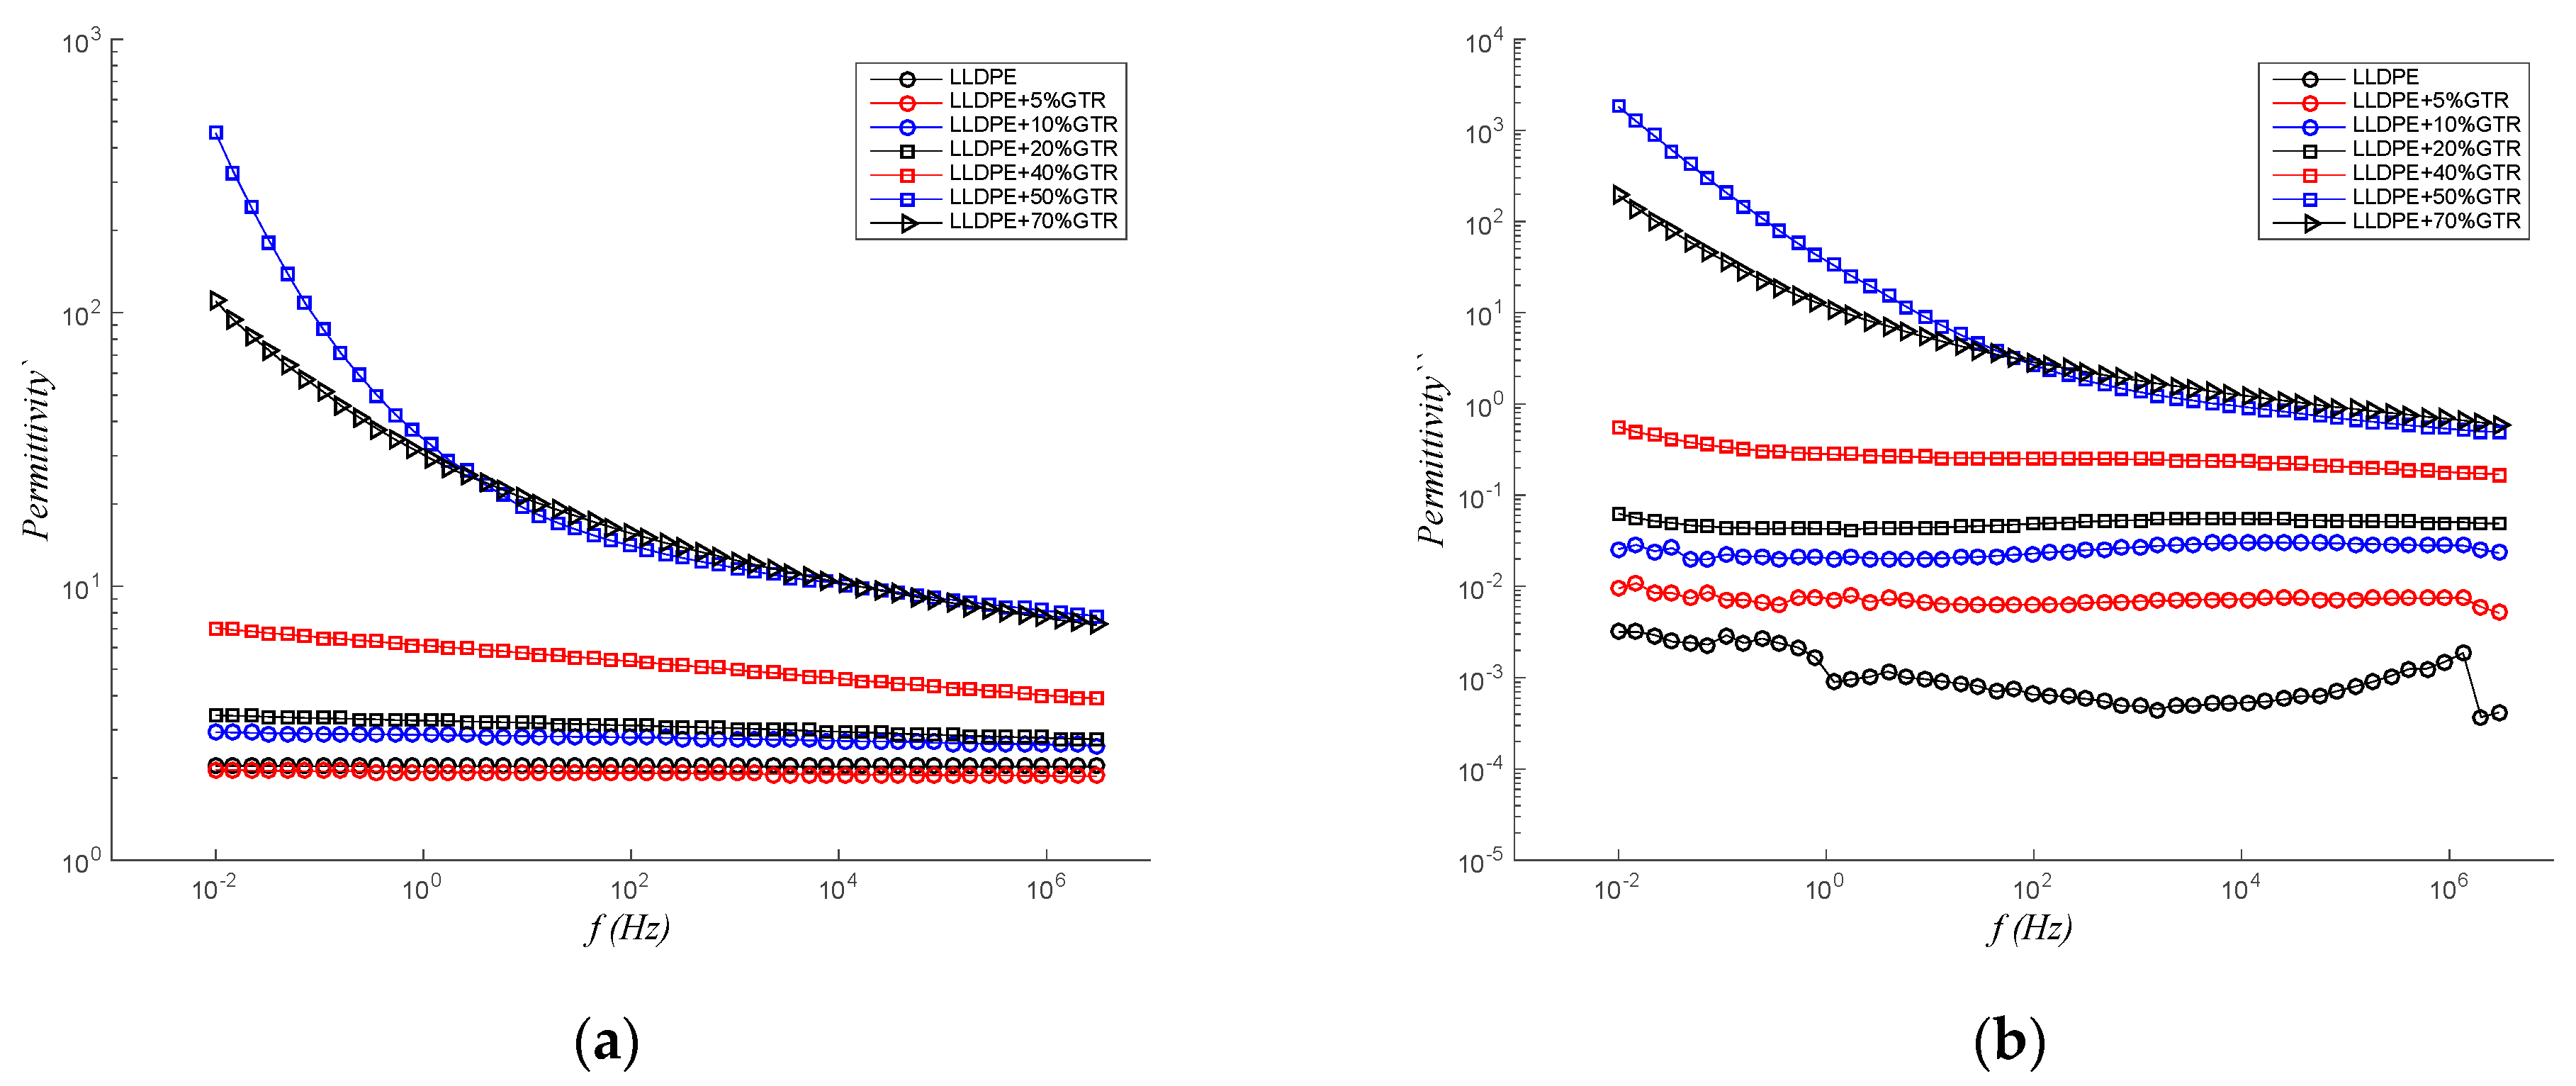
3.3. Permittivity
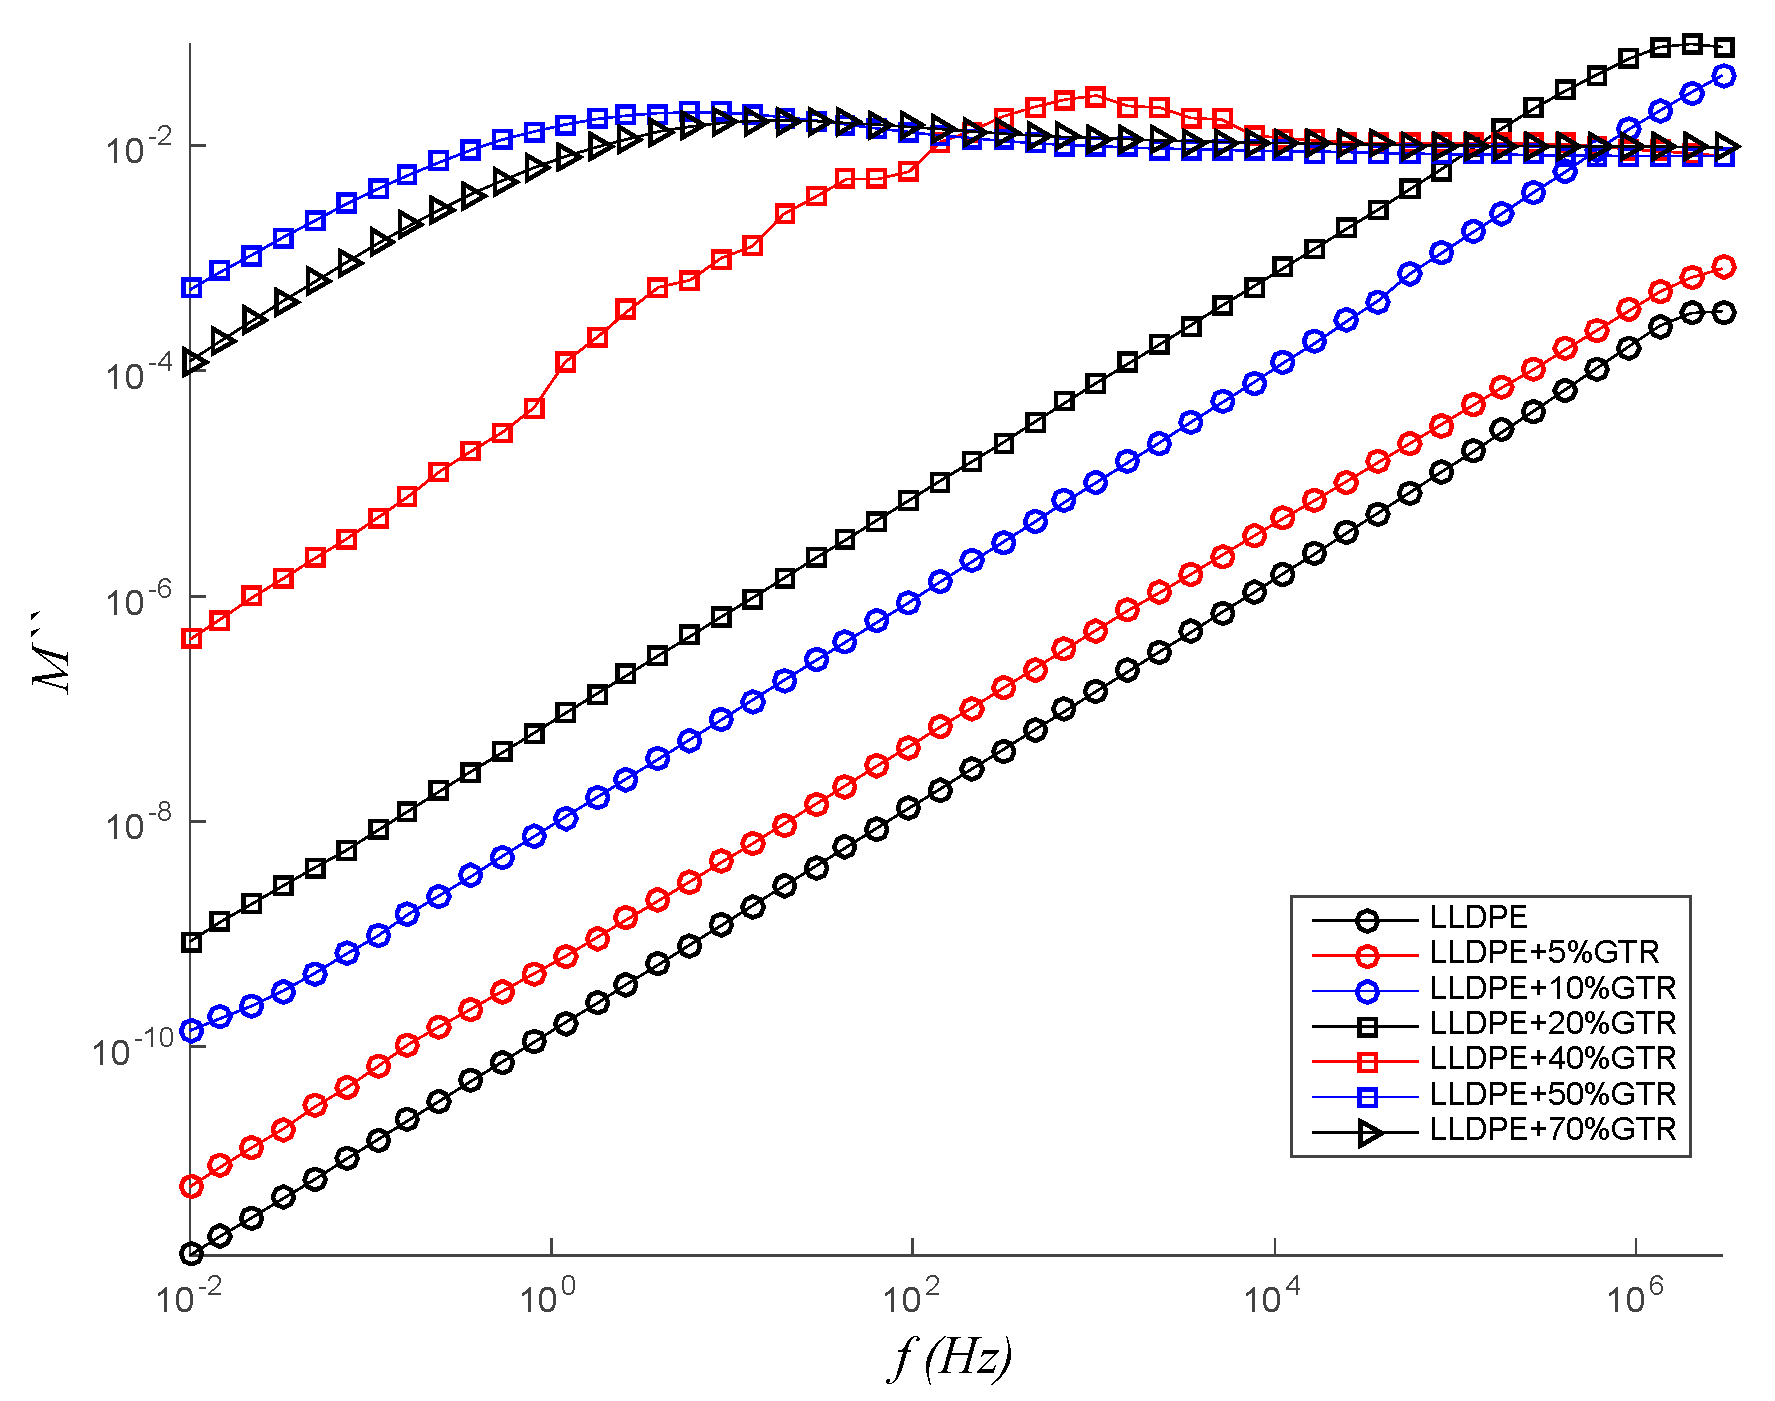
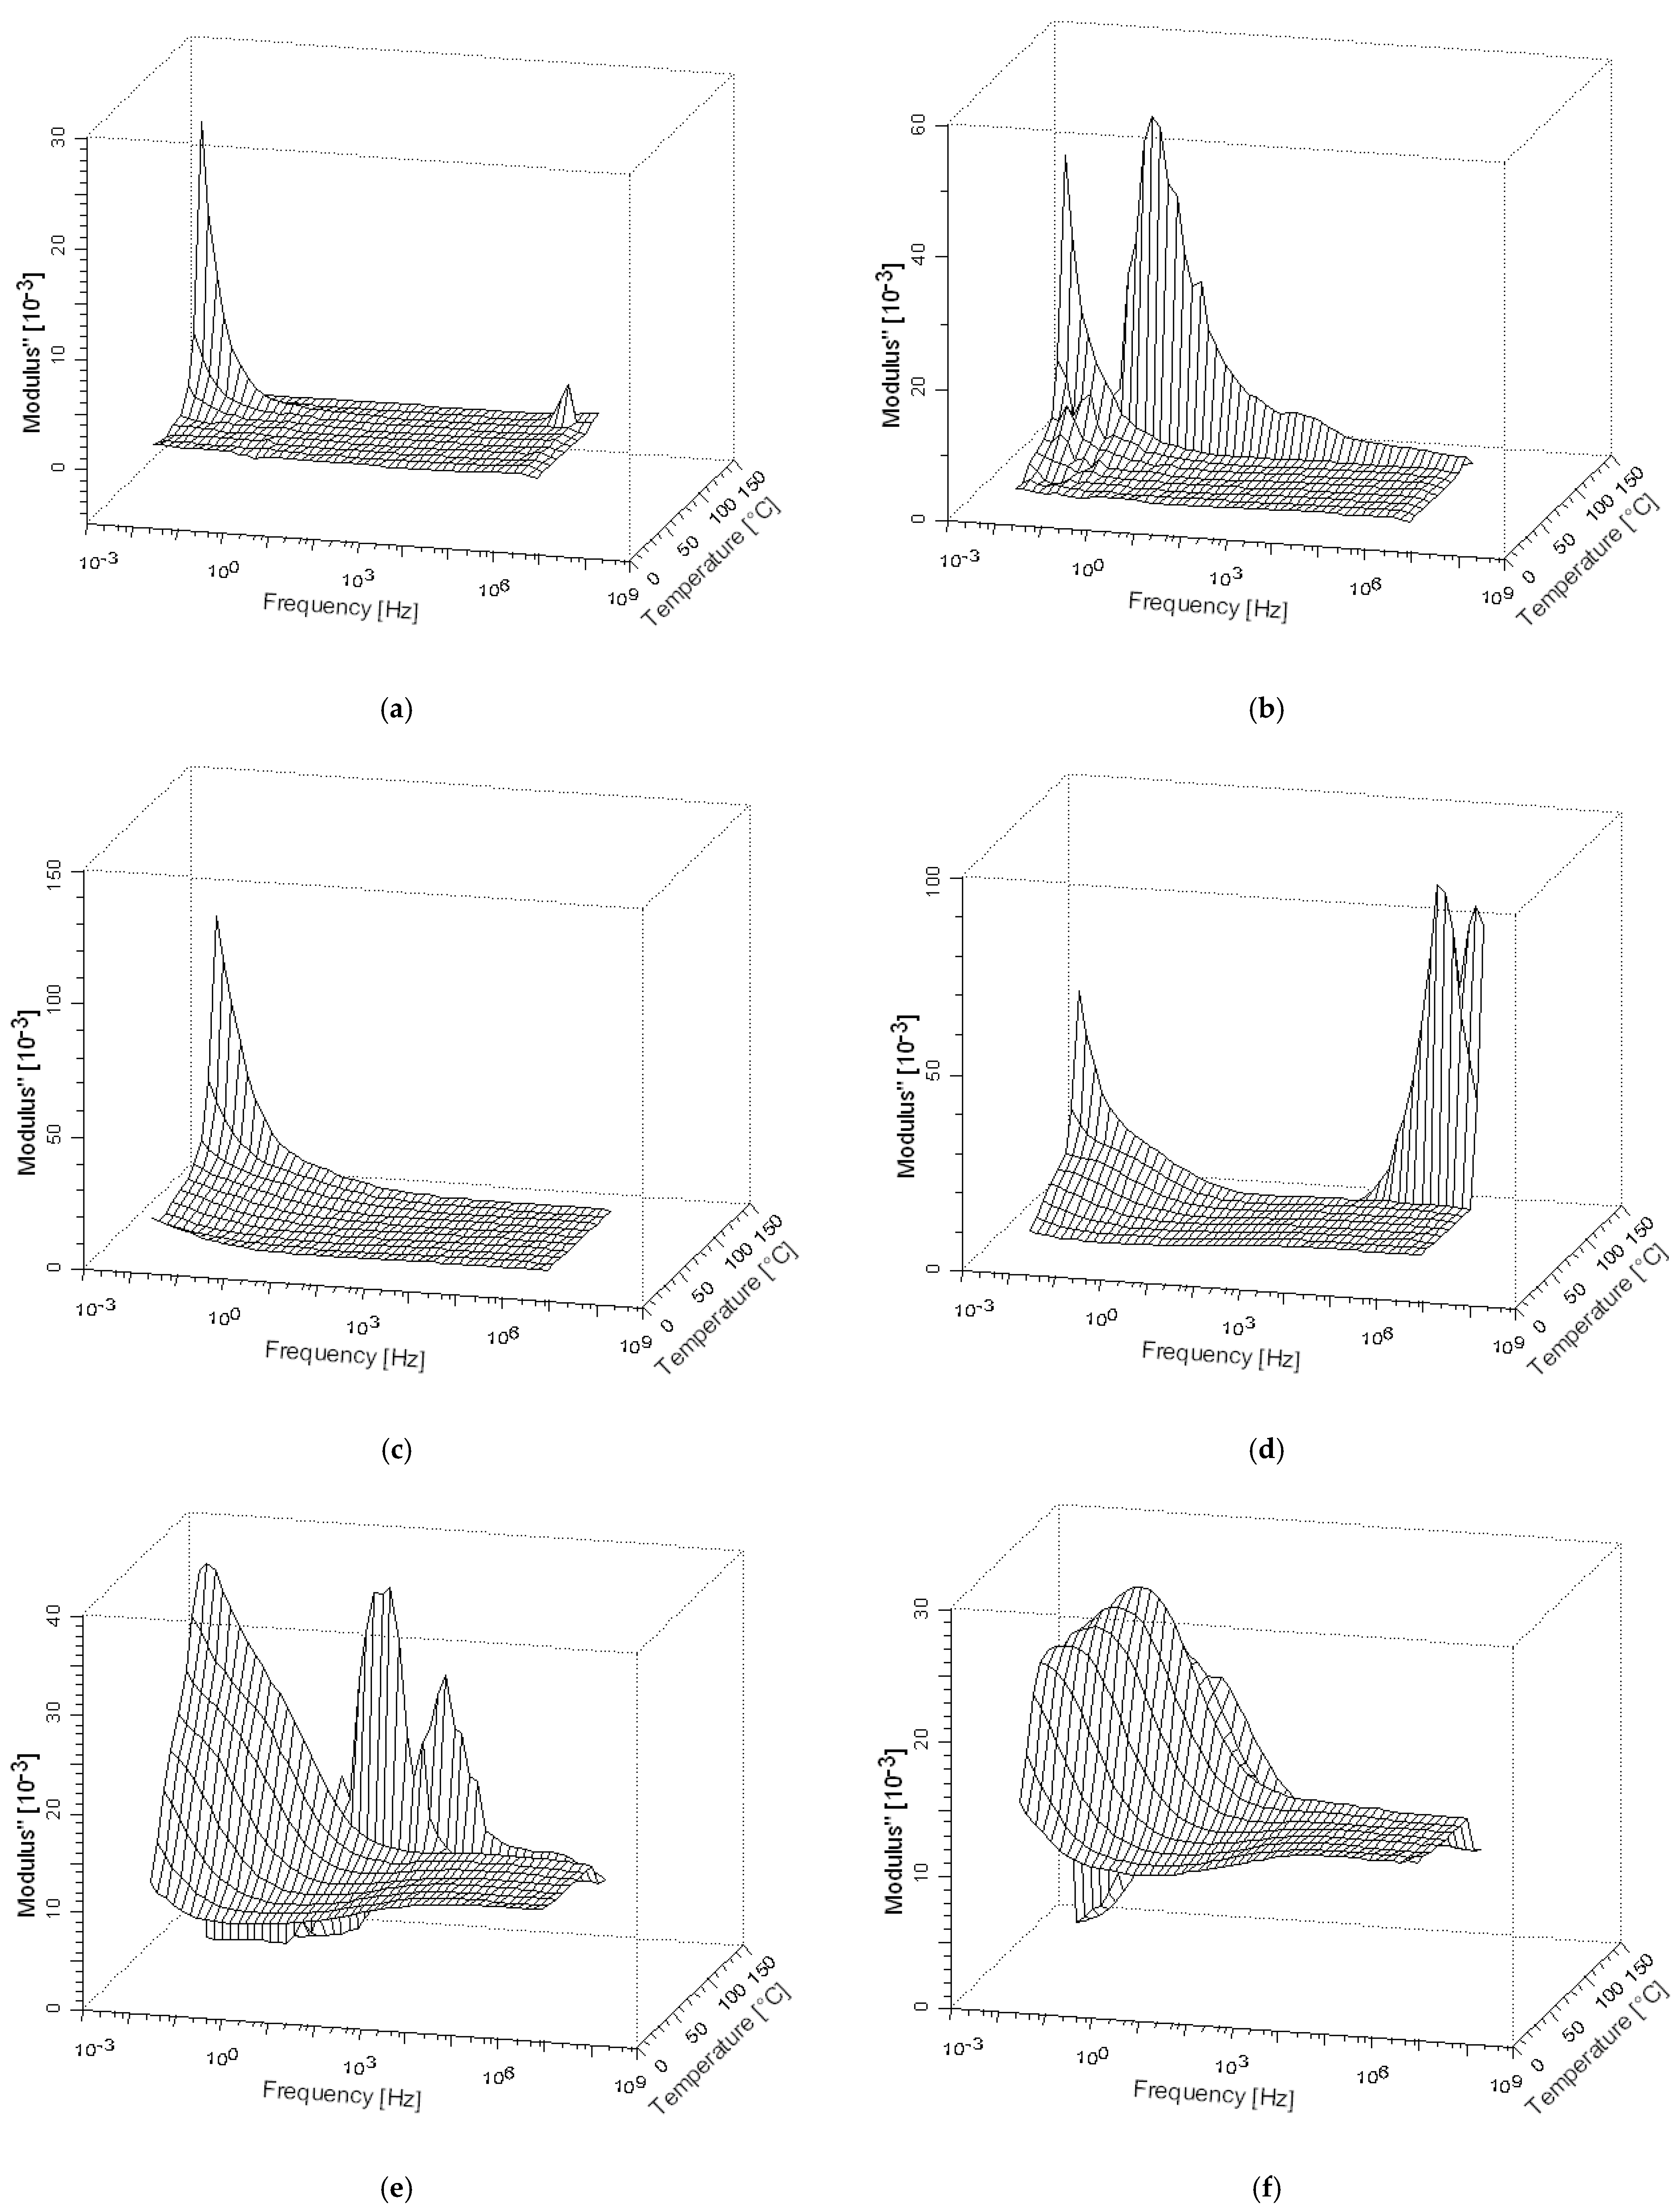
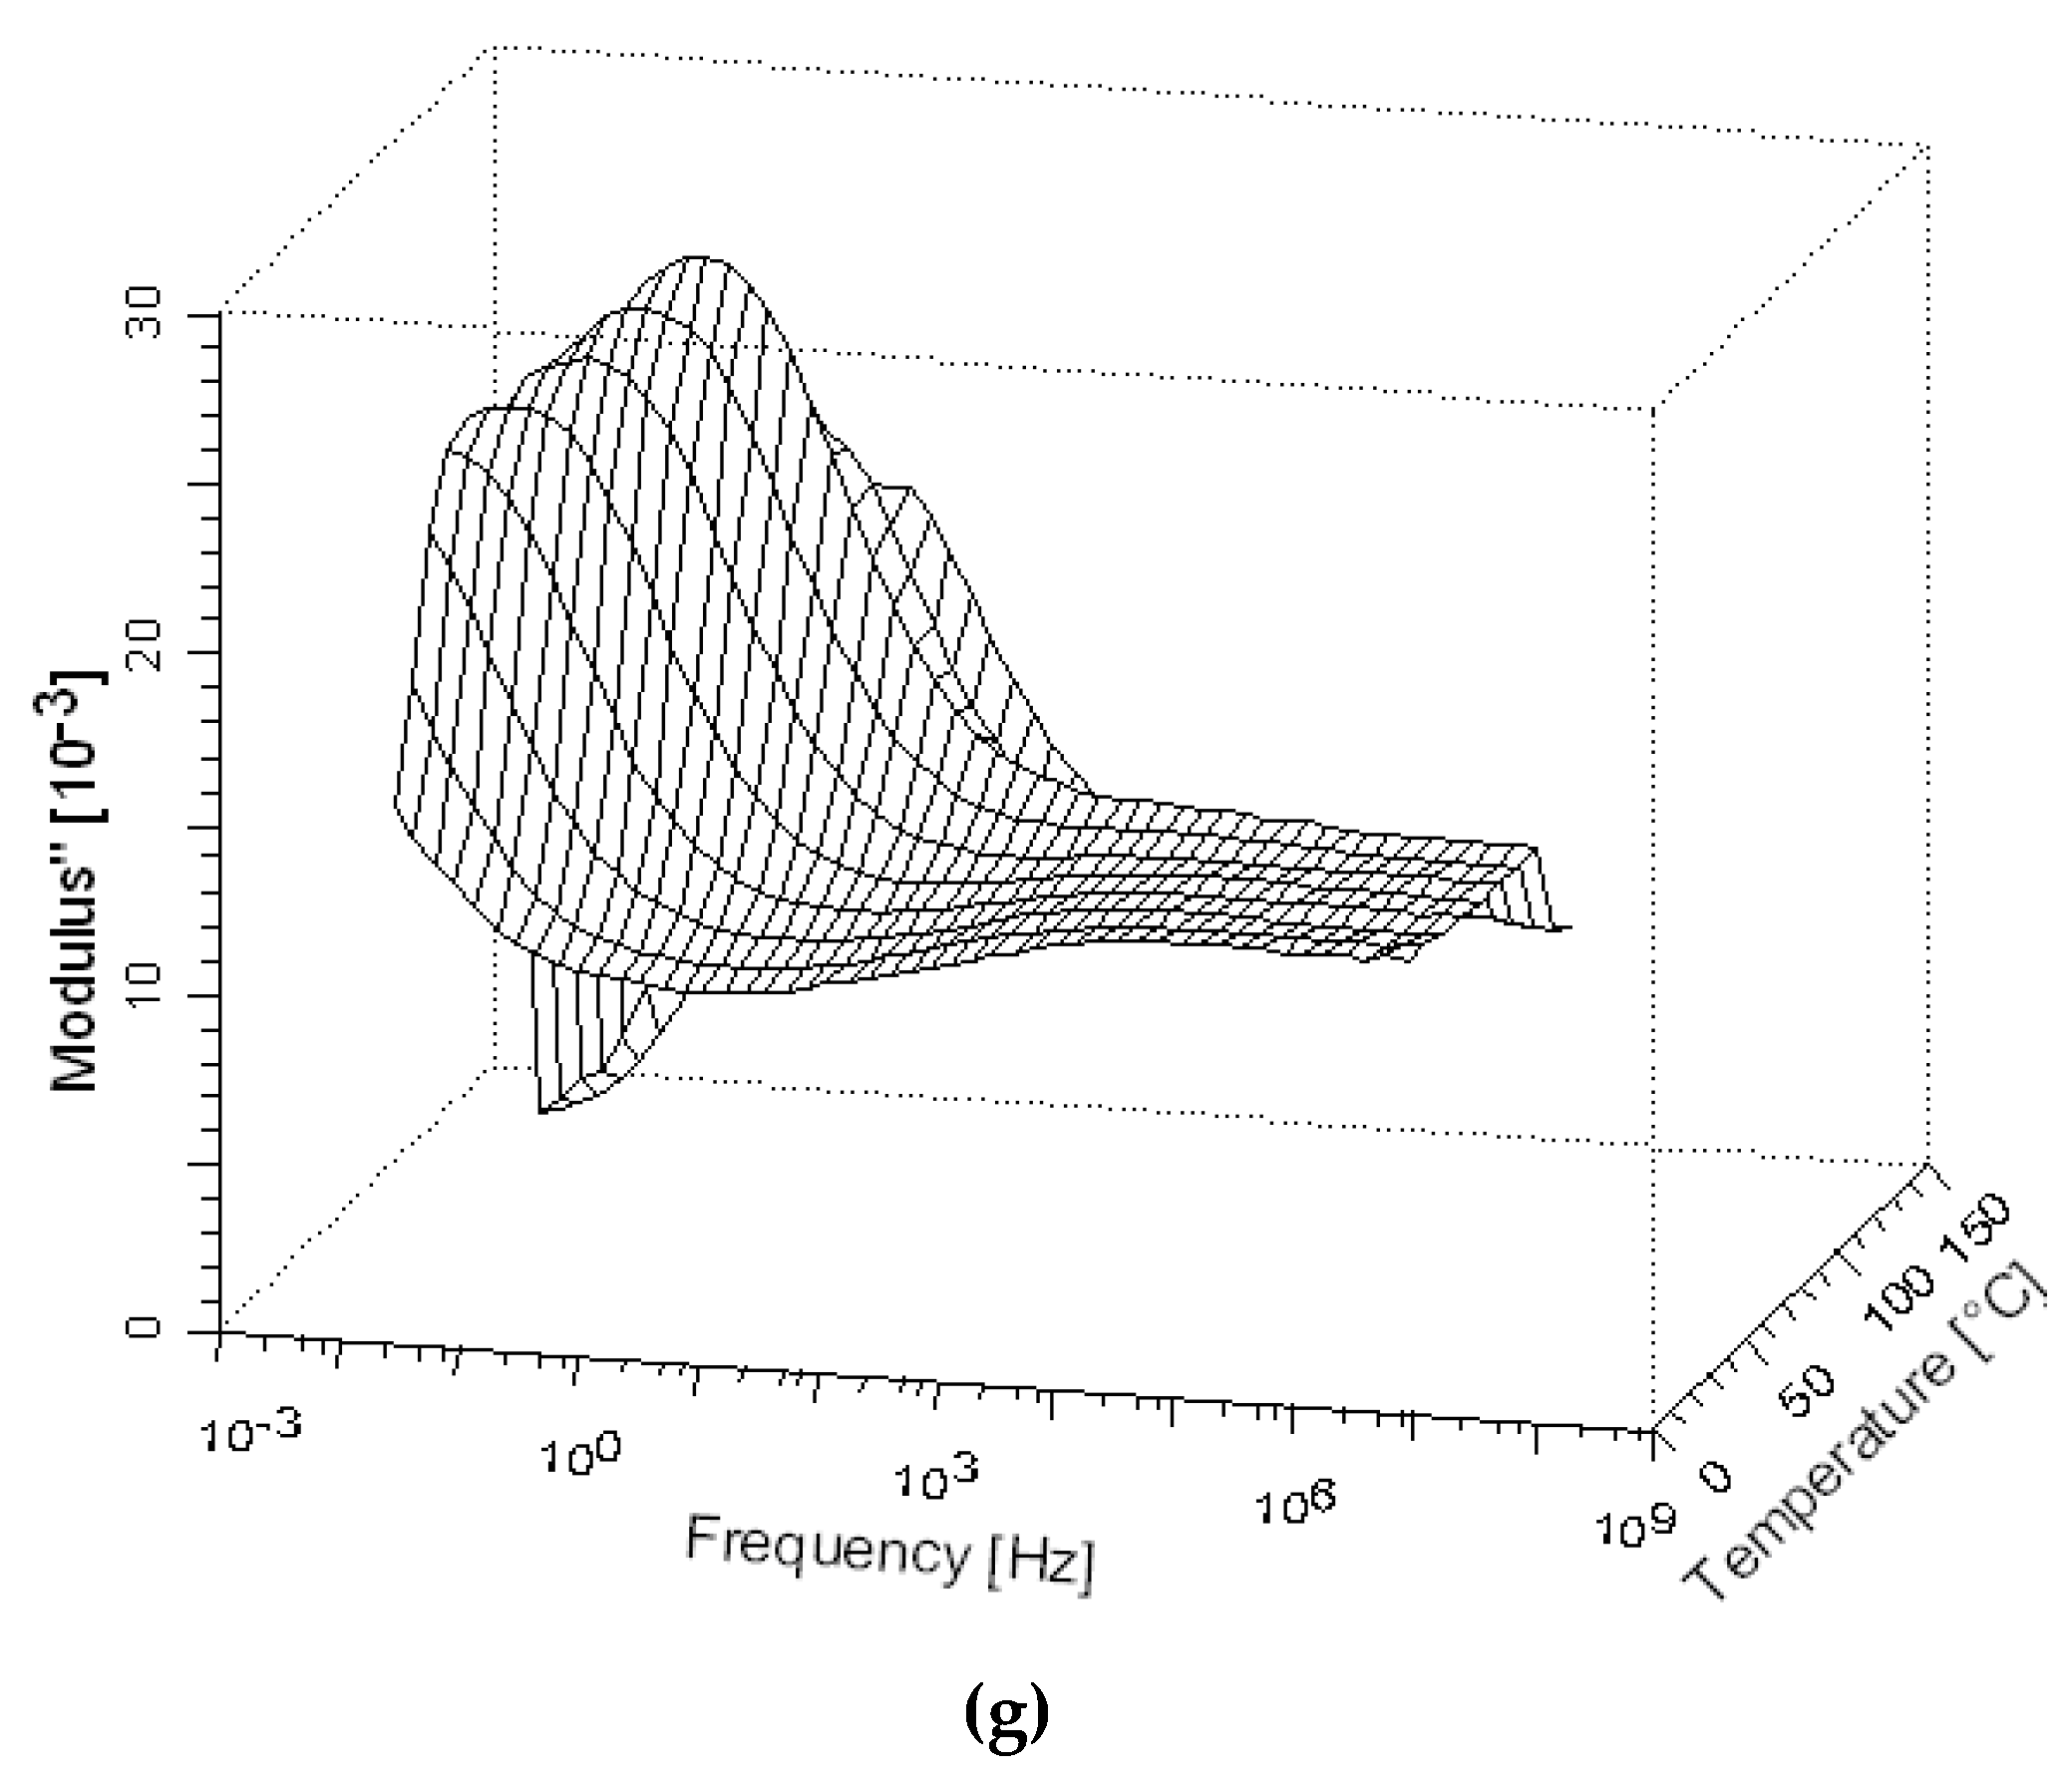
3.4. Dielectric Modulus (M″)
3.5. LLDPE/GTR Activation Energies (Ea)
3.6. LLDPE/GTR Argand Diagram
3.7. Industrial Applications Analysis
4. Conclusions
Author Contributions
Funding
Acknowledgments
Conflicts of Interest
References
- Myhre, M.; Saiwari, S.; Dierkes, W.; Noordermeer, J. Rubber Recycling: Chemistry, Processing, and Applications. Rubber Chem. Technol. 2012, 85, 408–449. [Google Scholar] [CrossRef]
- Fukumori, K.; Matsushita, M.; Okamoto, H.; Sato, N.; Suzuki, Y.; Takeuchi, K. Recycling technology of tire rubber. JSAE Rev. 2002, 23, 259–264. [Google Scholar] [CrossRef]
- Karger-Kocsis, J.; Mészáros, L.; Bárány, T. Ground tyre rubber (GTR) in thermoplastics, thermosets, and rubbers. J. Mater. Sci. 2013, 48, 1–38. [Google Scholar] [CrossRef]
- Ikeda, Y.; Kato, A.; Kohjiya, S.; Nakajima, Y. Rubber Science; Springer: Berlin/Heidelberg, Germany, 2018. [Google Scholar]
- Logakis, E.; Pandis, C.; Pissis, P.; Pionteck, J.; Pötschke, P. Highly conducting poly (methyl methacrylate)/carbon nanotubes composites: Investigation on their thermal, dynamic-mechanical, electrical and dielectric properties. Compos. Sci. Technol. 2011, 71, 854–862. [Google Scholar] [CrossRef]
- Liu, X.H.; Krückel, J.; Zheng, G.Q.; Schubert, D.W. Electrical conductivity behaviour of sheared poly(methyl methacrylate)/carbon black composites. Compos. Sci. Technol. 2014, 100, 99–104. [Google Scholar] [CrossRef]
- Zhao, J.; Dai, K.; Liu, C.; Zheng, G.; Wang, B.; Liu, C.; Chen, J.; Shen, C. A comparison between strain sensing behaviors of carbon black/polypropylene and carbon nanotubes/polypropylene electrically conductive composites. Compos. A Appl. Sci. Manuf. 2013, 48, 129–136. [Google Scholar] [CrossRef]
- Zhang, X.; Lu, C.; Liang, M. Preparation of thermoplastic vulcanizates based on waste crosslinked polyethylene and ground tire rubber through dynamic vulcanization. J. Appl. Polym. Sci. 2011, 122, 2110–2120. [Google Scholar] [CrossRef]
- Rodgers, B.; Waddell, W. Tire engineering. Sci. Tech. Rubber 2005. [Google Scholar] [CrossRef]
- Nuzaimah, M.; Sapuan, S.M.; Nadlene, R.; Jawaid, M. Recycling of waste rubber as fillers: A review. 2018 IOP Conf. Ser. Mater. Sci. Eng. 2017. [Google Scholar] [CrossRef]
- Sunthonpagasit, N.; Duey, M.R. Scrap tires to crumb rubber: Feasibility analysis for processing facilities. Resour. Conserv. Recycl. 2004, 40, 281–299. [Google Scholar] [CrossRef]
- Ramarad, S.; Khalid, M.; Ratnam, C.; Chuah, A.L.; Rashmi, W. Waste tire rubber in polymer blends: A review on the evolution, properties and future. Prog. Mater. Sci. 2015, 72, 100–140. [Google Scholar] [CrossRef]
- Fazli, A.; Rodrigue, D. Waste Rubber Recycling: A Review on the Evolution and Properties of Thermoplastic Elastomers. Materials 2020, 13, 782. [Google Scholar] [CrossRef] [PubMed]
- Aizawa, H.; Yoshida, H.; Sakai, S.I. Current results and future perspectives for Japanese recycling of home electrical appliances. Resour. Conserv. Recycl. 2008, 52, 1399–1410. [Google Scholar] [CrossRef]
- Rudolph, N.; Kiesel, R.; Aumnate, C. Understanding Plastics Recycling: Economic, Ecological, and Technical Aspects of Plastic Waste Handling; Carl Hanser Verlag GmbH Co. KG: Munich, Germany, 2017. [Google Scholar]
- Grigore, M.E. Methods of Recycling, Properties and Applications of Recycled Thermoplastic Polymers. Recycling 2017, 2, 24. [Google Scholar] [CrossRef]
- Gohatre, O.K.; Jaidev, K.; Suresh, S.S.; Biswal, M.; Mohanty, S.; Nayak, S.K. Composition and Recyclability Analysis of Poly(Vinyl Chloride) Recovered from Computer Power Cables and Commercial Wires. J. Vinyl Addit. Technol. 2019. [Google Scholar] [CrossRef]
- Radeshkumar, C.; Karger-Kocsis, J. Thermoplastic dynamic vulcanisates containing LDPE, rubber, and thermochemically reclaimed ground tyre rubber. Plast. Rubber Compos. 2002, 31, 99–105. [Google Scholar] [CrossRef]
- Liu, H.S.; Richard, C.P.; Mead, J.L.; Stacer, R.G. Development of Novel Applications for Using Recycled Rubber in Thermoplastics; Technical Research Program; Chelsea Center for Recycling and Economic Development, University of Massachusetts: Lowell, UK, 2000. [Google Scholar]
- Orrit-Prat, J.; Mujal-Rosas, R.; Rahhali, A.; Marin-Genesca, M.; Colom-Fajula, X.; Belana-Punseti, J. Dielectric and mechanical characterization of PVC composites with ground tire rubber. J. Compos. Mater. 2011, 45, 1233–1243. [Google Scholar] [CrossRef]
- Colom, X.; Carrillo, F.; Cañavate, J. Composites reinforced with reused tyres: Surface oxidant treatment to improve the interfacial compatibility. Compos. Part A Appl. Sci. Manuf. 2007, 38, 44–50. [Google Scholar] [CrossRef]
- Mujal, R.; Orrit-Prat, J.; Ramis-Juan, X.; Marin-Genesca, M. Electrical application of polyamide reinforced with old tire rubber (ground tire rubber): Dielectric, thermal, mechanical and structural properties. J. Compos. Mater. 2014, 27, 1209–1231. [Google Scholar] [CrossRef]
- Mujal-Rosas, R.; Marin-Genesca, M.; Orrit-Prat, J.; Rahhali, A.; Colom-Fajula, X. Dielectric, mechanical, and thermal characterization of high-density polyethylene composites with ground tire rubber. J. Thermoplast. Compos. Mater. 2012, 25, 537–559. [Google Scholar] [CrossRef]
- Yehia, A.; Mull, M.A.; Ismail, M.N.; Hefny, Y.A.; Abdel-Bary, E.M. Effect of chemically modified waste rubber powder as a filler in natural rubber vulcanizates. J. Appl. Polym. Sci. 2004, 93, 30–36. [Google Scholar] [CrossRef]
- Colom, X.; Marín-Genescà, M.; Mujal, R.; Formela, K.; Cañavate, J. Structural and physico-mechanical properties of natural rubber/GTR composites devulcanized by microwaves: Influence of GTR source and irradiation time. J. Compos. Mater. 2018, 52, 3099–3108. [Google Scholar] [CrossRef]
- Mujal, R.; Orrit, J.; Ramis, X.; Marin, M.; Rahhali, A. Dielectric, thermal, and mechanical properties of acrylonitrile butadiene styrene reinforced with used tires. Adv. Polym. Technol. 2013, 32, E399–E415. [Google Scholar] [CrossRef]
- Mujal-Rosas, R.; Ramis, X.; Marín-Genescà, M.; Rahhali, A.; Orrit-Prat, J. Study on dielectric, mechanical and thermal properties of polypropylene (PP) composites with ground tyre rubber (GTR). Polym. Polym. Compos. 2012, 20, 755–756. [Google Scholar]
- Giri, R.; Naskar, K.; Nando, G.B. Effect of electron beam irradiation on dynamic mechanical, thermal and morphological properties of LLDPE and PDMS rubber blends, Radiat. Phys. Chem. 2012, 81, 1930. [Google Scholar]
- Jalali-Arani, A.; Katbab, A.A.; Nazockdast, H. Thermomechanical reactive blending of silicone rubber and LLDPE: Effects of processing parameters. J. Appl. Polym. Sci. 2005, 96, 155–161. [Google Scholar] [CrossRef]
- Rigotti, D.; Dorigato, A.; Pegoretti, A. Thermo-Mechanical Behavior and Hydrolytic Degradation of Linear Low-Density Polyethylene/Poly(3-hydroxybutyrate) Blends. Front. Mater. 2020, 7, 31. [Google Scholar] [CrossRef]
- Osman, M.A.; Rupp, J.E.P.; Suter, U.W. Tensile properties of polyethylene-layered silicate nanocomposites. Polymer 2005, 46, 1653–1660. [Google Scholar] [CrossRef]
- Ismail, H.; Awang, M.; Hazizan, M. Effect of waste tire dust (WTD) size on the mechanical and morphological properties of polypropylene/waste tire dust (PP/WTD) blends. Polym. Plast. Technol. Eng. 2006, 45, 463–468. [Google Scholar] [CrossRef]
- Markov, A.; Fiedler, B.; Schulte, K. Electrical conductivity of carbon black/fibres filled glass-fibre-reinforced thermoplastic composites. Compos. Part A Appl. Sci. Manuf. 2006, 37, 1390–1395. [Google Scholar] [CrossRef]
- Tsangaris, G.M.; Psarras, G.C. The dielectric response of a polymeric three-component composite. J. Mater. Sci. 1999, 34, 2151. [Google Scholar] [CrossRef]
- El Hasnaoui, M.; Graça, M.P.F.; Achour, M.; Costa, L. Electric Modulus Analysis of Carbon Black/Copolymer Composite Materials. Mater. Sci. Appl. 2011, 2, 1421. [Google Scholar] [CrossRef]
- Boukheir, S.; Samir, Z.; Belhimria, R.; Kreit, L.; Achour, M.E.; Éber, N.; Costa, L.C.; Oueriagli, A.; Outzourhit, A. Electric Modulus Spectroscopic Studies of the Dielectric Properties of Carbon Nanotubes/Epoxy Polymer Composite Materials. J. Macromol. Sci. Part B Phys. 2018, 57, 210–221. [Google Scholar] [CrossRef]
- Belattar, J.; Graça, M.P.F.; Costa, L.C.; Achour, M.E.; Brosseau, C. Electric modulus-based analysis of the dielectric relaxation in carbon black loaded polymer composites. J. Appl. Phys. 2010, 107, 124111. [Google Scholar] [CrossRef]
- Ravi, M.; Pavani, Y.; Kiran, K.; Bhavani, S.; Sharma, A.; Rao, V. Studies on electrical and dielectric properties of PVP:KBrO4 complexed polymer electrolyte film. Mater. Chem. Phys. 2011. [Google Scholar] [CrossRef]
- Scarpa, P.C.N.; Das-Gupta, D.K. Dielectric spectroscopy of polyethylene with and without carbon black. In Proceedings of the Conference Record of the 1998 IEEE International Symposium on Electrical Insulation, Arlington, VA, USA, 7–10 June 1998; pp. 149–152. [Google Scholar]
- Ramos, R.J.; Bianchi, R.F.; Faria, R.M. AC electrical conductivity in polyethylene/carbon black composites. In Proceedings of the 10th International Symposium on Electrets, Athens, Greece, 22–24 September 1999; pp. 525–528. [Google Scholar]
- Hilker, B.; Fields, K.B.; Stern, A.; Space, B.; Zhang, P.; Harmon, J.P. Dielectric analysis of poly(methyl methacrylate) zinc(II) mono-pinacolborane diphenylporphyrin composites. Polymer 2010, 51, 4790–4805. [Google Scholar] [CrossRef]
- Ravikumar, K.; Palanivelu, K.; Ravichandran, K. Dielectric Properties of Natural Rubber Composites filled with Graphite. Mater. Today Proc. 2019, 16, 1338–1343. [Google Scholar] [CrossRef]
- İnal, M. Determination of dielectric properties of insulator materials by means of ANFIS: A comparative study. J. Mater. Process. Technol. 2008, 195, 34–43. [Google Scholar] [CrossRef]
- JadahFarhan, A.; Jerjak, N. Preparation and Study of Some Physical Properties for Polyester Reinforcement by (Al) Powder Composites. Int. J. Appl. Innov. Eng. Manag. 2014, 3, 2319–4847. [Google Scholar]
- Dou, Y.; Rodrigue, D. Rotomolding of foamed and unfoamed GTR-LLDPE blends: Mechanical, morphological and physical properties. Cell. Polym. 2018, 37, 55–68. [Google Scholar] [CrossRef]
- Yuan, Q.; Bateman, S.A.; Wu, D. Mechanical and Conductive Properties of Carbon Black-filled High-density Polyethylene, Low-density Polyethylene, and Linear Low-density Polyethylene. J. Compos. Mater. 2010, 23, 459–471. [Google Scholar] [CrossRef]
- Mujal-Rosas, R.; Marín-Genescà, M.; García-Amorós, J.; Salueña-Berna, X.; Colom-Fajula, X. Influence on the mechanical properties of various polymeric composites reinforced with GTR particles. Afinidad 2019, 76, 588. Available online: https://www.raco.cat/index.php/afinidad/article/view/361813 (accessed on 14 January 2020).
- Deng, H.; Lin, L.; Ji, M.; Zhang, S.; Yang, M.; Fu, Q. Progress on the morphological control of conductive network in conductive polymer composites and the use as electroactive multifunctional materials. Prog. Polym. Sci. 2014, 39, 627–655. [Google Scholar] [CrossRef]
- Pan, Y.; Liu, X.; Hao, X.; Starý, Z.; Schubert, D.W. Enhancing the electrical conductivity of carbon black-filled immiscible polymer blends by tuning the morphology. Eur. Pol. J. 2016, 78, 106–115. [Google Scholar] [CrossRef]
- Billings, M.J.; Smith, A.; Wilkins, R. Tracking in Polymeric Insulation. IEEE Trans. Electr. Insul. 1967, EI-2, 131–137. [Google Scholar] [CrossRef]
- Li, S.; Yu, S.; Feng, Y. Progress in and prospects for electrical insulating materials. High Volt. 2016, 1, 122–129. [Google Scholar] [CrossRef]
- Teyssedre, G.; Laurent, C. Charge Transport Modeling in Insulating Polymers: From Molecular to Macroscopic Scale. IEEE Trans. Dielectr. Electr. Insul. 2005, 12. [Google Scholar] [CrossRef]
- Crone, B.K.; Campbell, I.H.; Davids, P.S.; Smith, D.L. Device model for single carrier organic diodes. J. Appl. Phys. 1997, 82, 6319–6325. [Google Scholar] [CrossRef]
- Naskar, A.K.; Khastgir, D.; Bhowmick, A.K.; De, S.K. Effect of Chlorination of Ground Rubber Tire on its Compatibility with Poly(vinyl chloride): Dielectric Studies. J. Appl. Polym. Sci. 2002, 84, 993–1000. [Google Scholar] [CrossRef]
- Saad, A.L.G.; Aziz, H.A.; Dimitry, O.I.H. Studies of Electrical and Mechanical Properties of Poly(vinyl chloride) Mixed with Electrically Conductive Additives. J. Appl. Polym. Sci. 2004, 91, 1590–1598. [Google Scholar] [CrossRef]
- O’Neill, R.; Bowman, M.; Gregg, J.M. Dielectric enhancement and Maxwell–Wagner effects in ferroelectric superlattice structures. Appl. Phys. Lett. 2000, 77, 1520. [Google Scholar] [CrossRef]
- Petrović, M.M.V.; Bobić, J.D.; Ramoška, T.; Banys, J.; Stojanović, B.D. Antimony doping effect on barium titanate structure and electrical properties. Ceram. Int. 2011, 37, 2669–2677. [Google Scholar] [CrossRef]
- McCrum, N.G.; Read, B.E.; Williams, G. Anelastic and Dielectric Effects in Polymeric Solids; Dover Publications, INC.: New York, NY, USA, 1991. [Google Scholar]
- Kalogeras, I.M.; Pallikari-Viras, F.; Vassilikou-Dova, A. Dielectric and thermal characterization of electroactive sol gel/polymer composites. In Proceedings of the 9th International Symposium on Electrets (ISE 9) Proceedings, Shanghai, China, 27 September 1996. [Google Scholar]
- Wu, K.; Cheng, C. Interface charges between insulating materials. IEEE Trans. Dielectr. Electr. Insul. 2017, 24, 2633–2642. [Google Scholar] [CrossRef]
- Tsangaris, G.M.; Koulombi, N.; Kyvelidis, S. Interfacial Relaxation Phenomena in Particulate Composites of Epoxy Resin with Copper or Iron Particles. Mater. Chem. Phys. 1996, 44, 245–250. [Google Scholar] [CrossRef]
- Ohki, Y. Dielectric relaxation phenomena of several insulating polymers analyzed by electric modulus spectra. In Proceedings of the 2015 IEEE 11th International Conference on the Properties and Applications of Dielectric Materials (ICPADM), Sydney, Australia, 19–22 July 2015. [Google Scholar] [CrossRef]
- Anil Arya, P.; Sharma, A.L. Dielectric relaxations and transport properties parameter analysis of novel blended solid polymer electrolyte for sodium-ion rechargeable batteries. J. Mater. Sci. 2019, 54, 7131–7155. [Google Scholar]
- Tian, F.; Ohki, Y. Electric modulus powerful tool for analyzing dielectric behavior. IEEE Trans. Dielectr. Electr. Insul. 2014, 21, 929–931. [Google Scholar] [CrossRef]
- Prodromakis, T.; Papavassiliou, C. Engineering the Maxwell–Wagner polarization effect. Appl. Surf. Sci. 2009, 255, 6989–6994. [Google Scholar] [CrossRef]
- Petrović, M.M.V.; Grigalaitis, R.; Ilic, N.; Bobić, J.D.; Dzunuzovic, A.; Banys, J.; Stojanović, B.D. Interdependence between structure and electrical characteristics in Sm-doped barium titanate. J. Alloy. Compd. 2017, 724, 959–968. [Google Scholar] [CrossRef]
- Tsangaris, G.M.; Psarras, G.C.; Koulombi, N. Electric modulus and interfacial polarization in composite polymeric systems. J. Mater. Sci. 1998, 33, 2027–2037. [Google Scholar] [CrossRef]
- Patra, A.; Prasad, V. Effect of LaNiO3 on the impedance and dielectric properties of CoFe2O4: A high temperature study. J. Phys. D Appl. Phys. 2020, 53, 045301. [Google Scholar] [CrossRef]
- Aziz, S.B.; Woo, T.J.; Kadir, M.F.Z.; Ahmed, H.M. A conceptual review on polymer electrolytes and ion transport models. J. Sci. Adv. Mater. Devices 2018, 3, 1–17. [Google Scholar] [CrossRef]
- Coelho, R. On the relaxation of a space-charge. Rev. Phys. Appl. 1983, 18, 137–146. [Google Scholar] [CrossRef]
- Kondo, K.; Chiba, T.; Ando, S.; Yoshida, S.; Shimada, Y.; Nakamura, T.; Matsushita, N. Cole-Cole impedance analysis on spin sprayed Ni-Zn-Co ferrite films exhibiting strong magnetic loss in gigahertz range. IEEE Trans. Magn. 2003, 39, 3130–3132. [Google Scholar] [CrossRef]
- Ahmed, H.T.; Abdullah, O.G. Impedance and ionic transport properties of proton-conducting electrolytesbased on polyethylene oxide/methylcellulose blend polymers. J. Sci. Adv. Mater. Devices 2020. [Google Scholar] [CrossRef]
- Chawla, M.; Gupta, D.; Shekhawat, N.; Aggarwal, S. Argand plot and conduction mechanism study of N+ implanted CR-39 polymer. AIP Conf. Proc. 2019, 2093. [Google Scholar] [CrossRef]
- Tiwari, S.K.; Choudhary, R.N.P.; Mahapatra, S.P. Dynamic mechanical and dielectric relaxation studies of chlorobutyl elastomer nanocomposites: Effect of nanographite loading and temperature. High Perform. Polym. 2015, 27, 274–287. [Google Scholar] [CrossRef]
- Marín-Genescà, M.; García-Amorós, J.; Mujal-Rosas, R.; Salueña Berna, X.; Massagués Vidal, L. Comparison of Mechanical and Electrical Characteristics of Various Polymers Blended with Ground Tire Rubber (GTR) and Applications. Appl. Sci. 2019, 9, 1564. [Google Scholar] [CrossRef]
- Mujal, R.; Ramis, X. Electrical application of polystyrene (PS) reinforced with old tire rubber (GTR): Dielectric, thermal, and mechanical properties. Sci. Eng. Compos. Mater. 2013, 20, 233–244. [Google Scholar] [CrossRef]
- Mujal-Rosas, R.; Marín-Genescà, M.; Ballart-Prunell, M. Dielectric properties of vaius polymers (PVC, EVA, HDPE, and PP) reinforced with ground tire rubber (GTR). Sci. Eng. Compos. Mater. 2015, 22, 231–243. [Google Scholar] [CrossRef]
- Mujal, R.; Orrit-Prat, J.; Ramis-Juan, X.; Marin-Genesca, M.; Rahhali, A. Study on dielectric, thermal, and mechanical properties of the ethylene vinyl acetate reinforced with ground tire rubber. J. Reinf. Plast. Compos. 2011, 30, 581–592. [Google Scholar] [CrossRef]


| Properties | Unities | Values |
|---|---|---|
| Flow index | g/10 min | 1.0 |
| Density | g/cm3 | 0.924 |
| Melting temperature | °C | 126 |
| Tensile strength | Psi | 8.000 |
| Elongation at break | % | 720 |
| Processing Temperature | °C | 124 °C |
| Pressing Temperature | °C | 130 °C |
| Ea (eV) | GTR (%) | |
|---|---|---|
| 0.2585 | 0.0001 × 10⁻¹⁰ | 0% |
| 0.1157 | 0.0005 × 10⁻¹⁰ | 5% |
| 0.0553 | 0.0009 × 10⁻¹⁰ | 10% |
| 0.0982 | 0.0038 × 10⁻¹⁰ | 20% |
| 0.1130 | 0.0238 × 10⁻¹⁰ | 40% |
| 0.1220 | 0.0590 × 10⁻¹⁰ | 50% |
| 0.0959 | 0.2200 × 10⁻¹⁰ | 70% |
| Composite | Conductivity (S/cm) | Loss Factor (ԑ″) | Loss Tangent (Tg δ) |
|---|---|---|---|
| LLDPE | 1.6739 × 10⁻¹⁴ | 7.0115 × 10⁻⁴ | 3.19 × 10⁻⁴ |
| LLDPE + 5% GTR | 1.4927 × 10⁻¹³ | 6.2523 × 10⁻³ | 1.49 × 10⁻³ |
| LLDPE + 10% GTR | 5.1646 × 10⁻¹³ | 2.1633 × 10⁻² | 7.67 × 10⁻³ |
| LLDPE + 20% GTR | 1.1145 × 10⁻¹² | 4.6681 × 10⁻² | 1.49 × 10⁻² |
| LLDPE + 40% GTR | 6.0551 × 10⁻¹² | 2.5363 × 10⁻¹ | 4.64 × 10⁻² |
| LLDPE + 50% GTR | 1.3597 × 10⁻¹¹ | 5.6954 × 10⁻¹ | 7.47 × 10⁻² |
| LLDPE + 70% GTR | 8.3718 × 10⁻¹¹ | 3.5067 × 100 | 2.04 × 10⁻¹ |
| Applications Analyzed | Electrical Criterion | Standard |
|---|---|---|
| 1. Universal electrical cable joint | Conductivity <10−12 S/cm | UNE-HD 628; IEC 60840 |
| 2. Filler for electrical applications | Conductivity <10−12 S/cm | UNE-HD 632; UNE-EN 60811-4-1; UNE-ISO 1853:2012 |
| 3. Cable management—Cable tray systems and cable ladder system. Pipes for electrical cables | Conductivity <10−12 S/cm | UNE-EN 61537:2007; UNE-EN 50085-1, IEC 61537:2006 |
© 2020 by the authors. Licensee MDPI, Basel, Switzerland. This article is an open access article distributed under the terms and conditions of the Creative Commons Attribution (CC BY) license (http://creativecommons.org/licenses/by/4.0/).
Share and Cite
Marín-Genescà, M.; García-Amorós, J.; Mujal-Rosas, R.; Massagués, L.; Colom, X. Study and Characterization of the Dielectric Behavior of Low Linear Density Polyethylene Composites Mixed with Ground Tire Rubber Particles. Polymers 2020, 12, 1075. https://doi.org/10.3390/polym12051075
Marín-Genescà M, García-Amorós J, Mujal-Rosas R, Massagués L, Colom X. Study and Characterization of the Dielectric Behavior of Low Linear Density Polyethylene Composites Mixed with Ground Tire Rubber Particles. Polymers. 2020; 12(5):1075. https://doi.org/10.3390/polym12051075
Chicago/Turabian StyleMarín-Genescà, Marc, Jordi García-Amorós, Ramon Mujal-Rosas, Lluís Massagués, and Xavier Colom. 2020. "Study and Characterization of the Dielectric Behavior of Low Linear Density Polyethylene Composites Mixed with Ground Tire Rubber Particles" Polymers 12, no. 5: 1075. https://doi.org/10.3390/polym12051075
APA StyleMarín-Genescà, M., García-Amorós, J., Mujal-Rosas, R., Massagués, L., & Colom, X. (2020). Study and Characterization of the Dielectric Behavior of Low Linear Density Polyethylene Composites Mixed with Ground Tire Rubber Particles. Polymers, 12(5), 1075. https://doi.org/10.3390/polym12051075