Physical and Mechanical Properties of Ammonia-Treated Black Locust Wood

 ,
, 
 ,
, 
Abstract
1. Introduction
2. Materials and Methods
2.1. Materials
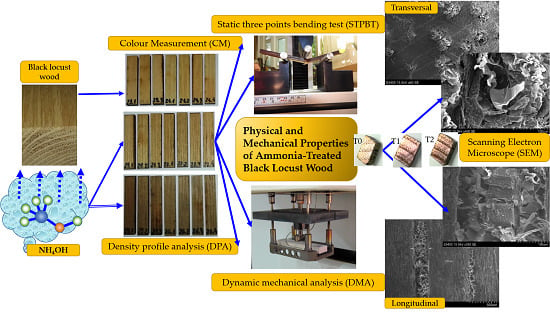
2.2. Methods
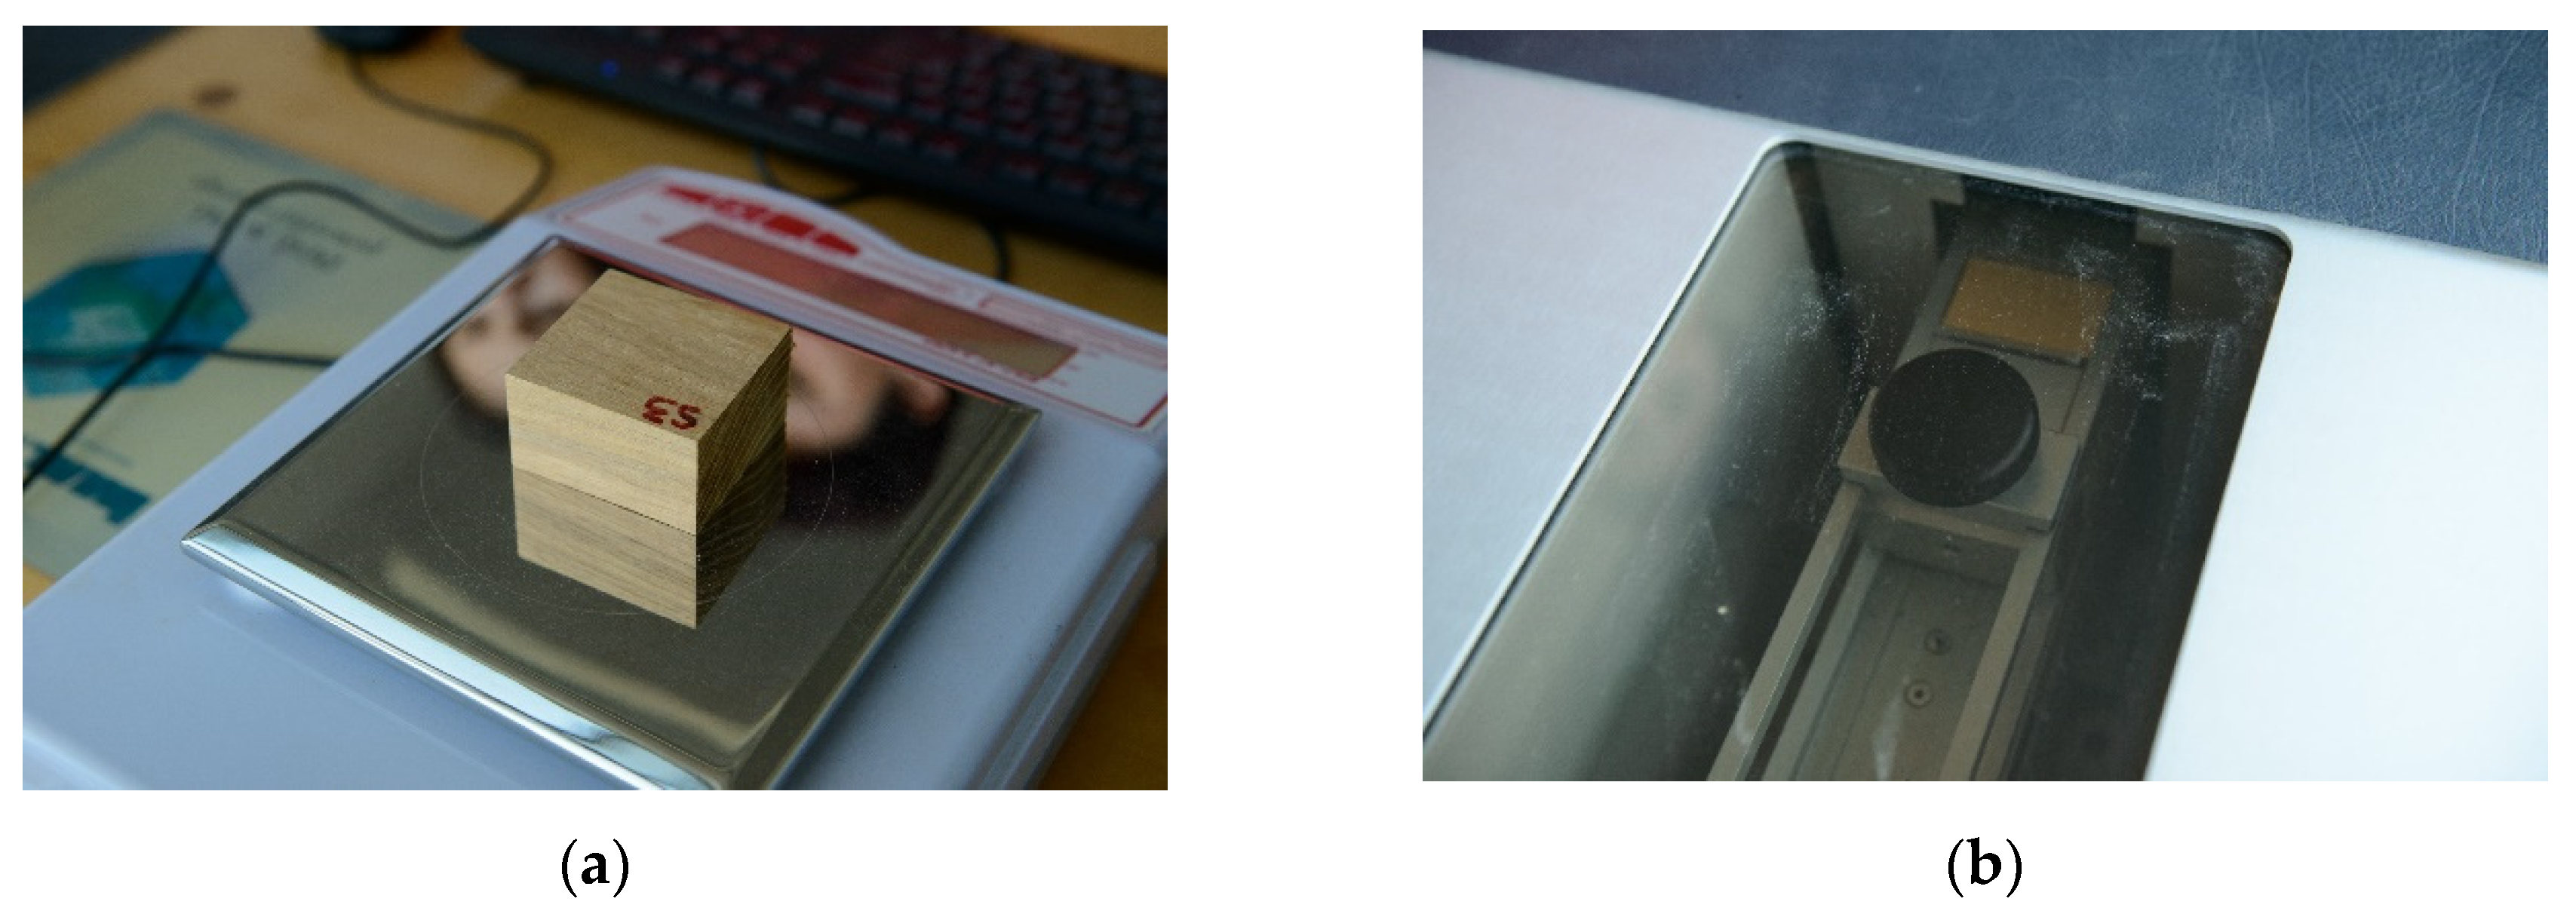
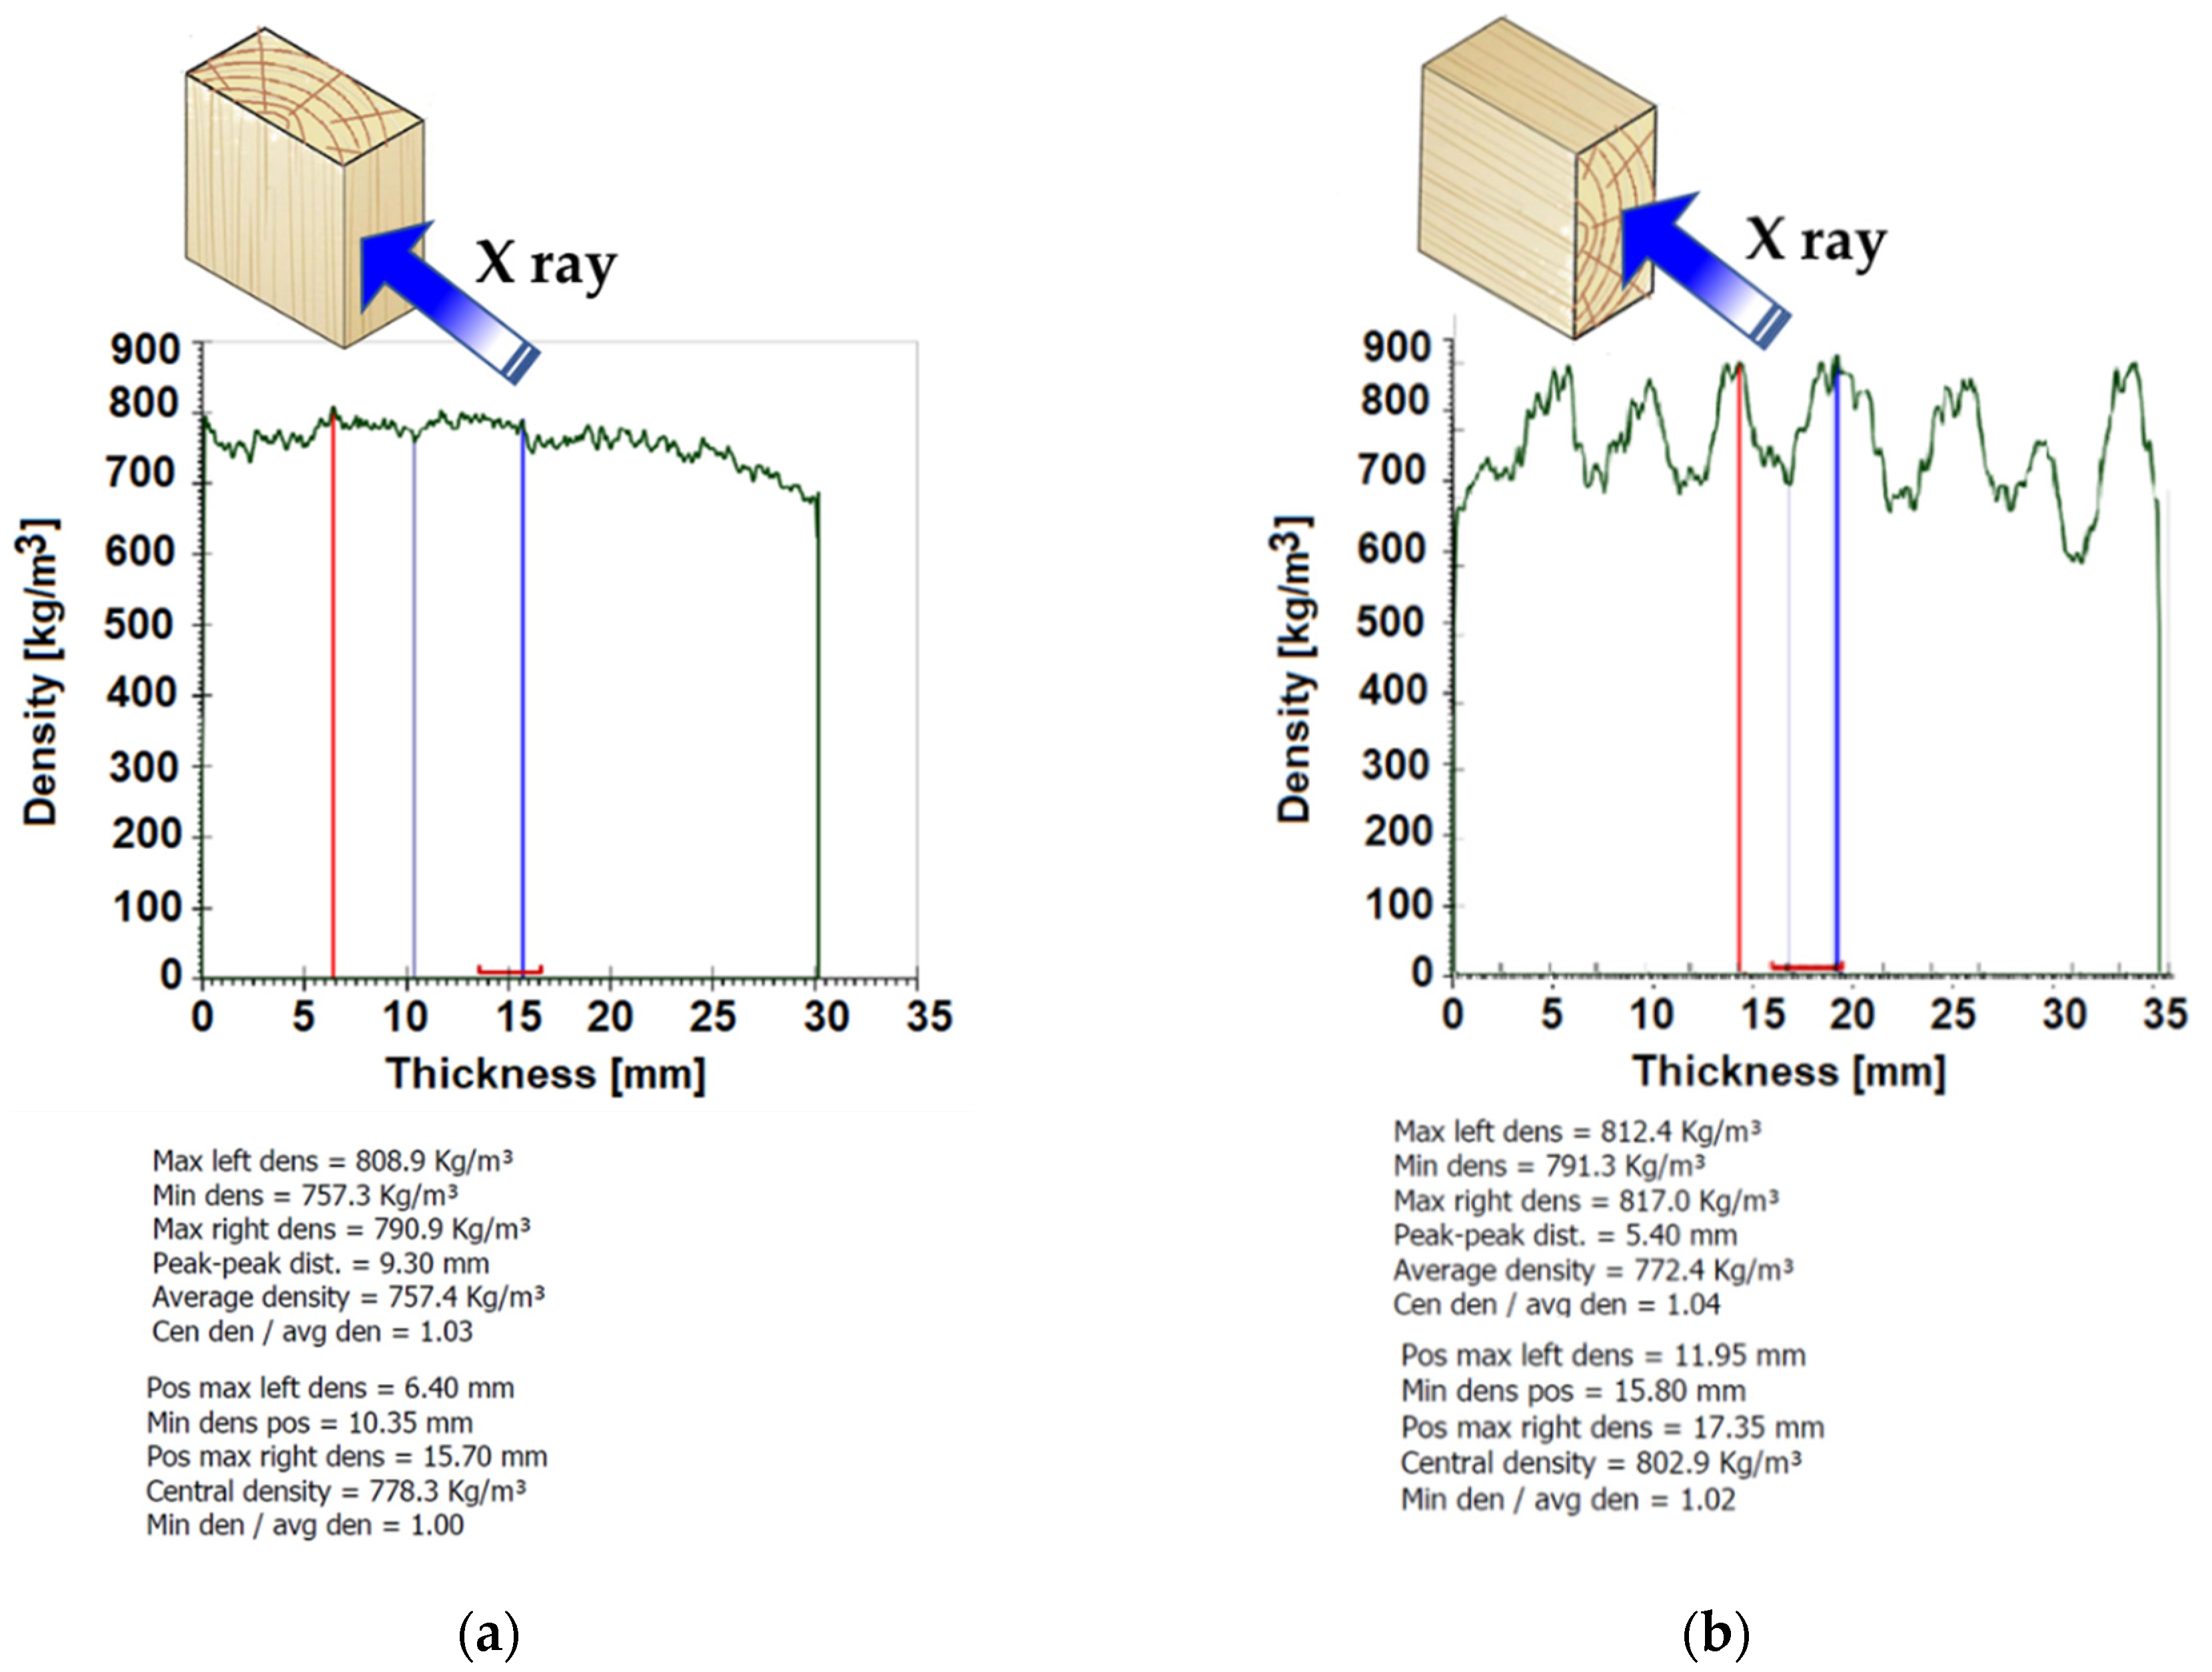
2.2.1. Density Profile Analysis (DPA)
2.2.2. Colour Measurement (CM)
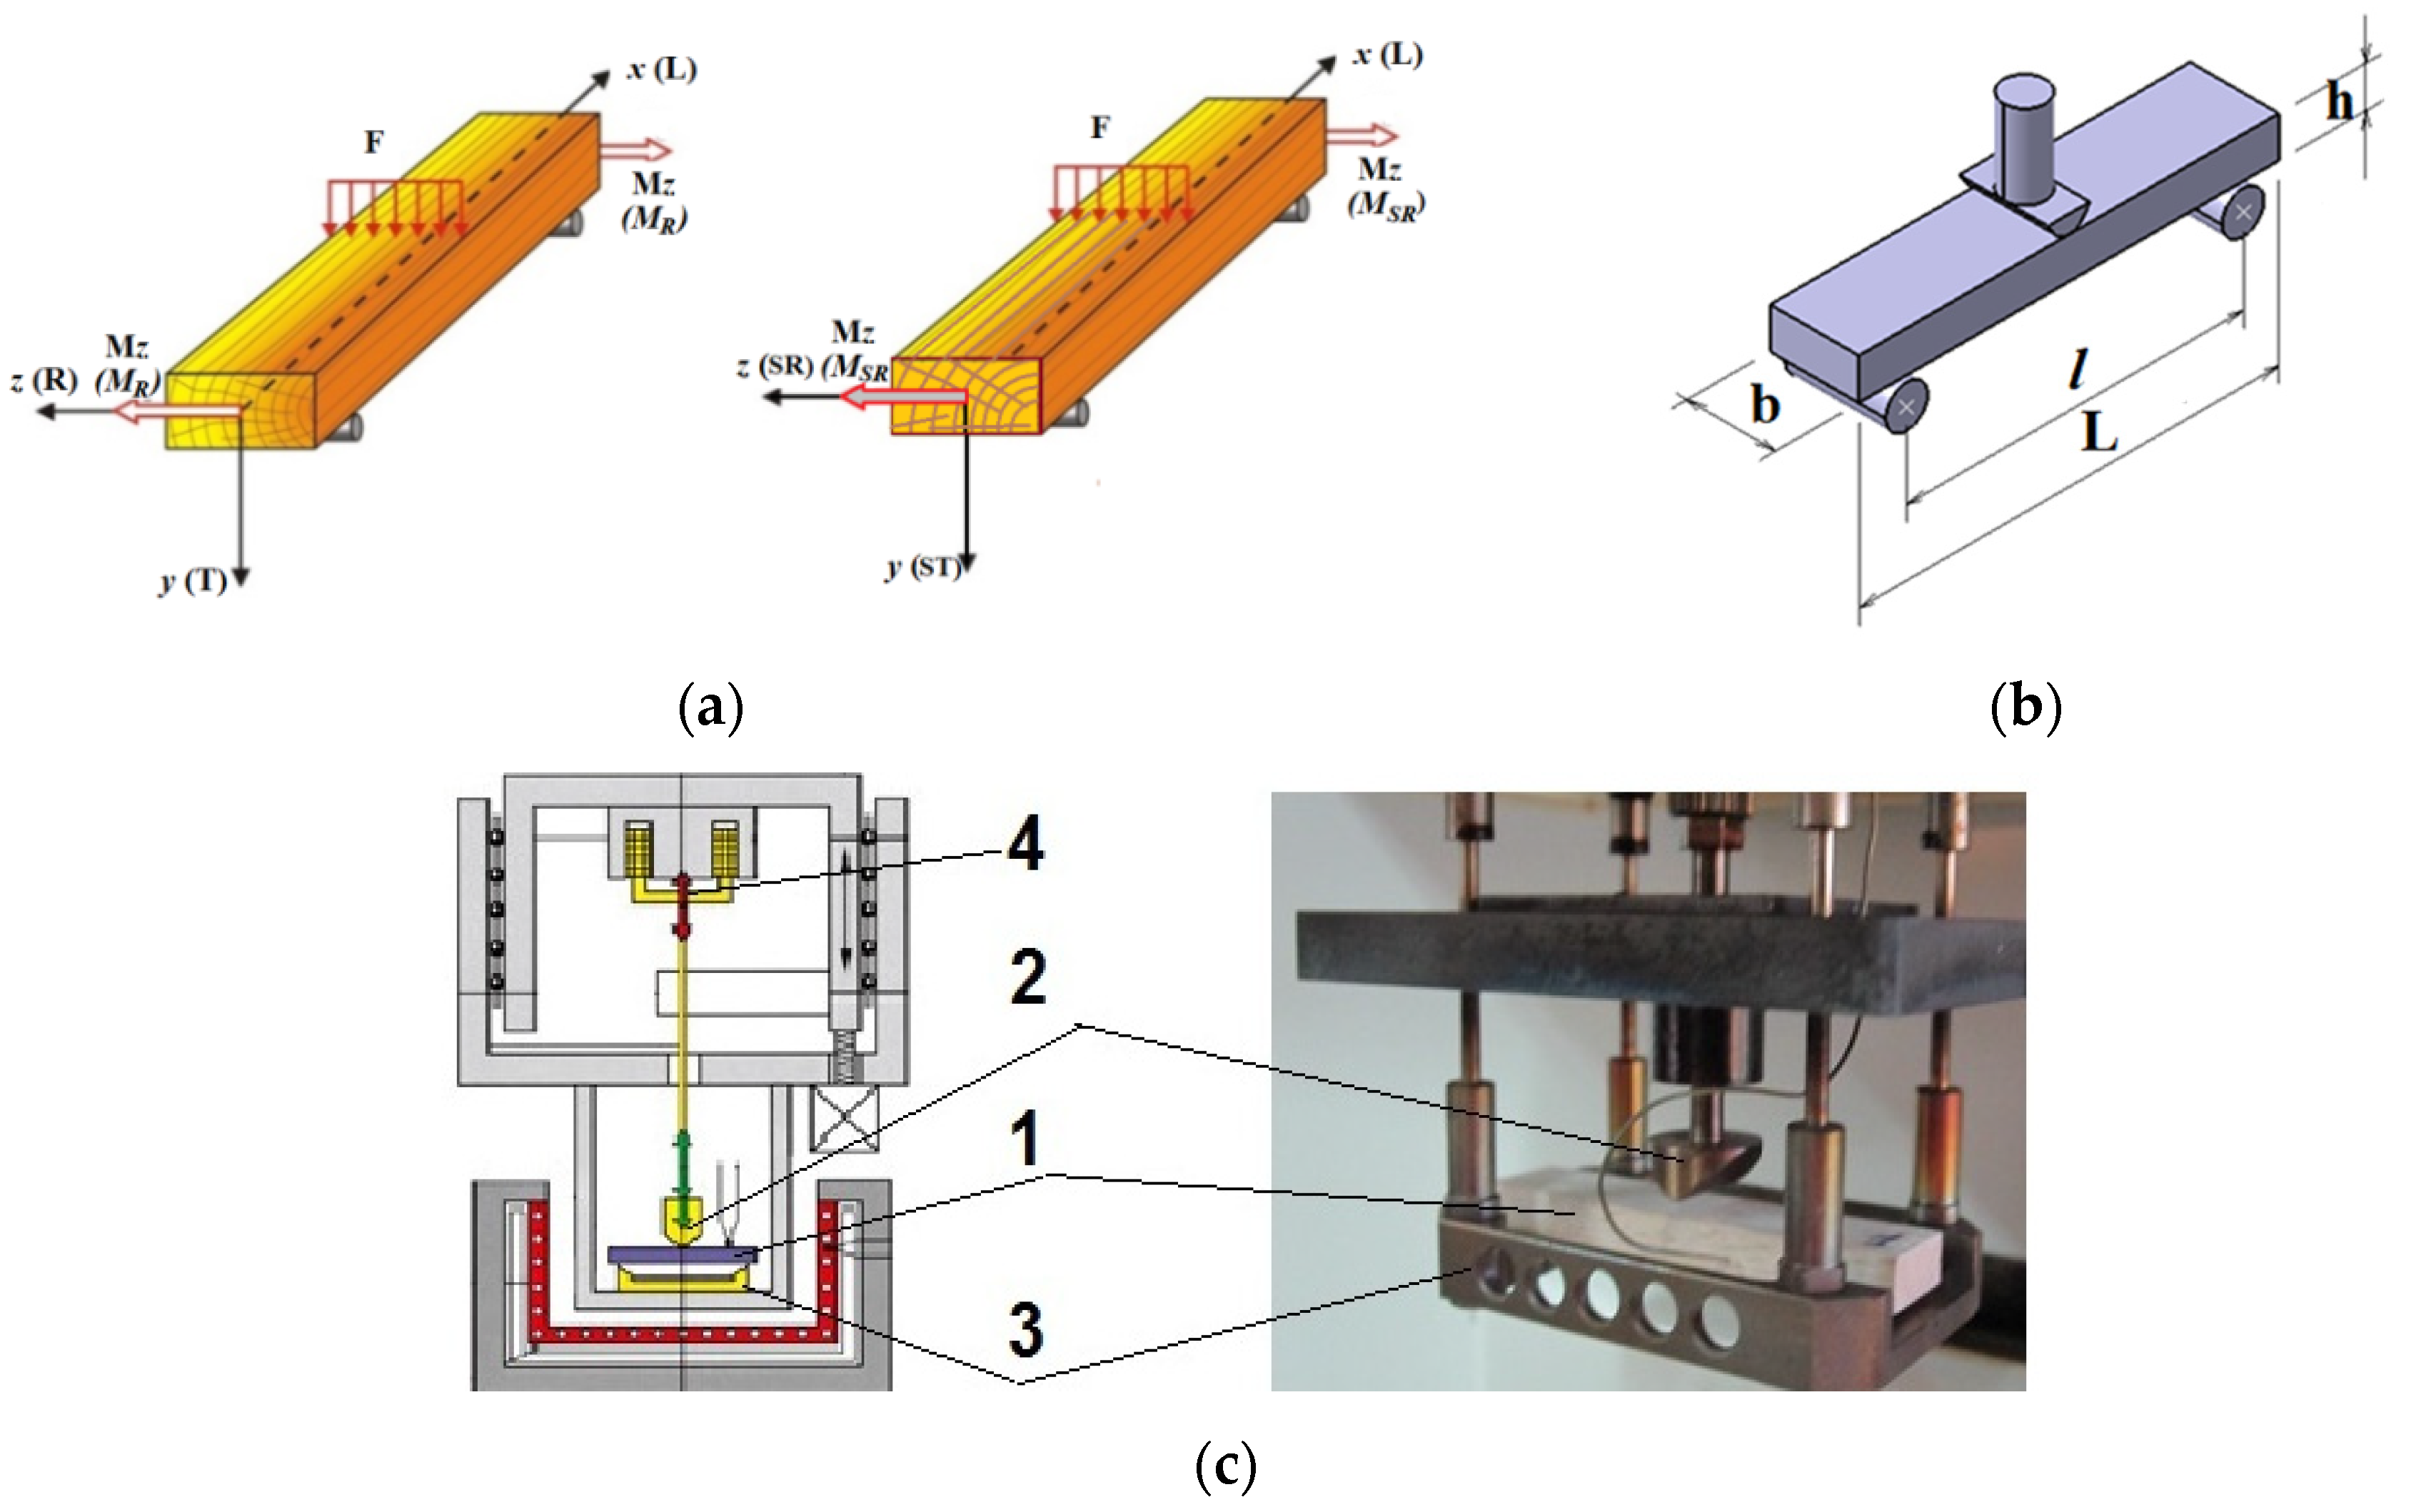
2.2.3. Bending Tests
2.2.4. Scanning Electron Microscope Hitachi S3400N
3. Results
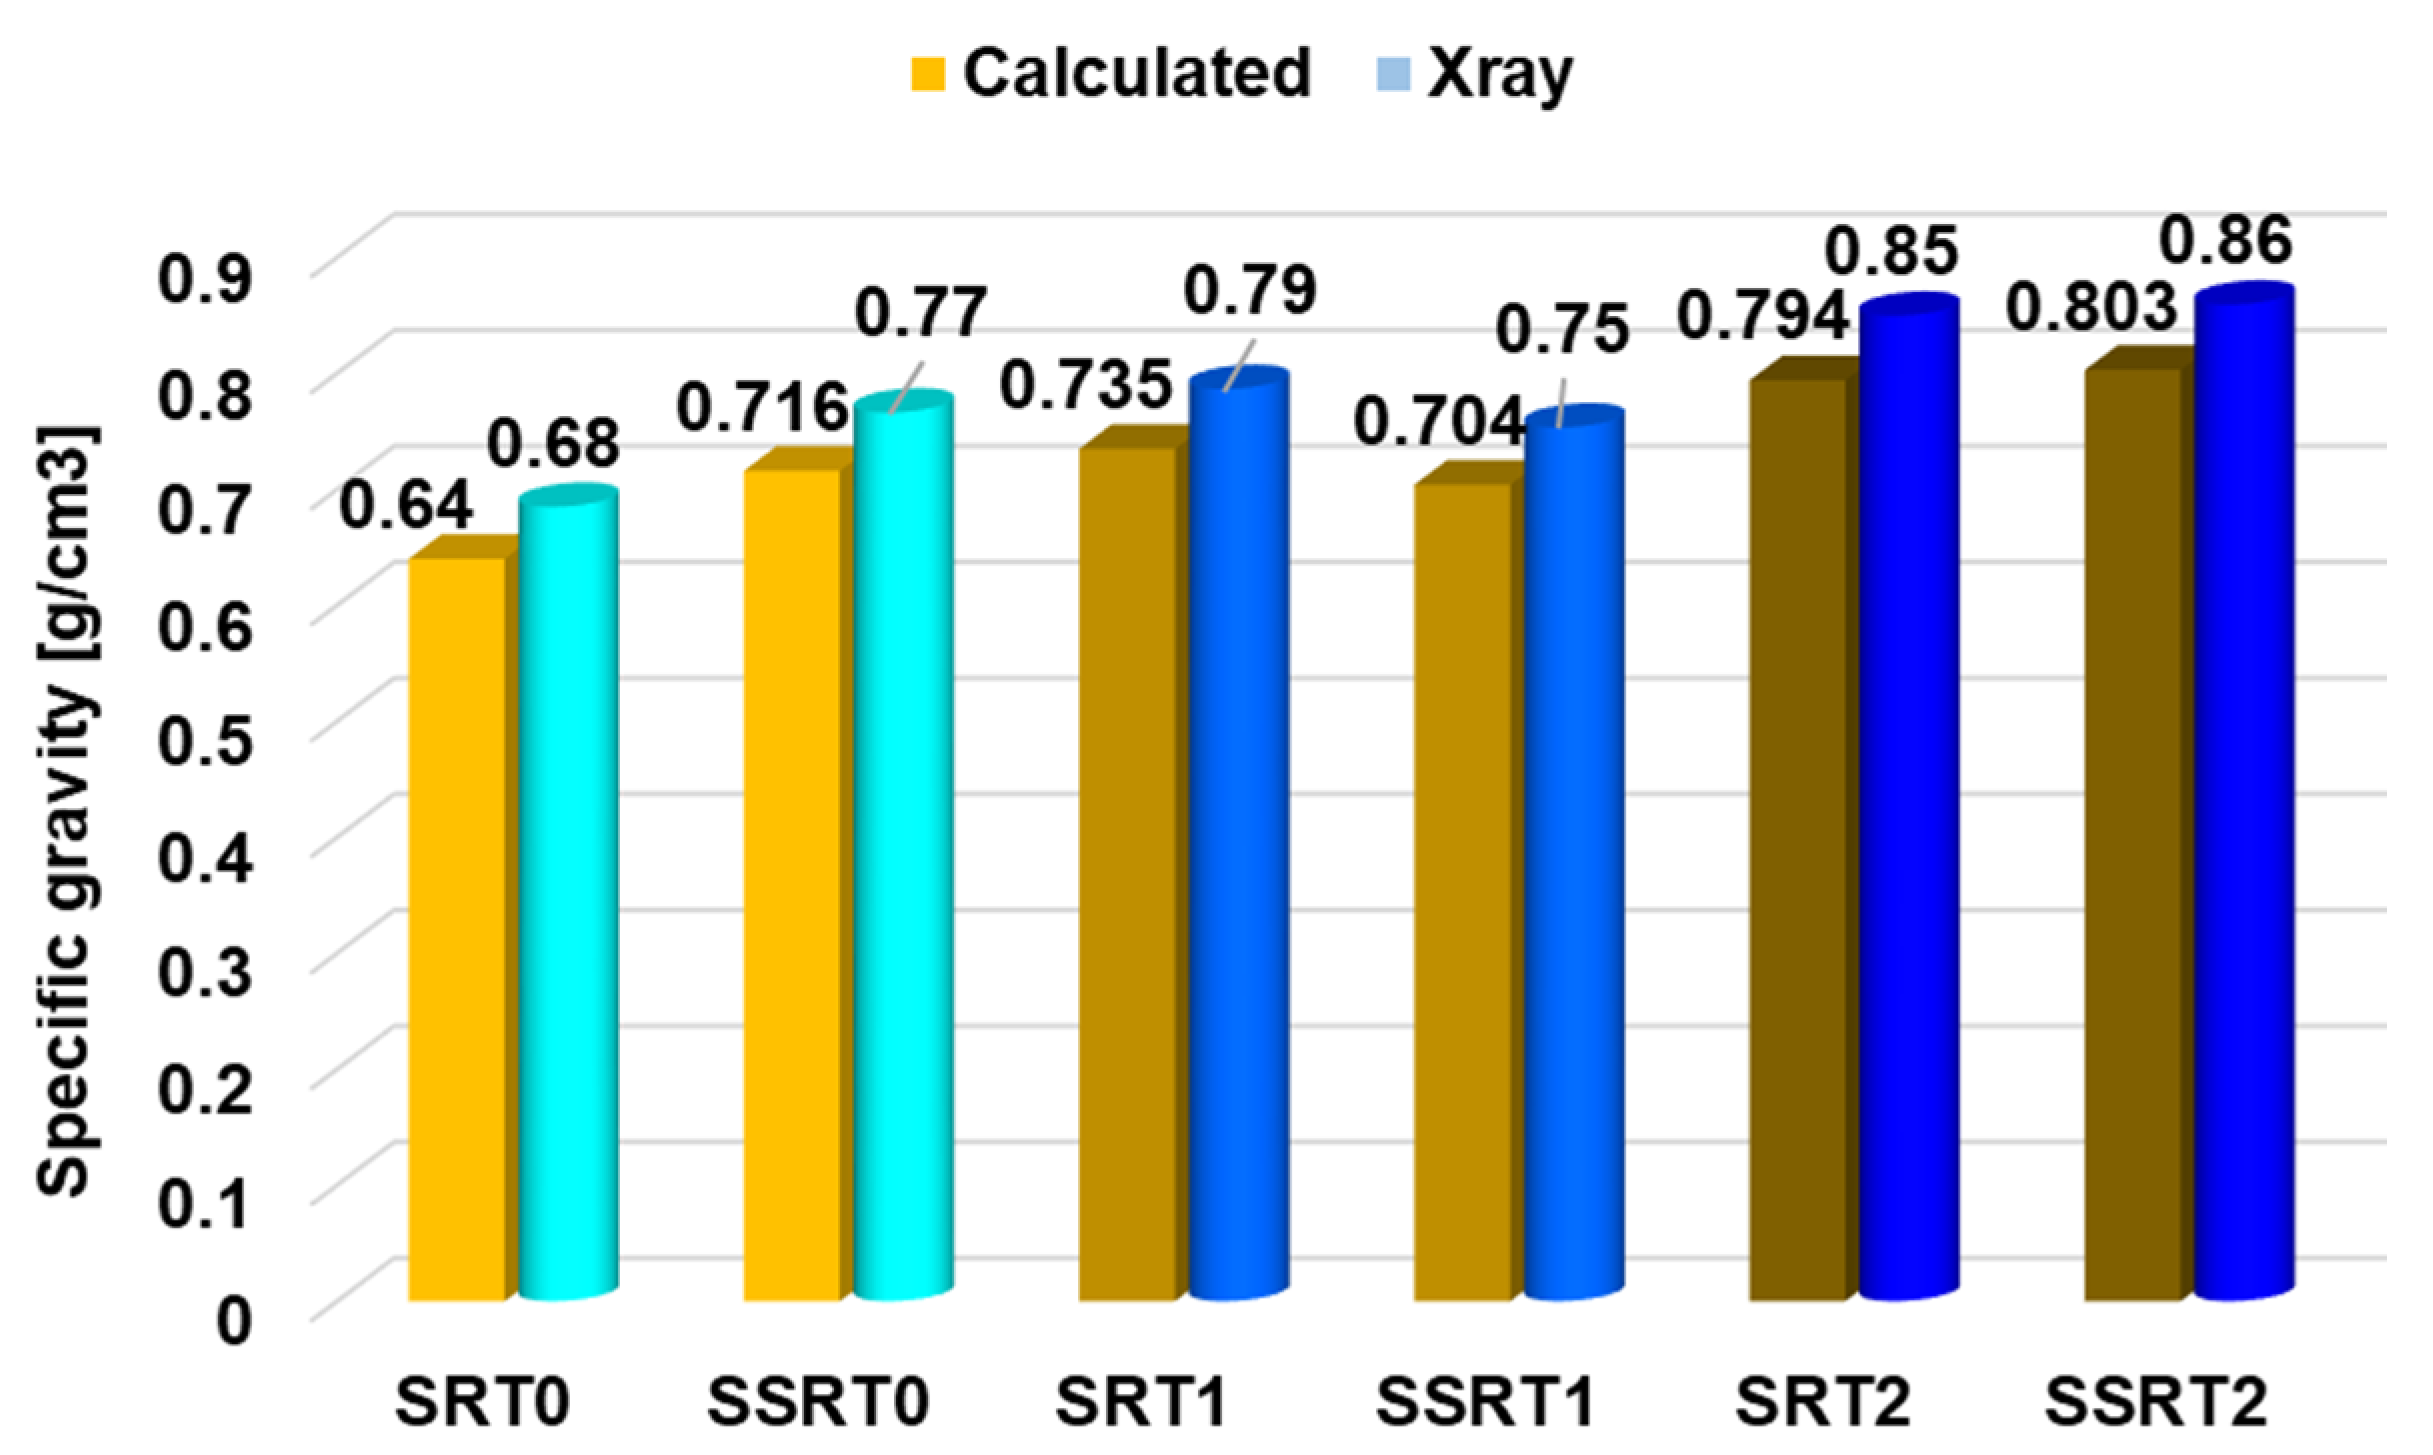
3.1. X-ray Density Profile Analyzer DPX300
3.2. Colour Measurement
3.3. Bending Test
3.3.1. Static Three-Point Bending Test
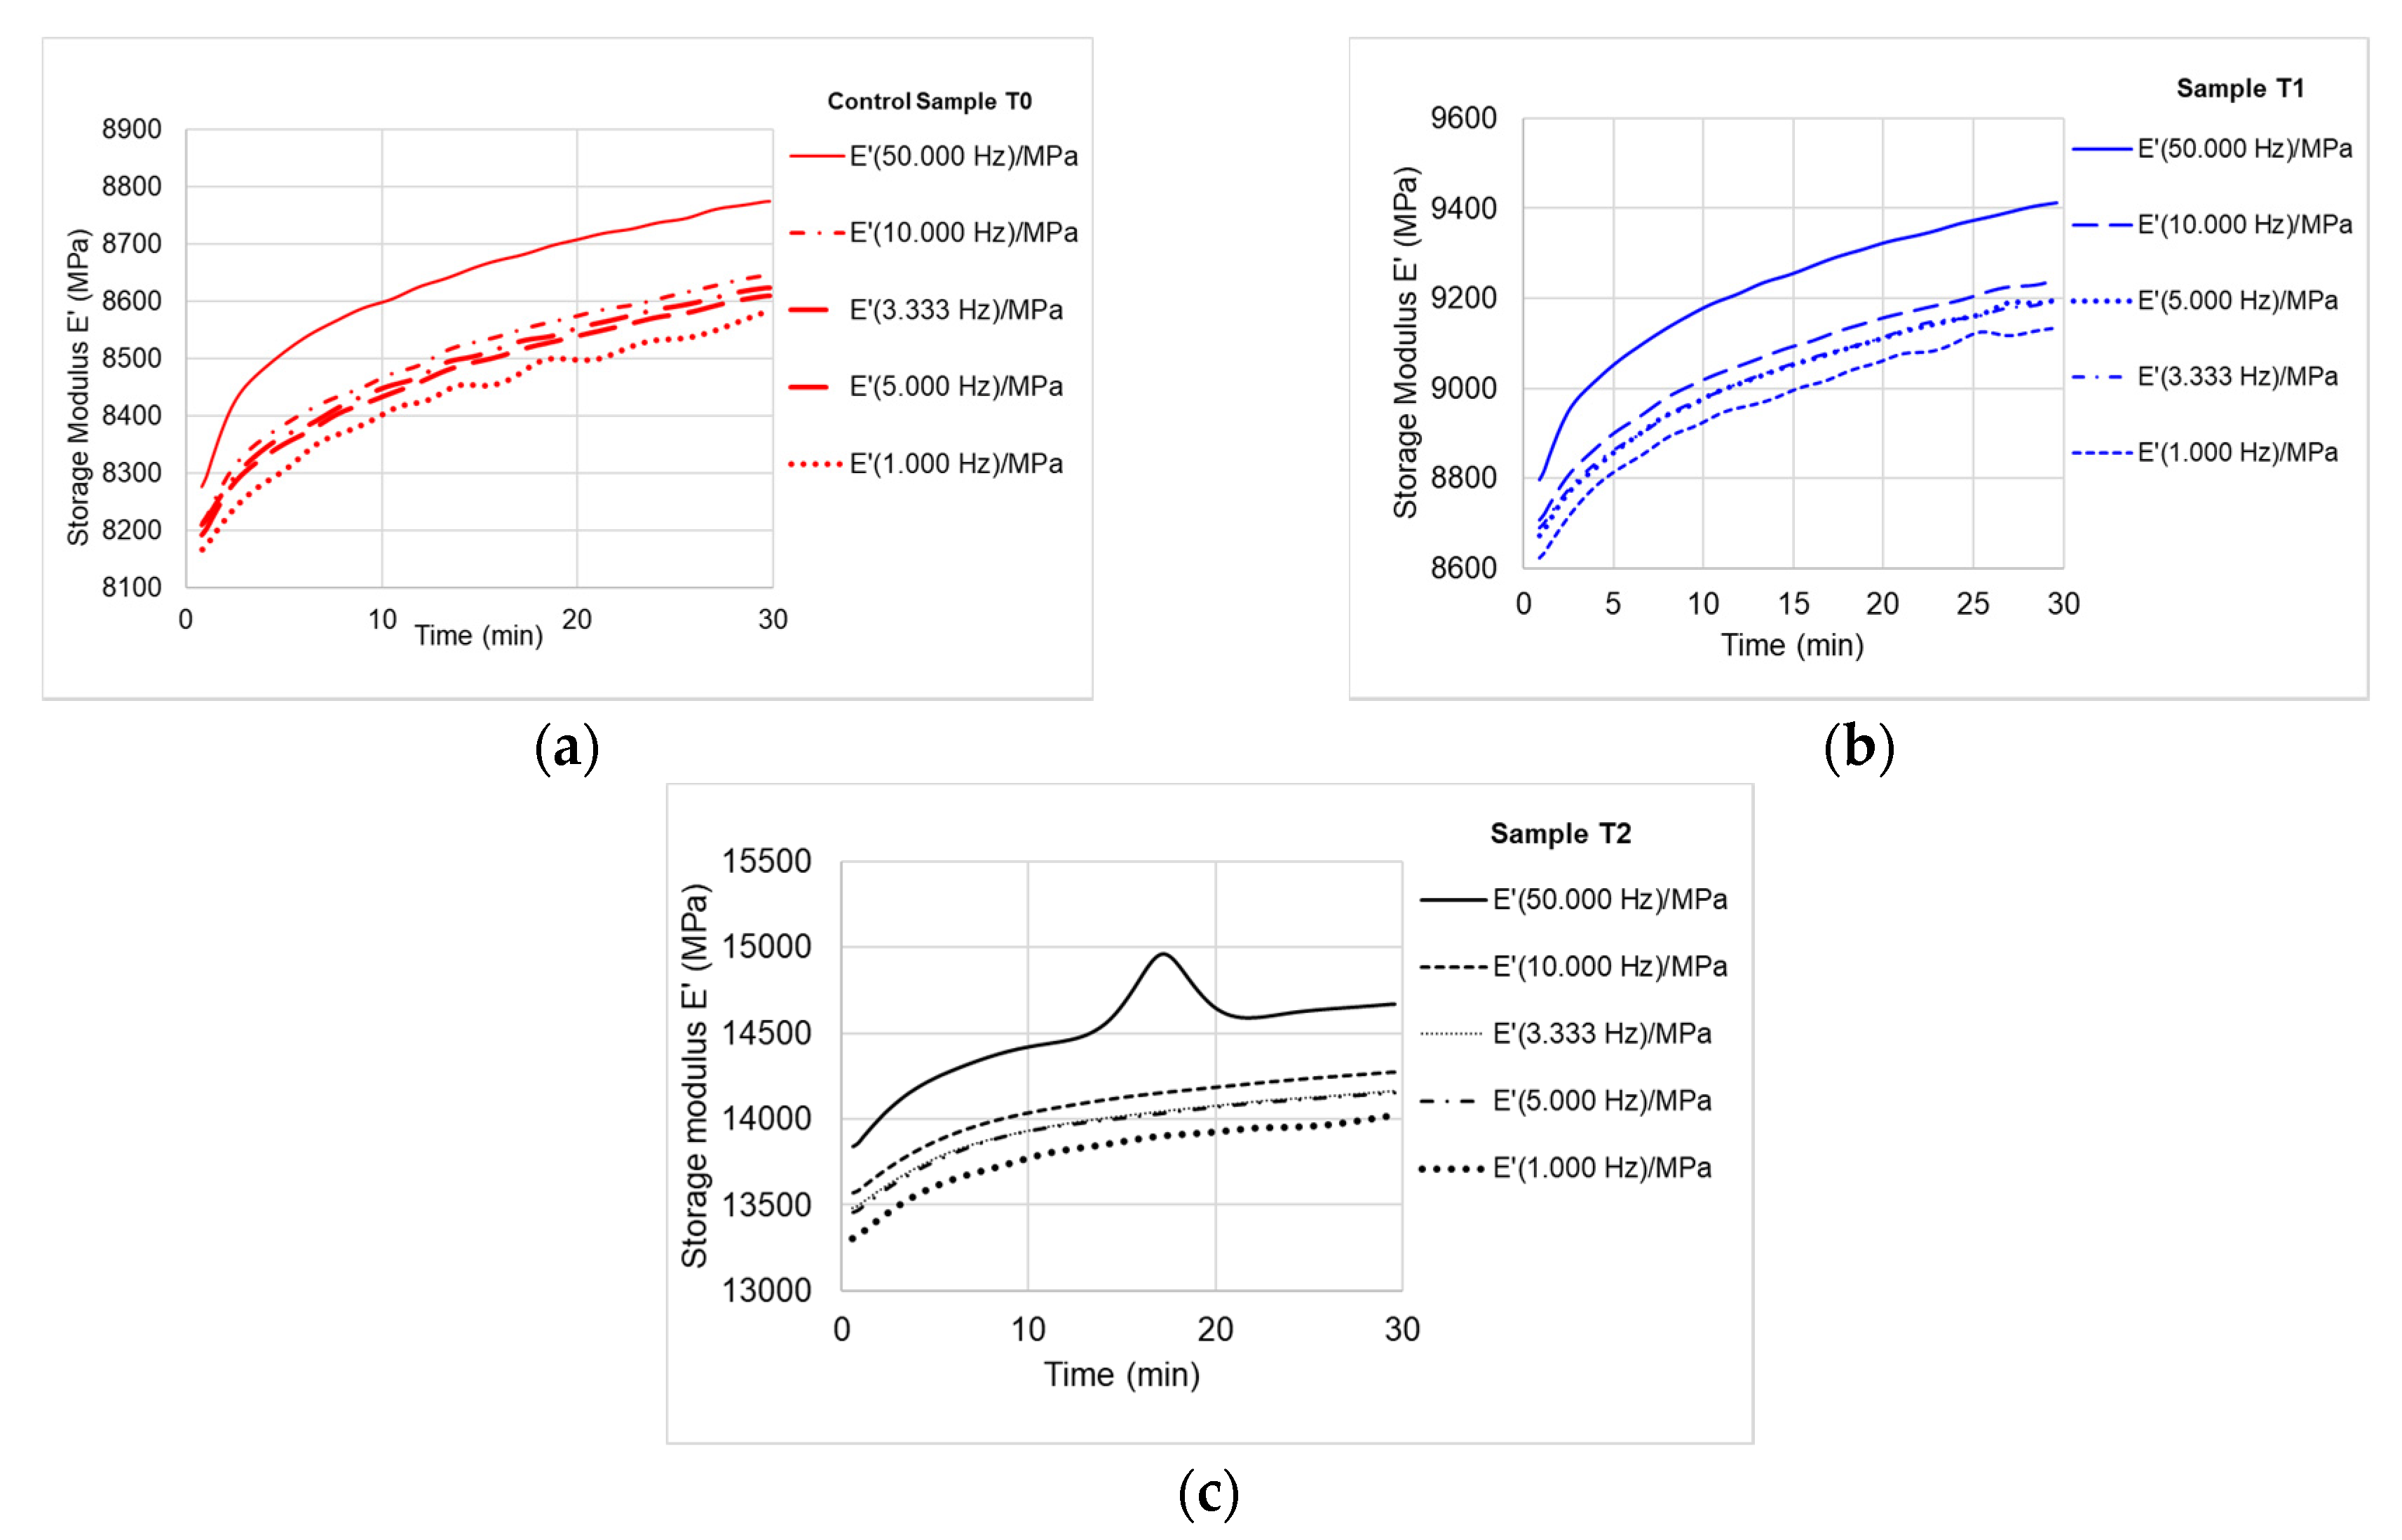
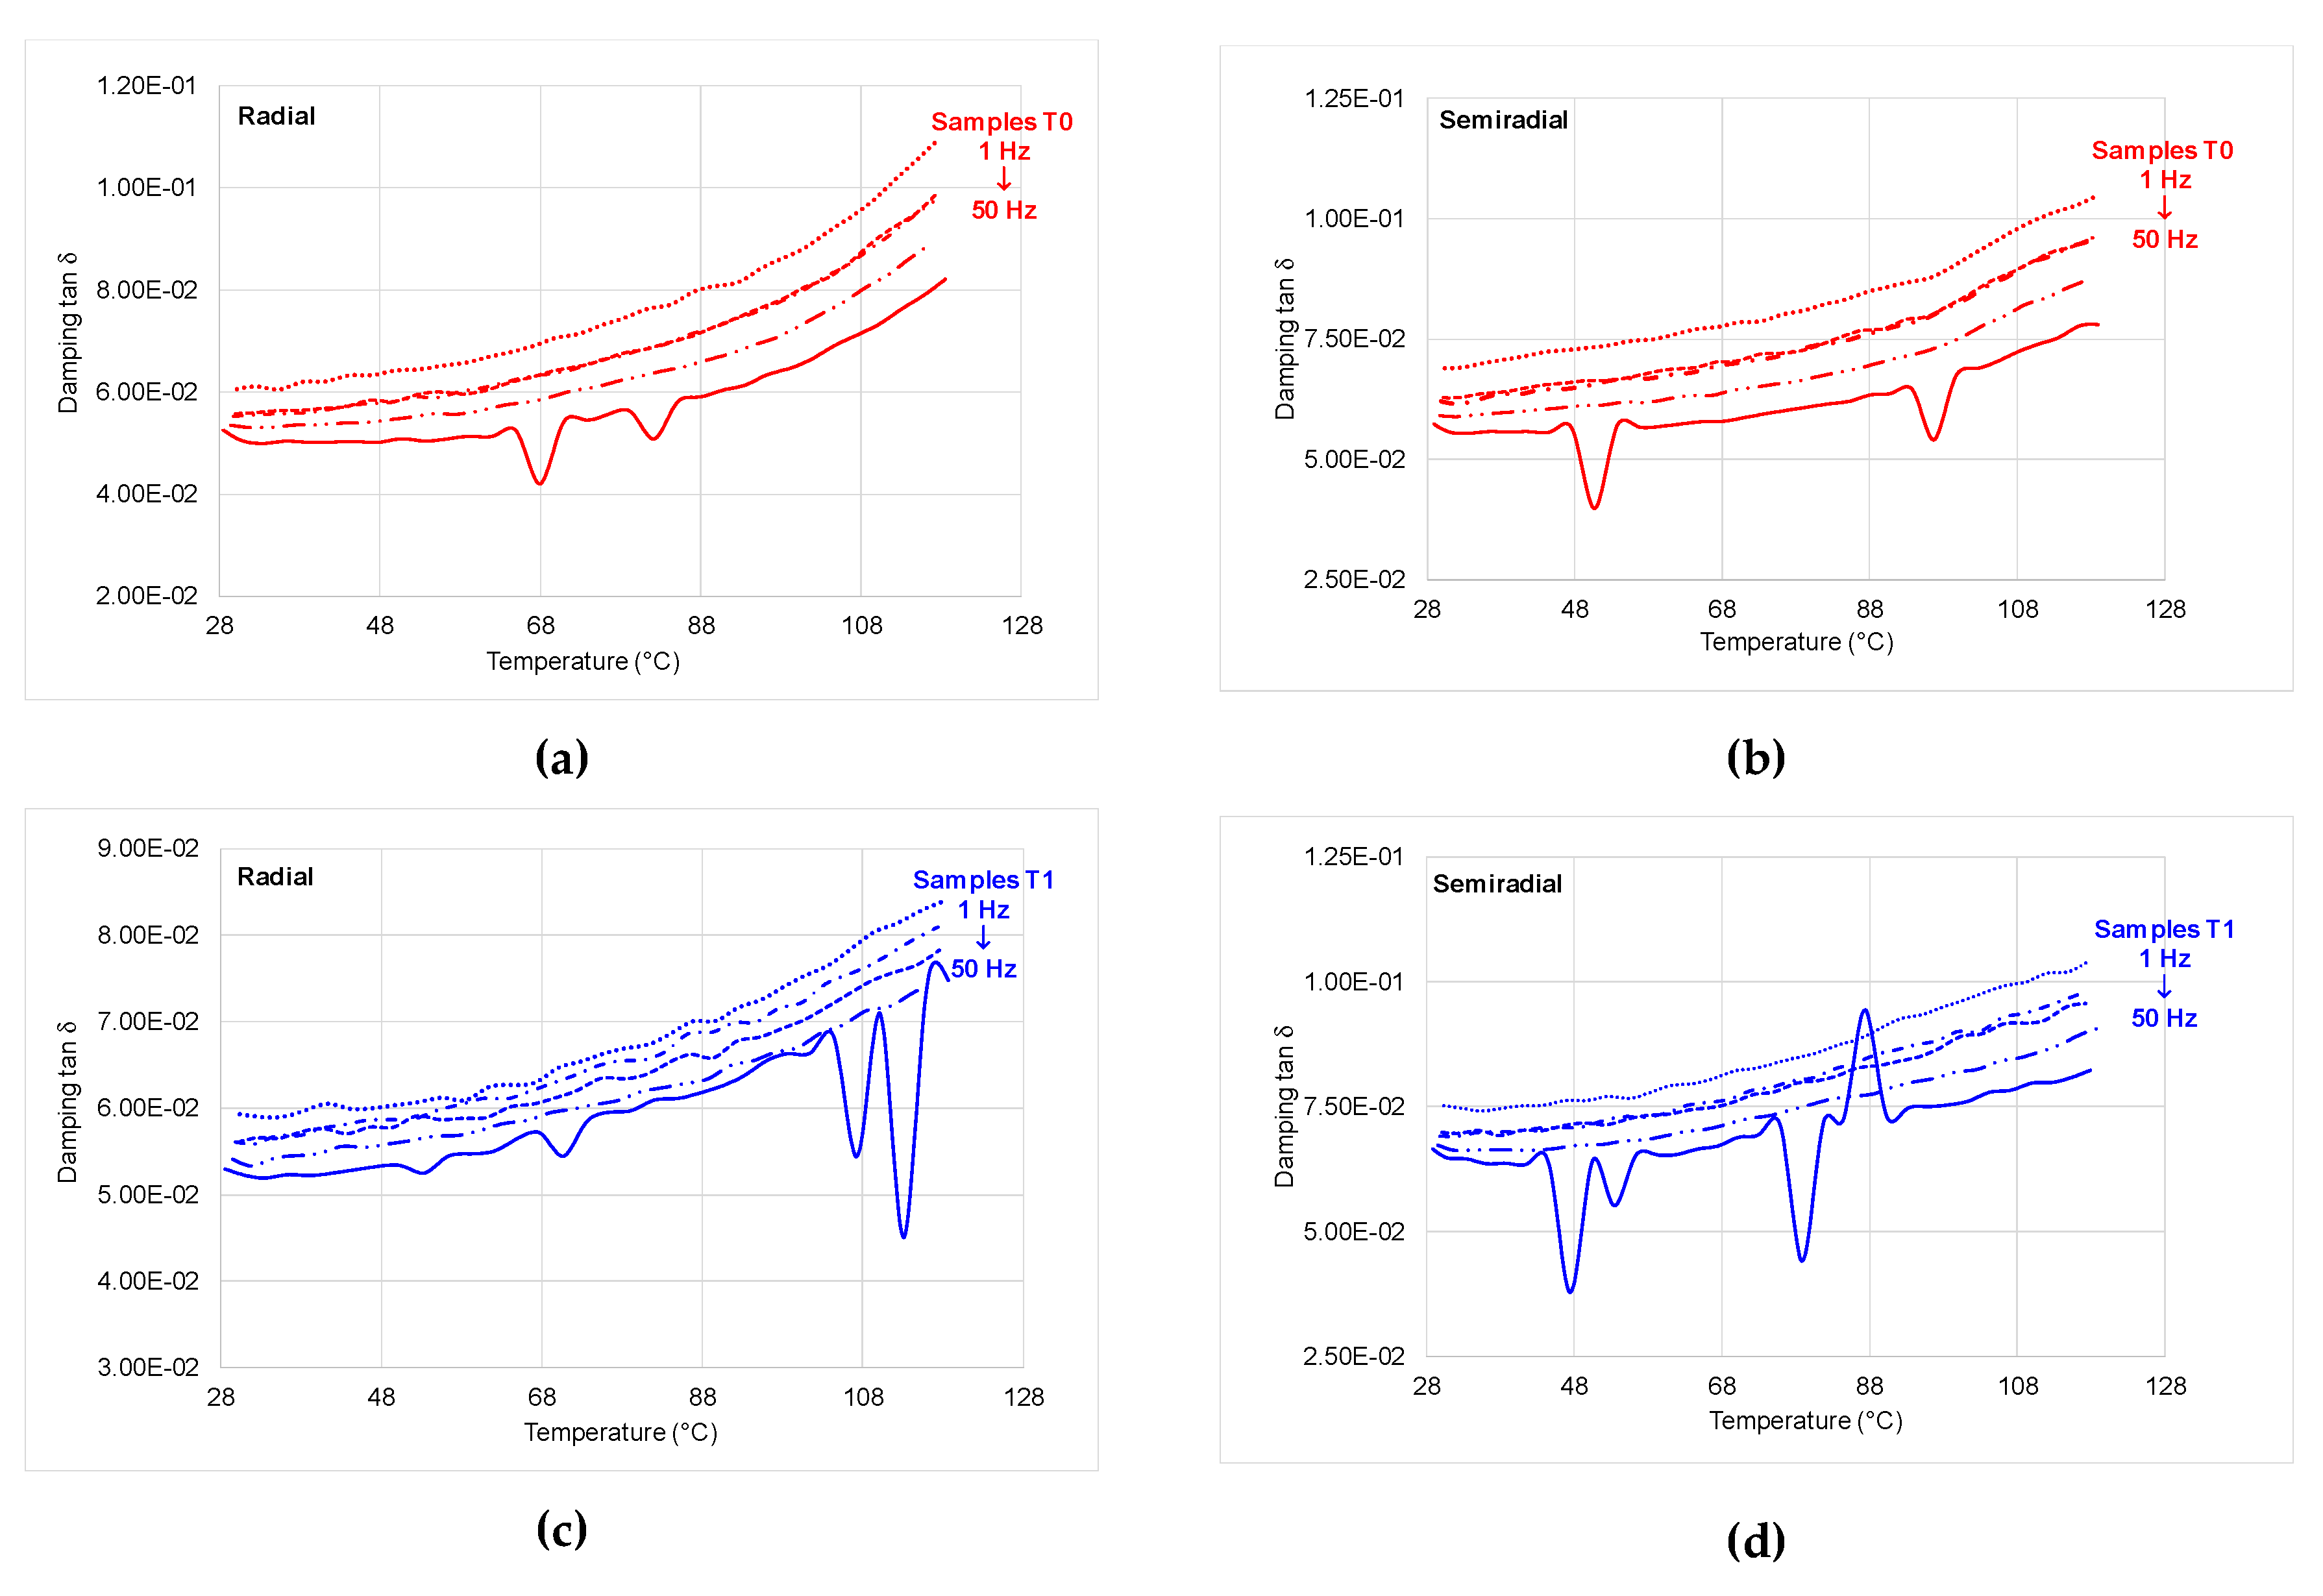
3.3.2. Dynamic Mechanical Analysis (DMA)
3.4. Scanning Electron Microscope Hitachi S3400N
4. Conclusions
- The overall colour change in the case ofthe second treatment is 27% in comparison with 7% recorded for the control samples. The lightness and yellowness are the most affected colour values after the second treatment of black locust wood with ammonia hydroxide (the lightness decreased with almost 40% after ammonia treatment and the yellowness—with 50%).
- The density increased with almost 20% due to ammonium fuming (10% concentration/60 days).
- At the static three-point bending, MOE recorded a decrease with almost 11% and MOR increased for ammonia treated samples with 15% to 17% in comparison with control samples.
- In the DMA test, the storage modulus (E’) is higher with almost 60% in the case of the second treatment of samples in comparison with control samples.
- The viscous behaviour is more evident when the temperature increases above 40–60 °C for all types of samples.
- The exposure of treated samples (T2) to temperature led to different behaviours according to the direction of wood grain related to the orthogonal directions of the samples (radial versus semiradial).
- The microscopic views captured with SEM did not highlight a specific surface modification of wood.
Author Contributions
Funding
Acknowledgments
Conflicts of Interest
References
- Valkenburgh Van, M.; Noone, S.; Zoli, T.; Lavender, D. Black Locust Lumber: A Sustainable Alternative. San Diego, 2011. Available online: https://www.asla.org/search.aspx?q=Valkenburgh (accessed on 28 December 2019).
- Papadopoulos, A.N.; Mantanis, G.I. Surface treatment technologies applied to wood surfaces. FDM Asia-Solid Wood and Panel Technology 2011, 5, 36–39. Available online: users.teilar.gr/~mantanis/Papadopoulos-Mantanis-FDM-Asia.pdf (accessed on 28 December 2019).
- Côte, W. Chemical composition of wood. In Principles of Wood Science and Technology; Springer: Berlin, Germany, 1968; pp. 55–78. [Google Scholar]
- Kapitovic, S.; Klasnja, B.; Guzina, V. Importance of structural, physical and chemical properties of robinia wood for its mechanical characteristics. Drevarski Vyskum. 1989, 122, 13–30. [Google Scholar]
- Kollmann, F.F.P. Principles of Wood Science and Technology: Solid Wood; Springer: Berlin, Germany, 1968. [Google Scholar]
- Weigl, M.; Pockl, J.; Grabner, M. Selected properties of gas phase ammonia treated wood. Eur. J. Wood Prod. 2009, 6, 103–109. [Google Scholar] [CrossRef]
- Miklečić, J.; Španić, N.; Vlatka, J.R. Wood Colour Changes by Ammonia Fuming. BioResources 2012, 7, 3767–3778. [Google Scholar]
- Pawlak, Z.; Pawlak, A.S. A review of infrared spectra from wood and wood components following treatment with liquid ammonia and solvated electrons in liquid ammonia. Appl. Spectrosc. Rev. 1997, 32, 349–383. [Google Scholar] [CrossRef]
- Troppova, E.; Tippner, J.; Hrčka, R.; Halacan, P. Quasi-stationary measurements of Lignamon thermal properties. BioResources 2013, 8, 6288–6296. [Google Scholar] [CrossRef]
- Čermák, P.; Dejmal, A. The effect of heat and ammonia treatment on colour response of oak wood (Quercus Robur) and comparison of some physical and mechanical properties. Maderas. Ciencia y Tecnología 2013, 15, 375–389. [Google Scholar]
- Borysiuk, P.; Jablonski, M.; Policimska-Serwa, A.; Ružinská, E. Mechanical properties of glue bonds in black locust wood treated with ammonia. Ann. WULS-SGGW For. Wood Technol. 2011, 73, 162–166. [Google Scholar]
- Kačík, F.; Ďurkovič, J.; Kačíková, D.; Zenková, E. Changes in the chemical composition of black locust wood after hot-water pretreatment before bioethanol production. Acta Facultatis Xylologiae Zvolen. 2016, 58, 15–23. [Google Scholar]
- Adamopoulos, S. Flexural properties of black locust (Robinia pseudoblack locust L.) small clear wood specimens in relation to the direction of load application. Holz als Roh-und Werkstoff. 2002, 60, 325–327. [Google Scholar] [CrossRef]
- Niklas, K.J. Mechanical Properties of Black Locust (Robinia pseudoacacia L.) Wood. Size and Age-dependent Variations in Sap- and Heartwood. Ann. Bot. 1997, 79, 265–272. [Google Scholar] [CrossRef]
- Pollet, C.; Verheyen, C.; Hebert, J.; Jourez, B. Physical and mechanical properties of black locust (Robinia pseudoacacia) wood grown in Belgium. Can. J. For. Res. 2012, 42, 831–840. [Google Scholar] [CrossRef]
- Weigl, M.; Müller, U.; Wimmer, R.; Hansmann, C. Ammonia vs. thermally modified timber—Comparison of physical and mechanical properties. Eur. J. Wood Prod. 2012, 70, 233–239. [Google Scholar] [CrossRef]
- Rousek, R.; Rademacher, P.; Brabec, M.; Dejmal, A.; Horníček, S.; Baar, J.; Śprdlík, V. Beech wood modification with ammonia gass improved properties. Pro Ligno. 2015, 11, 230–238. [Google Scholar]
- Šprdlík, V.; Brabec, M.; Mihailović, S.; Rademacher, P. Plasticity increase of beech veneer by steaming and gaseous ammonia treatement. Maderas. Ciencia y Tecnología 2016, 18, 91–98. [Google Scholar]
- Kamperidou, V.; Barboutis, I.; Vassiliou, V. Prospects for the utilization of black locust wood (Robinia pseudoacacia L.) coming from plantations in Furniture Manufacturing. In Proceedings of the 27th International Conference on Wood Modification and Technology, Zagreb, Croatia, 13–14 October 2016; pp. 123–128. [Google Scholar]
- Molnar, S.; Peszlen, I.; Richter, H.G.; Tolvaj, L.; Varga, F. Influence of Steaming on Selected Wood Properties of Black Locust. In Proceedings “Environment and Wood Science”; Acta Facultatis Ligniensis, University of Sopron: Sopron, Hungary, 1998; pp. 38–45. [Google Scholar]
- Nemeth, R.; Molnar, S. Utilisation of Walnut (Juglans), Robinia (Robinia pseudoacacia) and Ash (Fraxinus) on the Basis of Hungarian Experiences. Available online: http://www.valbro.uni-freiburg.de/pdf/pres_thes_util_walnut.pdf (accessed on 20 November 2019).
- Menard, K.P. Dynamic Mechanical Analysis–A Practical Introduction; CRC Press LLC: Boca Raton, FL, USA, 1999; p. 117. [Google Scholar]


| Wood Sample Codes | Dimensions | Mass | Apparent Density | Average Density | Standard Deviation | |||
|---|---|---|---|---|---|---|---|---|
| Width b (mm) | Length L (mm) | Thickness h (mm) | m (g) | ρ (g/cm3) | ρav (g/cm3) | STDV | ||
| SRT0 MC = 7% | SRT01. | 10.6 | 50 | 4.88 | 1.58 | 0.611 | 0.640 | 0.026 |
| SRT02. | 10.5 | 50 | 4.9 | 1.63 | 0.634 | |||
| SRT03. | 10.56 | 49.95 | 4.92 | 1.73 | 0.667 | |||
| SRT04. | 10.56 | 49.98 | 4.88 | 1.67 | 0.648 | |||
| SSRT0 MC = 7% | SSRT01. | 10.64 | 50.04 | 4.88 | 1.93 | 0.743 | 0.716 | 0.031 |
| SSRT02. | 10.64 | 50.05 | 4.86 | 1.92 | 0.742 | |||
| SSRT03. | 10.6 | 50.03 | 4.86 | 1.79 | 0.695 | |||
| SSRT04. | 10.6 | 50.01 | 4.88 | 1.77 | 0.684 | |||
| SRT1 MC = 7.5% | SRT11. | 10.35 | 49.9 | 4.97 | 1.94 | 0.756 | 0.735 | 0.021 |
| SRT12. | 10.59 | 50 | 5.02 | 1.88 | 0.707 | |||
| SRT13. | 10.45 | 50.01 | 5.09 | 1.94 | 0.729 | |||
| SRT14. | 10.45 | 49.98 | 4.94 | 1.93 | 0.748 | |||
| SSRT1 MC = 8% | SSRT11. | 10.49 | 49.96 | 4.92 | 1.63 | 0.632 | 0.704 | 0.085 |
| SSRT12. | 10.45 | 49.97 | 4.86 | 1.61 | 0.634 | |||
| SSRT13. | 10.46 | 49.97 | 4.91 | 2.06 | 0.803 | |||
| SSRT14. | 10.48 | 49.97 | 4.94 | 1.94 | 0.750 | |||
| SRT2 MC = 8% | SRT21. | 10.49 | 49.93 | 4.85 | 1.87 | 0.736 | 0.794 | 0.039 |
| SRT22. | 10.47 | 50.04 | 4.88 | 2.07 | 0.810 | |||
| SRT23. | 10.58 | 50 | 4.85 | 2.10 | 0.819 | |||
| SRT24. | 10.57 | 49.93 | 4.76 | 2.04 | 0.812 | |||
| SSRT2 MC = 8% | SSRT21. | 10.56 | 50 | 4.94 | 2.18 | 0.836 | 0.803 | 0.031 |
| SSRT22. | 10.55 | 50 | 4.96 | 2.08 | 0.795 | |||
| SSRT23. | 10.52 | 50.01 | 4.92 | 2.11 | 0.815 | |||
| SSRT24. | 10.52 | 49.99 | 4.98 | 2.00 | 0.764 | |||
| Average Values (10 Samples for Each Type) | Samples | |||||
|---|---|---|---|---|---|---|
| T0 | STDEV | T1 | STDEV | T2 | STDEV | |
| MOE of Bending (MPa) | 7190 | 236.44 | 6469 | 214.38 | 6338 | 268.53 |
| Differences MOE (%) | 0 | −10.03 | −11.85 | |||
| Break Force F (N) | 679.19 | 84.64 | 860.93 | 103.80 | 963.50 | 110.74 |
| Differences F (%) | 0 | +26.75 | +41.86 | |||
| MOR of Bending (MPa) | 156.51 | 24.63 | 180.51 | 25.14 | 183.41 | 28.53 |
| Differences MOR (%) | 0 | +15.33 | +17.18 | |||
| Maximum Deflection (mm) | 7.01 | 0.512 | 7.00 | 0.653 | 6.05 | 0.721 |
© 2020 by the authors. Licensee MDPI, Basel, Switzerland. This article is an open access article distributed under the terms and conditions of the Creative Commons Attribution (CC BY) license (http://creativecommons.org/licenses/by/4.0/).
Share and Cite
Stanciu, M.D.; Sova, D.; Savin, A.; Ilias, N.; Gorbacheva, G.A. Physical and Mechanical Properties of Ammonia-Treated Black Locust Wood. Polymers 2020, 12, 377. https://doi.org/10.3390/polym12020377
Stanciu MD, Sova D, Savin A, Ilias N, Gorbacheva GA. Physical and Mechanical Properties of Ammonia-Treated Black Locust Wood. Polymers. 2020; 12(2):377. https://doi.org/10.3390/polym12020377
Chicago/Turabian StyleStanciu, Mariana Domnica, Daniela Sova, Adriana Savin, Nicolae Ilias, and Galina A. Gorbacheva. 2020. "Physical and Mechanical Properties of Ammonia-Treated Black Locust Wood" Polymers 12, no. 2: 377. https://doi.org/10.3390/polym12020377
APA StyleStanciu, M. D., Sova, D., Savin, A., Ilias, N., & Gorbacheva, G. A. (2020). Physical and Mechanical Properties of Ammonia-Treated Black Locust Wood. Polymers, 12(2), 377. https://doi.org/10.3390/polym12020377