Article

PDMS Based Hybrid Sol-Gel Materials for Sensing Applications in Alkaline Environments: Synthesis and Characterization

by
Rui P. C. L. Sousa
1,*,
Bárbara Ferreira
1,
Miguel Azenha
2,
Susana P. G. Costa
1,
Carlos J. R. Silva
1 and
Rita B. Figueira
1,*
1
Centro de Química, Campus de Gualtar, Universidade do Minho, 4710-057 Braga, Portugal
2
ISISE, Departamento de Engenharia Civil, Escola de Engenharia, Campus de Azurém, Universidade do Minho, 4800-058 Guimarães, Portugal
*
Authors to whom correspondence should be addressed.
Polymers 2020, 12(2), 371; https://doi.org/10.3390/polym12020371
Submission received: 29 November 2019 / Revised: 10 January 2020 / Accepted: 16 January 2020 / Published: 7 February 2020
(This article belongs to the Special Issue Organic-Inorganic Hybrid Materials)

Abstract

:
Nowadays, concrete degradation is a major problem in the civil engineering field. Concrete carbonation, one of the main sources of structures’ degradation, causes concrete’s pH to decrease; hence, enabling the necessary conditions for corrosion reinforcement. An accurate, non-destructive sensor able to monitor the pH decrease resistant to concrete conditions is envisaged by many researchers. Optical fibre sensors (OFS) are generally used for concrete applications due to their high sensitivity and resistance to external interferences. Organic-inorganic hybrid (OIH) films, for potential functionalization of OFS to be applied in concrete structures, were developed. Polydimethylsiloxane (PDMS) based sol-gel materials were synthesized by the formation of an amino alcohol precursor followed by hydrolysis and condensation. Different ratios between PDMS and (3-aminopropyl)triethoxysilane (3-APTES) were studied. The synthesized OIH films were characterized by Fourier-transformed infrared spectroscopy (FTIR), UV–Vis spectroscopy, electrochemical impedance spectroscopy (EIS) and thermogravimetric analysis (TGA). The OIH films were doped with phenolphthalein (Phph), a pH indicator, and were characterized by UV–Vis and EIS. FTIR characterization showed that the reaction between both precursors, the hydrolysis and the condensation reactions occurred successfully. UV–Vis characterization confirmed the presence of Phph embedded in the OIH matrices. Dielectric and thermal properties of the materials showed promising properties for application in contact with a high alkaline environment.

Graphical Abstract

1. Introduction

The sol-gel process is a synthetic method that allows producing organic-inorganic hybrid (OIH) materials [1,2]. These materials are also known as organically modified silicates (ORMOSILs), and have a wide range of applications [3,4,5,6,7,8,9,10,11,12]. Generically, this method consists of the hydrolysis and condensation of an alkoxide to form a polymeric matrix [13,14,15,16]. The precursors and the synthesis conditions can be tuned, allowing one to obtain a product with suitable physicochemical properties according to the required application. Furthermore, OIH sol-gel materials can be doped with several species, such as corrosion inhibitors [17], electrolytes (to produce high conductivity films) [18], pharmaceutical drugs or other biomolecules [19]. These materials can also be doped with chemosensors, allowing them to obtain a polymeric matrix with sensing abilities [20,21,22]. A chemosensor is a molecule that is sensitive to the presence of a certain analyte and provides a detectable change in a signal, transducing a chemical signal into an action potential [23]; pH indicators are one of the main examples of this class of chemosensors, since these molecules provide a signal change with a concentration variation in H+; pH indicators such as cresol red, bromophenol blue and fluorescein, among others, have already been successfully entrapped into a polymeric sol-gel matrix [24]. The most sol-gel precursors used in these cases are tetramethyl orthosilicate (TMOS) and tetraethyl orthosilicate (TEOS). The literature reports also entrapment of pH indicators, such as fluorescein isothiocyanate and hydroxypyrenetrisulfonic acid [25,26], in films based on polydimethylsiloxanes (PDMS). However, these studies only covered neutral pH values. PDMS is one of the most used precursors in sol-gel synthesis due to the presence of different functional groups such as amine [27], hydroxyl [28] and epoxy [29]. PDMS based precursors are commonly viscous liquids, and several applications such as coatings [30], sponges [31] or biomedical devices [32] have been reported. The different PDMS functional groups available allow the possibility to synthesize OIH gel matrices by reacting with a cross-linker, such as a silane [33,34,35], followed by hydrolysis and condensation. These precursors show several advantages when compared to other sol-gel precursors (e.g., TEOS or TMOS, which produce fully inorganic materials), particularly in properties such as elasticity, transparency and biocompatibility [36]. These properties allowing one to obtain OIH films suitable for optical fibre sensing applications such as the ones reported by Gao and Wang [37,38].
Concrete structures are designed to have high durability (design lifetimes typically within 50 to 100 years) with low maintenance costs. Therefore, concrete can be regarded as a stable material, with the typical internal pH at the pore network having, usually, very high values (12.5–13.5). However, due to the combination of several factors, the degradation of concrete and reinforced concrete structures (RCS) may take place due to corrosion or chemical reactions such as the alkali–silica reaction [39,40]. Moreover, the porous structure of the concrete does not provide a perfect physical barrier. This lack of imperviousness allows the progressive ingress of aggressive species at the steel/concrete interface, causing the rupture of the passivation film. The most common causes for RCS corrosion are the ingress of chloride ions, the reaction of atmospheric CO2 with the constituents of concrete and the combination of these two processes. Carbonation of concrete occurs due to the chemical reaction of atmospheric CO2 with the alkaline components present in the concrete pore solution, forming calcite (CaCO3). This reaction leads to a decrease in the pH values of the interstitial concrete pore solution [41]. This pH decrease, generally from values above 12.5 to values between 9 and 6, compromises the concrete’s protective function [42]. Therefore, monitoring concrete and RCS is a crucial activity, not only economically but also for human safety; pH monitoring in concrete has been approached by the scientific community already. For instance, Behnood et al. [43] reviewed and compared the methods for monitoring pH in concrete and divided them into destructive and non-destructive methods. Destructive methods are the most used for concrete condition assessment. However, these are limited by sampling, which may not be representative of the whole structure [44]. Behnood et al. described the three most used destructive methods for pH monitoring; namely: the pore water expression method, that extracts the concrete pore solution under hydraulic pressure; the in-situ leaching method, which analyses the concrete pore solution inside a cavity by equilibrium with an added solution; and the ex-situ leaching method, that is based on a powder solution and by equilibration with an added solution. Pore water expression is the most used from the three methods above, and it was recommended by Plusquelle et al. [45] mainly due to its simplicity. On the other hand, non-destructive methods, which are becoming more and more evolved, can be electrochemical or optical [44]. These monitoring methods started with the development of electrochemical sensors for the measurement of corrosion potential of rebars [44]. However, in the last few years, there has been a huge interest in the development of new optical sensors which are generally based on properties such as fluorescence, absorbance, reflectance and refractive index [46]. Optical fibre sensors (OFS) for applications in concrete structures show several advantages when compared to electrochemical methods, such as reduced cost, size and weight, as well as higher sensitivity [39]. Behnood et al. concluded that OFS can be very effective for real-time pH monitoring. Nevertheless, the sensors already reported for application in concrete need to be further developed in order to obtain accurate levels of resolution, repeatability and reproducibility [43].
The use of OFS for concrete monitoring was introduced long ago, mainly for crack monitoring [47] and other mechanical variations. Since then, OFS based on sol-gel materials have been developed for structural health monitoring [39,43,45,48,49,50], including parameters such as temperature, humidity and pH [39]. However, most of the developed OFS functionalized with OIH sol-gel films have limitations for concrete applications, such as the leaching of the doped species from the films or poor resistance to be used in fresh concrete. As far as the authors know, no OFS functionalized with PDMS-based OIH sol-gel films for concrete pH monitoring have been described. PDMS hydroxyl-terminated has been reported as a concrete additive [51] to reduce the production of calcite protecting the concrete structures against the reduction of the pH level. Sidek et al. [52,53] reported the preparation of a fibre Bragg grating (FBG) sensor for strain detection in concrete structures, with and without a PDMS coating. PDMS coated FBG sensors have shown themselves to be more sensitive than uncoated FBG sensors [54]. Later, in 2016, Tan et al. [55] showed that PDMS-coated FBG indeed enhanced the sensibility of strain detection and that the response of the sensor was linear to the rebar corrosion rate, estimated by the weight loss. PDMS has also some limitations, such as its low Young’s modulus and the possibility to absorb impurities during the curing process [55]. Nevertheless, the combination of the OFS technology and PDMS-based OIH show the potential to build a non-destructive monitoring system that can withstand the harsh conditions of fresh concrete. Phenolphthalein (Phph) is one of the most well-known pH indicators and has its turning point at a pH between 8 and 10. This indicator is already used for qualitative assessment of the depth of carbonation in concrete (e.g., by staining concrete cores right after extraction from a given structure) [56]. Therefore, OIH sol-gel materials doped with Phph can be used to functionalise OFS, allowing one to assess the carbonation of concrete structures.
This work reports a study that is only focused on the synthesis and characterization of three OIH sol-gel materials based on PDMS-diglycidyl, ether terminated (PDMS(800)-GET). The chemical characterization and stability testing of the OIH matrices in contact with simulating concrete pore solution (SCPS) were carried out. The development of OFS based on OIH sol-gel materials opens up the possibility of producing highly accurate and reliable sensing systems. Therefore, the aim of these studies was to assess the ability of these materials to be used as sensing material for OFS functionalisation. The produced films, doped and undoped with Phph, were characterized by Fourier-transformed infrared (FTIR) spectroscopy, UV-Vis spectroscopy, electrochemical impedance spectroscopy (EIS) and thermogravimetric analysis (TGA). UV–Vis characterization confirmed the presence of Phph embedded in the OIH matrices. The dielectric and thermal properties of the materials showed promising properties for application in contact with a high alkaline environment.

2. Materials and Methods

2.1. Materials

Poly(dimethylsiloxane)-diglycidyl ether (PDMS(800)-GET, Sigma-Aldrich, St. Louis, MO, USA), 3-aminopropyltriethoxysilane (3-APTES, 99%, Acros Organics, Geel, Belgium), phenolphthalein (Merck, Darmstadt, Germany), absolute ethanol (EtOH, PanReac, Darmstadt, Germany), citric acid monohydrate (Merck, Darmstadt, Germany), potassium bromide (KBr, FTIR grade, ≥99%, Sigma-Aldrich, St. Louis, MO, USA), calcium hydroxide (Ca(OH)2, 95%, Riedel, Bucharest, Romania) and potassium hydroxide (KOH, 90%, PanReac, Darmstadt, Germany) were used as received. High purity deionized water with high resistivity (higher than 18 MΩ cm) obtained from a Millipore water purification system was used in all prepared solutions.

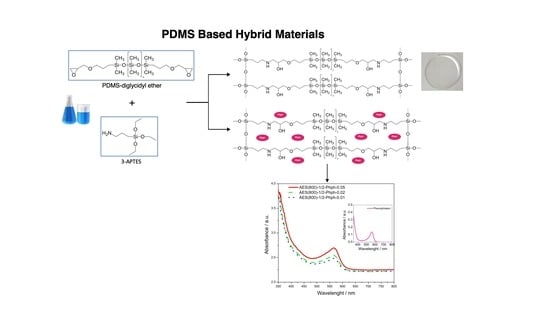
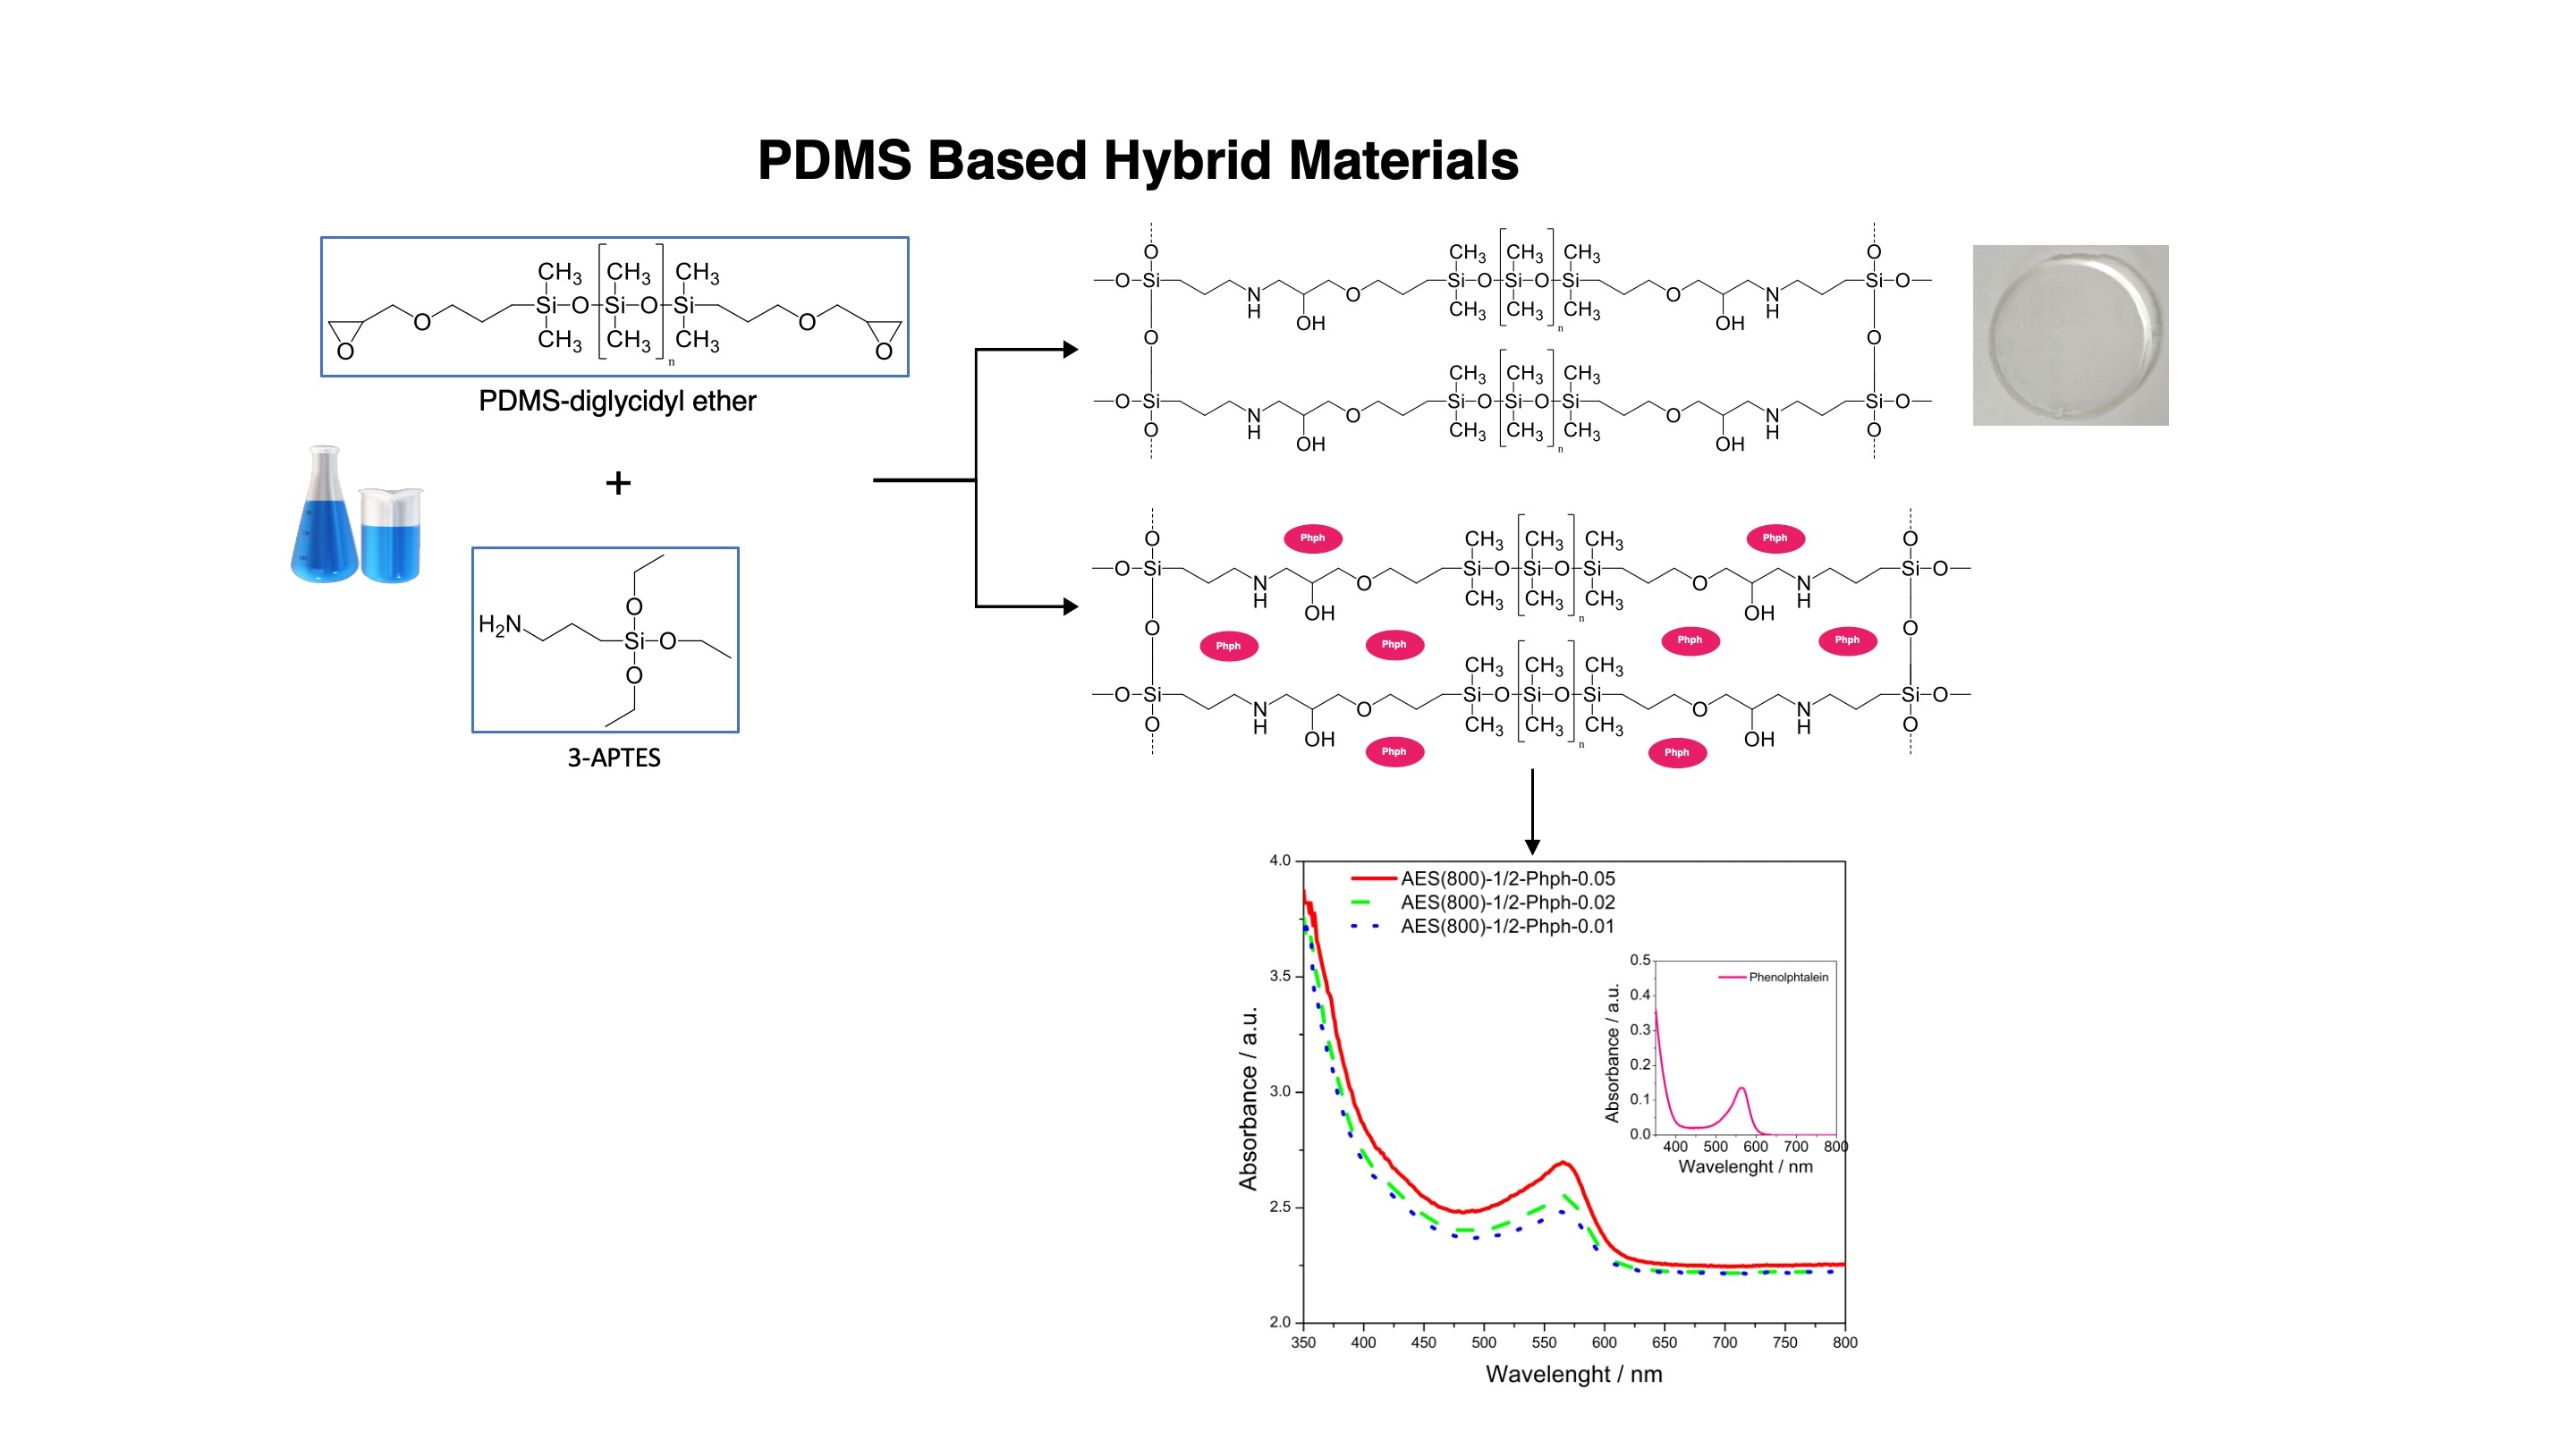
2.2. Synthesis of Organic-Inorganic Hybrid (OIH) Films

2.2.1. General Procedure

The first stage of the hybrid films’ synthesis consisted of the formation of a covalent bond between PDMS(800)-GET and 3-APTES (Table 1, Figure 1). Different ratios between the two precursors were used (1:2, 1:2.5 and 1:5 PDMS: 3-APTES). The two precursors were mixed in a glass container for 20 min. A 0.22 M citric acid ethanolic solution was added to set a ratio of 0.094 between citric acid and the corresponding amount of silane. The mixture was stirred for another 20 min and water was added to set a H2O/PDMS ratio of 29.7. The solution was stirred for more 20 min to obtain a homogeneous mixture and cast into a Teflon® mould. The Teflon® mould was sealed with parafilm® and placed in a universal oven (UNB 200, Memmert, Buechenbach, Germany) and kept at 40 °C for 15 days in order to ensure the curing of the films and evaporation of the remaining solvents. Films were identified as AES(800)-1/2, AES(800)-1/2.5 and AES(800)-1/5.

2.2.2. Phph Doped Films

PDMS(800)-GET (1 mmol) was stirred with a 0.1 M ethanolic solution of Phph, according to Table 1, for 20 min in a glass container; 3-APTES (2 mmol, 1/2 PDMS/3-APTES ratio) was added to the solution and the general procedure was followed. However, in this particular case water was not added into the solution. Films were identified as AES(800)-1/2-Phph-0.01, AES(800)-1/2-Phph-0.02 and AES(800)-1/2-Phph-0.05.

2.3. Characterization of the OIH Films

The OIH pure films were characterized by Fourier-transformed infrared (FTIR) spectroscopy, UV-Vis spectroscopy, electrochemical impedance spectroscopy (EIS) and thermogravimetric analysis (TGA). The three OIH films doped with Phph were only characterized by UV-Vis and EIS.

2.3.1. FTIR

FTIR spectra for AES(800)-1/2 were recorded in transmittance mode on a Bomem MB104 spectrometer, by averaging 20 scans at a maximum resolution of 4 cm−1. Spectra were obtained in 4000-700 cm−1 range on KBr pellets. For the analysis during synthesis, a 2 µL droplet of the solution was placed in the previously prepared 100 mg KBr pellet. Droplets were collected 20 min after both precursors were added, before hydrolysis and condensation of amino alcohol precursor. Liquid precursors KBr pellets followed the same preparation. For the final OIH films, KBr pellets were prepared with 0.1 mg of cured material and 200 mg of KBr.

2.3.2. UV–Vis Spectroscopy

UV–Vis spectra for both pure and doped OIH films were recorded in absorbance mode on a Shimadzu UV-2501 PC spectrophotometer. Spectra were obtained in the range of 200–800 nm for solid samples.

2.3.3. Electrochemical Impedance Spectroscopy (EIS)

EIS measurements were carried out on all the produced OIH disc materials at room temperature in a Faraday cage, using a potentiostat/galvanostat/ZRA (Reference 600+, Gamry Instruments, Warminster, PA, USA). EIS measurements were used to characterize resistance, electrical conductivity and electric permittivity of the prepared OIH disc materials. The capacitance of OIH films was also determined. Measurements were performed using a support cell as reported in previous studies [57]. The disc films were placed between two parallel Au electrodes (10 mm diameter and 250 μm thickness) using the mentioned support cell and the EIS measurements were conducted [57]. EIS studies were accomplished by applying a 10 mV (peak-to-peak, sinusoidal) electrical potential within a frequency range from 1 × 10⁶ Hz to 0.01 Hz (10 points per decade) at open circuit potential (OCP). The frequency response data of the studied electrochemical cells were displayed in a Nyquist plot, using Gamry ESA410 Data Acquisition software that was also used for data fitting purposes. For chemical stability studies in an alkaline environment, the OIH discs were immersed in a simulative concrete pore solution (SCPS) with a pH of 13.5. The SCPS was prepared, using deionized water at room temperature according to M. Sanchez et al. [58] and F. J. Recio et al. [59]. Generically, the SCPS was obtained by addition of 0.2 M KOH to a Ca(OH)2 saturated solution [58,59].

2.3.4. TGA

Thermal analysis was carried out on an SDT Q600 system for the three pure OIH materials. Samples were subjected to a temperature ramp of 10 °C/min between room temperature and 800 °C at a constant 40 mL/min nitrogen flux. For each analysis, 15 mg of each OIH material was placed into an alumina pan.

3. Results and Discussion

3.1. FTIR Analysis

FTIR analysis was carried out for AES(800)-1/2 and is shown in Figure 2. Spectra of both precursors ((a) and (b)), from a sample during synthesis after 20 min of precursors addition (e.g., before hydrolysis and condensation of amino alcohol precursor) (c) and the final OIH material (d) are depicted.
PDMS(800)-GET spectrum (a) from Figure 2 shows a weak band at 3050 cm−1, corresponding to the epoxy terminal group [60]. Bands between 2960 and 2870 cm−1 may be ascribed to C-CH2 asymmetric and symmetric stretching vibrations. A well-defined sharp peak at 1260 cm−1 belonging to C–Si bond symmetric bending is especially characteristic of dimethylsiloxane chains [61]. Broad bands at 1090 and 1020 cm−1 are related to Si–O–C and Si–O–Si bonds and the peak at 800 cm−1 corresponds to C–Si bond symmetric rocking vibration [61,62]. 3-APTES spectrum (b) from Figure 2. also shows the bands corresponding to C–CH2 asymmetric and symmetric stretching vibrations. Besides, a broad band between 3500–3300 cm−1 may be ascribed to N–H bond stretching vibrations of the terminal amine group involved in H-bonds. Peaks at 1100, 1080 and 955 cm−1 are characteristic of Si–O–CH2CH3 bonds of this precursor [61]. In the spectrum of the hybrid film during its synthesis (c) from Figure 2, the epoxy group peak present in PDMS spectra (3050 cm−1) disappeared, as expected, due to the reaction between this group and the amine group from the silane. The broad band between 3500–3300 cm−1 is also present, showing no difference between primary (3-APTES) and secondary (hybrid films) amines. The peak corresponding to C–Si symmetric bending (1260 cm−1) is still present, as well as the peaks between 2960 and 2870 cm−1 belonging to C–CH2 asymmetric and symmetric stretching vibrations and the peaks at 1090, 1020 and 800 cm−1, from the dimethylsiloxane chain. The Si–O–CH2CH3 characteristic peak (955 cm−1) is still present but on a minor scale. Final hybrid film spectrum Figure 2. (d) does not show this peak, due to the total hydrolysis of these alkoxy groups. A small peak at 1650 cm−1 appears, which may belong to the C–NH–C bond bending vibration, corresponding to the formed amino alcohol bond. The broad and intense band at about 3450 cm−1 can be related not only to the hydroxyl group formed in the film but also to water molecules that remained entrapped in the polymeric matrix.

3.2. UV–Vis Analysis

Optical absorption spectra for the three pure OIH samples are shown in Figure 3. Even though the samples are not transparent, absorbance in the range of 400–800 nm is constant, showing the films can be doped with a colorimetric chemosensor that absorbs in this range.
Phph, a well-known pH indicator, colourless below pH 8 and pink above pH 10, was immobilized in the sol-gel matrix. UV–Vis spectroscopy analysis was carried out to confirm the presence of the indicator in the matrix. The spectra for AES based Phph doped films are shown in Figure 4. The absorption spectrum of the basic form of Phph in ethanol is also shown as inset. The three spectra show a peak around 566 nm, corresponding to the basic form of Phph, confirming its presence within the OIH material. Since the Phph peak in ethanol and within the matrix share the same wavelength, it can be assumed that the molecule does not change the electron distribution profile that is involved in the radiation absorption.
The results show (Table 2) that the absorption coefficients for Phph on the three doped films are of the same magnitude order. That result was expected, since the matrix has a similar composition. Distinctively from the ethanol solution, the molecule entrapped within a rigid matrix contributes to molecule–matrix interaction, reducing the efficiency of the radiation absorption.

3.3. EIS Analysis

EIS is a technique widely used for materials characterization. EIS allows one to obtain the dielectric properties of the OIH films and can be extremely helpful on optimizing the OIH materials in the synthesis procedure. Considering the information that can be extracted (e.g., capacitance, resistivity, dielectric permittivity, etc.) from EIS measurements, it is possible to follow the degradation of the OIH materials by quantifying the changes in the dielectric properties [63,64]. When EIS is performed on high performance materials, the Nyquist plots show a typical capacitive response over a wide range of frequencies. In the high-frequency region of the Nyquist plots, the dielectric properties of the material can be extracted. In this work, the EIS was used to characterize the dielectric properties (e.g., conductivity, capacitance and electric permittivity), which can be linked to the degradation properties of the material. Therefore, these studies allow one to assess the potential of the OIH matrices to be used in contact with a high alkaline environment (fresh concrete). Figure 5, Figure 6 and Figure 7 show the Nyquist plots of the pure OIH materials identified according to Table 1. Figure 8 shows the Nyquist plots of the OIH materials doped with Phph, which were also identified according to Table 1. The fitting results are also displayed in all the Nyquist plots. The equivalent electrical circuit (EEC) to describe the impedance spectra response was also included in each figure.
Figure 5, Figure 6 and Figure 7 show that at higher frequencies both Nyquist plots describe a semicircle, with the exception of the AES(800)-1/2.5 sample (Figure 6), which intersects the x-axis; none of the other samples displayed this behaviour. The amplitudes of the different samples change with their composition, and the undoped samples show the higher impedance magnitudes. The AES(800)-1/2 sample (Figure 5) showed the highest magnitude, and was followed by the AES(800)-1/2.5 (Figure 6). Sample AES(800)-1/5 showed the lowest magnitude. These differences are assigned to the dielectric properties of the OIH materials (e.g., resistivity and capacitance). The data obtained at lower frequencies describes a line in AES(800)-1/5 (Figure 5). The same behaviour was found in all OIH materials doped with Phph. This suggests that another electrochemical process, which is attributed to the Au|OIH material interface, is taking place. This part of the Nyquist plot describes a simple parallel resistance and capacitor EEC; however, the fitting was disregarded, since it is not relevant for the comprehension of the dielectric properties of the OIH materials. The analysis of EIS data was based on the represented EEC. Constant phase elements (CPE) were used instead of pure capacitance, since the results obtained (Figure 5, Figure 6, Figure 7 and Figure 8) do not show ideal behaviour. The impedance of a CPE can be defined as [65]:
ZCPE = 1/[Q(jω)α].
When α = 1, Q represents the capacity, and if α ≠ 1, the system shows a behaviour that is linked to the surface heterogeneity. If the system shows this second behaviour instead of an ideal capacitor, the impedance for the EEC is determined by [66]:
ZCPE = RSample/[1 + (jω)αQRSample],
where RSample is the resistance in parallel with the CPE. The CPE parameter Q cannot be considered as the interfacial capacitance (Ceff). Ceff is determined by [66,67]:
Ceff = [QRsample(1−α)]1/α.
The EEC used to fit the Nyquist plots obtained for all samples contains two CPEs (CPE1 and CPE2) and two resistances (R1 and R2) which are related to the resistance of the OIH material. The observation of the Nyquist plots (Figure 5, Figure 6, Figure 7 and Figure 8) shows, at higher frequencies, two partially overlapping semicircles with different radii. This behaviour may be identified as two time-dependent charge relaxation processes with two different time-constants (CPE1 and CPE2). The systems show a frequency dispersion linked to the relaxation phenomena that may be explained by the presence of residual solvent incorporated within the OIH matrix. The elements R1 and R2 depict the sample’s (bulk) resistance of these two distinct dielectric media and according to this EEC, the sample’s bulk resistance is the sum of R1 and R2. Three measurements were performed for each sample. However, only representative values together with the respective fitting parameters and the percentage of error associated with each element parameter are shown in Table 2.
Table 3 shows that all the resistances are within the range of 107–1011 Ω cm2. This suggests that the studied OIH materials display suitable resistance values which may imply that the synthesized materials can endeavour the harsh conditions of the fresh concrete [68]. The electrical resistance of the OIH AES(800)-1/2 is the highest, and the resistance of the OIH AES(800)-1/5 is the lowest (Table 2). This is in accordance with the literature [7,68], since the higher the ratio between the organic and inorganic amounts of precursors, the lowest the resistance. Table 2 also shows that the OIH materials doped with Phph are of the same magnitude order (109). Moreover, the samples AES(800)-1/2-Phph-0.01 and AES-1/2Phph-0.02 have equal electrical resistance values. This behaviour is expected, since the ratio between PDMS and 3-APTES is the same for the OIH materials doped with Phph.
To assess the chemical stability and resistance of the pure OIH materials, these were immersed in SCPS, which was prepared as described in Section 2.3.3. This solution was used since it is generally accepted as the most representative of concrete pore solution [58,59], because it simulates the alkalinity and the high alkali content of the pore solution existent in the concrete structures. The EIS measurements of the OIH films in contact with SCPS were conducted after 30 min, 4 h and 24 h of immersion. The Bode plots obtained are shown in Figure 9, Figure 10 and Figure 11.
High impedance modulus |Z| at low-frequency (LF) ranges indicate the level of porosity and defects present in the OIH films [69]. Generally, for all OIH samples, as the immersion time increases the impedance modulus decreases. For OIH samples AES(800)-1/2, Figure 9 shows that this value decreases as the immersion time in SCPS increases. The highest decrease (about two magnitude orders when compared to samples immersed for 30 min) was found after 4 h of immersion. After 24 h, the decrease is lower than one order of magnitude when compared to samples after 4 h of immersion. For OHI samples AES(800)-1/2.5 (Figure 10) the bode plots are similar after 4 h and 24 h, but decreased about one order of magnitude when compared to samples immersed for 30 min. For AES(800)-1/5 samples, shown in Figure 11, there is a clear decrease after 4 h of immersion. However, after 24 h of immersion, the impedance shows a similar behaviour when compared to samples immersed for 30 min. This may be explained by the lower ratio between the organic and inorganic amounts of precursors.
Generally, the results show that the dielectric properties of the OIH materials change during the immersion in SCPS (pH > 12.5). Nevertheless, the |Z| values are within the range of 106–109. This behaviour suggests that the OIH materials synthesized show suitable properties to be embedded in fresh concrete. Furthermore, according to previous studies [68] materials with similar values were able to resist to the high pH of mortars.

3.4. TGA Analysis

Figure 12 shows that the highest degradation processes of the OIH materials occurred in the range between 400 and 600 °C, which is according to the literature [70,71,72,73]. Higher weight loss is shown for the sample with a smaller 3-APTES/PDMS ratio. These degradation processes are due to the depolymerization of the matrices and cleavage of Si–C bonds. The sample with the higher 3-APTES/PDMS ratio (AES(800)-1/5) has a smaller percentage of weight loss due to depolymerization. This may be explained by the decrease in the ratio between the organic and inorganic amounts of precursors. Table 3 shows the 5% weight loss temperature (T5) and the temperature of the maximum rate of weight loss (Tmax). It is shown that the higher the stoichiometric molar ratio between 3-ATPES and PDMS, the lower is the T5 due to the higher volatile content. Tmax (Table 4) does not show a clear association with this ratio. However, the maximum rate of weight loss is higher for smaller ratios between organic and inorganic amounts of precursors.
The TGA/DTGA data show that the main degradation processes occurred at temperatures above 350 °C; therefore, these OIH materials are suitable to apply in fresh concrete, since the maximum values achieved during the concrete curing process reach temperatures around 70 °C [74].

4. Conclusions

New OIH sol-gel materials based on PDMS(800)-GET and 3-APTES, with different ratios, were synthesized and were characterized by FTIR, UV–Vis spectroscopy, EIS and TGA. Phph-doped OIH films were also synthesized. FTIR spectroscopy showed that the synthesis of the precursor by the reaction between PDMS(800)-GET and 3-APTES was successful by the disappearance of the PDMS-characteristic epoxy group band, as were the hydrolysis and condensation of this precursor, as shown by the disappearance of alkoxy group’s band. The presence of the indicator on the doped films was confirmed by UV–Vis spectroscopy.
Dielectric and thermal properties of the materials show that these materials resist high alkaline environments (SCPS, pH > 12.5). The impedance values allow one to conclude that for the OIH films, after immersion in SCPS, they do not decrease significantly. TGA data show that the produced OIH materials are stable enough to be used in fresh concrete, since the thermal degradation only occurs for values above the curing process of concrete (70 °C). The results indicate that these materials have potential to be used as sensing material and functionalize OFS to assess the pH of concrete. However, further studies must be conducted on functionalized OFS in SCPS in order to validate the potentiality of these OIH materials on OFS.

Author Contributions

Conceptualization, R.B.F., C.J.R.S. and R.P.C.L.S.; formal analysis, R.P.C.L.S., R.B.F, C.J.R.S. and S.P.G.C.; funding acquisition, R.B.F and C.J.R.S.; investigation, R.B.F., R.P.C.L.S. and B.F.; methodology, R.B.F and C.J.R.S.; writing—original draft preparation, R.P.C.L.S. and R.B.F.; writing—review and editing, R.B.F., M.A., S.P.G.C. and C.J.R.S.; project administration, R.B.F. and C.J.R.S; resources, C.J.R.S., R.B.F. and M.A.; supervision, R.B.F. and C.J.R.S. All authors have read and agreed to the published version of the manuscript.

Funding

This research was funded by the Program Budget COMPETE—Operational Program Competitiveness and Internationalization—COMPETE 2020, and the Lisbon Regional Operational Program (its FEDER component), and by the budget of FCT Foundation for Science and Technology, I.P, grant number POCI-01-0145-FEDER-031220.

Acknowledgments

The authors acknowledge the support of Centro de Química, CQUM, which is financed by national funds through the FCT Foundation for Science and Technology, I.P. under the project UID/QUI/00686/2016.

Conflicts of Interest

The authors declare no conflict of interest. The funders had no role in the design of the study; in the collection, analyses, or interpretation of data; in the writing of the manuscript, or in the decision to publish the results.

References

  1. Schmidt, H. New Type of Non-Crystalline Solids between Inorganic and Organic Materials. J. Non Cryst. Solids 1985, 73, 681–691. [Google Scholar] [CrossRef] [Green Version]
  2. Mackenzie, J.D. Structures and Properties of Ormosils. J. Sol Gel Sci. Technol. 1994, 2, 81–86. [Google Scholar] [CrossRef]
  3. Figueira, R. Multifunctional and Smart Organic-Inorganic Hybrid Sol-Gel Coatings for Corrosion Protection Application. In Advances in Smart Coatings And Thin Films for Future Industrial and Biomedical Engineering Applications; Elsevier: Amsterdam, The Netherlands, 2019. [Google Scholar]
  4. Figueira, R.B.; Fontinha, I.R.; Silva, C.J.R.; Pereira, E.V. Hybrid Sol-Gel Coatings: Smart and Green Materials for Corrosion Mitigation. Coatings 2016, 6, 12. [Google Scholar] [CrossRef] [Green Version]
  5. Figueira, R.B.; Silva, C.J.R. Application of Sol–Gel Method to Synthesize Organic–Inorganic Hybrid Coatings to Minimize Corrosion in Metallic Substrates. In Hybrid Organic-Inorganic Interfaces; John Wiley & Sons, Ltd.: New York, NY, USA, 2017; pp. 355–412. [Google Scholar] [CrossRef]
  6. Figueira, R.B.; Silva, C.J.R.; Pereira, E.V. Organic–Inorganic Hybrid Sol–Gel Coatings for Metal Corrosion Protection: A Review of Recent Progress. J. Coat. Technol. Res. 2015, 12, 1–35. [Google Scholar] [CrossRef]
  7. Figueira, R.B.; Silva, C.J.R.; Pereira, E.V. Hybrid Sol–Gel Coatings for Corrosion Protection of Galvanized Steel in Simulated Concrete Pore Solution. J. Coat. Technol. Res. 2016, 13, 355–373. [Google Scholar] [CrossRef]
  8. Boaretto, N.; Bittner, A.; Brinkmann, C.; Olsowski, B.-E.; Schulz, J.; Seyfried, M.; Vezzù, K.; Popall, M.; Di Noto, V. Highly Conducting 3D-Hybrid Polymer Electrolytes for Lithium Batteries Based on Siloxane Networks and Cross-Linked Organic Polar Interphases. Chem. Mater. 2014, 26, 6339–6350. [Google Scholar] [CrossRef]
  9. Mujahid, A.; Lieberzeit, P.A.; Dickert, F.L. Chemical Sensors Based on Molecularly Imprinted Sol-Gel Materials. Materials 2010, 3, 2196–2217. [Google Scholar] [CrossRef] [Green Version]
  10. Wright, J.; Sommerdijk, N.A.J.M. Sol-Gel Materials: Chemistry and Applications, 1st ed.; Gordon and Breach: London, UK, 2001. [Google Scholar]
  11. Ianculescu, A.C.; Vasilescu, C.A.; Crisan, M.; Raileanu, M.; Vasile, B.S.; Calugaru, M.; Crisan, D.; Dragan, N.; Curecheriu, L.; Mitoseriu, L. Formation Mechanism and Characteristics of Lanthanum-Doped BaTiO3 Powders and Ceramics Prepared by the Sol–Gel Process. Mater. Charact. 2015, 106, 195–207. [Google Scholar] [CrossRef]
  12. Kumar, P.; Yadav, A.K.; Joshi, A.G.; Bhattacharyya, D.; Jha, S.N.; Pandey, P.C. Influence of Li Co-Doping on Structural Property of Sol-Gel Derived Terbium Doped Zinc Oxide Nanoparticles. Mater. Charact. 2018, 142, 593–601. [Google Scholar] [CrossRef]
  13. Brinker, C.J.; Scherer, G.W. Sol-Gel Science: The Physics and Chemistry of Sol-Gel Processing; Elsevier: Amsterdam, The Netherlands, 1990. [Google Scholar]
  14. Hench, L.L.; West, J.K. The Sol-Gel Process. Chem. Rev. 1990, 90, 33–72. [Google Scholar] [CrossRef]
  15. Livage, J. Basic Principles of Sol-Gel Chemistry. In Sol-Gel Technologies for Glass Producers and Users; Aegerter, M., Mennig, M., Eds.; Springer: New York, NY, USA, 2004. [Google Scholar]
  16. Sakka, S.; Kozuka, H. Sol-Gel Processing. In Handbook of Sol-Gel Science and Technology; Springer Science & Business Media: Berlin, Germany, 2005. [Google Scholar]
  17. Su, H.-Y.; Chen, P.-L.; Lin, C.-S. Sol–Gel Coatings Doped with Organosilane and Cerium to Improve the Properties of Hot-Dip Galvanized Steel. Corros. Sci. 2016, 102, 63–71. [Google Scholar] [CrossRef]
  18. Tatsumisago, M.; Honjo, H.; Sakai, Y.; Minami, T. Proton-Conducting Silica-Gel Films Doped with a Variety of Electrolytes. Solid State Ion. 1994, 74, 105–108. [Google Scholar] [CrossRef]
  19. Owens, G.J.; Singh, R.K.; Foroutan, F.; Alqaysi, M.; Han, C.-M.; Mahapatra, C.; Kim, H.-W.; Knowles, J.C. Sol–Gel Based Materials for Biomedical Applications. Prog. Mater. Sci. 2016, 77, 1–79. [Google Scholar] [CrossRef] [Green Version]
  20. Nedeljko, P.; Turel, M.; Lobnik, A. Hybrid Sol-Gel Based Sensor Layers for Optical Determination of Biogenic Amines. Sens. Actuators B Chem. 2017, 246, 1066–1073. [Google Scholar] [CrossRef]
  21. Choodum, A.; Kanatharana, P.; Wongniramaikul, W.; NicDaeid, N. A Sol–Gel Colorimetric Sensor for Methamphetamine Detection. Sens. Actuators B Chem. 2015, 215, 553–560. [Google Scholar] [CrossRef]
  22. Hashem, S.G.; Elsaady, M.M.; Afify, H.G.; Omer, W.E.; Youssef, A.O.; El-Kemary, M.; Attia, M.S. Determination of Uric Acid in Serum Using an Optical Sensor Based on Binuclear Pd(II) 2-Pyrazinecarboxamide-Bipyridine Doped in a Sol Gel Matrix. Talanta 2019, 199, 89–96. [Google Scholar] [CrossRef]
  23. Wang, B.; Anslyn, E.V. Chemosensors: Principles, Strategies, and Applications; John Wiley & Sons, Ltd.: New York, NY, USA, 2011. [Google Scholar] [CrossRef]
  24. Jerónimo, P.C.A.; Araújo, A.N.; Conceição, B.S.M.; Montenegro, M. Optical Sensors and Biosensors Based on Sol–Gel Films. Talanta 2007, 72, 13–27. [Google Scholar] [CrossRef]
  25. Nivens, D.A.; Zhang, Y.; Angel, S.M. A Fiber-Optic PH Sensor Prepared Using a Base-Catalyzed Organo-Silica Sol–Gel. Anal. Chim. Acta 1998, 376, 235–245. [Google Scholar] [CrossRef]
  26. Nivens, D.A.; Schiza, M.V.; Angel, S.M. Multilayer Sol–Gel Membranes for Optical Sensing Applications: Single Layer PH and Dual Layer CO2 and NH3 Sensors. Talanta 2002, 58, 543–550. [Google Scholar] [CrossRef]
  27. Riehle, N.; Thude, S.; Götz, T.; Kandelbauer, A.; Thanos, S.; Tovar, G.E.M.; Lorenz, G. Influence of PDMS Molecular Weight on Transparency and Mechanical Properties of Soft Polysiloxane-Urea-Elastomers for Intraocular Lens Application. Eur. Polym. J. 2018, 101, 190–201. [Google Scholar] [CrossRef]
  28. Zhao, W.; Yang, J.; Guo, H.; Xu, T.; Li, Q.; Wen, C.; Sui, X.; Lin, C.; Zhang, J.; Zhang, L. Slime-Resistant Marine Anti-Biofouling Coating with PVP-Based Copolymer in PDMS Matrix. Chem. Eng. Sci. 2019, 207, 790–798. [Google Scholar] [CrossRef]
  29. Romo-Uribe, A.; Santiago-Santiago, K.; Reyes-Mayer, A.; Aguilar-Franco, M. Functional PDMS Enhanced Strain at Fracture and Toughness of DGEBA Epoxy Resin. Eur. Polym. J. 2017, 89, 101–118. [Google Scholar] [CrossRef]
  30. Eduok, U.; Faye, O.; Szpunar, J. Recent Developments and Applications of Protective Silicone Coatings: A Review of PDMS Functional Materials. Prog. Org. Coat. 2017, 111, 124–163. [Google Scholar] [CrossRef]
  31. Zhu, D.; Handschuh-Wang, S.; Zhou, X. Recent Progress in Fabrication and Application of Polydimethylsiloxane Sponges. J. Mater. Chem. A 2017, 5, 16467–16497. [Google Scholar] [CrossRef]
  32. Fujii, T. PDMS-Based Microfluidic Devices for Biomedical Applications. Microelectron. Eng. 2002, 61–62, 907–914. [Google Scholar] [CrossRef]
  33. Tamayo, A.; Téllez, L.; Rubio, J.; Rubio, F.; Oteo, J.L. Effect of Reaction Conditions on Surface Properties of TEOS–TBOT–PDMS Hybrid Materials. J. Sol Gel Sci. Technol. 2010, 55, 94–104. [Google Scholar] [CrossRef]
  34. Xu, F.; Li, D. Effect of the Addition of Hydroxyl-Terminated Polydimethylsiloxane to TEOS-Based Stone Protective Materials. J. Sol Gel Sci. Technol. 2013, 65, 212–219. [Google Scholar] [CrossRef]
  35. Dirè, S. Sol-Gel Derived Polysiloxane-Oxide Hybrid Materials: Extent of Phase Interaction. J. Sol Gel Sci. Technol. 2003, 26, 285–290. [Google Scholar] [CrossRef]
  36. Wolf, M.P.; Salieb-Beugelaar, G.B.; Hunziker, P. PDMS with Designer Functionalities—Properties, Modifications Strategies, and Applications. Prog. Polym. Sci. 2018, 83, 97–134. [Google Scholar] [CrossRef]
  37. Gao, H.; Hu, H.; Zhao, Y.; Li, J.; Lei, M.; Zhang, Y. Highly-Sensitive Optical Fiber Temperature Sensors Based on PDMS/Silica Hybrid Fiber Structures. Sens. Actuators Phys. 2018, 284, 22–27. [Google Scholar] [CrossRef]
  38. Wang, D.; Sheng, B.; Peng, L.; Huang, Y.; Ni, Z. Flexible and Optical Fiber Sensors Composited by Graphene and PDMS for Motion Detection. Polymers 2019, 11. [Google Scholar] [CrossRef] [PubMed] [Green Version]
  39. Taheri, S. A Review on Five Key Sensors for Monitoring of Concrete Structures. Constr. Build. Mater. 2019, 204, 492–509. [Google Scholar] [CrossRef]
  40. Figueira, R.B.; Sousa, R.; Coelho, L.; Azenha, M.; de Almeida, J.M.; Jorge, P.A.S.; Silva, C.J.R. Alkali-Silica Reaction in Concrete: Mechanisms, Mitigation and Test Methods. Constr. Build. Mater. 2019, 222, 903–931. [Google Scholar] [CrossRef]
  41. Winter, N.B. Understanding Cement: An Introduction to Cement Production, Cement Hydration and Deleterious Processes in Concrete; Microanalysis Consultants: St. Ives, UK, 2012. [Google Scholar]
  42. Parrott, L.J. A Review of Carbonation in Reinforced Concrete: A Review Carried out by C & CA under a BRE Contract; Cement and Concrete Association: Wexham Springs: Liverpool, UK, 1987. [Google Scholar]
  43. Behnood, A.; Van Tittelboom, K.; De Belie, N. Methods for Measuring PH in Concrete: A Review. Constr. Build. Mater. 2016, 105, 176–188. [Google Scholar] [CrossRef]
  44. Figueira, R.B. Electrochemical Sensors for Monitoring the Corrosion Conditions of Reinforced Concrete Structures: A Review. Appl. Sci. 2017, 7, 1157. [Google Scholar] [CrossRef] [Green Version]
  45. Plusquellec, G.; Geiker, M.R.; Lindgård, J.; Duchesne, J.; Fournier, B.; De Weerdt, K. Determination of the PH and the Free Alkali Metal Content in the Pore Solution of Concrete: Review and Experimental Comparison. Cem. Concr. Res. 2017, 96, 13–26. [Google Scholar] [CrossRef]
  46. Ferreira, M.; Castro-Camus, E.; Ottaway, D.; López-Higuera, J.; Feng, X.; Jin, W.; Jeong, Y.; Picqué, N.; Tong, L.; Reinhard, B.; et al. Roadmap on Optical Sensors. J. Opt. 2017, 19, 083001. [Google Scholar] [CrossRef]
  47. Leung, C.K.Y. Fiber Optic Sensors in Concrete: The Future? NDT E Int. 2001, 34, 85–94. [Google Scholar] [CrossRef]
  48. Dhouib, M.; Conciatori, D.; Sorelli, L. Optical Fiber Chloride Sensor for Health Monitoring of Structures in Cold Regions. Cold Reg. Eng. 2019, 391–397. [Google Scholar] [CrossRef]
  49. Basheer, P.A.M.; Grattan, K.; Sun, T.; Long, A.; Mcpolin, D.O.; Xie, W. Fiber Optic Chemical Sensor Systems for Monitoring PH Changes in Concrete. Proc. SPIE Int. Soc. Opt. Eng. 2004, 5586. [Google Scholar] [CrossRef]
  50. Mcpolin, D.O.; Basheer, P.A.M.; Grattan, K.; Long, A.; Sun, T.; Xie, W. Preliminary Development and Evaluation of Fibre Optic Chemical Sensors. J. Mater. Civ. Eng. 2011, 23, 1200–1210. [Google Scholar] [CrossRef]
  51. Sugama, T.; Brothers, L.E.; Weber, L. Acid-Resistant Polydimethylsiloxane Additive for Geothermal Well Cement in 150°C H2SO4 Solution. Adv. Cem. Res. 2003, 15, 35–44. [Google Scholar] [CrossRef]
  52. Sidek, O.; Afzal, M.H.B. A Review Paper on Fiber-Optic Sensors and Application of PDMS Materials for Enhanced Performance. In Proceedings of the 2011 IEEE Symposium on Business, Engineering and Industrial Applications (ISBEIA), Langkawi, Malaysia, 25–28 September 2011; pp. 458–463. [Google Scholar] [CrossRef]
  53. Sidek, O.; Kabir, S.; Afzal, M.H.B. Fiber Optic-Based Sensing Approach for Corrosion Detection. In Proceedings of the PIERS Proceedings, Suzhou, China, 12–16 September 2011. [Google Scholar]
  54. Park, C.; Han, Y.; Joo, K.-I.; Lee, Y.W.; Kang, S.-W.; Kim, H.-R. Optical Detection of Volatile Organic Compounds Using Selective Tensile Effects of a Polymer-Coated Fiber Bragg Grating. Opt. Express 2010, 18, 24753–24761. [Google Scholar] [CrossRef] [PubMed]
  55. Tan, C.H.; Shee, Y.G.; Yap, B.K.; Adikan, F.R.M. Fiber Bragg Grating Based Sensing System: Early Corrosion Detection for Structural Health Monitoring. Sens. Actuators Phys. 2016, 246, 123–128. [Google Scholar] [CrossRef]
  56. Choi, J.-I.; Lee, Y.; Kim, Y.Y.; Lee, B.Y. Image-Processing Technique to Detect Carbonation Regions of Concrete Sprayed with a Phenolphthalein Solution. Constr. Build. Mater. 2017, 154, 451–461. [Google Scholar] [CrossRef]
  57. Figueira, R.B.; Callone, E.; Silva, C.J.R.; Pereira, E.V.; Dirè, S. Hybrid Coatings Enriched with Tetraethoxysilane for Corrosion Mitigation of Hot-Dip Galvanized Steel in Chloride Contaminated Simulated Concrete Pore Solutions. Materials 2017, 10, 306. [Google Scholar] [CrossRef] [PubMed]
  58. Sánchez, M.; Alonso, M.C.; Cecílio, P.; Montemor, M.F.; Andrade, C. Electrochemical and Analytical Assessment of Galvanized Steel Reinforcement Pre-Treated with Ce and La Salts under Alkaline Media. Cem. Concr. Compos. 2006, 28, 256–266. [Google Scholar] [CrossRef]
  59. Recio, F.; Alonso, C.; Gaillet, L.; Sánchez Moreno, M. Hydrogen Embrittlement Risk of High Strength Galvanized Steel in Contact with Alkaline Media. Corros. Sci. 2011, 53, 2853–2860. [Google Scholar] [CrossRef] [Green Version]
  60. Sakka, S.; Almeida, R.M. Characterization and Properties of Sol-Gel Materials and Products. In Handbook of Sol-Gel Science and Technology; Springer Science & Business Media: Berlin, Germany, 2005. [Google Scholar]
  61. Arkles, B.; Larson, G. Silicon Compounds: Silanes & Silicones, 3rd ed.; Gelest Inc.: Morrisville, PA, USA, 2013. [Google Scholar]
  62. Cai, D.; Neyer, A.; Kuckuk, R.; Heise, H.M. Raman, Mid-Infrared, near-Infrared and Ultraviolet–Visible Spectroscopy of PDMS Silicone Rubber for Characterization of Polymer Optical Waveguide Materials. J. Mol. Struct. 2010, 976, 274–281. [Google Scholar] [CrossRef]
  63. Macdonald, J.R. Impedance Spectroscopy Emphasizing Solid Materials and Analysis; John Wiley and Sons, Ltd.: New York, NY, USA, 1987. [Google Scholar]
  64. Orazem, M.E.; Tribollet, B. Electrochemical Impedance Spectroscopy; John Wiley and Sons, Ltd.: New York, NY, USA, 2008. [Google Scholar]
  65. Barsoukov, E.; Macdonald, J.R. (Eds.) Impedance Spectroscopy: Theory, Experiment, and Applications, 3rd ed.; Wiley: Hoboken, NJ, USA, 2018. [Google Scholar]
  66. Orazem, M.E.; Tribollet, B. The Electrochemical Society Series. In Electrochemical Impedance Spectroscopy; John Wiley & Sons, Ltd.: New York, NY, USA, 2017; pp. I–III. [Google Scholar] [CrossRef]
  67. Jorcin, J.-B.; Orazem, M.E.; Pébère, N.; Tribollet, B. CPE Analysis by Local Electrochemical Impedance Spectroscopy. Electrochimica Acta 2006, 51, 1473–1479. [Google Scholar] [CrossRef]
  68. Figueira, R.B.; Silva, C.J.R.; Pereira, E.V.; Salta, M.M. Alcohol-Aminosilicate Hybrid Coatings for Corrosion Protection of Galvanized Steel in Mortar. J. Electrochem. Soc. 2014, 161, C349–C362. [Google Scholar] [CrossRef]
  69. Qian, M.; Mcintosh Soutar, A.; Tan, X.H.; Zeng, X.T.; Wijesinghe, S.L. Two-Part Epoxy-Siloxane Hybrid Corrosion Protection Coatings for Carbon Steel. Thin Solid Films 2009, 517, 5237–5242. [Google Scholar] [CrossRef]
  70. Moreira, S.D.F.C.; Silva, C.J.R.; Prado, L.A.S.A.; Costa, M.F.M.; Boev, V.I.; Martín-Sánchez, J.; Gomes, M.J.M. Development of New High Transparent Hybrid Organic–Inorganic Monoliths with Surface Engraved Diffraction Pattern. J. Polym. Sci. Part B Polym. Phys. 2012, 50, 492–499. [Google Scholar] [CrossRef]
  71. Thomas, T.H.; Kendrick, T.C. Thermal Analysis of Polydimethylsiloxanes. I. Thermal Degradation in Controlled Atmospheres. J. Polym. Sci. Part A 2 Polym. Phys. 1969, 7, 537–549. [Google Scholar] [CrossRef]
  72. Ručigaj, A.; Krajnc, M.; Sebenik, U. Kinetic Study of Thermal Degradation of Polydimethylsiloxane: The Effect of Molecular Weight on Thermal Stability in Inert Atmosphere. Polym. Sci. 2017, 3. [Google Scholar] [CrossRef] [Green Version]
  73. Gonzalez, J.; Iglio, R.; Barillaro, G.; Duce, C.; Tiné, M. Structural and Thermoanalytical Characterization of 3D Porous PDMS Foam Materials: The Effect of Impurities Derived from a Sugar Templating Process. Polymers 2018, 10, 616. [Google Scholar] [CrossRef] [Green Version]
  74. Taylor, H.F.W.; Famy, C.; Scrivener, K.L. Delayed Ettringite Formation. Cem. Concr. Res. 2001, 31, 683–693. [Google Scholar] [CrossRef]
Figure 1. Schematic of the main steps used in the synthesis of PDMS based OIH films.
Polymers 12 00371 g001
Figure 2. FTIR transmittance spectra of AES(800)-1/2. (a) PDMS(800)-GET; (b) 3-APTES; (c) AES(800)-1/2 during synthesis; (d) AES(800)-1/2 final hybrid (presented with a different scale, for higher definition purposes).
Polymers 12 00371 g002
Figure 3. Absorption spectra of pure hybrid samples.
Polymers 12 00371 g003
Figure 4. Absorption spectra of AES based FFT doped films. Inset: absorption spectrum of the basic form of Phph in ethanol.
Polymers 12 00371 g004
Figure 5. Nyquist plot for pure OIH AES(800)-1/2.
Polymers 12 00371 g005
Figure 6. Nyquist plot for pure OIH AES(800)-1/2.5.
Polymers 12 00371 g006
Figure 7. Nyquist plot for pure OIH AES(800)-1/5.
Polymers 12 00371 g007
Figure 8. Nyquist plot for Phph doped OIH AES(800)-1/2-Phph films.
Polymers 12 00371 g008
Figure 9. Bode plot for EIS analysis of AES(800)-1/2 after 30 min, 4 h and 24 h in SCPS.
Polymers 12 00371 g009
Figure 10. Bode plot for EIS analysis of AES(800)-1/2.5 after 30 min, 4 h and 24 h in SCPS.
Polymers 12 00371 g010
Figure 11. Bode plot for EIS analysis of AES(800)-1/5 after 30 min, 4 h and 24 h in SCPS.
Polymers 12 00371 g011
Figure 12. Experimental TGA and DTGA traces for AES(800)-1/2, AES(800)-1/2.5 and AES(800)-1/5 obtained at a heating rate of 10 °C/min.
Polymers 12 00371 g012
Table 1. Adopted codes for organic-inorganic hybrid (OIH) films.
OIH FilmsPDMS:APTES RatioPhph:PDMS Ratio
AES(800)-1/21:2-
AES(800)-1/2.51:2.5-
AES(800)-1/51:5-
AES(800)-1/2-Phph-0.011:21:100
AES(800)-1/2-Phph-0.021:21:50
AES(800)-1/2-Phph-0.051:21:20
Table 2. UV–Vis data values obtained from the doped OIH materials spectra (Figure 4).
PhphEthanolAES(800)-1/2-Phph-0.01AES(800)-1/2-Phph-0.02AES(800)-1/2-Phph-0.05
Absorbance (566 nm) *0.1360.4110.4820.627
[Phph]/mol g−11.27 × 10−78.05 × 10−61.48 × 10−52.62 × 10−5
Optical path/cm1.0001.131 **0.919 **1.017 **
Absorption coefficient/104 g mol−1 cm−1107.084.523.552.35
* For the OIH films, the absorbance of the corresponding OIH undoped (AES(800)-1/2) was subtracted. ** Thickness of the film.
Table 3. EEC data parameters values obtained by fitting the EIS response obtained for both doped and undoped films (Figure 5, Figure 6, Figure 7 and Figure 8).
SampleCPE1/Sα−1 cm−2α1R1/Ω cm2CPE2/Sα−1 cm−2α2R2/Ω cm2Rsample/Ω cm2χ2
AES(800)-1/29.27 × 10−120.9009.00 × 10108.12 × 10−120.9008.84 × 10101.78 × 10112.24 × 10−1
(1.54%)(0.25%)(0.01%)(2.75%)(0.51%)(2.20%)
AES(800)-1/2.56.45 × 10−120.975 1.47 × 1095.35 × 10−120.8819.16 × 1091.06 × 10104.81 × 10−3
(2.17%)(0.19%)(13.10%)(8.36%)(2.90%)(2.61%)
AES(800)-1/52.46 × 10−110.9102.10 × 1065.28 × 10−100.5753.81 × 1074.02 × 1073.58 × 10−4
(±13.19%)(±0.97%)(±9.90%)(±10.64%)(±2.57%)(±3.00%)
AES(800)-1/2-Phph-0.016.60 × 10−120.9613.17 × 1082.97 × 10−110.7481.94 × 1092.26 × 1092.61 × 10−3
(±2.73%)(±0.23%)(±7.96%)(±7.11%)(±2.56%)(±2.24%)
AES(800)-1/2-Phph-0.027.61 × 10−120.9641.94 × 1086.47 × 10−100.5972.07 × 1092.26 × 1091.88 × 10−3
(±3.26%)(±0.27%)(±15.50%)(±5.95%)(±3.01%)(±2.63%)
AES(800)-1/2-Phph-0.058.32 × 10−120.954 2.82 × 1085.99 × 10−110.7131.27 × 109 1.55 × 1091.31 × 10−3
(±2.61%)(±0.00%)(±7.40%)(±7.96%)(±3.34%)(±3.01%)
Table 4. Data collected from TGA and DTGA traces.
FilmsT5Tmax
AES(800)-1/2256438
AES(800)-1/2.5213442
AES(800)-1/5135431

