Tandem Mass-Remainder Analysis of Industrially Important Polyether Polyols


Abstract
:
1. Introduction
2. Materials and Methods
2.1. Chemicals
2.2. Electrospray Quadrupole Time-of-Flight Mass Spectrometry (ESI-QTOF MS)
3. Results and Discussion
4. Conclusions
Supplementary Materials
Author Contributions
Funding
Conflicts of Interest
References
- Ionescu, M. Chemistry and Technology of Polyols for Polyurethanes; Rapra Technology: Shrewsbury, UK, 2005. [Google Scholar]
- Engels, H.-W.; Pirkl, H.-G.; Albers, R.; Albach, R.W.; Krause, J.; Hoffmann, A.; Casselmann, H.; Dormish, J. Polyurethanes: Versatile Materials and Sustainable Problem Solvers for Today’s Challenges. Angew. Chem. Int. Ed. 2013, 52, 9422–9441. [Google Scholar] [CrossRef] [PubMed]
- Mkrtchyan, L.; Maier, M.; Huber, U. Structural polyurethane foam: Testing and modelling for automotive applications. Int. J. Crashworthiness 2008, 13, 523–532. [Google Scholar] [CrossRef]
- Boutar, Y.; Naïmi, S.; Mezlini, S.; Da Silva, L.F.M.; Ali, M.B.S. Characterization of aluminium one-component polyurethane adhesive joints as a function of bond thickness for the automotive industry: Fracture analysis and behavior. Eng. Fract. Mech. 2017, 177, 45–60. [Google Scholar] [CrossRef]
- D’Souza, J.; Camargo, R.; Yan, N. Biomass Liquefaction and Alkoxylation: A Review of Structural Characterization Methods for Bio-based Polyols. Polym. Rev. 2017, 57, 668–694. [Google Scholar] [CrossRef]
- Karas, M.; Hillenkamp, F. Laser desorption ionization of proteins with molecular masses exceeding 10,000 daltons. Anal. Chem. 1988, 60, 2299–2301. [Google Scholar] [CrossRef] [PubMed]
- Tanaka, K.; Waki, H.; Ido, Y.; Akita, S.; Yoshida, Y.; Yoshida, T.; Matsuo, T. Protein and polymer analyses up to m/z 100 000 by laser ionization time-of-flight mass spectrometry. Rapid Commun. Mass Spectrom. 1988, 2, 151–153. [Google Scholar] [CrossRef]
- Wong, S.F.; Meng, C.K.; Fenn, J.B. Multiple charging in electrospray ionization of poly(ethylene glycols). J. Phys. Chem. 1988, 92, 546–550. [Google Scholar] [CrossRef]
- Wesdemiotis, C.; Solak, N.; Polce, M.J.; Dabney, D.E.; Chaicharoen, K.; Katzenmeyer, B.C. Fragmentation pathways of polymer ions. Mass Spectrom. Rev. 2011, 30, 523–559. [Google Scholar] [CrossRef]
- Lattimer, R.P. Tandem mass spectrometry of lithium-attachment ions from polyglycols. J. Am. Soc. Mass Spectrom. 1992, 3, 225–234. [Google Scholar] [CrossRef] [Green Version]
- Lattimer, R.P. Tandem mass spectrometry of poly(ethylene glycol) lithium-attachment ions. J. Am. Soc. Mass Spectrom. 1994, 5, 1072–1080. [Google Scholar] [CrossRef] [Green Version]
- Selby, T.L.; Wesdemiotis, C.; Lattimer, R.P. Dissociation characteristics of [M + X]+ ions (X = H, Li, Na, K) from linear and cyclic polyglycols. J. Am. Soc. Mass Spectrom. 1994, 5, 1081–1092. [Google Scholar] [CrossRef] [Green Version]
- Chen, R.; Li, L. Lithium and transition metal ions enable low energy collision-induced dissociation of polyglycols in electrospray ionization mass spectrometry. J. Am. Soc. Mass Spectrom. 2001, 12, 832–839. [Google Scholar] [CrossRef] [Green Version]
- Girod, M.; Carissan, Y.; Humbel, S.; Charles, L. Tandem mass spectrometry of doubly charged poly(ethylene oxide) oligomers produced by electrospray ionization. Int. J. Mass Spectrom. 2008, 272, 1–11. [Google Scholar] [CrossRef]
- Okuno, S.; Kiuchi, M.; Arakawa, R. Structural Characterization of Polyethers Using Matrix-Assisted Laser Desorption/Ionization Quadrupole Ion Trap Time-of-Fight Mass Spectrometry. Eur. J. Mass Spectrom. 2006, 12, 181–187. [Google Scholar] [CrossRef] [PubMed]
- Jackson, A.T.; Green, M.R.; Bateman, R.H. Generation of end-group information from polyethers by matrix-assisted laser desorption/ionisation collision-induced dissociation mass spectrometry. Rapid Commun. Mass Spectrom. 2006, 20, 3542–3550. [Google Scholar] [CrossRef] [PubMed]
- Thalassinos, K.; Jackson, A.T.; Williams, J.P.; Hilton, G.R.; Slade, S.E.; Scrivens, J.H. Novel software for the assignment of peaks from tandem mass spectrometry spectra of synthetic polymers. J. Am. Soc. Mass Spectrom. 2007, 18, 1324–1331. [Google Scholar] [CrossRef] [Green Version]
- Memboeuf, A.; Nasioudis, A.; Indelicato, S.; Pollreisz, F.; Kuki, A.; KékiS, S.; van den Brink, O.F.; Vékey, K.; Drahos,, L. Size Effect on Fragmentation in Tandem Mass Spectrometry. Anal. Chem. 2010, 82, 2294–2302. [Google Scholar] [CrossRef]
- Fouquet, T.; Satoh, T.; Sato, H. First Gut Instincts Are Always Right: The Resolution Required for a Mass Defect Analysis of Polymer Ions Can Be as Low as Oligomeric. Anal. Chem. 2018, 90, 2404–2408. [Google Scholar] [CrossRef] [Green Version]
- Fouquet, T.N.J. The Kendrick analysis for polymer mass spectrometry. J. Mass Spectrom. 2019, 54, 933–947. [Google Scholar] [CrossRef]
- Kuki, Á.; Nagy, L.; Nagy, T.; Zsuga, M.; Kéki, S. Arm-length distribution in four-arm star-propoxylated ethylenediamine polyol by tandem mass spectrometry. J. Mass Spectrom. 2013, 48, 1125–1127. [Google Scholar] [CrossRef]
- Shemirani, G.; Kuki, Á.; Nagy, L.; Nagy, T.; Zsuga, M.; Kéki, S. Electrospray ionization tandem mass spectrometry of the star-shaped propoxylated diethylenetriamine polyols. J. Mass Spectrom. 2015, 50, 914–917. [Google Scholar] [CrossRef] [PubMed]
- Nagy, T.; Kuki, Á.; Zsuga, M.; Kéki, S. Mass-Remainder Analysis (MARA): A New Data Mining Tool for Copolymer Characterization. Anal. Chem. 2018, 90, 3892–3897. [Google Scholar] [CrossRef] [PubMed]
- Nagy, T.; Kuki, Á.; Nagy, M.; Zsuga, M.; Kéki, S. Mass-Remainder Analysis (MARA): An Improved Method for Elemental Composition Assignment in Petroleomics. Anal. Chem. 2019, 91, 6479–6486. [Google Scholar] [CrossRef] [PubMed]
- Nagy, T.; Kuki, Á.; Hashimov, M.; Zsuga, M.; Kéki, S. Multistep Mass-Remainder Analysis and its Application in Copolymer Blends. Macromolecules 2020, 53, 1199–1204. [Google Scholar] [CrossRef]
- Kuki, Á.; Nagy, T.; Hashimov, M.; File, S.; Nagy, M.; Zsuga, M.; Kéki, S. Mass Spectrometric Characterization of Epoxidized Vegetable Oils. Polymers 2019, 11, 394. [Google Scholar] [CrossRef] [Green Version]
- Derwa, F.; De Pauw, E.; Natalis, P. New basis for a method for the estimation fo seconary ion internal energy distribution in ‘soft’ ionization techniques. J. Mass Spectrom. 1991, 26, 117–118. [Google Scholar] [CrossRef]


| No. | Type | Structure | Elemental Composition | Monoisotopic Mass (Da) |
|---|---|---|---|---|
| 1 | Diol | H2O(C2H4O)9(C3H6O)3 | C27H56O13 | 588.3721 |
| 2 | Triol | C3H8O3(C2H4O)6(C3H6O)4 | C27H56O13 | 588.3721 |
| 3 | Tetraol | C5H12O4(C2H4O)5(C3H6O)4 | C27H56O13 | 588.3721 |
| 4 | Hexaol | C6H14O6(C2H4O)0(C3H6O)7 | C27H56O13 | 588.3721 |
| 5 | Tetraol | (NH2)2C2H4(C2H4O)12(C3H6O)0 | C26H56N2O12 | 588.3833 |
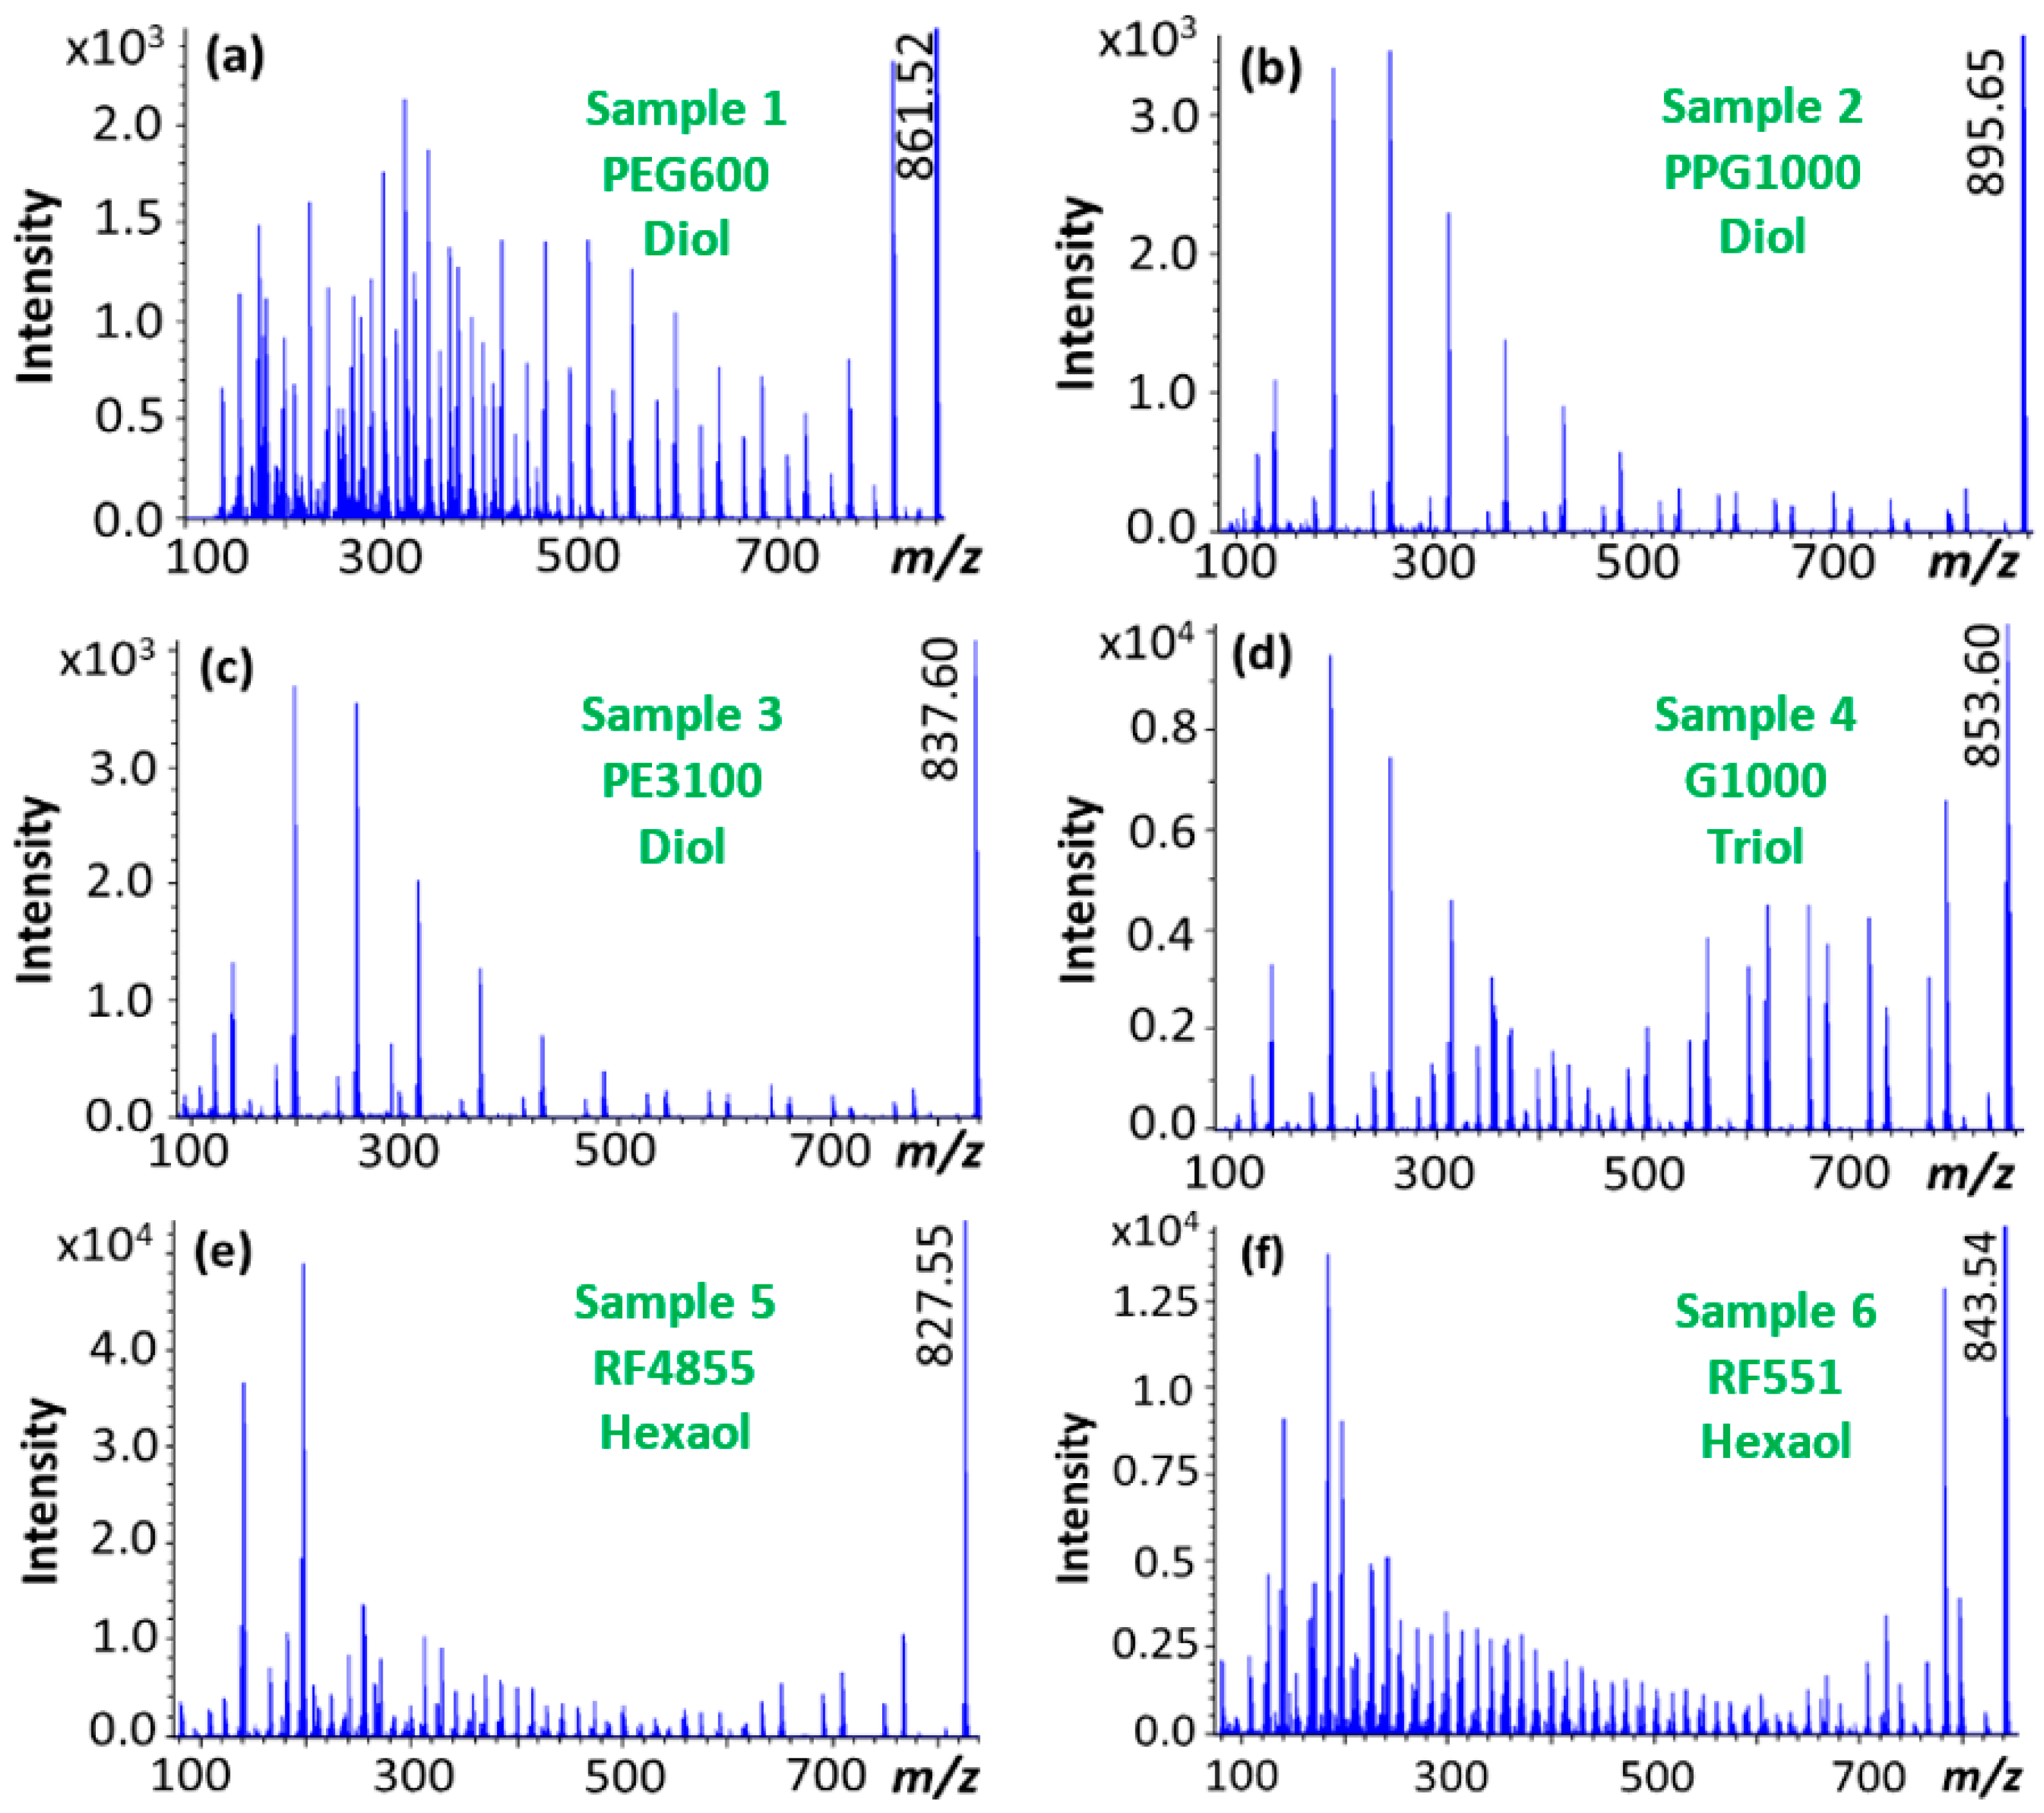
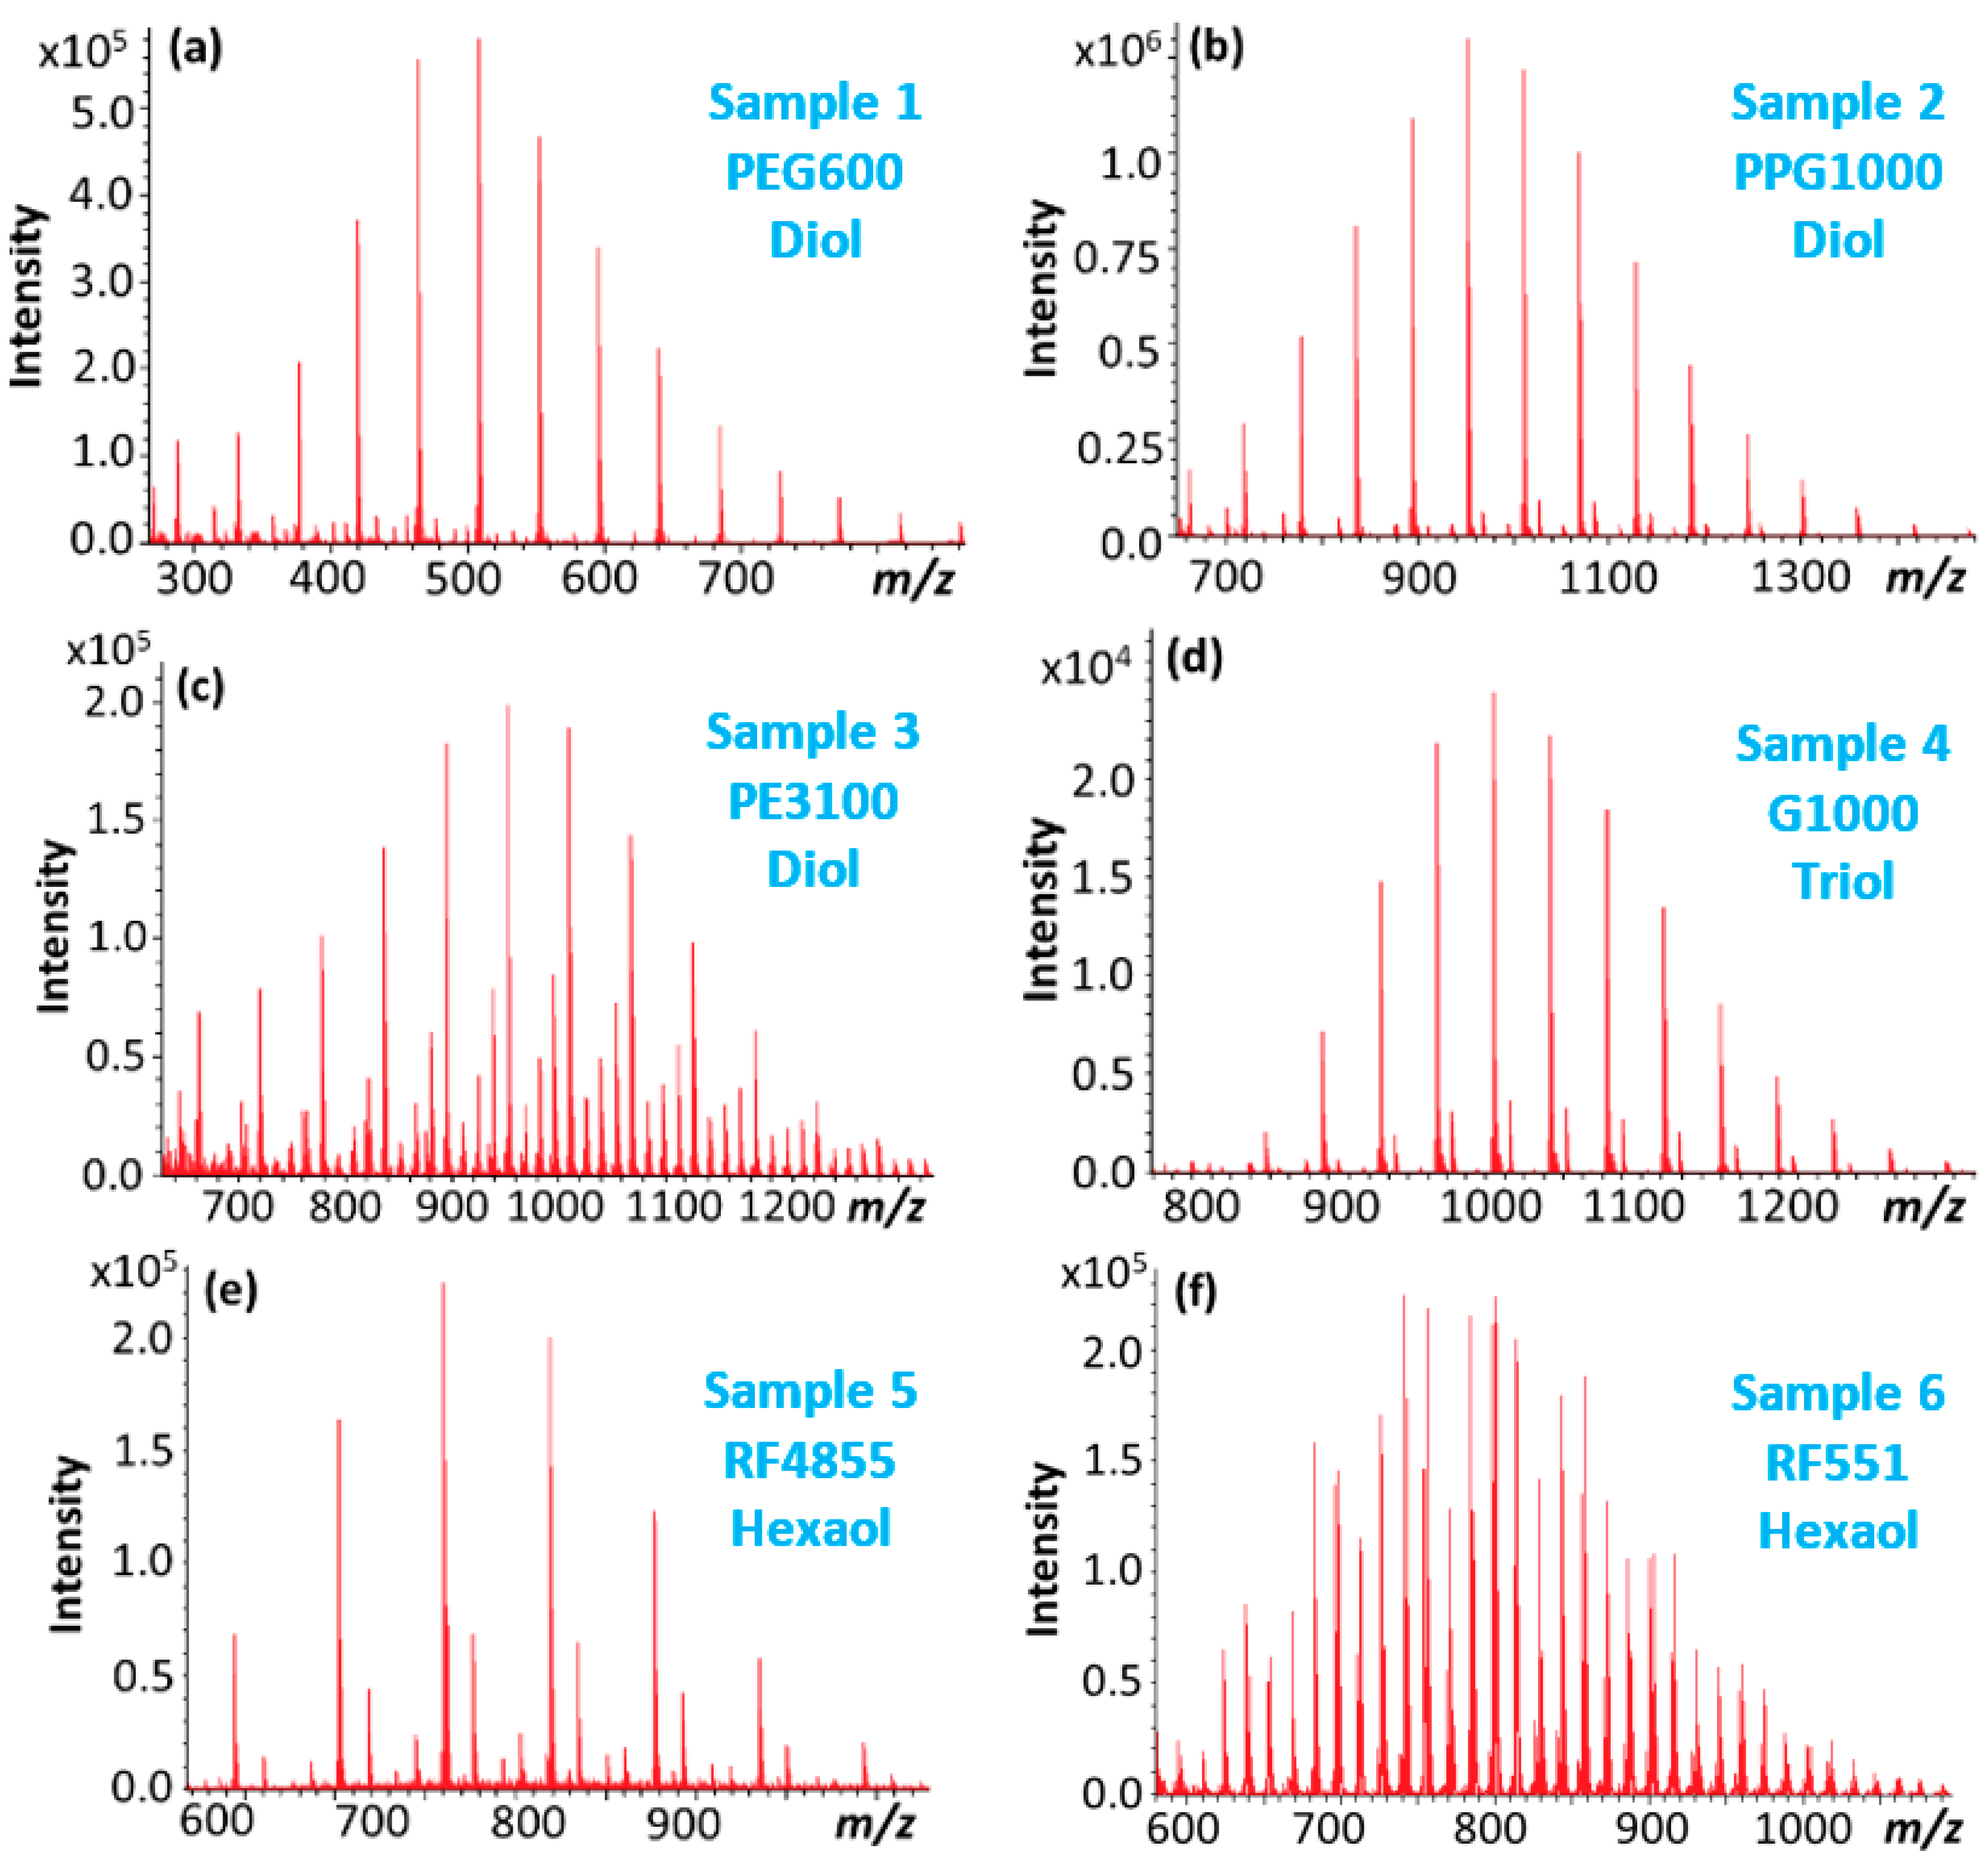
| Name | Composition | Base | Structure | Mn (MS) (g/mol) | |
|---|---|---|---|---|---|
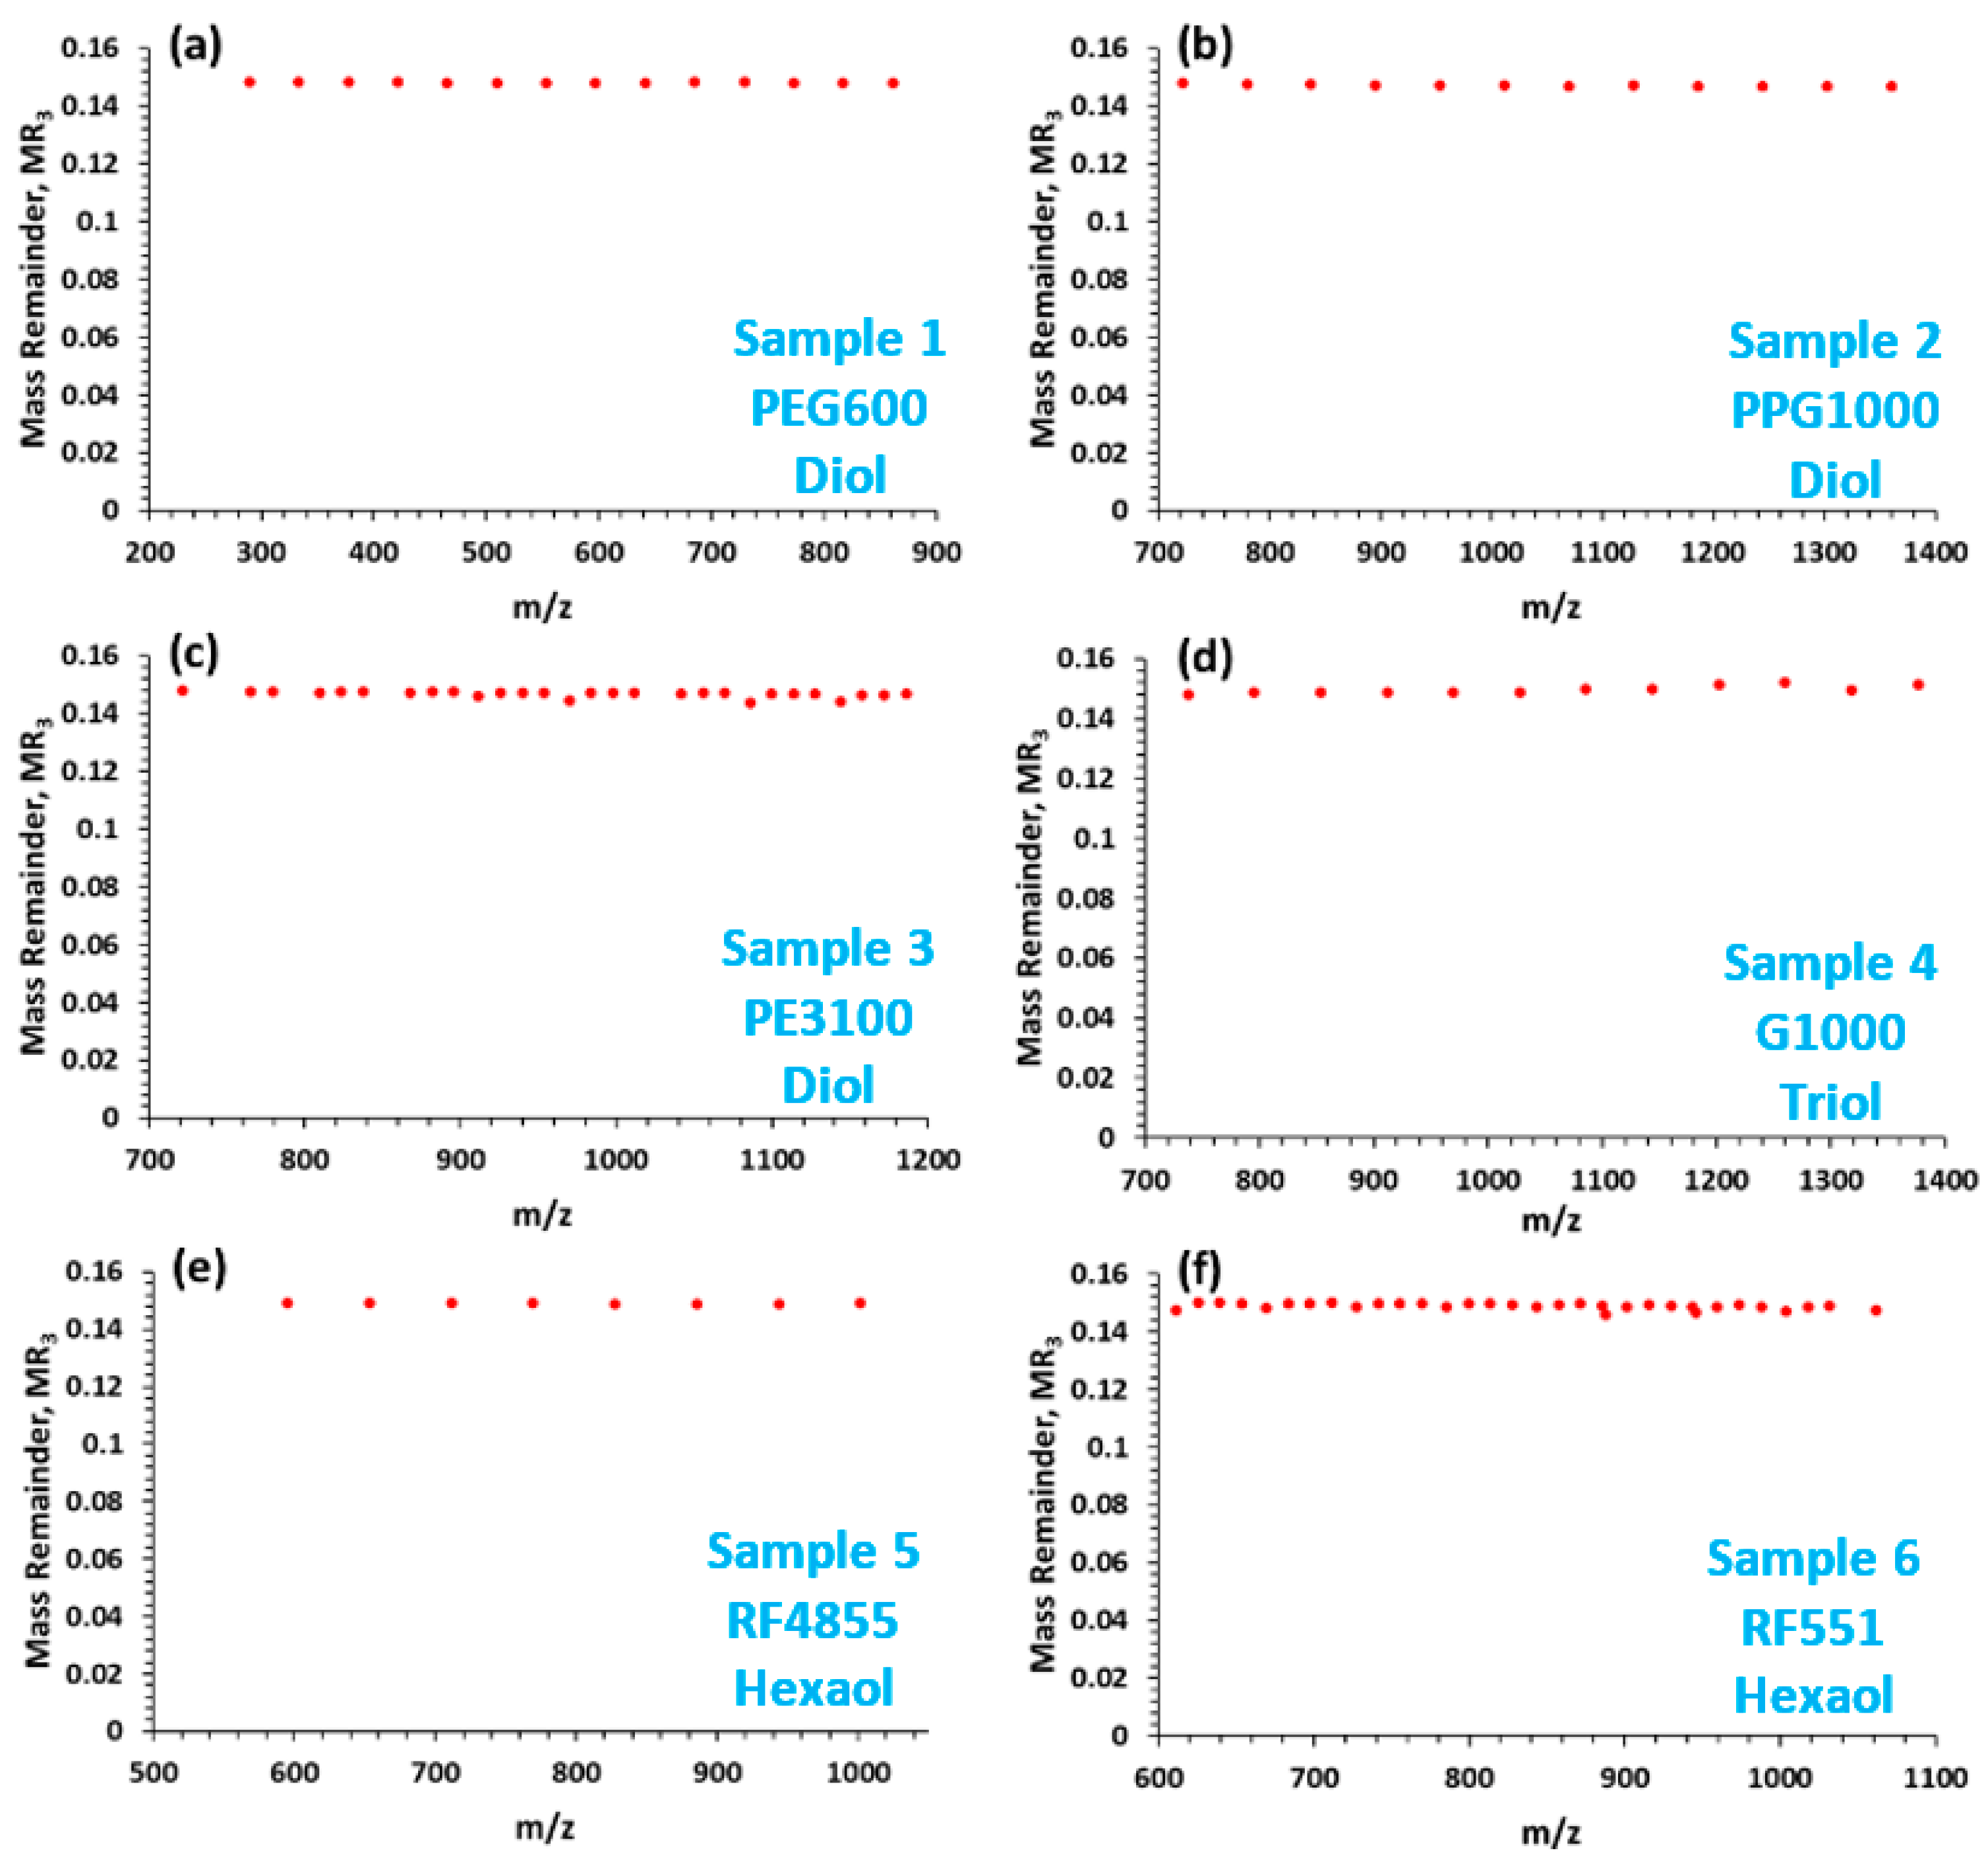
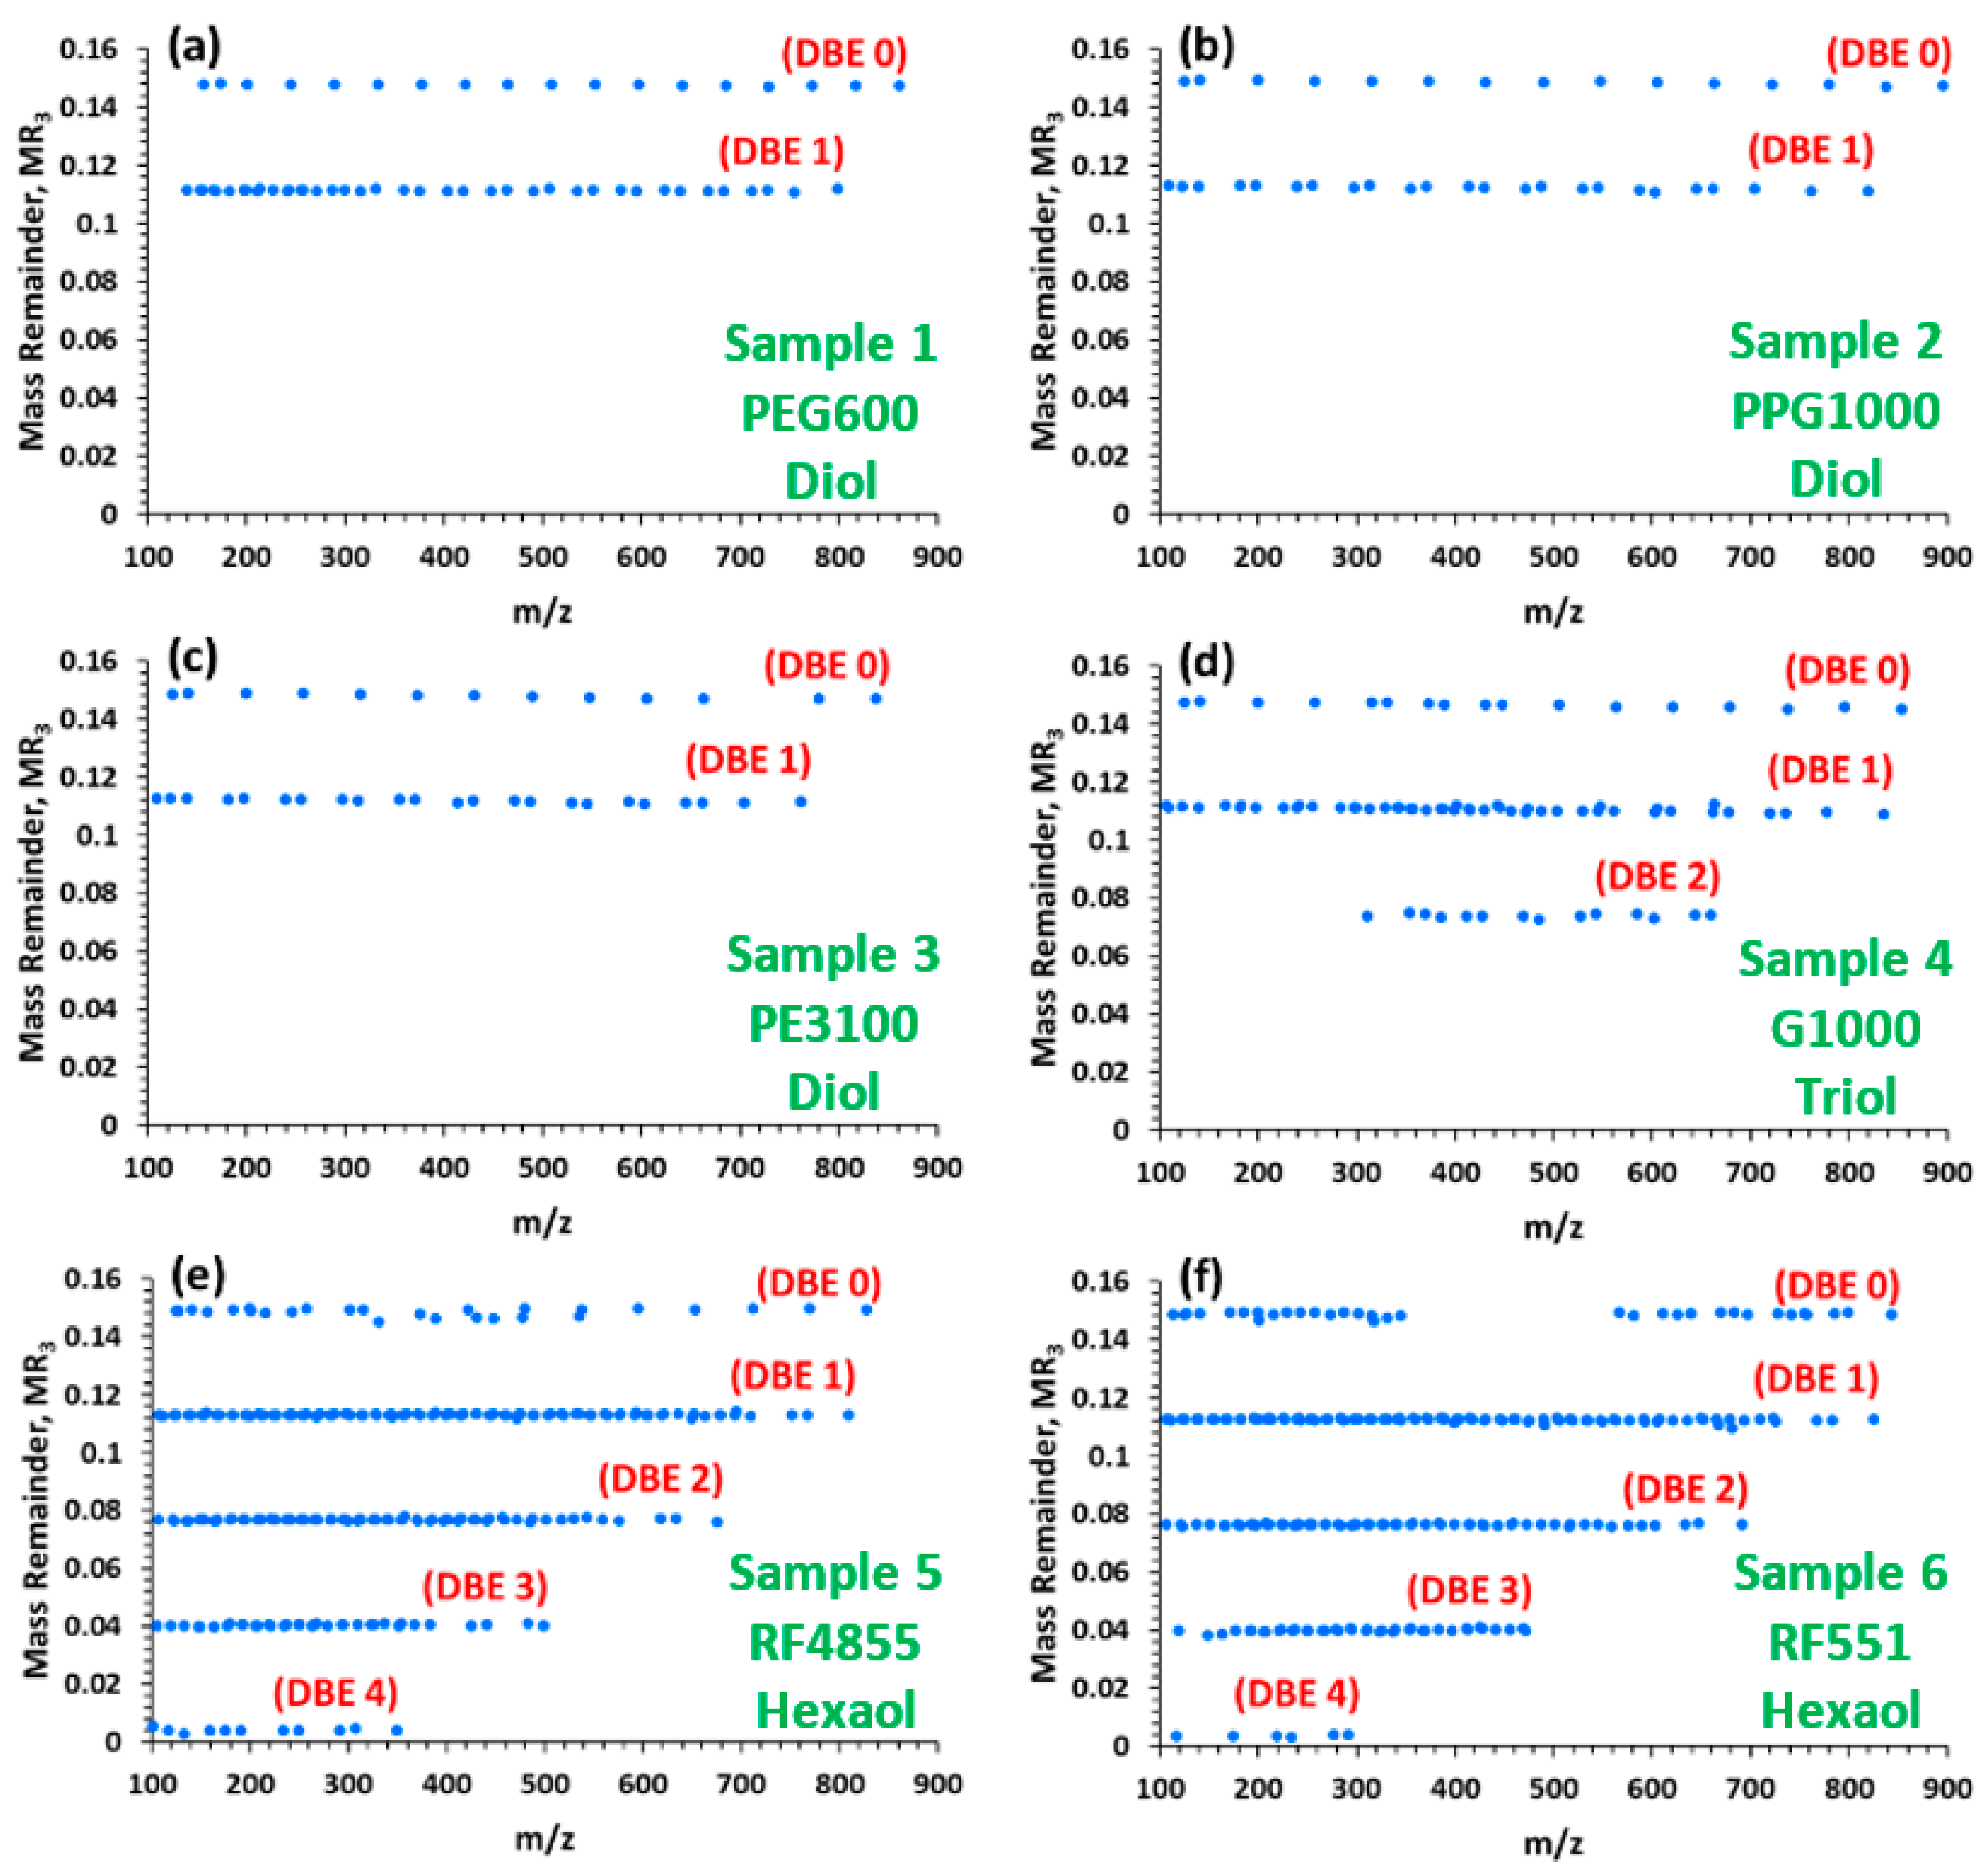
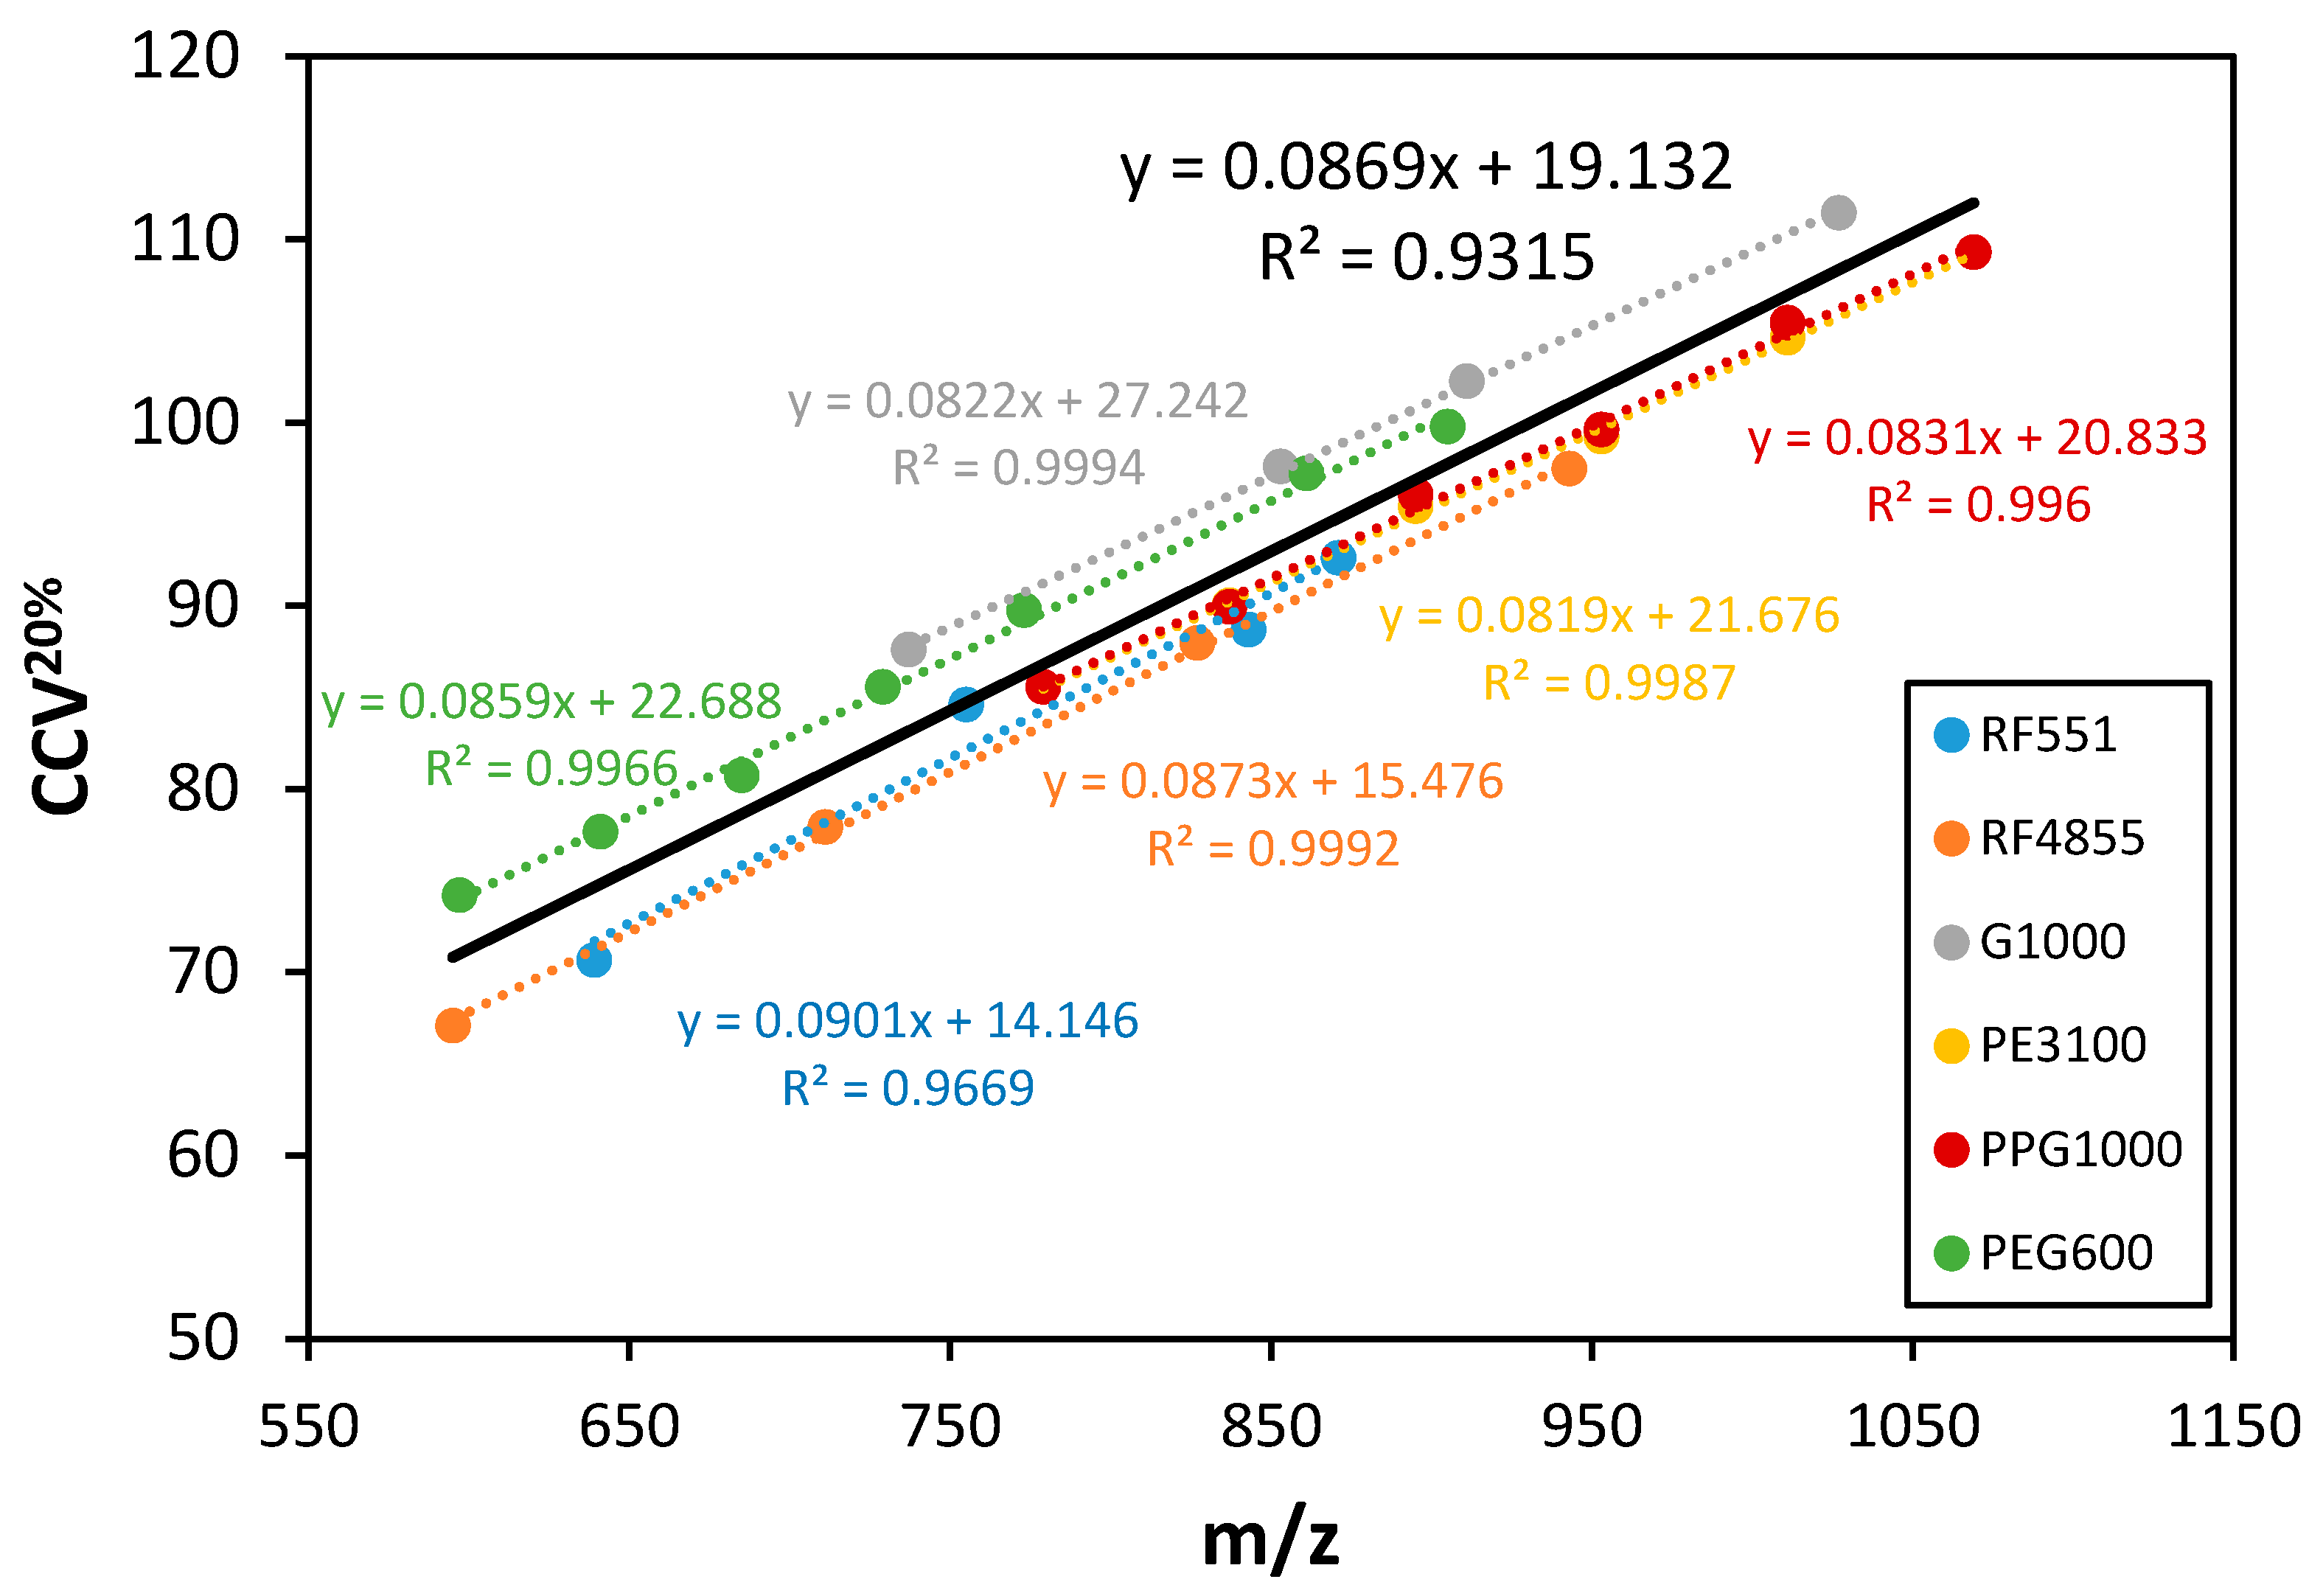
| Sample 1 | PEG600 | EO | Diol—linear | 600 | |
| Sample 2 | PPG1000 | PO | Diol—linear | 1000 | |
| Sample 3 | PE3100 | EO/PO | Diol—linear | 1000 | |
| Sample 4 | G1000 | PO | glycerol | Triol—3 arms | 1000 |
| Sample 5 | RF4855 | PO | sorbitol | Hexaol—6 arms | 600 |
| Sample 6 | RF551 | EO/PO | sorbitol | Hexaol—6 arms | 800 |
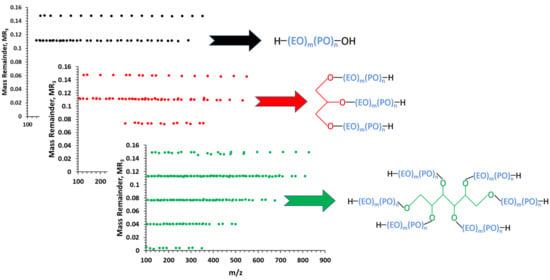
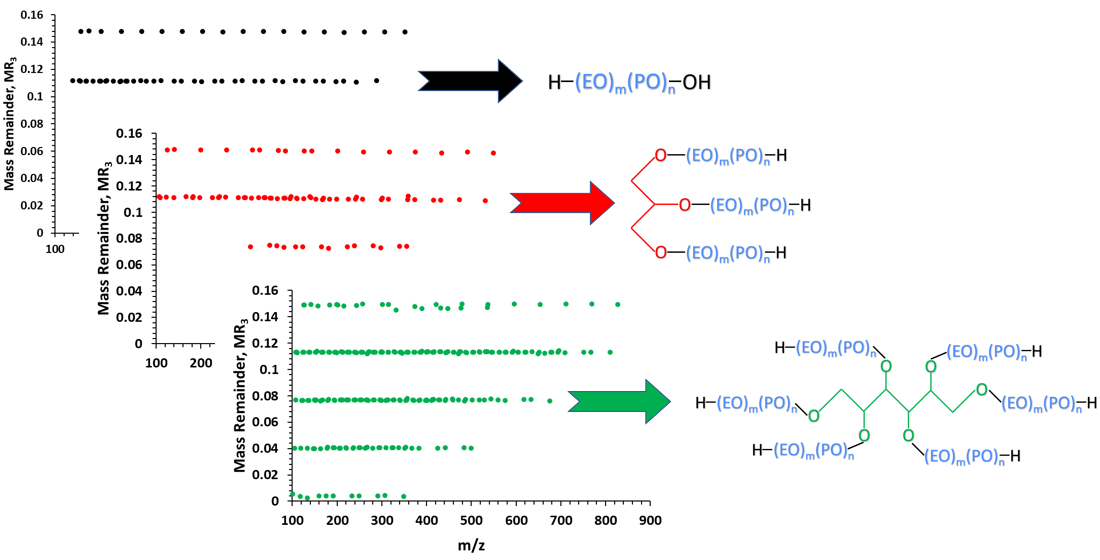
| Series | Formula | Chain Termination | MR3 |
|---|---|---|---|
| A | Li[HO(C2H4O)n(C3H6O)mH]+ | hydroxyl | 0.149 |
| B | Li[HO(C2H4O)n(C3H6O)mCHCH2]+ | vinyl | 0.113 |
| B | Li[HO(C2H4O)n(C3H6O)mCHCHCH3]+ | vinyl | 0.113 |
| C | Li[HO(C2H4O)n(C3H6O)mCH2CHO]+ | formyl | 0.113 |
| C | Li[HO(C2H4O)n(C3H6O)mCHCH3CHO]+ | formyl | 0.113 |
| H2 | 0.036 |
Publisher’s Note: MDPI stays neutral with regard to jurisdictional claims in published maps and institutional affiliations. |
© 2020 by the authors. Licensee MDPI, Basel, Switzerland. This article is an open access article distributed under the terms and conditions of the Creative Commons Attribution (CC BY) license (http://creativecommons.org/licenses/by/4.0/).
Share and Cite
Hashimov, M.; Kuki, Á.; Nagy, T.; Zsuga, M.; Kéki, S. Tandem Mass-Remainder Analysis of Industrially Important Polyether Polyols. Polymers 2020, 12, 2768. https://doi.org/10.3390/polym12122768
Hashimov M, Kuki Á, Nagy T, Zsuga M, Kéki S. Tandem Mass-Remainder Analysis of Industrially Important Polyether Polyols. Polymers. 2020; 12(12):2768. https://doi.org/10.3390/polym12122768
Chicago/Turabian StyleHashimov, Mahir, Ákos Kuki, Tibor Nagy, Miklós Zsuga, and Sándor Kéki. 2020. "Tandem Mass-Remainder Analysis of Industrially Important Polyether Polyols" Polymers 12, no. 12: 2768. https://doi.org/10.3390/polym12122768
APA StyleHashimov, M., Kuki, Á., Nagy, T., Zsuga, M., & Kéki, S. (2020). Tandem Mass-Remainder Analysis of Industrially Important Polyether Polyols. Polymers, 12(12), 2768. https://doi.org/10.3390/polym12122768