Article

The Study of the Degree of Crystallinity, Electrical Equivalent Circuit, and Dielectric Properties of Polyvinyl Alcohol (PVA)-Based Biopolymer Electrolytes

by
Shujahadeen B. Aziz
1,2,*,
Ayub S. Marf
1,
Elham M. A. Dannoun
3,
Mohamad A. Brza
4 and
Ranjdar M. Abdullah
1
1
Advanced Polymeric Materials Research Lab., Department of Physics, College of Science, University of Sulaimani, Qlyasan Street, Kurdistan Regional Government, Sulaimani 46001, Iraq
2
Department of Civil Engineering, College of Engineering, Komar University of Science and Technology, Kurdistan Regional Government, Sulaimani 46001, Iraq
3
Associate Director of General Science Department, Woman Campus, Prince Sultan University, P.O. Box 66833, Riyadh 11586, Saudi Arabia
4
Manufacturing and Materials Engineering Department, Faculty of Engineering, International Islamic University of Malaysia, Kuala Lumpur 50603, Gombak, Malaysia
*
Author to whom correspondence should be addressed.
Polymers 2020, 12(10), 2184; https://doi.org/10.3390/polym12102184
Submission received: 30 August 2020 / Revised: 21 September 2020 / Accepted: 23 September 2020 / Published: 24 September 2020
(This article belongs to the Special Issue Conducting Polymers for Advanced Applications)

Abstract

:
This report presents a facile and efficient methodology for the fabrication of plasticized polyvinyl alcohol (PVA):chitosan (CS) polymer electrolytes using a solution cast technique. Regarding characterizations of electrical properties and structural behavior, the electrochemical impedance spectroscopy (EIS) and X-ray diffraction (XRD) are used, respectively. Crystalline peaks appear in the XRD pattern of the PVA:CS:NH4I while no peaks can be seen in the XRD pattern of plasticized systems. The degree of crystallinity is calculated for all the samples from the deconvoluted area of crystalline and amorphous phases. Considering the EIS measurements, the most conductive plasticized system shows a relatively high conductivity of (1.37 × 10⁻⁴) S/cm, which is eligible for applications in energy storage devices. The analysis of the EIS spectra reveals a decrease in bulk resistance which indicates an increase in free ion carriers. The electrical equivalent circuit (EEC) model is used in the analysis of EIS plots. Dielectric properties are modified with the addition of glycerol as a plasticizer. It is proved that the addition of glycerol as a plasticizer lowers ion association. It also shows, at the low-frequency region, a large value of a dielectric constant which is correlated with electrode polarization (EP). The distribution of relaxation times is associated with conducting ions.

1. Introduction

Solid polymer-based electrolytes as promising electrolytes have increased the awareness of numerous research groups due to the extensive utilization of these advanced materials in electrochemical energy devices; for example, in supercapacitors, dye-sensitized solar cells, fuel cells, and high energy solid-state batteries [1,2]. There are several advantages to solid polymer electrolytes (SPEs) which can be taken into consideration, for instance, extended lifetime, safety, lightweight, mechanical flexibility, high corrosion resistance, and trouble-free processing [3,4,5]. However, the main and effective barrier that makes SPEs hard to utilize on a large scale is the relatively low ionic conductivity at ambient temperatures [6,7]. Therefore, many attempts have focused on enhancing the ionic conductivity of SPE systems. Thus, various salts have been incorporated into different host polymer matrices [8,9,10,11]. Polymer electrolytes are hosts for ion carriers while conductive polymers such as polyaniline (PANI) are hosts for electron carriers [12]. Polymer electrolyte ions are responsible for conduction [9,10,11], while in PANI electrons are sources for conduction [12]. Polymers used for polymer electrolyte preparation can be categorized into natural polymers and synthetic polymers. The natural ones are renewable and can be easily obtained from natural resources, such as proteins, wool, cellulose, and silk. Conversely, the synthetic or man-made polymers can be synthesized from relatively low molecular weight compounds such as monomers, for example, polystyrene and polyethylene. The natural polymers also can be obtained from natural resources just by modifications, for instance, rubber (Hevea), which is known as a polyisoprene in its synthetic form [13].
Poly(vinyl alcohol) (PVA) polymer is one of the fascinating polymers that is characterized by non-toxicity, water solubility, and ability to form a film. Furthermore, many functional groups within the backbone enable PVA to be polar, where it can form hydrogen bonds and facilitate polymer-blend formation [14]. All this means that the hydrophilic character and the high density of reactive chemical functional groups encourage PVA to be able to cross-link with dopant chemical materials [15]. Nowadays, the focus has been devoted to biodegradable and compatible natural polymers, for example, starch, cellulose, chitosan, carrageenan, and agarose. This is due to their environmental sustainability and renewability, and their ease of handling during electrolyte preparations [16,17]. The first and second abundant natural polymers are cellulose and chitin, respectively, the latter being a deacetylated product of chitosan (CS) [18]. CS is extractable from shrimp waste and has received considerable focus in numerous applications [19,20]. It is a polycationic polymer that possesses an amino group and two hydroxyl groups in each repeating unit [21,22,23,24]. Several favorable traits of CS, such as biocompatibility, biodegradability, benign nature, and cheapness cause this material to be under intensive study [25,26]. Based on the functional groups in CS and the high molecular weight polysaccharide, there is a strong network of intermolecular or intramolecular hydrogen bonds [27,28]. The crystalline structure on one side, and the existence of hydrogen bonds on the other side, provides a compromise that it is usually soluble in acids [29,30]. Herein, a promising methodology known as polymer blending has been implemented often to develop new polymeric materials with unique properties that differ from their individual components. This method is usually facile, efficient, and time-saving for synthesizing polymeric materials with desired properties [31,32,33]. Polymer blending is also easy to process, reforming polymers with high flexibility [34].
PVA and CS are compatible with blending [35] and they are miscible into each other [36]. The miscibility of PVA and CS blends was established by Lewandowska et al. [37] via dynamic mechanical analysis. It also has been reported that films with high compatibility and miscibility were created when blending PVA with CS [38]. The presence of robust hydrogen bonding among the hydroxyl groups in PVA, and the hydroxyl groups in CS via blending, also offer good mechanical properties [35]. The polymer electrolyte conductivity can be increased by blending two polymers as the host material for ionic conduction [39]. Polymer-blend complexes have a possible application as SPEs in electrochemical devices [40]. Alternatively, plasticization of polymer electrolytes provides a relatively high direct current (DC) conductivity and dielectric constant [41,42]. Chai and Isa [43] added glycerol into carboxymethyl cellulose (CMC) via solution cast methodology, producing plasticized polymer. It was proved that the addition of glycerol improved ionic conductivity and the mechanical strength of the electrolyte film significantly.
To provide insight into the chemical and physical states of the polymer understudy, dielectric properties, dielectric constant, and dielectric loss have to be measured. To improve these properties, the insertion of dopants into polymers is one of the promising methodologies [12,41,42,44]. As relatively high-energy capacity materials, dielectric polymers have been studied extensively and intensively. The decisive properties of dielectric materials are their large dielectric constant, low dielectric loss, and high electric breakdown strength [45]. Previously, it has been proved that polymer electrolytes with a relatively high DC conductivity and dielectric constant are eligible to be used as separators and charge providers in electrical double layer capacitor (EDLC) applications [12,41,42].
Here, structural, electrical equivalent circuits and several electrical parameters are investigated for PVA:CS:NH4I:glycerol systems.

2. Experimental Method

2.1. Materials and Sample Preparation

Chitosan (CS) obtained from crab shells (≥75% deacetylated, average molecular weight 1.1 × 10⁵ g/mol) and PVA (Mw 89,000–98,000, 99+% hydrolyzed) powder materials were purchased from Sigma–Aldrich (St. Louis, MO, USA). Both polymer raw materials and ammonium iodide (NH4I) were obtained from Sigma–Aldrich. The CS powder (0.5 g) was dissolved in 50 mL of 1% acetic acid. Subsequently, the solution was stirred using a magnetic stirrer for 4 h at room temperature until complete dissolution of the polymer, when a clear viscose solution was gained. Separately, an accurate amount of 0.5 g of PVA was dissolved in distilled water with continuous stirring. To prepare series blend solutions, various portions of PVA solutions were added to CS solutions. Then, 40 wt.% of NH4I was added into the PVA:CS solution, maintaining stirring. Afterward, various quantities of glycerol ranging from 14 to 42 wt.% as an efficient plasticizer were added to PVA:CS:NH4I electrolytes to prepare the plasticized blend electrolytes. The stirring of the mixtures was carried out continuously until homogeneous solutions were achieved. After casting, the coding process was performed in different Petri dishes where the polymer-blend electrolyte samples were labeled as PVCSGP0, PVCSGP1, PVCSGP2, and PVCSGP3 for PVA:CS:NH4I incorporated with 0 wt.%, 14 wt.%, 28 wt.%, and 42 wt.% of glycerol, respectively. The solutions were left to dry gradually at room temperature to form films. Ultimately, to ensure the dryness of the films, it was imperative to put them into a desiccator, producing solvent-free films.

2.2. Characterization Techniques

The acquisition of X-ray diffraction (XRD) was performed using an X-ray diffractometer (Malvern Panalytical Ltd., Malvern, UK) by applying 40 kV and 40 mA at room temperature. To investigate the electrical properties of the samples, a 3532-50 LCR HiTESTER (Hioki, Nagano, Japan) was used at room temperature. The preferred frequency choice of 0.05–5000 kHz was applied. The electrolyte films were cut into semicircles and sandwiched between two stainless steel (SS) electrodes.

3. Results and Discussion

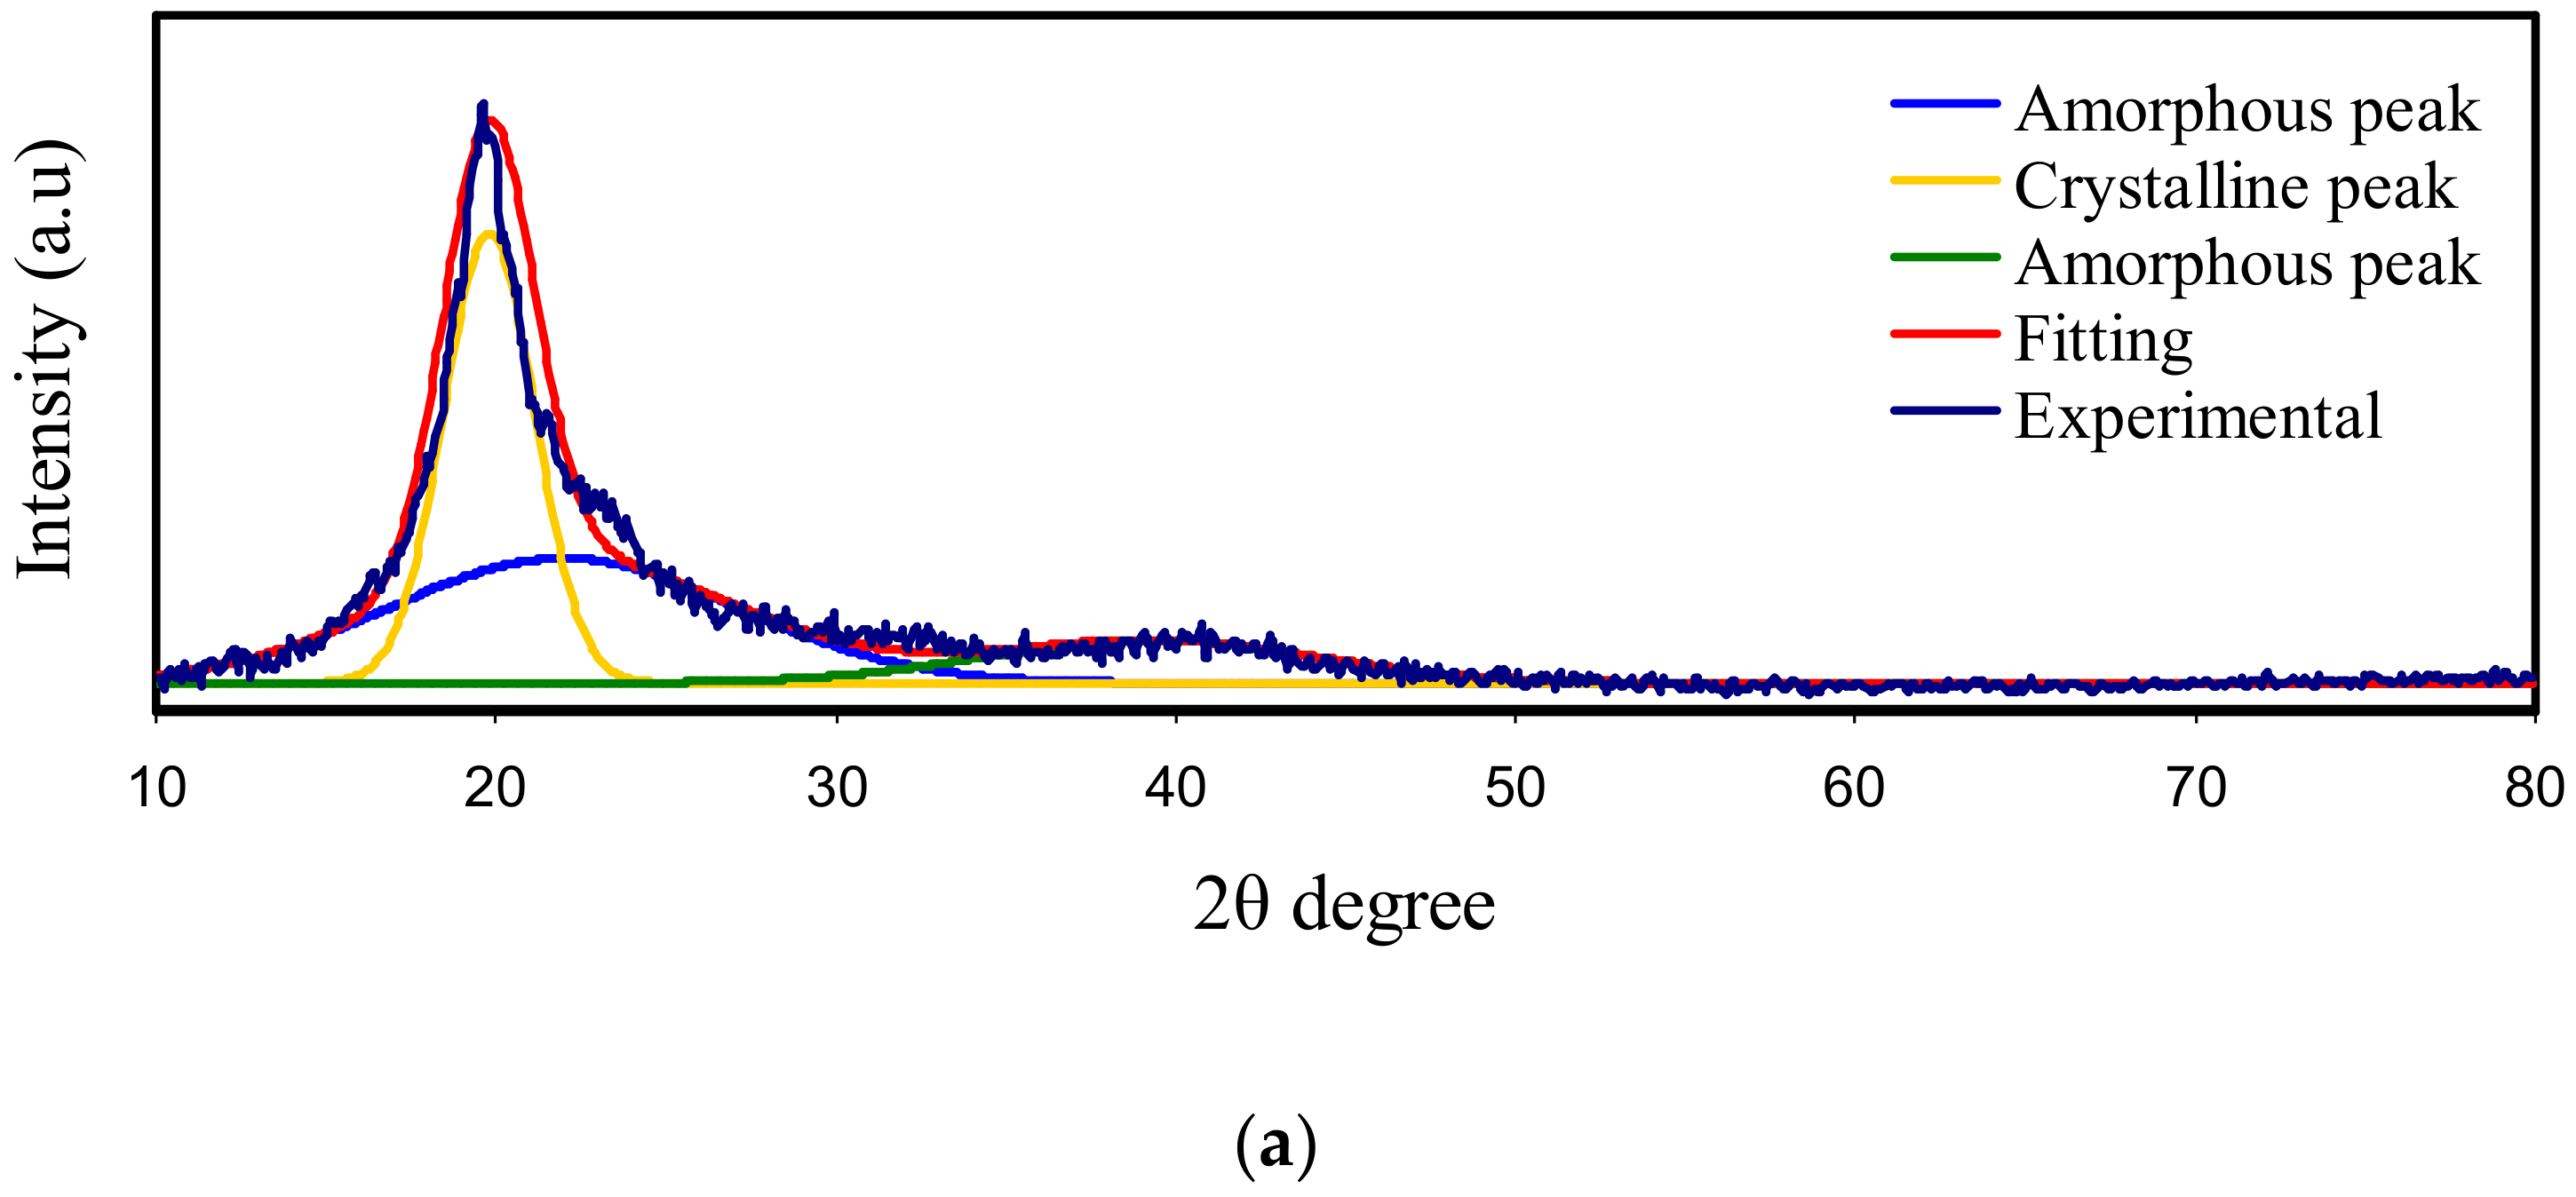
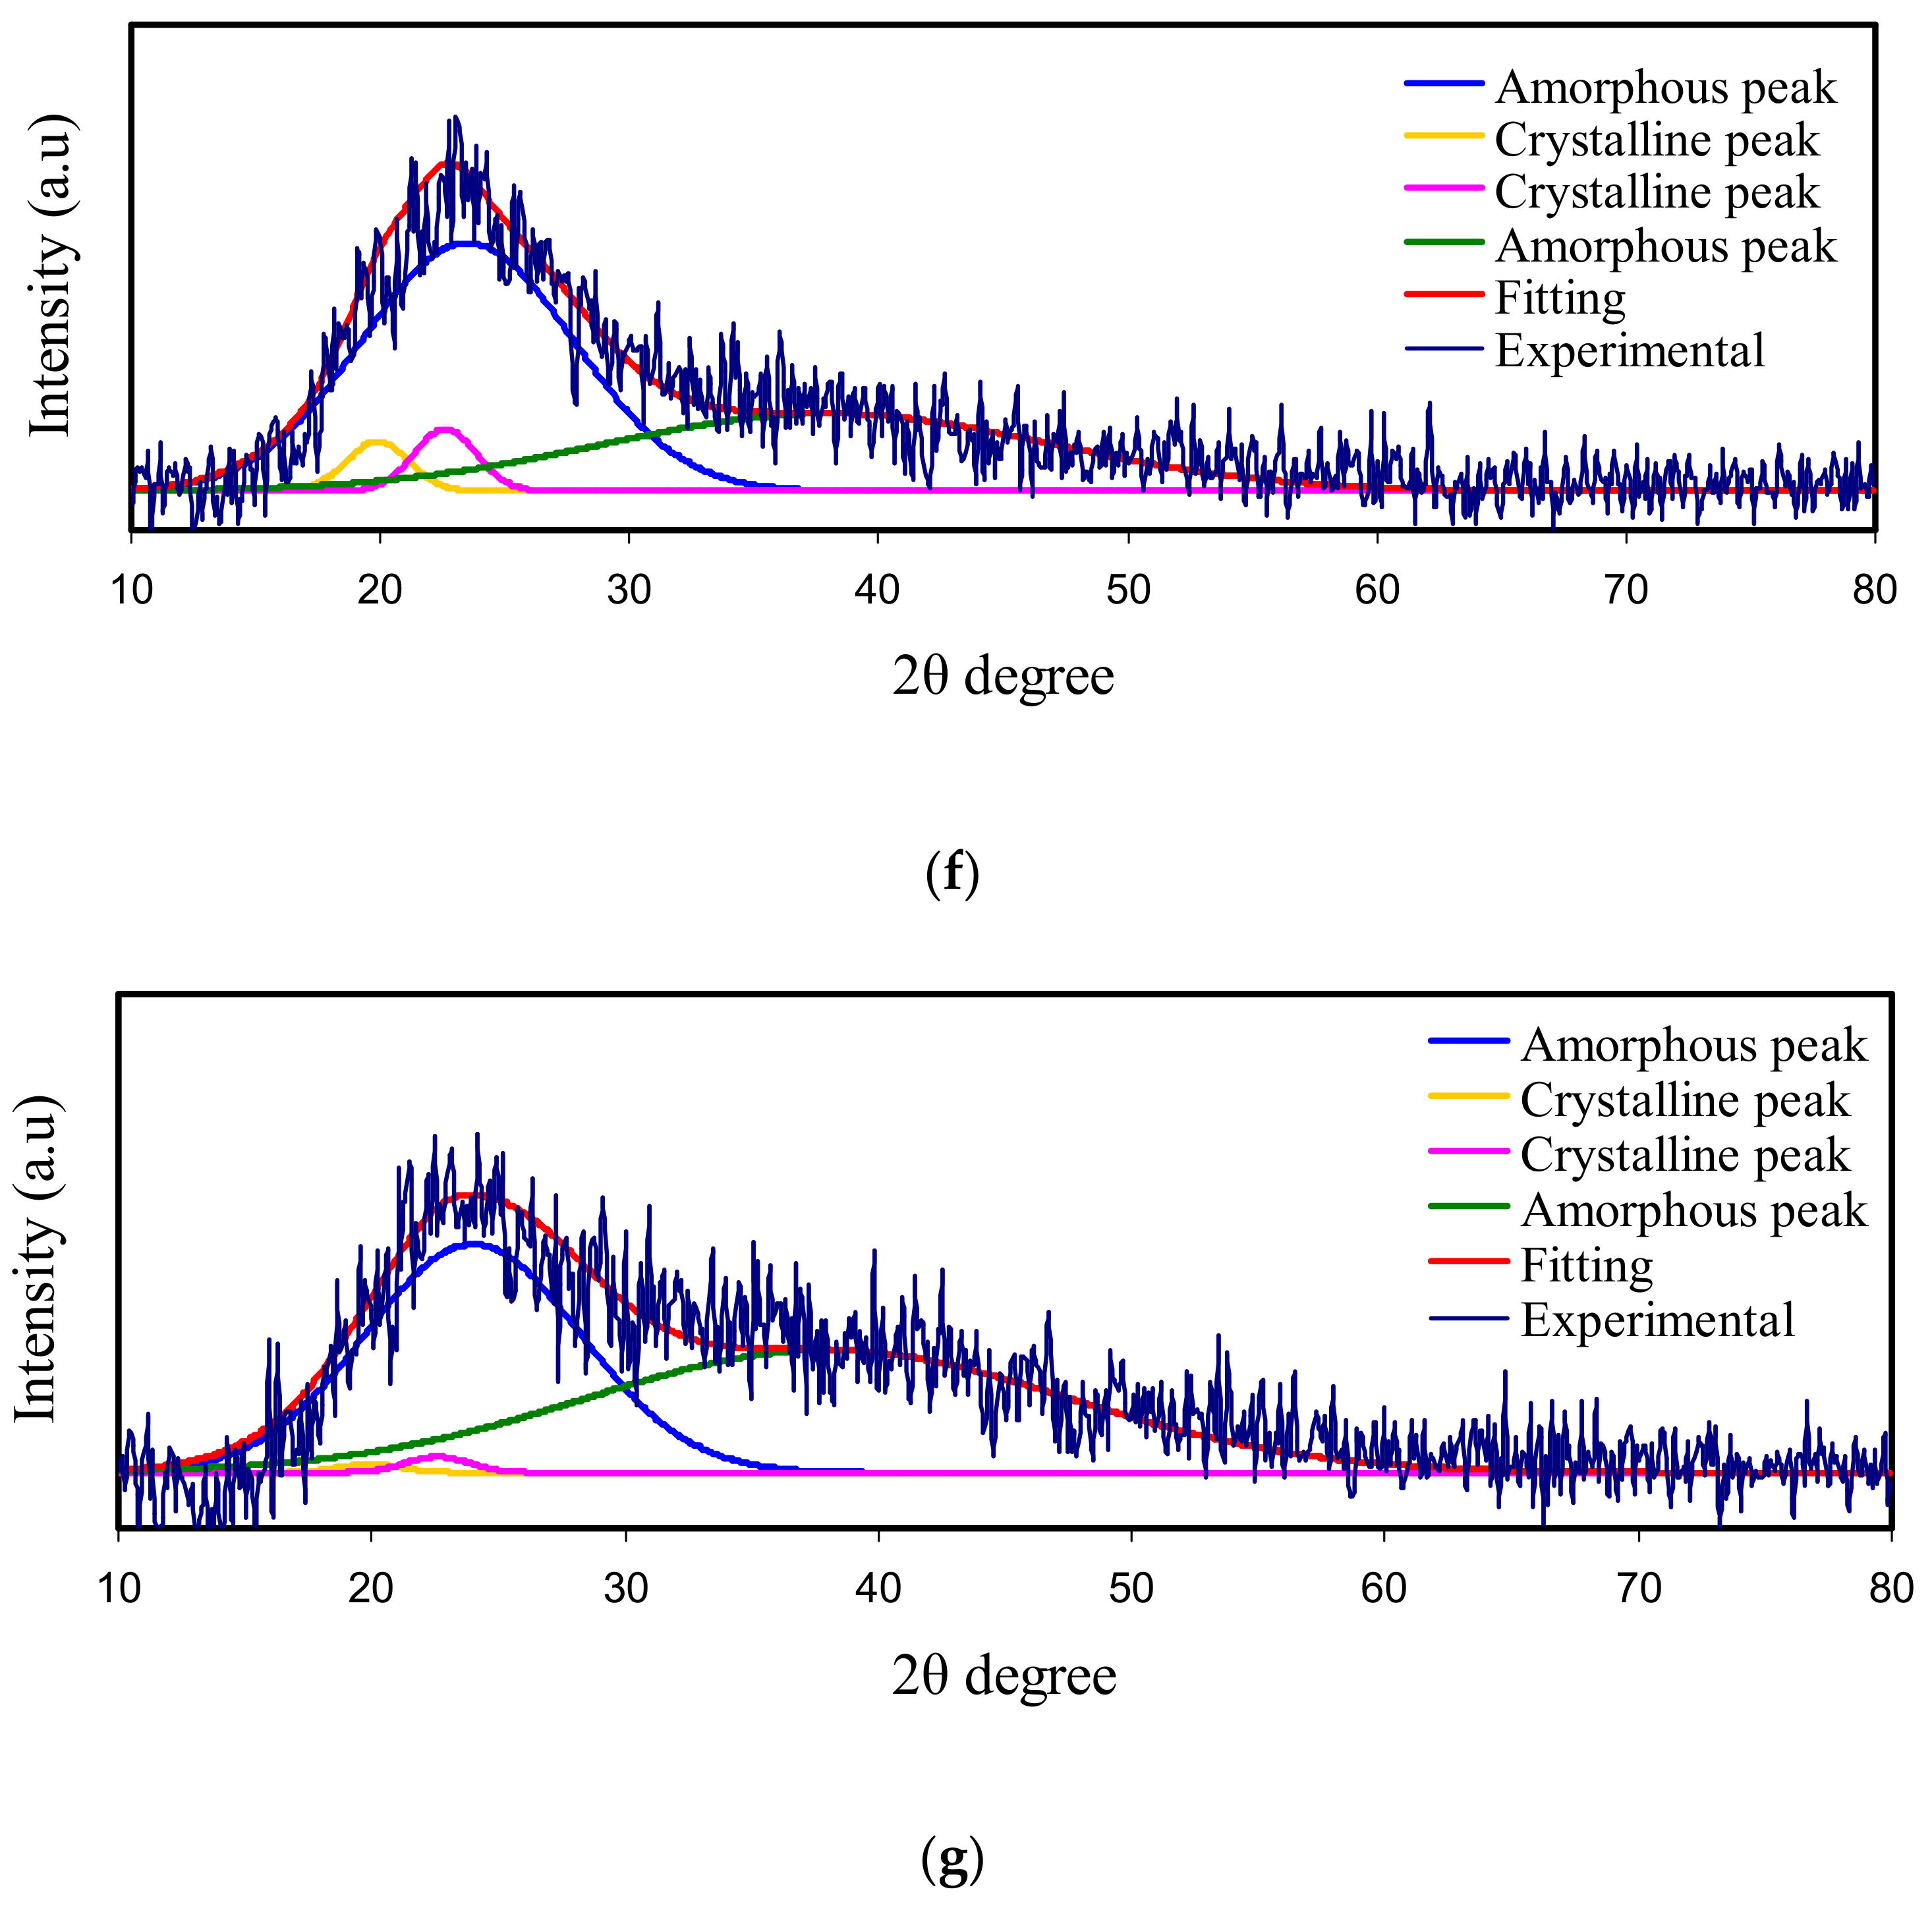
3.1. X-Ray Diffraction (XRD)

To examine the influence of glycerol as a plasticizer on the crystalline structure of PVA:CS:NH4I, XRD was acquired and analyzed. Early studies showed that the two distinct crystalline peaks at 2θ = 15.1° and 20.9° are a feature of a pure CS sample film. These crystalline peaks at 15.1° and 20.9° correspond to the reflection planes of (110) and (220), respectively [46,47]. The preservation of the rigid crystalline structure of CS is chiefly endorsed to the intramolecular and intermolecular hydrogen bonds, signifying an average intermolecular distance of the crystalline parts of CS [24,48]. The wide peak at 2θ extended from 35 to 55° is the mark of the amorphous phase of CS [49,50,51]. The XRD pattern of pure CS and PVA films are shown in Figure 1a,b. A featured peak around 2θ = 18° proves the semi-crystalline manners of pure PVA [15]. The attachment of PVA with OH groups along the major chain is adequate to have a strong intermolecular and intramolecular hydrogen bonding. Notably, a large peak center at 2θ = 40.7° refers to amorphous phases in the PVA structure. This study showed, as the 50 wt.% of PVA was blended with 50 wt.% of CS, the intensity of the diffraction peaks decreased and broadened (see Figure 1c). This is caused by hydrogen bonding disruption owing to the amorphous structure dominance in the blend system. Therefore, polymer blending could be considered an efficient methodology to reduce the PVA crystalline segment. It is remarkable to see that the degree of crystallinity (XC) is decreased upon the insertion of CS content (see Table 1). The XC of CS in this study is quite close to the previous report [52].
Figure 1d shows the XRD pattern for a PVA:CS:NH4I electrolyte system. It is seen that the intensity of the peak at 2θ = 18.6° is noticeably decreased, indicating the interaction between the polymer-blend and NH4I. However, it is determined that the new strong and high-intensity peak that appears at 2θ = 26.9° is related to the NH4I salt, which may be due to the incomplete dissociation of the NH4I in the polymer electrolyte film. The XRD pattern of PVA:CS:NH4I electrolytes incorporated with a series of quantities of glycerol is shown in Figure 1e–g. It is seen, as the quantity of glycerol is increased up to 42 wt.% into the electrolyte system, the intensity of the XRD peaks is considerably decreased. This indicates decreasing of the XC of the electrolyte system and the amorphous phase dominates. Moreover, the effect of glycerol as a plasticizer on PVA:CS:NH4I, is evidenced from the disruption of hydrogen bonding between the amino groups and the hydroxyl groups in the PVA polymer matrix [53]. Consequently, one can say that plasticizer has a substantial influence on the crystalline phases of PVA solid polymer electrolytes.
To determine the XC, it is essential to deconvolute the XRD spectra of the samples to find the area of the amorphous and crystalline peaks [47]. The XC was calculated using Equation (1) [54]:
X C = A C A T × 100 %
where AC and AT are the areas of crystalline peaks and the total area of amorphous and crystalline peaks, respectively. It is significant to view that the XC is reduced upon the inclusion of extra glycerol content (see Table 1). The deconvoluted XRD spectra of plasticized PVA:CS electrolyte is shown in Figure 1a–g. It is fascinating to observe that the intensity of the XRD peaks is considerably decreased. The amorphous structure increment might be associated with the crystalline phase disruption in the polymer [55]. Compared to the pure films, regarding the PVA:CS blend and the un-plasticized system, the XC in the plasticized systems is significantly decreased (see Table 1).

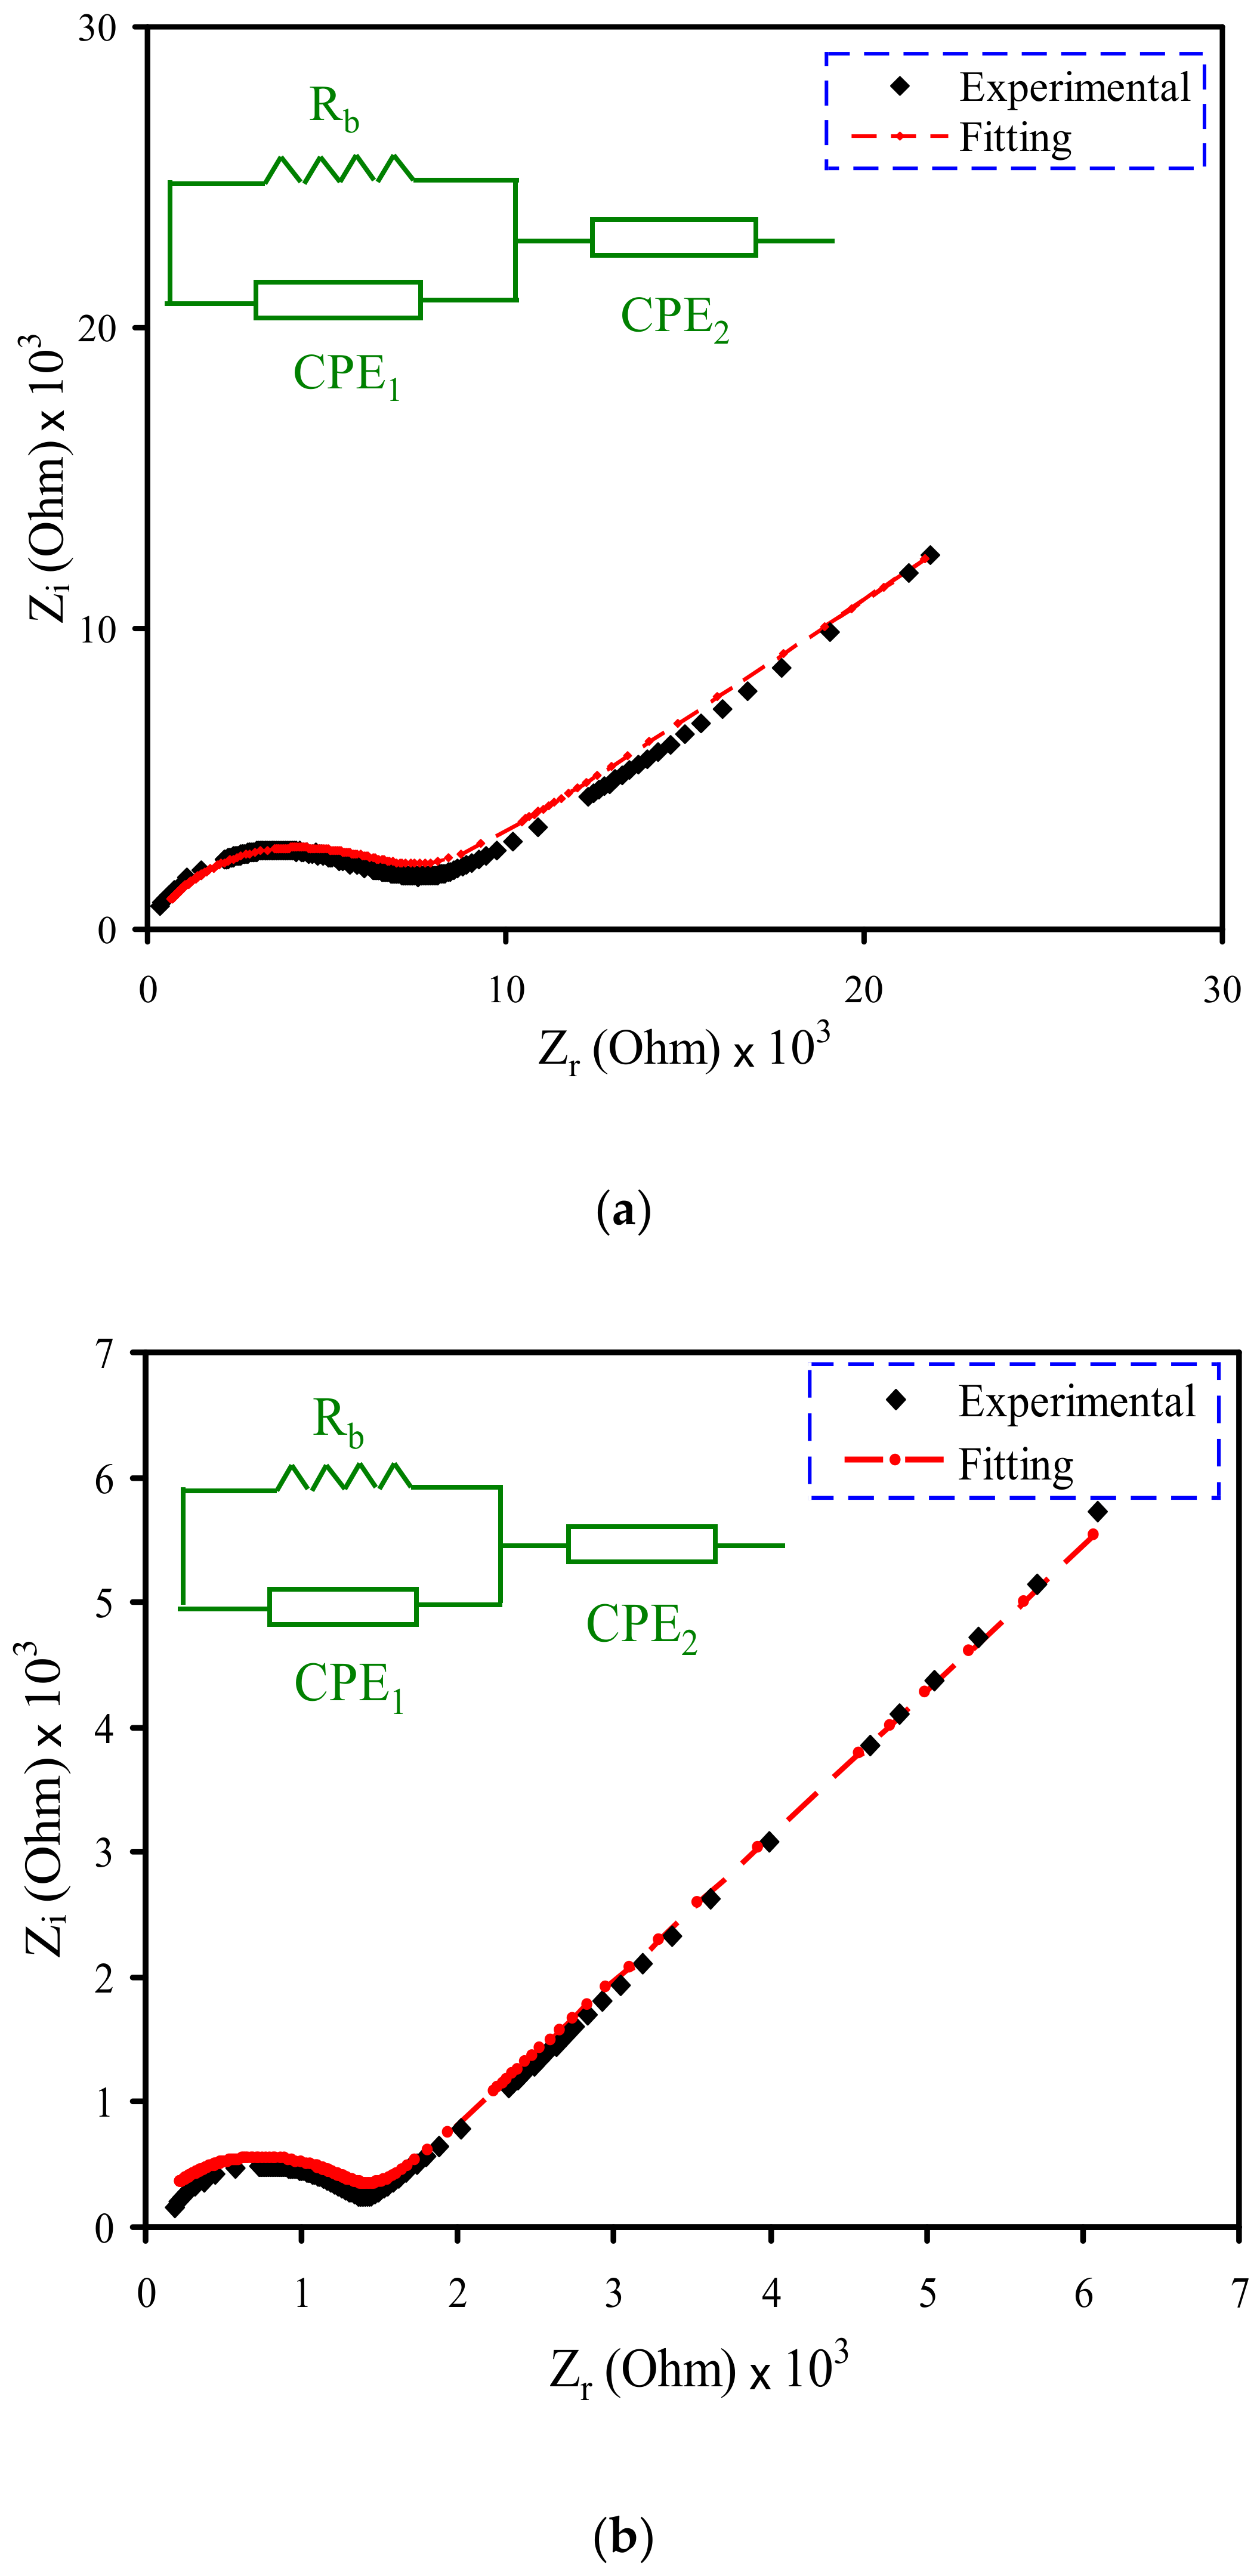
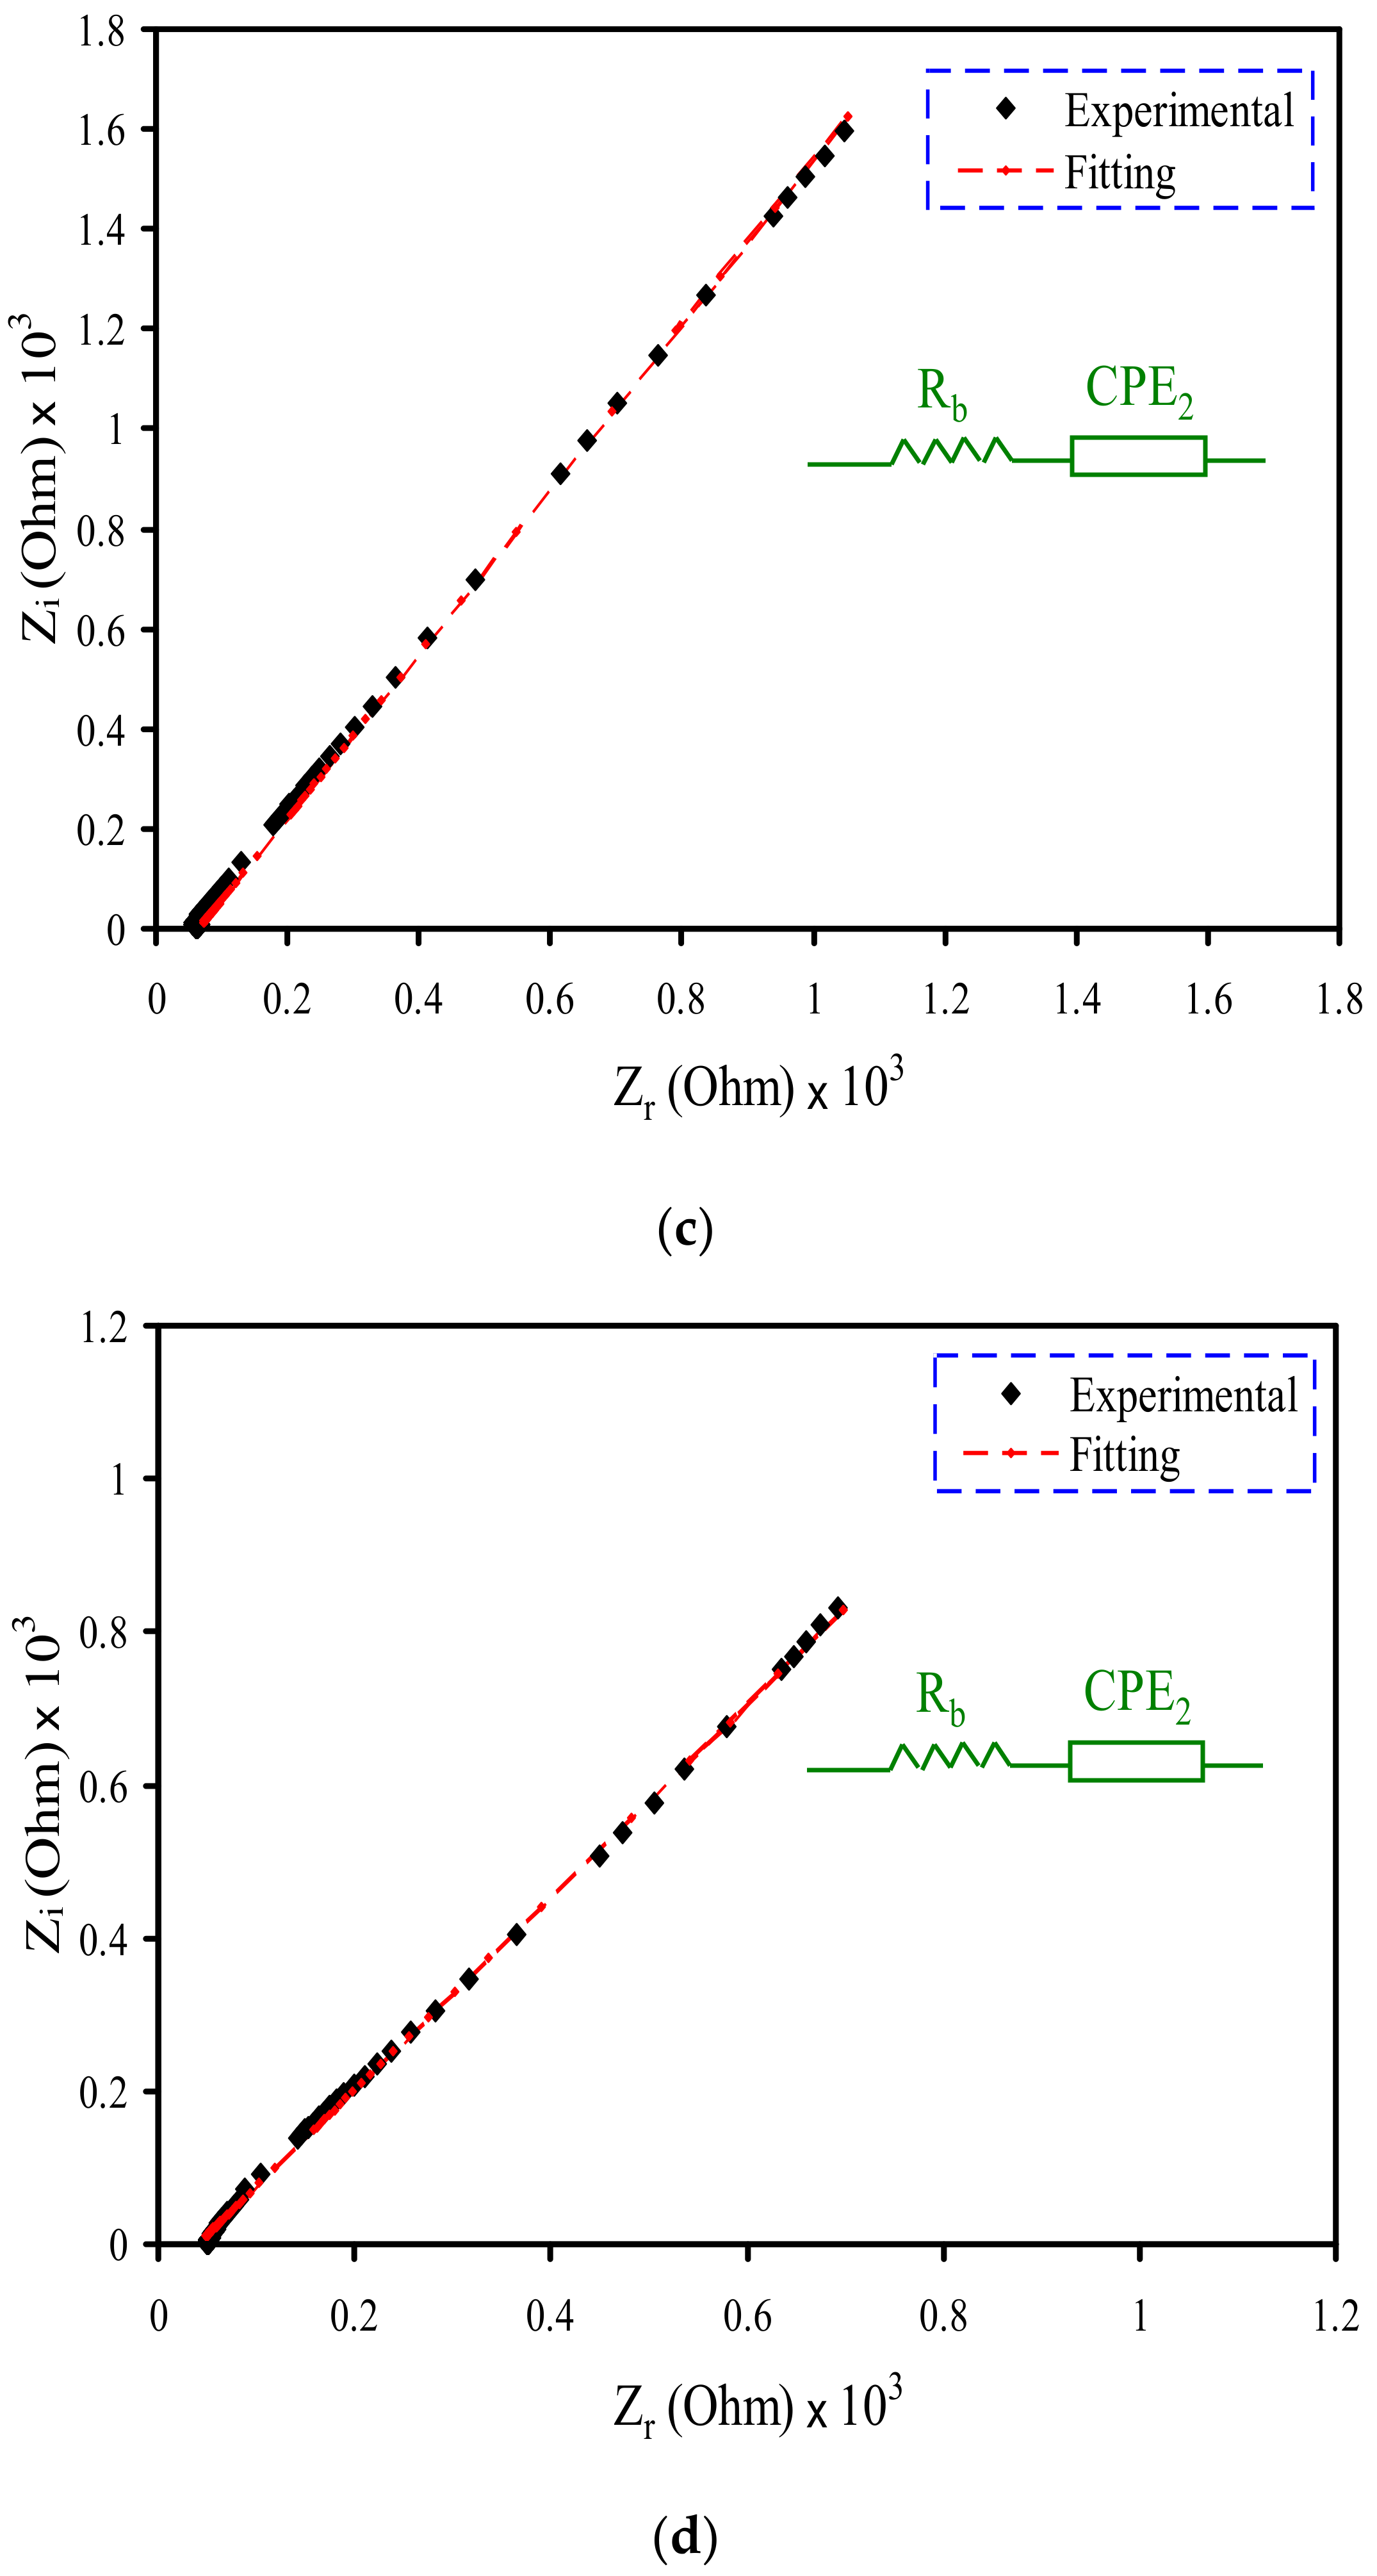
3.2. Impedance Study

During the investigation of electrolyte conductivity and the frequency behavior of the polymer electrolyte, impedance spectroscopy measurements were performed. The Cole–Cole plot (Nyquist plot) for each electrolyte system at room temperature is presented in Figure 2a–d. Considering the complex impedance plots, there is a high-frequency semi-circle and a low-frequency spike, as shown in Figure 2a,b. The semi-circle at the high-frequency is interrelated to a mixture of bulk resistance (due to migration of ions) and bulk capacitance (due to immobile polymer chains). While, at the low-frequency, a spike results from the effect of the charge polarization at the electrode–electrolyte interface [25,56]. When the 14 wt.% of glycerol is added to the electrolyte system, the diameter of the high-frequency semi-circle decreases (see Figure 2b). Furthermore, at 28 and 42 wt.% of glycerol, the semi-circle disappears, indicating the prevalence of the resistance within the polymer matrix, and the conductivity totally results from the ion mobility [57,58]. The values of bulk resistance (Rb) are measured at the point where the semicircle intercepts the real axis (Zr). Equation (2) is employed to measure the films’ DC conductivity based on Rb values and the dimensions of the film. Table 2 lists the DC conductivity for each film.
σ d c = 1 R b × t A
Concerning the low-frequency region, it is presumed that a straight line is parallel to the imaginary axis, i.e., the inclination of the straight line should be 90° in the complex impedance plots. To contrast, this inclination is caused by the double-layer capacitance (electrode polarization (EP) phenomena) at the blocking electrodes [59,60]. The fitting process of the impedance plots of the electrolyte systems taken from the experimental measurements is carried out in an attempt to obtain an electrical equivalent circuit (EEC) model. The equivalent circuit is used in the analysis because it is straightforward, providing a comprehensive profile of the systems [61]. The experimental impedance plots and the general equivalent circuit model of the SPE consist of a bulk resistance (Rb) and two constant phase elements (CPE1 and CPE2), as shown in Figure 2a–d. Both Rb and CPE1 responses are located in the high-frequency region. The response of CPE2 corresponds to the double-layer capacitance formed between the SPEs, and electrodes lie at the low-frequency spike region. Alternatively, the term constant phase element (CPE) is used in place of the capacitor in an equivalent circuit model. This is because in the SPE systems there are pseudo-capacitor or capacitor-like components rather than an ideal capacitor [62].
The impedance (Z) of CPE (ZCPE) is written as the following [63,64,65,66]:
Z C P E = 1 C ω p cos π p 2 i sin π p 2
The values of real part (Zr) and imaginary part (Zi) are correlated to the equivalent circuit (inset of Figure 2a,b) that is mathematically expressed as below [53]:
Z r = R b 2 ( A 1 ) + R b 2 R b ( A 1 ) + A 2 + 1 + A 3 C 2 ω p 2
where
A 1 = C 1 ω p 1 cos π p 1 2 , A 2 = R b 2 C 1 2 ω 2 p 1 ,   and   A 3 = cos π p 2 2
Z i = R b 2 ( A 4 ) 2 R b ( A 1 ) + A 2 + 1 + A 5 C 2 ω p 2
where
A 4 = C 1 ω p 1 sin π p 1 2   and   A 5 = sin π p 2 2
The spike features of the impedance of the plasticized electrolytes indicate that the resistive component of the polymer is predominant [25]. Based on this observation, the values of Zr and Zi in EEC (inset of Figure 2c,d) can be expressed as follows:
Z r = R + A 3 C 2 ω p
Z i = A 5 C 2 ω p
Considering Equations (3)–(7), the capacitance of the CPE is represented by C, ω is the angular frequency and p is interrelated to the plot deviation from the usual vertical axis in complex impedance plots. The EEC fitting parameters are shown in Table 3.

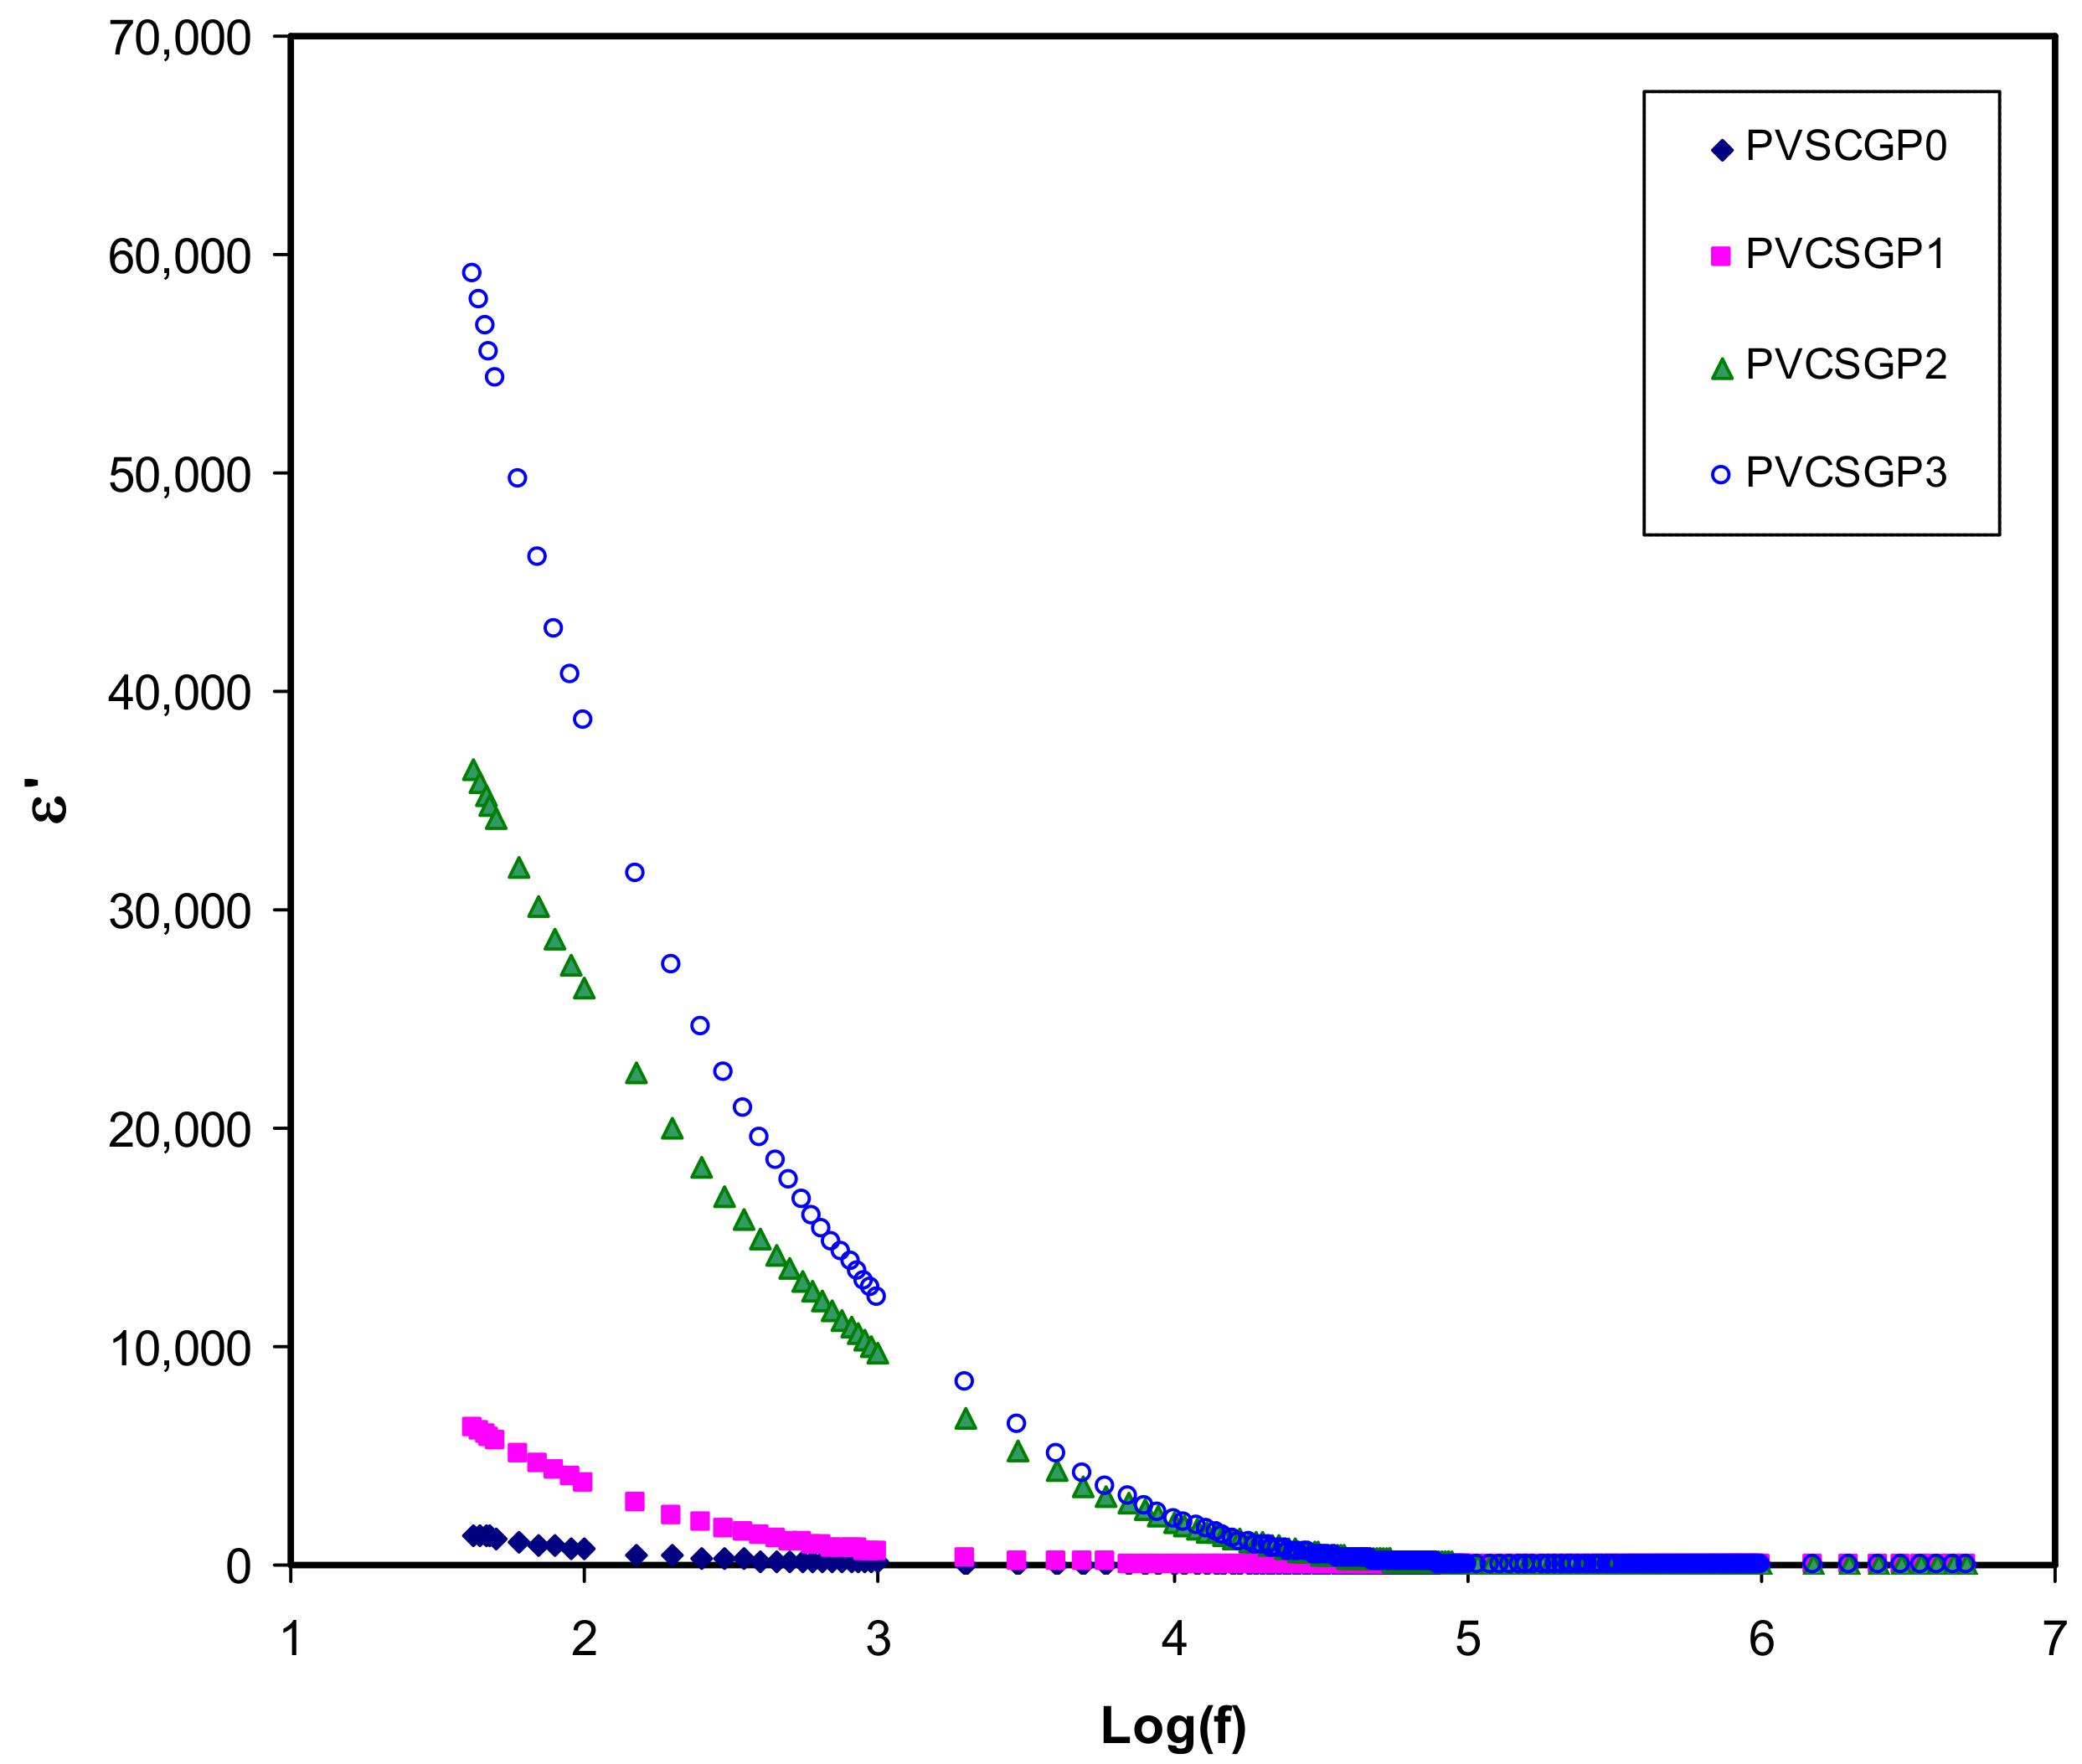
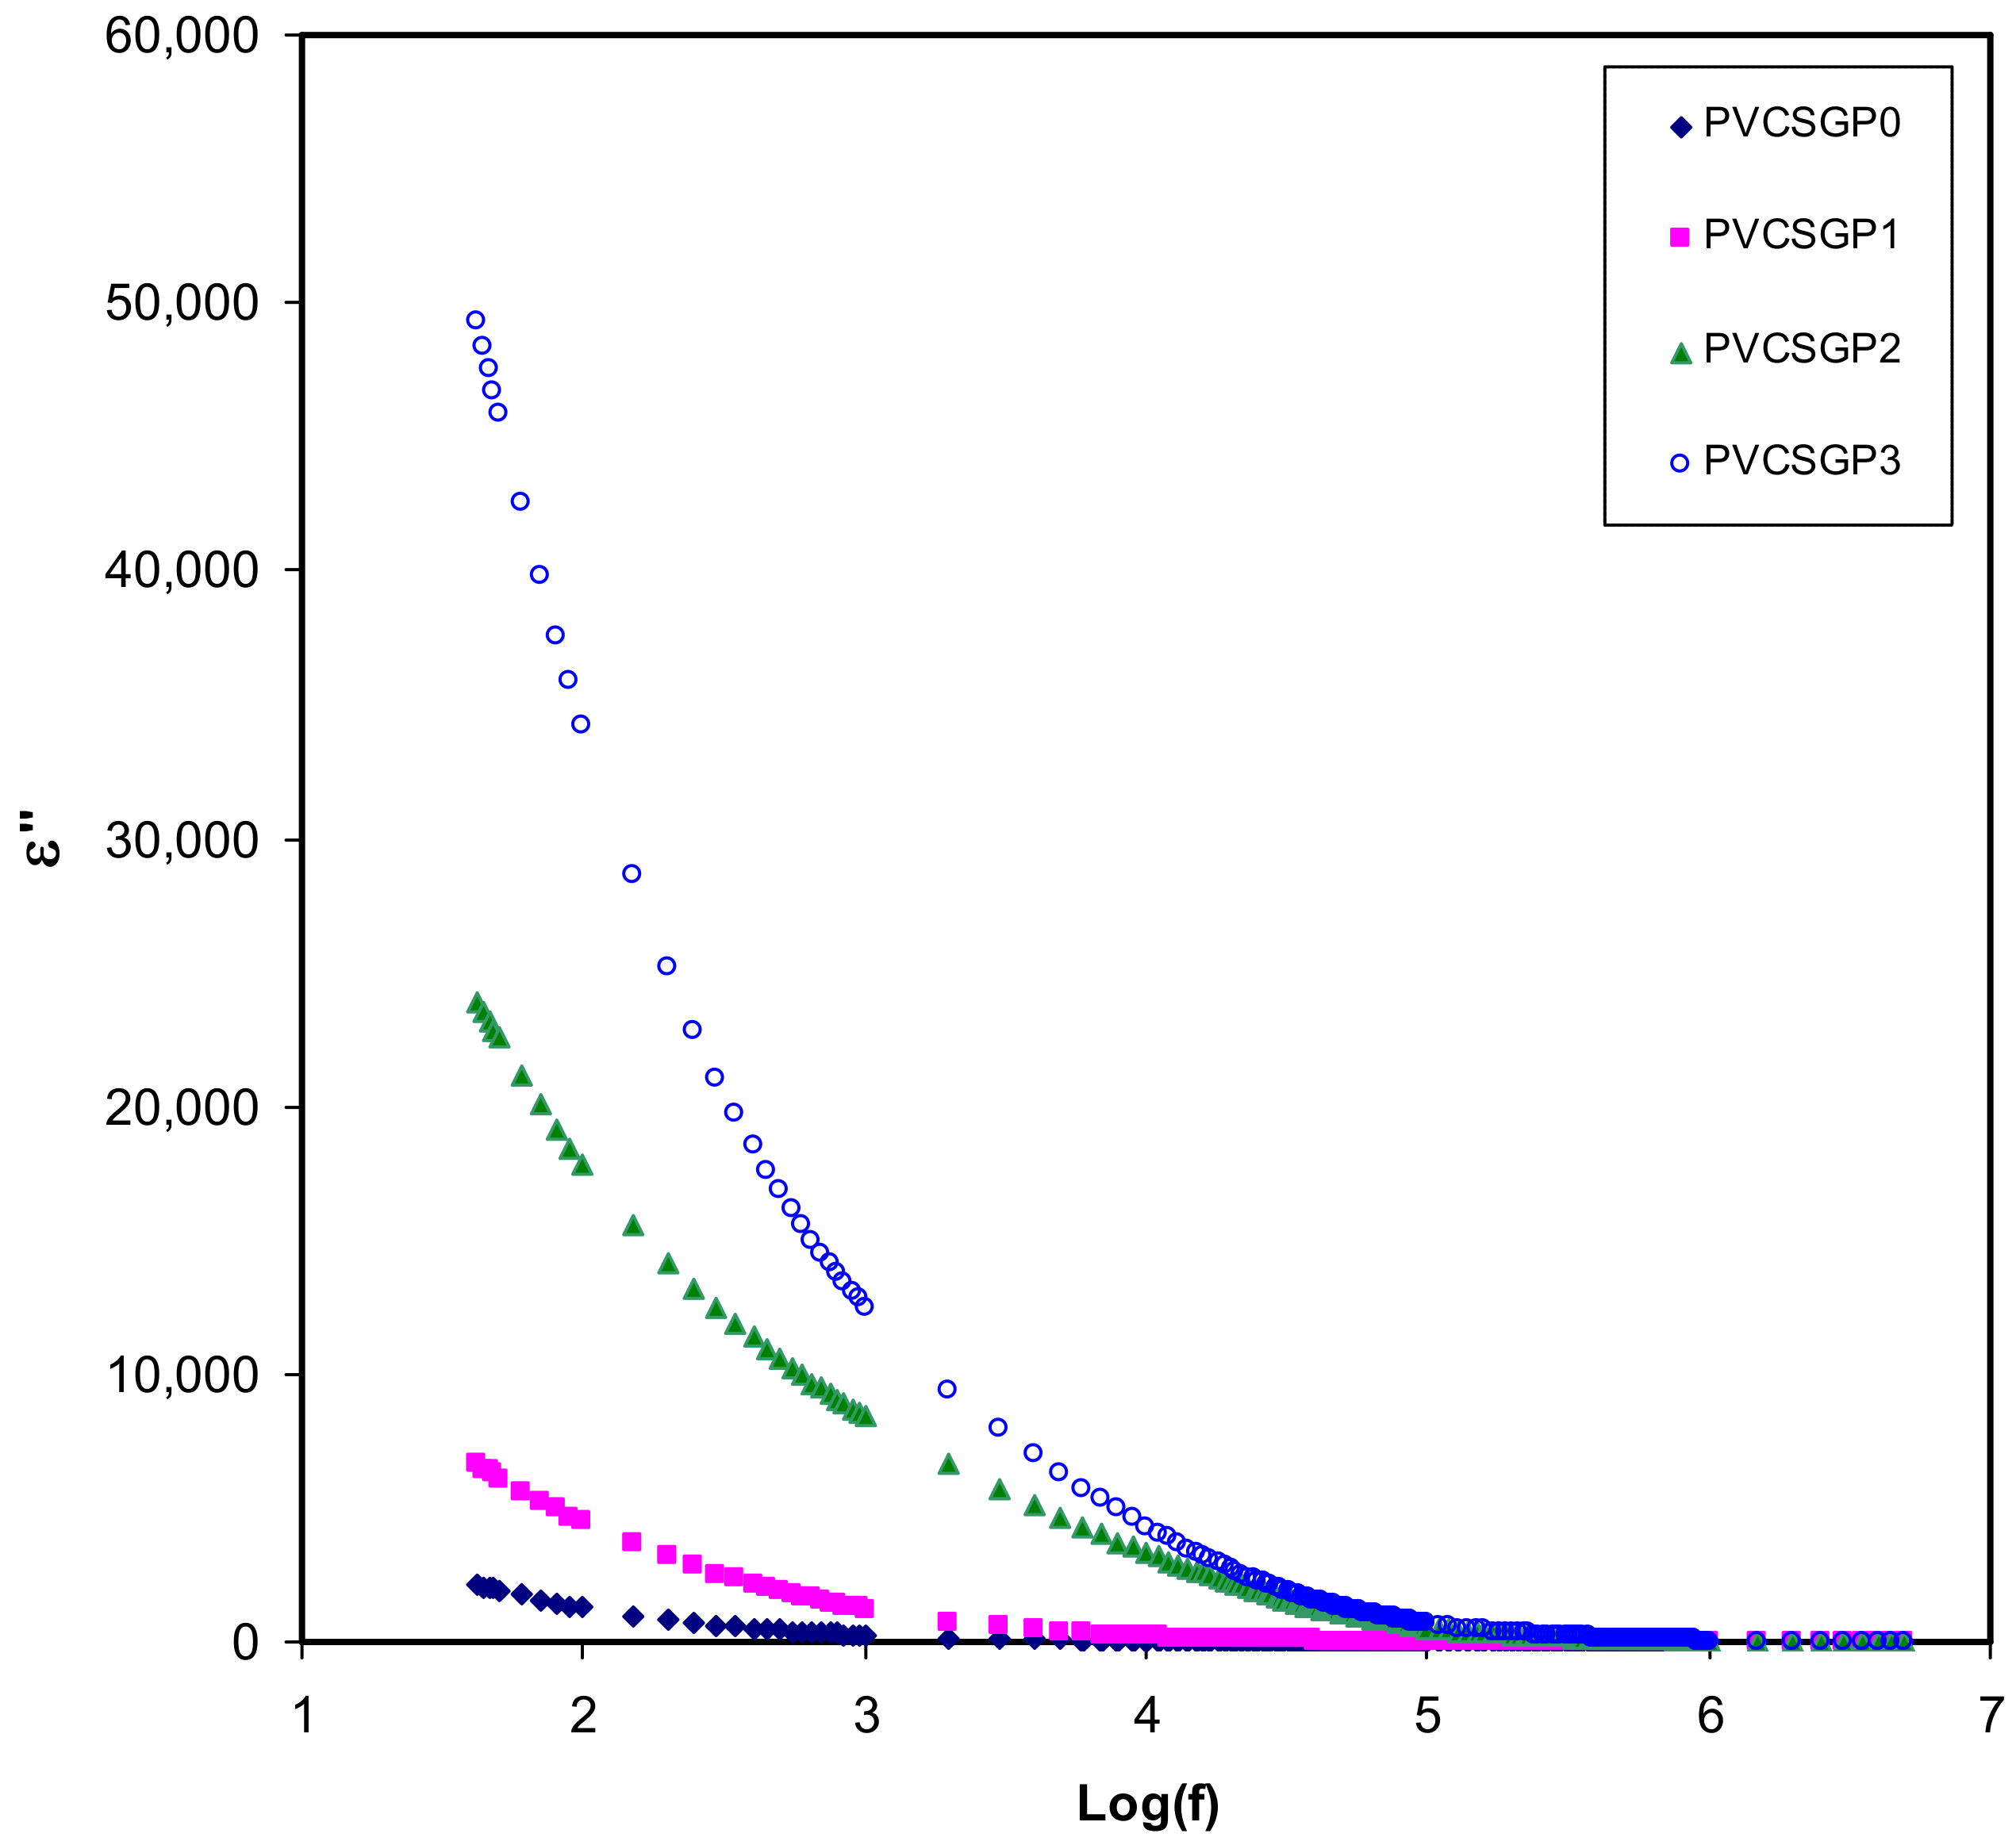
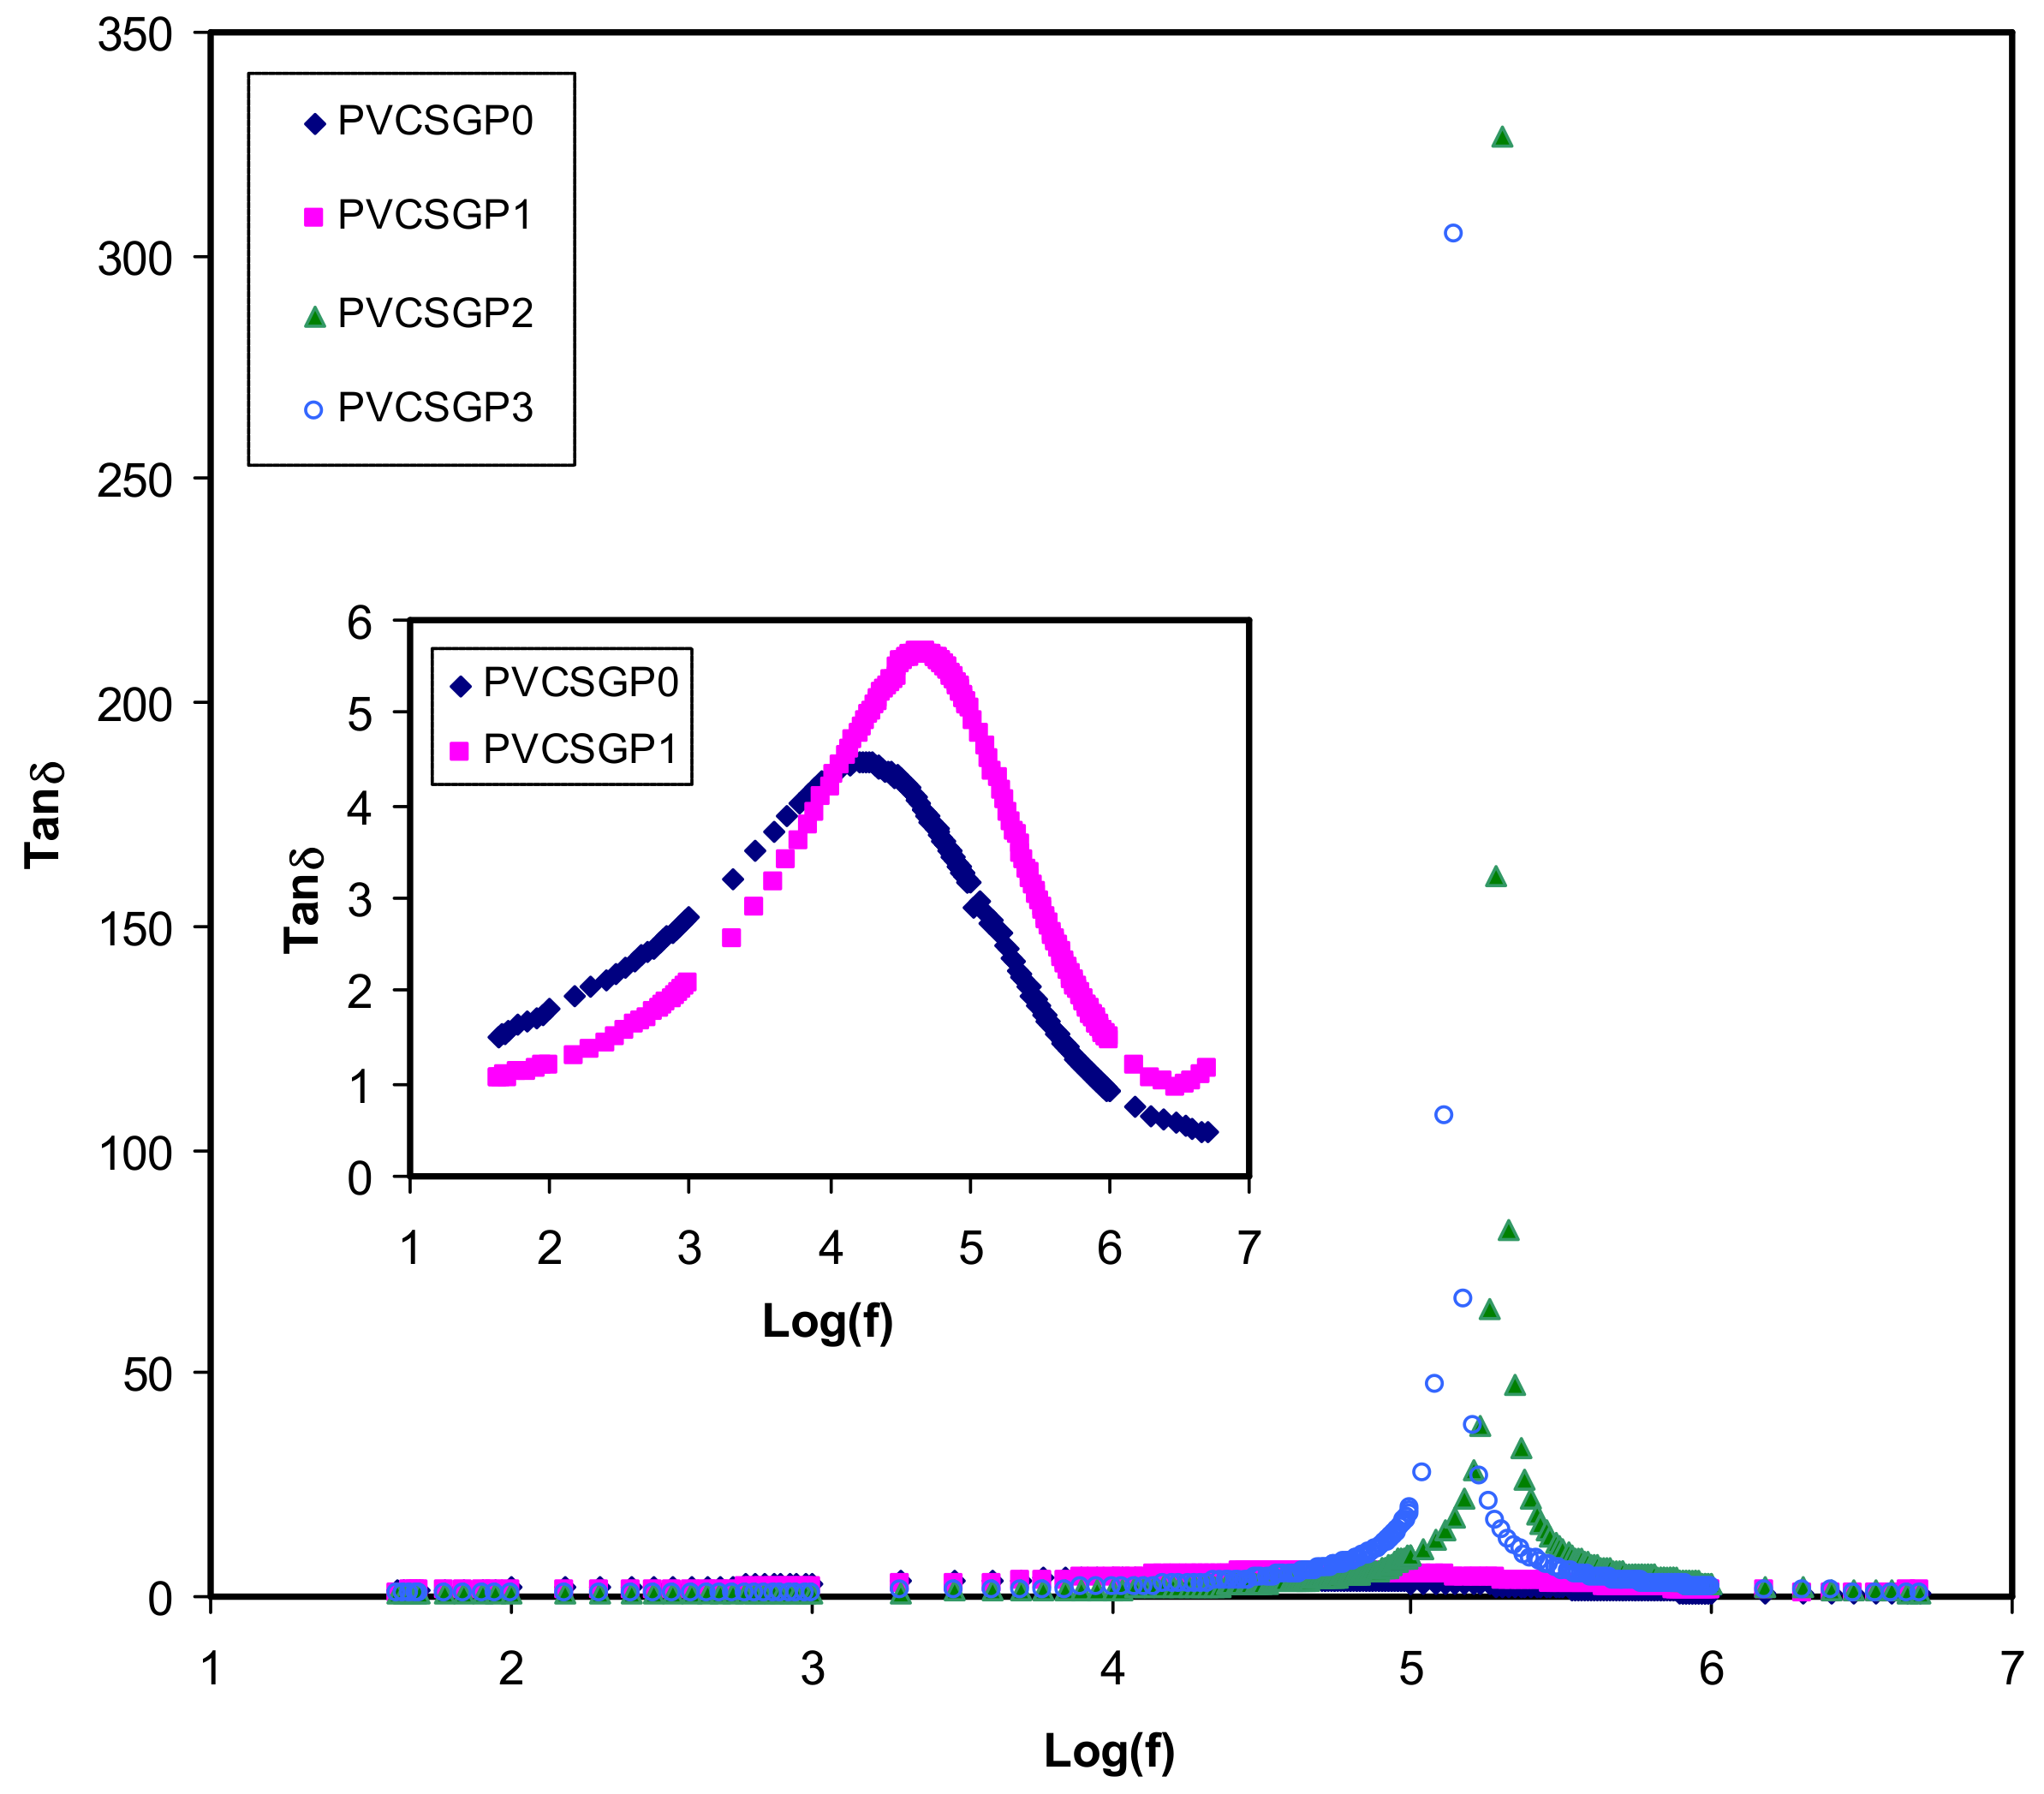
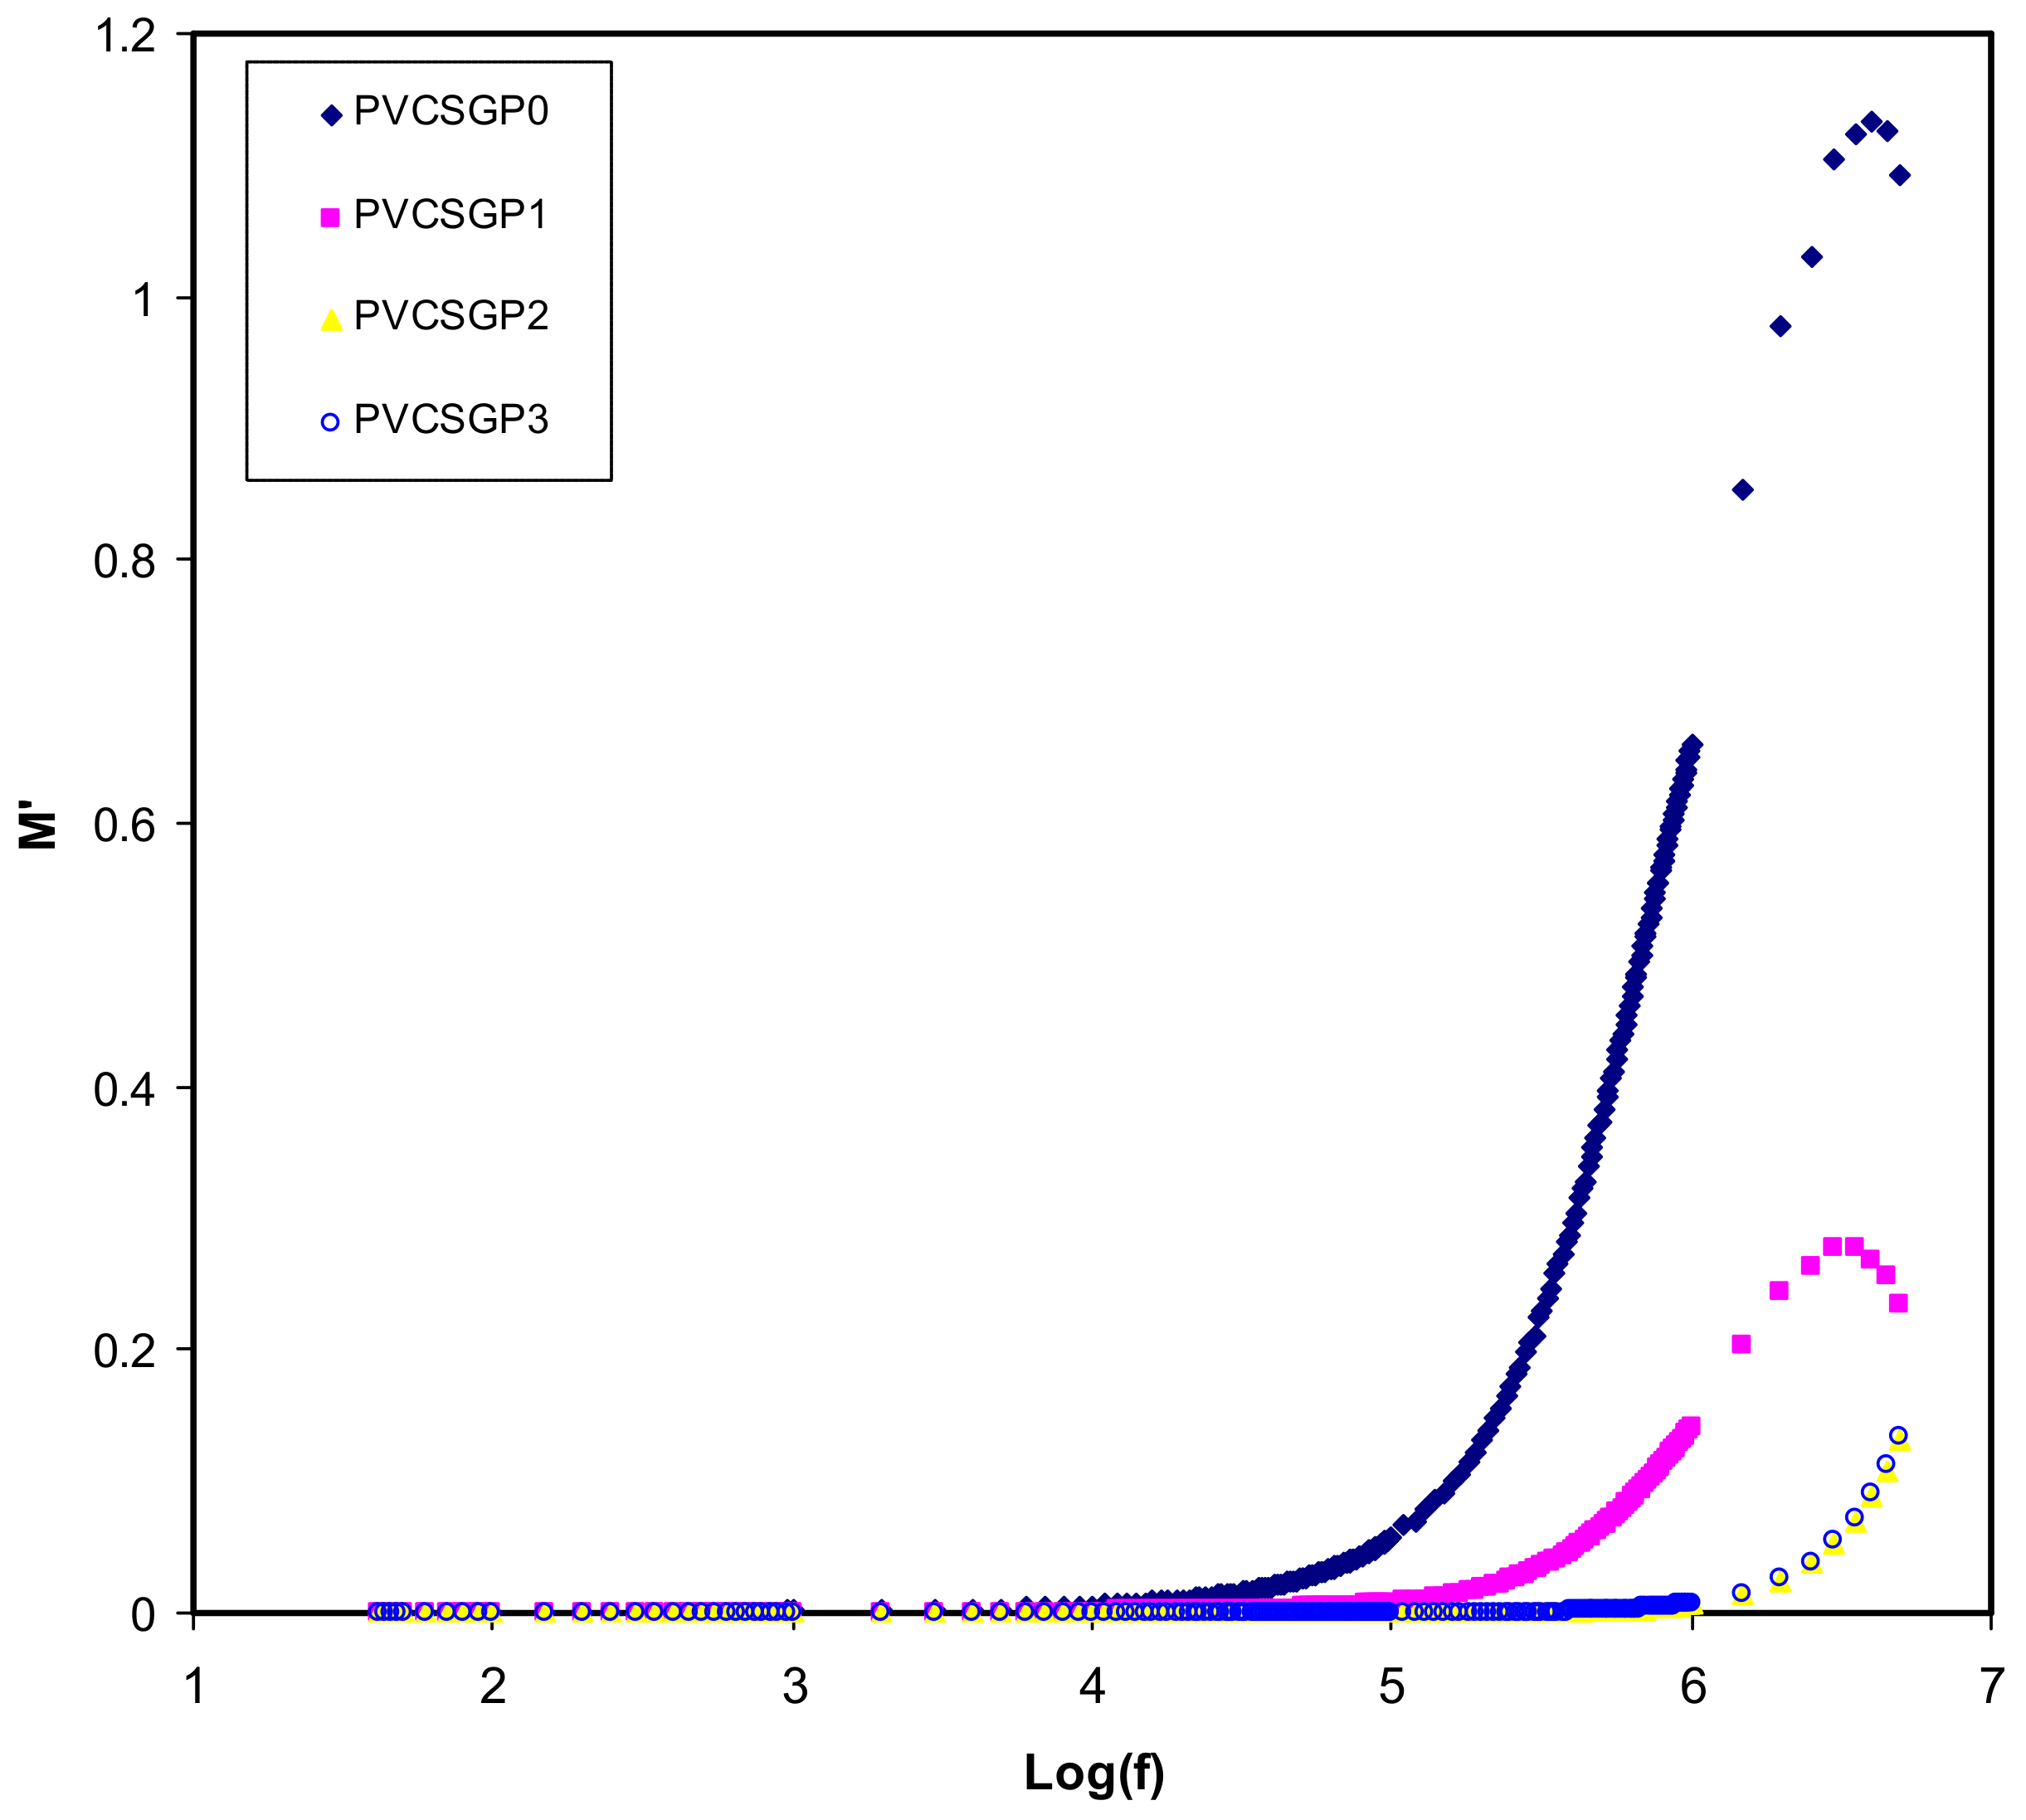
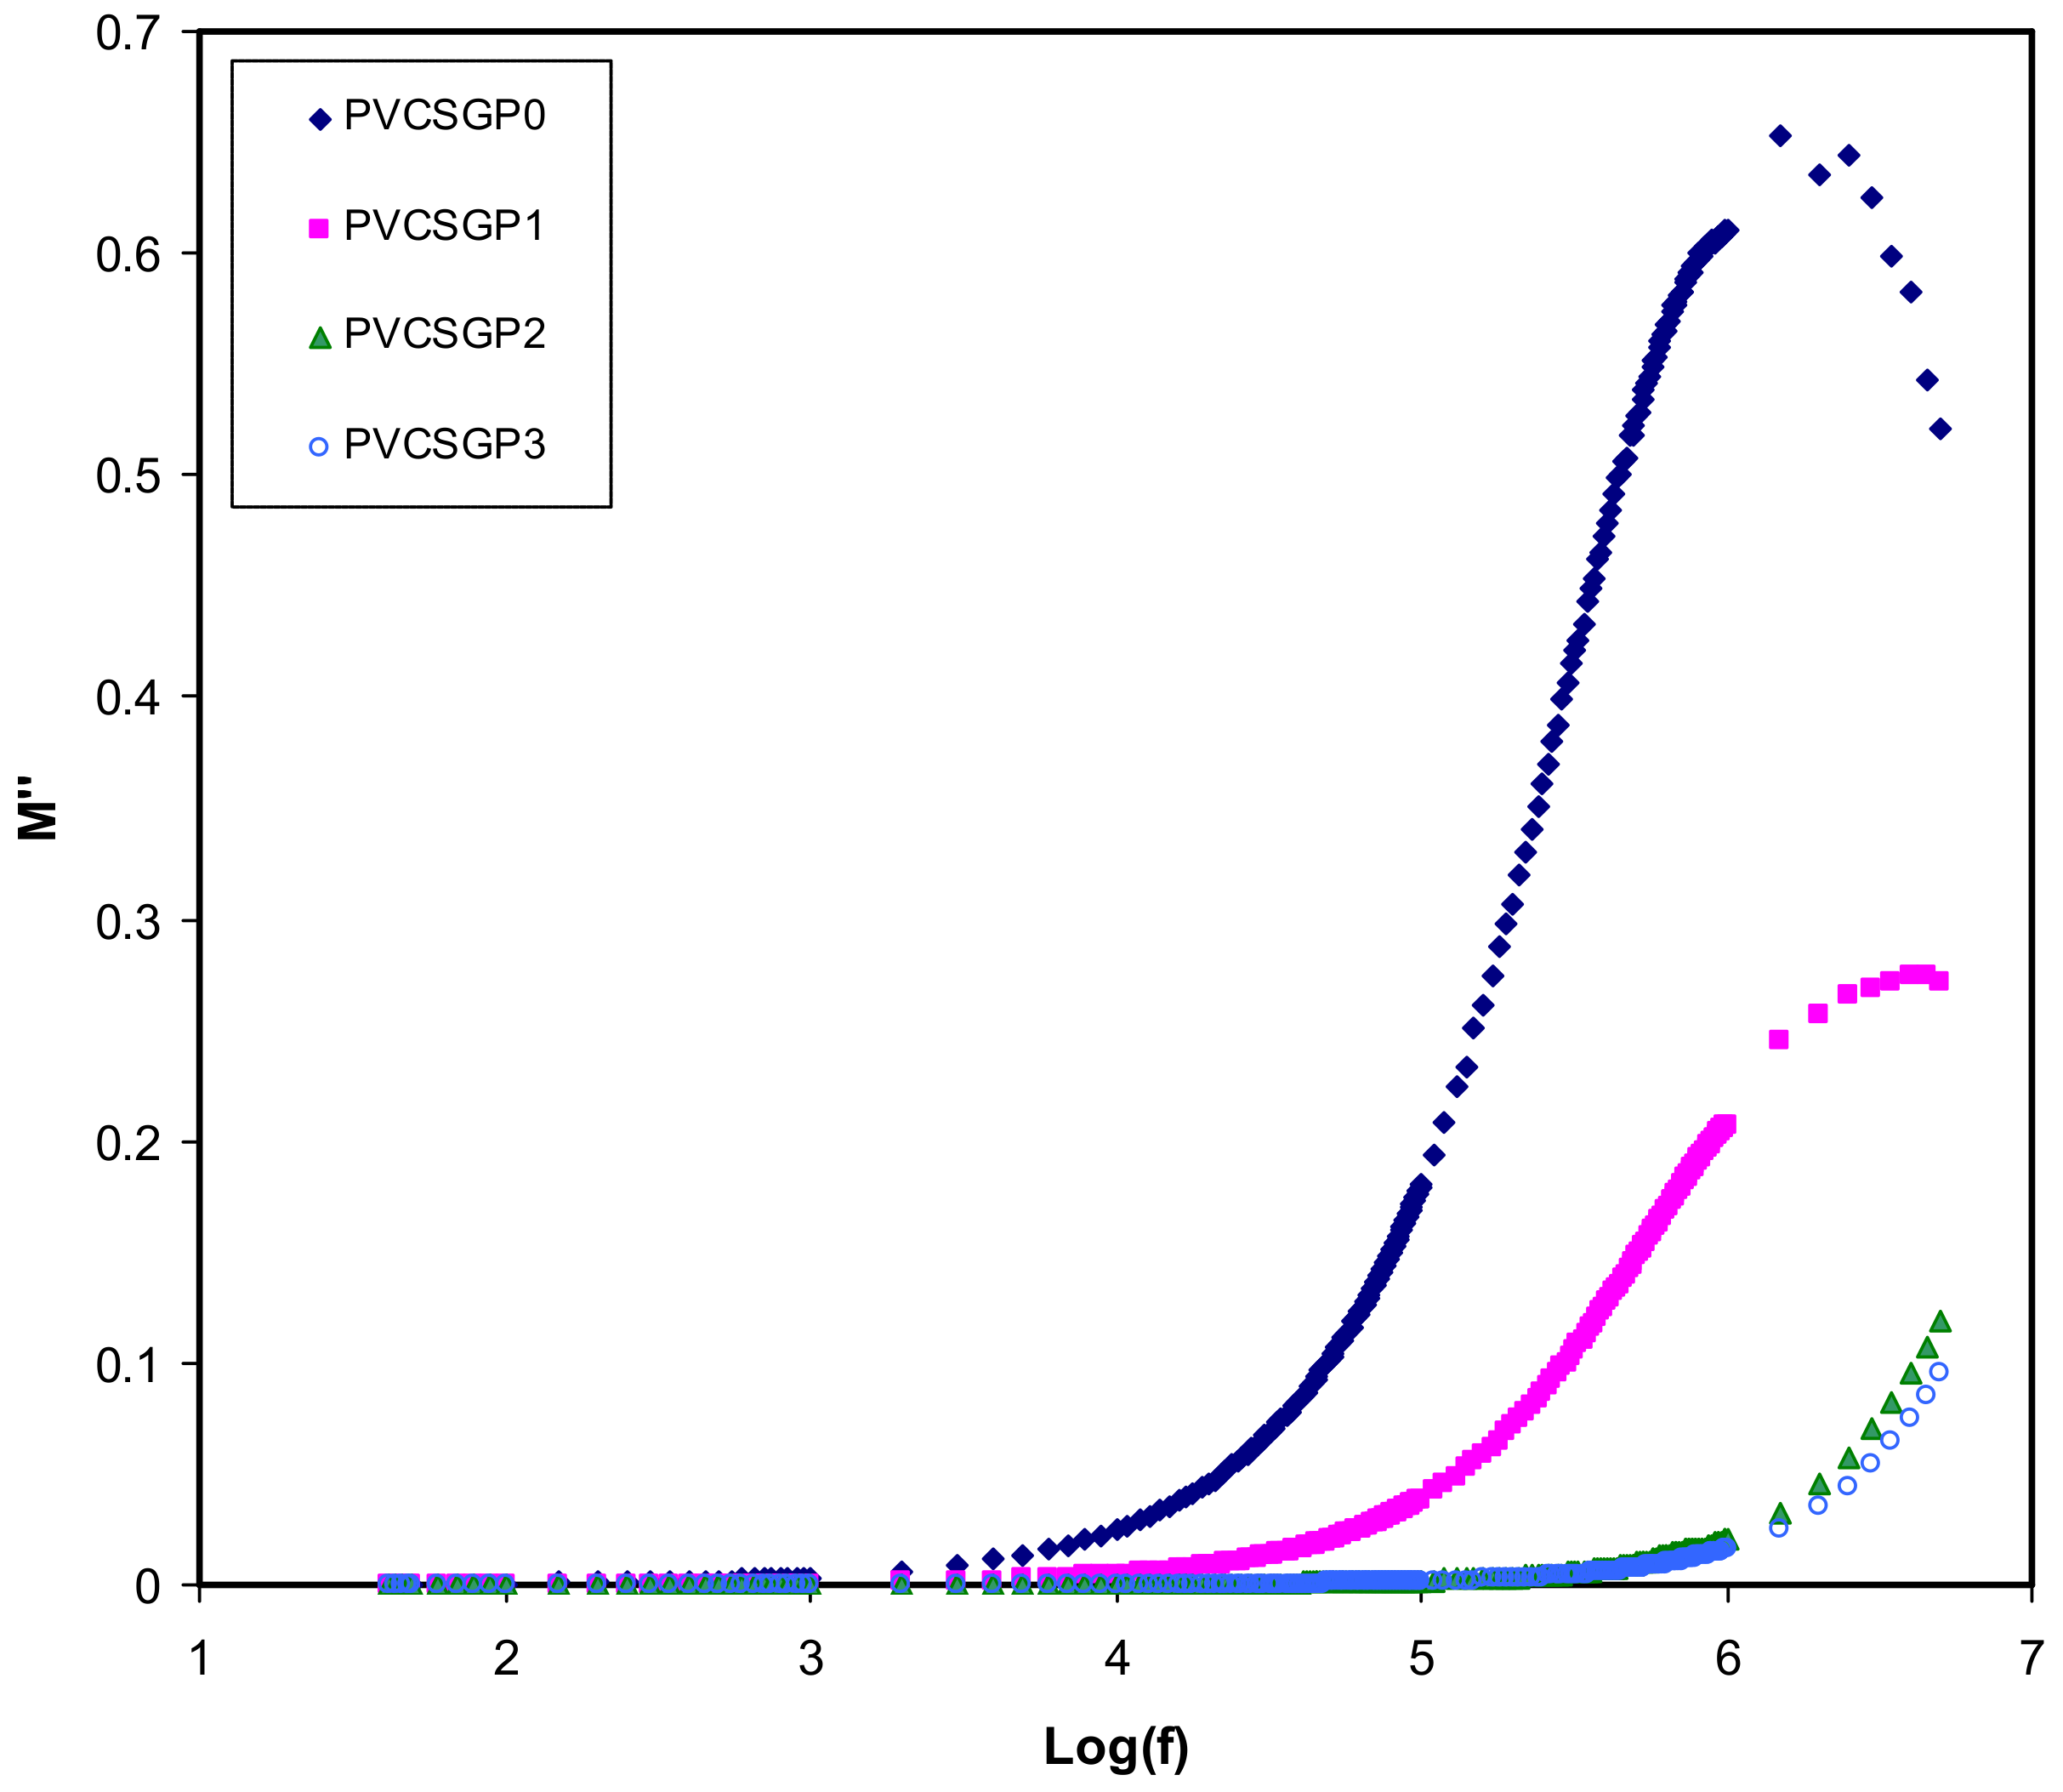
3.3. Dielectric Properties

To study the composition and physical and electrochemical properties of pure polymers and their corresponding blends, it is of great importance to evaluate the dielectric relaxation. It also is necessary and helpful to perform the dielectric relaxation and dipole relaxation measurements of polymer electrolytes over a wide frequency range [3,6,23].
The dielectric spectroscopy is one of the useful and powerful techniques in dealing with the mechanism of ion transport [3,6,23,64]. To this aim, the complex dielectric constant (ε*) and complex electric modulus (M*) have to be measured. Figure 3 and Figure 4 show the dielectric constant (ε′) and dielectric loss (ε″) versus the frequency of electrolyte systems at room temperature. The values of ε′ and ε″ have been calculated using the equations shown below [3,6,23,67]:
ε =   Z ω C 0   Z 2 +   Z 2  
ε =   Z ω C 0     Z 2 +   Z 2  
where ω is the angular frequency, and Co is the vacuum capacitance (Co = εoA/d, where εo is a free space permittivity, 8.854187 × 10⁻¹² F m−1). The value of ε’ and ε″ is relatively large within the low-frequency range; in contrast, as it is roughly a plateau at a higher frequency one. Interestingly, at low frequencies, charge accumulation from free mobile ions at the electrode–electrolyte interfacial region occurs as a result of electrode polarization, resulting in a thin layer of capacitance [68,69]. Contrarily, the reversal of the applied electric field is quick, and the majority of the ions may stay on in the bulk of the sample. This leads to lessening of the electrode polarization, decreasing the ε’ and ε″ value [3,6,23,70].
It is seen, as glycerol concentration is increased, the ε′ increases. This is owing to the increase in the number of charge carriers causing greater polarization [27,71,72,73]. Based on these results, it is easy to manipulate the conductivity of polymer electrolytes using the dielectric constant. It has already been proved that ε′ and the density of charge carriers (ni) are strongly associated with each other using a mathematical relationship, n i = n o exp ( U / ε K B T ) , where U is the energy of dissociation [3,23,72,73]. Briefly, in other words, a decrease in ε′ results in a decrease in DC conductivity. The density of the charge carrier (ni) and their mobility (µi) (σ = Σ qniµi), where q is the charge on the ion carriers, are two factors that govern the DC ionic conductivity of polymer ion-conducting electrolytes [3,23]. Thereby, a precise study of ε′ is useful in that one can achieve a complete understanding of the electrical properties of polymer electrolytes, particularly the conductivity.
The peaks of high electrically conductive polymer electrolyte systems are caused by either permanent or induced dipoles. These dipoles could be masked by the polarization relaxation of mobile charged species present in the material and, thus, the low-frequency relaxation peaks disappear [74,75]. Figure 5 shows the dielectric loss tangent (tan δ) versus frequency can be used to understand the relaxation process. Koop’s phenomenological model is used in the interpretation of the shape of tan δ [73,76]. According to the principles of the model, tan δ increases with increasing frequency until reaching a maximum value and then starts to decrease. It is explained based on the fact that at a low-frequency region, where tan δ increases, the ohmic component of the created current rises sharply compared to its capacitive component (XC = 1/2πfC). To contrast, at the high-frequency region, where tan δ decreases, the ohmic component is virtually frequency independent, and the capacitive component increases, resulting in a small value of XC [73,76,77]. Besides, the non-Debye type behavior of the relaxation process is evidenced by the broad nature of the tan δ peaks [41,78]. The complex impedance function is mathematically specified as Z*= R − jXC, where; R and XC are the resistor element and the capacitive element, respectively [73]. The above mathematical function of the impedance makes it clear that at low frequency the capacitive component is dominant and, thus, a major current passes through the resistor element. It is seen that from the tan δ = ε″/ε′ relationship, the tan δ is directly proportional to ε″.
Viewing the electric modulus, one can study the dielectric response that results from ion relaxation in which the electrode polarization effects can be suppressed; in other words, small features at the high-frequency region are recognized [79]. The impedance data correlate the real and imaginary parts of the electric modulus with each other through the equations shown below [10,47],
M = ω C 0 Z
M =   ω C 0 Z
Figure 6 and Figure 7 exhibit the frequency-dependence of real and imaginary parts corresponding to M′ and M″, respectively, of the plot of the electrical modulus. The data points of the real part of the modulus spectra are located in the low-frequency region. This could be due to the large capacitance associated with the electrodes that facilitate the migration of the ion conduction process. It is seen that M′ reaches a maximum saturation level in the high-frequency region. Occurring at the high-frequency region, the ε decreases to a minimum value and, thus, M′ becomes maximum (M = 1/ε) [80], in other words. A dispersion in M′ is observed when the frequency is increased, suggesting the non-Debye behavior of the samples [81]. The imaginary part of the modulus spectra is presented in Figure 7. It is seen that even at PVCSGP0 and PVCSGP1, the conductivity relaxation peaks appear. It also is notable that there is a shift of peak position to the higher frequency region with the addition of further glycerol concentration.
Fortunately, the electrical properties are supported by the XRD results. Presumably, in the M″ spectra, some peaks would be concerning the translational ion dynamics and also reflect the conductivity relaxation of the mobile ions. During the amorphous phase, the segmental motion of the polymeric chain lowers the relaxation time and increases the ion transport process. To pinpoint, a mathematical relationship of τ = 1/2πfmax, indicates that τ is the relaxation time of the ionic charge carriers [82]. Figure 7 shows the shift of the relaxation peaks to the lower frequency side. This is owing to the addition of glycerol that causes an increase in ionic conductivity that consequently reduces the relaxation time.

4. Conclusions

PVA-CS-NH4I glycerol-based plasticized electrolytes were successfully fabricated via the solution cast technique. The XC was observed to decrease with increasing plasticizer concentration. To attain more insight into the electrical properties of the films, the EIS spectra were fitted with electrical equivalent circuits (EECs). The EIS spectra analysis showed a decrease in bulk resistance, which reveals an increase of free ion carriers. The maximum conducting plasticized system showed a high conductivity of (1.37 × 10⁻⁴) S/cm, which is eligible for applications in energy storage devices, for example, supercapacitors and batteries. The outcome from the XRD examination indicated that the maximum conducting plasticized system exhibited the minimum XC, which was determined to be 1.34. The XRD outcomes also can be associated to the trend in the XC with a variation in the conductivity of the electrolyte. The conductivity trend was further confirmed via dielectric examination. Concerning the region of low frequencies, large values of dielectric loss and dielectric constant were obtained owing to electrode polarization. Regarding the electric modulus and loss tangent plots, the distribution of relaxation times associated with conducting ions were concluded.

Author Contributions

Conceptualization, S.B.A.; Formal analysis, S.B.A., A.S.M. and M.A.B.; Funding acquisition, E.M.A.D.; Investigation, A.S.M.; Methodology, A.S.M.; Project administration, S.B.A., E.M.A.D. and R.M.A.; Supervision, R.M.A.; Validation, S.B.A., A.S.M. and M.A.B.; Writing—original draft, S.B.A.; Writing—review & editing, E.M.A.D., M.A.B. and R.M.A. All authors have read and agreed to the published version of the manuscript.

Funding

The authors appreciatively acknowledge the financial support for this work by the Ministry of Higher Education & Scientific Research-Kurdish National Research Council (KNRC), Kurdistan Regional Government-Iraq. The financial support by the University of Sulaimani and Komar University of Science and Technology are impressively respected.

Conflicts of Interest

The authors declare no conflict of interest.

References

  1. Mustafa, M.S.; Ghareeb, H.O.; Aziz, S.B.; Brza, M.A.; Al-Zangana, S.; Hadi, J.M.; Kadir, M.F.Z. Electrochemical Characteristics of Glycerolized PEO-Based Polymer Electrolytes. Membranes 2020, 10, 116. [Google Scholar] [CrossRef] [PubMed]
  2. Johnsi, M.; Suthanthiraraj, S.A. Compositional effect of ZrO2 nanofillers on a PVDF-co-HFP based polymer electrolyte system for solid state zinc batteries. Chin. J. Polym. Sci. 2016, 34, 332–343. [Google Scholar] [CrossRef]
  3. Aziz, S.B. Li+ ion conduction mechanism in poly (ε-caprolactone)-based polymer electrolyte. Iran. Polym. J. 2013, 22, 877–883. [Google Scholar] [CrossRef] [Green Version]
  4. Rathod, S.G.; Bhajantri, R.F.; Ravindrachary, V.; Poojary, B.; Pujari, P.; Sheela, T.; Naik, J. Influence of transport parameters on conductivity of lithium perchlorate-doped poly(vinyl alcohol)/chitosan composites. J. Elastomers Plast. 2016, 48, 442–455. [Google Scholar] [CrossRef]
  5. Shukla, N.; Thakur, A.K.; Shukla, A.; Marx, D.T. Ion conduction mechanism in solid polymer electrolyte: An applicability of almond-west formalism. Int. J. Electrochem. Sci. 2014, 9, 7644–7659. [Google Scholar]
  6. Aziz, S.B.; Brza, M.; Saed, S.R.; Hamsan, M.; Kadir, M. Ion association as a main shortcoming in polymer blend electrolytes based on CS:PS incorporated with various amounts of ammonium tetrafluoroborate. J. Mater. Res. Technol. 2020, 9, 5410–5421. [Google Scholar] [CrossRef]
  7. Muthuvinayagam, M.; Gopinathan, C. Characterization of proton conducting polymer blend electrolytes based on PVdF-PVA. Polymer 2015, 68, 122–130. [Google Scholar] [CrossRef]
  8. Aziz, S.B.; Abdullah, R.M.; Rasheed, M.A.; Ahmed, H.M. Role of Ion Dissociation on DC Conductivity and Silver Nanoparticle Formation in PVA:AgNt Based Polymer Electrolytes: Deep Insights to Ion Transport Mechanism. Polymer 2017, 9, 338. [Google Scholar] [CrossRef] [Green Version]
  9. Hamsan, M.H.; Aziz, S.B.; Shukur, M.F.; Kadir, M. Protonic cell performance employing electrolytes based on plasticized methylcellulose-potato starch-NH4NO3. Ionics 2019, 25, 559–572. [Google Scholar] [CrossRef]
  10. Aziz, S.B.; Karim, W.O.; Ghareeb, H.O. The deficiency of chitosan:AgNO3 polymer electrolyte incorporated with titanium dioxide filler for device fabrication and membrane separation technology. J. Mater. Res. Technol. 2020, 9, 4692–4705. [Google Scholar] [CrossRef]
  11. Hadi, J.M.; Aziz, S.B.; Mustafa, M.S.; Hamsan, M.H.; Abdulwahid, R.T.; Kadir, M.F.; Ghareeb, H.O. Role of nano-capacitor on dielectric constant enhancement in PEO:NH4SCN:xCeO2 polymer nano-composites: Electrical and electrochemical properties. J. Mater. Res. Technol. 2020, 9, 9283–9294. [Google Scholar] [CrossRef]
  12. Cruz-Pacheco, A.F.; Paredes-Madrid, L.; Orozco, J.; Gómez-Cuaspud, J.A.; Batista-Rodríguez, C.R.; Gómez, C.A.P. Assessing the Influence of the Sourcing Voltage on Polyaniline Composites for Stress Sensing Applications. Polymer 2020, 12, 1164. [Google Scholar] [CrossRef] [PubMed]
  13. Mahmoud, A.M.; Nasrat, L.S.; Ibrahim, A.A.A. Dielectric Properties of Polymer Blends Using Least Square Method. EJERS 2017, 2, 1–8. [Google Scholar] [CrossRef] [Green Version]
  14. Aziz, S.B.; Ahmed, H.M.; Hussein, A.M.; Fathulla, A.B.; Wsw, R.M.; Hussein, R.T. Tuning the absorption of ultraviolet spectra and optical parameters of aluminum doped PVA based solid polymer composites. J. Mater. Sci. Mater. Electron. 2015, 26, 8022–8028. [Google Scholar] [CrossRef]
  15. Aziz, S.B. Modifying poly (vinyl alcohol)(PVA) from insulator to small-band gap polymer: A novel approach for organic solar cells and optoelectronic devices. J. Electron. Mater. 2016, 45, 736–745. [Google Scholar] [CrossRef]
  16. Aziz, S.B.; Hamsan, M.H.; Karim, W.O.; Marif, A.S.; Abdulwahid, R.T.; Kadir, M.F.Z.; Brza, M.A. Study of impedance and solid-state double-layer capacitor behavior of proton (H+)-conducting polymer blend electrolyte-based CS:PS polymers. Ionics 2020, 26, 1–15. [Google Scholar] [CrossRef]
  17. Aziz, S.B.; Hamsan, M.; Brza, M.; Kadir, M.; Muzakir, S.; Abdulwahid, R.T. Effect of glycerol on EDLC characteristics of chitosan:methylcellulose polymer blend electrolytes. J. Mater. Res. Technol. 2020, 9, 8355–8366. [Google Scholar] [CrossRef]
  18. Hirase, R.; Higashiyama, Y.; Mori, M.; Takahara, Y.; Yamane, C. Hydrated salts as both solvent and plasticizer for chitosan. Carbohydr. Polym. 2010, 80, 993–996. [Google Scholar] [CrossRef]
  19. Aziz, S.B.; Abidin, Z.H.Z.; Kadir, M.F.Z. Innovative method to avoid the reduction of silver ions to silver nanoparticles (Ag+-> Ag degrees) in silver ion conducting based polymer electrolytes. Phys. Scr. 2015, 90, 035808. [Google Scholar] [CrossRef]
  20. Trung, T.S.; Thein-Han, W.W.; Qui, N.T.; Ng, C.-H.; Stevens, W.F. Functional characteristics of shrimp chitosan and its membranes as affected by the degree of deacetylation. Bioresour. Technol. 2006, 97, 659–663. [Google Scholar] [CrossRef]
  21. Aziz, S.B.; Abidin, Z.; Arof, A.K. Effect of silver nanoparticles on the DC conductivity in chitosan–silver triflate polymer electrolyte. Phys. B Condens. Matter 2010, 405, 4429–4433. [Google Scholar] [CrossRef]
  22. Agrawal, P.; Strijkers, G.J.; Nicolay, K. Chitosan-based systems for molecular imaging. Adv. Drug Deliv. Rev. 2010, 62, 42–58. [Google Scholar] [CrossRef] [PubMed]
  23. Aziz, S.B.; Abidin, Z.H.Z. Electrical and morphological analysis of chitosan:AgTf solid electrolyte. Mater. Chem. Phys. 2014, 144, 280–286. [Google Scholar] [CrossRef]
  24. Aziz, S.B.; Abidin, Z.H.Z. Electrical Conduction Mechanism in Solid Polymer Electrolytes: New Concepts to Arrhenius Equation. J. Soft Matter 2013, 2013, 1–8. [Google Scholar] [CrossRef]
  25. Aziz, S.B.; Hamsan, M.H.H.; Nofal, M.M.; San, S.; Abdulwahid, R.T.; Saeed, S.R.; Brza, M.A.; Kadir, M.; Mohammed, S.J.; Al-Zangana, S. From Cellulose, Shrimp and Crab Shells to Energy Storage EDLC Cells: The Study of Structural and Electrochemical Properties of Proton Conducting Chitosan-Based Biopolymer Blend Electrolytes. Polymers 2020, 12, 1526. [Google Scholar] [CrossRef]
  26. Cheng, M.; Deng, J.; Yang, F.; Gong, Y.; Zhao, N.; Zhang, X. Study on physical properties and nerve cell affinity of composite films from chitosan and gelatin solutions. Biomaterials 2003, 24, 2871–2880. [Google Scholar] [CrossRef]
  27. Asnawi, A.S.F.M.; Aziz, S.B.; Nofal, M.M.; Hamsan, M.H.; Brza, M.A.; Yusof, Y.M.; Abdulwahid, R.T.; Muzakir, S.K.; Kadir, M. Glycerolized Li+ Ion Conducting Chitosan-Based Polymer Electrolyte for Energy Storage EDLC Device Applications with Relatively High Energy Density. Polymers 2020, 12, 1433. [Google Scholar] [CrossRef]
  28. El-Sawy, N.M.; El-Rehim, H.A.A.; Elbarbary, A.M.; Hegazy, E.-S.A. Radiation-induced degradation of chitosan for possible use as a growth promoter in agricultural purposes. Carbohydr. Polym. 2010, 79, 555–562. [Google Scholar] [CrossRef]
  29. Asnawi, A.S.F.M.; Aziz, S.B.; Nofal, M.M.; Yusof, Y.M.; Brevik, I.; Hamsan, M.H.; Brza, M.A.; Abdulwahid, R.T.; Kadir, M. Metal Complex as a Novel Approach to Enhance the Amorphous Phase and Improve the EDLC Performance of Plasticized Proton Conducting Chitosan-Based Polymer Electrolyte. Membranes 2020, 10, 132. [Google Scholar] [CrossRef]
  30. Nagahama, H.; Maeda, H.; Kashiki, T.; Jayakumar, R.; Furuike, T.; Tamura, H. Preparation and characterization of novel chitosan/gelatin membranes using chitosan hydrogel. Carbohydr. Polym. 2009, 76, 255–260. [Google Scholar] [CrossRef]
  31. Aziz, S.B.; Hamsan, M.H.; Abdullah, R.M.; Kadir, M.F.Z. A Promising Polymer Blend Electrolytes Based on Chitosan: Methyl Cellulose for EDLC Application with High Specific Capacitance and Energy Density. Molecules 2019, 24, 2503. [Google Scholar] [CrossRef] [PubMed] [Green Version]
  32. Aziz, S.B.; Abdulwahid, R.T.; Hamsan, M.H.; Brza, M.A.; Abdullah, R.M.; Kadir, M.; Muzakir, S.K. Structural, Impedance, and EDLC Characteristics of Proton Conducting Chitosan-Based Polymer Blend Electrolytes with High Electrochemical Stability. Molecules 2019, 24, 3508. [Google Scholar] [CrossRef] [PubMed] [Green Version]
  33. Aziz, S.B.; Hamsan, M.H.; Nofal, M.M.; Karim, W.O.; Brevik, I.; Brza, M.A.; Abdulwahid, R.T.; Al-Zangana, S.; Kadir, M. Structural, Impedance and Electrochemical Characteristics of Electrical Double Layer Capacitor Devices Based on Chitosan: Dextran Biopolymer Blend Electrolytes. Polymers 2020, 12, 1411. [Google Scholar] [CrossRef] [PubMed]
  34. Aziz, S.B.; Hamsan, M.H.; Kadir, M.F.Z.; Karim, W.O.; Abdullah, R.M. Development of Polymer Blend Electrolyte Membranes Based on Chitosan: Dextran with High Ion Transport Properties for EDLC Application. Int. J. Mol. Sci. 2019, 20, 3369. [Google Scholar] [CrossRef] [PubMed] [Green Version]
  35. Mucha, M. Rheological properties of chitosan blends with poly(ethylene oxide) and poly(vinyl alcohol) in solution. React. Funct. Polym. 1998, 38, 19–25. [Google Scholar] [CrossRef]
  36. Kadir, M.; Majid, S.; Arof, A.K. Plasticized chitosan–PVA blend polymer electrolyte based proton battery. Electrochim. Acta 2010, 55, 1475–1482. [Google Scholar] [CrossRef]
  37. Lewandowska, K. Miscibility and thermal stability of poly(vinyl alcohol)/chitosan mixtures. Thermochim. Acta 2009, 493, 42–48. [Google Scholar] [CrossRef]
  38. Young, M.L.; Su, H.K.; Seon, J.K. Preparation and characteristics of b-chitin and poly(vinyl alcohol) blend. Polymer 1996, 7, 5897–5905. [Google Scholar]
  39. Kim, N.-W.; Park, J.-K.; Rhee, H.-W. Conductivity and thermal studies of solid polymer electrolytes prepared by blending poly(ethylene oxide), poly(oligo[oxyethylene]oxysebacoyl) and lithium perchlorate. Solid State Ionics 1996, 83, 49–56. [Google Scholar] [CrossRef]
  40. Yang, C.-C.; Wu, G. Study of microporous PVA/PVC composite polymer membrane and it application to MnO2 capacitors. Mater. Chem. Phys. 2009, 114, 948–955. [Google Scholar] [CrossRef]
  41. Hadi, J.M.; Aziz, S.B.; Nofal, M.M.; Hussen, S.A.; Hafiz, M.H.; Brza, M.A.; Abdulwahid, R.T.; Kadir, M.; Woo, H.J.; Hamsan, M.H. Electrical, Dielectric Property and Electrochemical Performances of Plasticized Silver Ion-Conducting Chitosan-Based Polymer Nanocomposites. Membranes 2020, 10, 151. [Google Scholar] [CrossRef] [PubMed]
  42. Hamsan, H.; Aziz, S.B.; Kadir, M.; Brza, M.; Karim, W.O. The study of EDLC device fabricated from plasticized magnesium ion conducting chitosan based polymer electrolyte. Polym. Test. 2020, 106714, 106714. [Google Scholar] [CrossRef]
  43. Chai, M.N.; Isa, M.I.N. Novel Proton Conducting Solid Bio-polymer Electrolytes Based on Carboxymethyl Cellulose Doped with Oleic Acid and Plasticized with Glycerol. Sci. Rep. 2016, 6, 27328. [Google Scholar] [CrossRef] [PubMed]
  44. Rao, V.; Ashokan, P.V.; Shridhar, M.H. Studies of dielectric relaxation and a.c. conductivity in cellulose acetate hydrogen phthalate–poly(methyl methacrylate) blends. Mater. Sci. Eng. 2000, A281, 213–220. [Google Scholar] [CrossRef]
  45. Aziz, S.B.; Brza, M.A.; Nofal, M.M.; Abdulwahid, R.T.; Hussen, S.A.; Hussein, A.M.; Karim, W.O. A Comprehensive Review on Optical Properties of Polymer Electrolytes and Composites. Materials 2020, 13, 3675. [Google Scholar] [CrossRef]
  46. Aziz, S.B. Study of Dielectric Properties and Ion Transport Parameters in Chitosan-Barium Nitrate Based Solid Polymer Electrolytes. Int. J. Electrochem. Sci. 2019, 14, 11580–11595. [Google Scholar] [CrossRef]
  47. Aziz, S.B. Role of Dielectric Constant on Ion Transport: Reformulated Arrhenius Equation. Adv. Mater. Sci. Eng. 2016, 2016, 1–11. [Google Scholar] [CrossRef] [Green Version]
  48. Marf, A.S.; Aziz, S.B.; Abdullah, R.M. Plasticized H+ ion-conducting PVA:CS-based polymer blend electrolytes for energy storage EDLC application. J. Mater. Sci. Mater. Electron. 2020. [Google Scholar] [CrossRef]
  49. Aziz, S.B.; Abidin, Z.H.Z. Ion-transport study in nanocomposite solid polymer electrolytes based on chitosan: Electrical and dielectric analysis. J. Appl. Polym. Sci. 2015, 132, 41774. [Google Scholar] [CrossRef]
  50. Belamie, E.; Domard, A.; Chanzy, H.; Giraud-Guille, M.-M. Spherulitic Crystallization of Chitosan Oligomers. Langmuir 1999, 15, 1549–1555. [Google Scholar] [CrossRef]
  51. Pawlicka, A.; Danczuk, M.; Wieczorek, W.; Zygadło-Monikowska, E. Influence of Plasticizer Type on the Properties of Polymer Electrolytes Based on Chitosan. J. Phys. Chem. A 2008, 112, 8888–8895. [Google Scholar] [CrossRef] [PubMed]
  52. Osorio-Madrazo, A.; David, L.; Trombotto, S.; Lucas, J.-M.; Peniche-Covas, C.; Domard, A. Highly crystalline chitosan produced by multi-steps acid hydrolysis in the solid-state. Carbohydr. Polym. 2011, 83, 1730–1739. [Google Scholar] [CrossRef]
  53. Aziz, S.B.; Abdullah, O.G.; Rasheed, M.A.; Ahmed, H.M. Effect of High Salt Concentration (HSC) on Structural, Morphological, and Electrical Characteristics of Chitosan Based Solid Polymer Electrolytes. Polymer 2017, 9, 187. [Google Scholar] [CrossRef] [PubMed] [Green Version]
  54. Marf, A.S.; Abdullah, R.M.; Aziz, S.B. Structural, Morphological, Electrical and Electrochemical Properties of PVA: CS-Based Proton-Conducting Polymer Blend Electrolytes. Membranes 2020, 10, 71. [Google Scholar] [CrossRef]
  55. Hemalatha, R.; Alagar, M.; Selvasekarapandian, S.; Sundaresan, B.; Moniha, V. Studies of proton conducting polymer electrolyte based on PVA, amino acid proline and NH4SCN. J. Sci. Adv. Mater. Dev. 2019, 4, 101–110. [Google Scholar] [CrossRef]
  56. Reddy, M.J.; Chu, P.P. Ion pair formation and its effect in PEO:Mg solid polymer electrolyte system. J. Power Sources 2002, 109, 340–346. [Google Scholar] [CrossRef]
  57. Francis, K.M.G.; Subramanian, S.; Shunmugavel, K.; Naranappa, V.; Pandian, S.S.M.; Nadar, S.C. Lithium Ion-Conducting Blend Polymer Electrolyte Based on PVA-PAN Doped with Lithium Nitrate. Polym. Technol. Eng. 2015, 55, 25–35. [Google Scholar] [CrossRef]
  58. Khiar, A.S.A.; Arof, A.K. Conductivity studies of starch-based polymer electrolytes. Ionics 2009, 16, 123–129. [Google Scholar] [CrossRef]
  59. Hema, M.; Selvasekerapandian, S.; Hirankumar, G. Vibrational and impedance spectroscopic analysis of poly(vinyl alcohol)-based solid polymer electrolytes. Ionics 2007, 13, 483–487. [Google Scholar] [CrossRef]
  60. Jacob, M. Effect of PEO addition on the electrolytic and thermal properties of PVDF-LiClO4 polymer electrolytes. Solid State Ionics 1997, 104, 267–276. [Google Scholar] [CrossRef]
  61. Fonseca, C.P.; Cavalcante, F., Jr.; Amaral, F.A.; Neves Souza, C.A.Z. Thermal and Conduction Properties of a PCL-biodegradable Gel Polymer Electrolyte with LiClO4, LiF3CSO3, and LiBF4 Salts. Int. J. Electrochem. Sci. 2007, 2, 252–263. [Google Scholar]
  62. Pradhan, D.K.; Choudhary, R.N.; Samantaray, B.K.; Karan, N.K.; Katiyar, R.S. Effect of plasticizer on structural and electrical properties of polymer nanocompsoite electrolytes. Int. J. Electrochem. Sci. 2007, 2, 861–871. [Google Scholar]
  63. Mohapatra, S.R.; Thakur, A.K.; Choudhary, R. Effect of nanoscopic confinement on improvement in ion conduction and stability properties of an intercalated polymer nanocomposite electrolyte for energy storage applications. J. Power Sources 2009, 191, 601–613. [Google Scholar] [CrossRef]
  64. Shukur, M.F.; Ithnin, R.; Kadir, M. Electrical characterization of corn starch-LiOAc electrolytes and application in electrochemical double layer capacitor. Electrochim. Acta 2014, 136, 204–216. [Google Scholar] [CrossRef]
  65. Aziz, S.B.; Abdullah, R.M. Crystalline and amorphous phase identification from the tanδ relaxation peaks and impedance plots in polymer blend electrolytes based on [CS:AgNt]x:PEO(x-1) (10 ≤ x ≤ 50). Electrochim. Acta 2018, 285, 30–46. [Google Scholar] [CrossRef]
  66. Teo, L.P.; Buraidah, M.H.; Nor, A.F.M.; Majid, S.R. Conductivity and dielectric studies of Li2SnO3. Ionics 2012, 18, 655–665. [Google Scholar] [CrossRef]
  67. Aziz, S.B.; Abdullah, R.M.; Kadir, M.; Ahmed, H.M. Non suitability of silver ion conducting polymer electrolytes based on chitosan mediated by barium titanate (BaTiO3) for electrochemical device applications. Electrochim. Acta 2019, 296, 494–507. [Google Scholar] [CrossRef]
  68. Aziz, S.B. Study of electrical percolation phenomenon from the dielectric and electric modulus analysis. Bull. Mater. Sci. 2015, 38, 1597–1602. [Google Scholar] [CrossRef]
  69. Navaratnam, S.; Ramesh, K.; Basirun, W.J. Investigation of ion conducting behaviour of composite chitosan based polymer electrolytes. Mater. Res. Innov. 2011, 15, s184–s186. [Google Scholar] [CrossRef]
  70. Aziz, S.B.; Abidin, Z.H.Z.; Arof, A.K. Influence of silver ion reduction on electrical modulus parameters of solid polymer electrolyte based on chitosan-silver triflate electrolyte membrane. Express Polym. Lett. 2010, 4, 300–310. [Google Scholar] [CrossRef]
  71. Shukur, M.F.; Ithnin, R.; Illias, H.; Kadir, M. Proton conducting polymer electrolyte based on plasticized chitosan–PEO blend and application in electrochemical devices. Opt. Mater. 2013, 35, 1834–1841. [Google Scholar] [CrossRef]
  72. Singh, M.; Singh, V.K.; Surana, K.; Bhattacharya, B.; Singh, P.K.; Rhee, H.-W. New polymer electrolyte for electrochemical application. J. Ind. Eng. Chem. 2013, 19, 819–822. [Google Scholar] [CrossRef]
  73. Aziz, S.B.; Marif, R.B.; Brza, M.A.; Hamsan, M.H.; Kadir, M.F.Z. Employing of Trukhan Model to Estimate Ion Transport Parameters in PVA Based Solid Polymer Electrolyte. Polymer 2019, 11, 1694. [Google Scholar] [CrossRef] [PubMed] [Green Version]
  74. Aziz, S.B.; Karim, W.O.; Brza, M.A.; Abdulwahid, R.T.; Saeed, S.R.; Al-Zangana, S.; Kadir, M. Ion Transport Study in CS: POZ Based Polymer Membrane Electrolytes Using Trukhan Model. Int. J. Mol. Sci. 2019, 20, 5265. [Google Scholar] [CrossRef] [Green Version]
  75. Jayathilaka, P.; Dissanayake, M.; Albinsson, I.; Mellander, B.-E. Dielectric relaxation, ionic conductivity and thermal studies of the gel polymer electrolyte system PAN/EC/PC/LiTFSI. Solid State Ionics 2003, 156, 179–195. [Google Scholar] [CrossRef]
  76. Aziz, S.B. The Study of Dielectric Properties and Conductivity Relaxation of Ion Conducting Chitosan:NaTf Based Solid Electrolyte. Int. J. Electrochem. Sci. 2018, 13, 10274–10288. [Google Scholar] [CrossRef]
  77. Koops, C.G. On the dispersion of resistivity and dielectric constant of some semiconductors at audio frequencies. Phys. Rev. 1951, A83, 121–124. [Google Scholar] [CrossRef]
  78. Louati, B.; Hlel, F.; Guidara, K. Ac electrical properties and dielectric relaxation of the new mixed crystal (Na0.8Ag0.2)2PbP2O7. J. Alloy. Compd. 2009, 486, 299–303. [Google Scholar] [CrossRef]
  79. Idris, N.H.; Senin, H.B.; Arof, A.K. Dielectric spectra of LiTFSI-doped chitosan/PEO blends. Ionics 2007, 13, 213–217. [Google Scholar] [CrossRef]
  80. Richert, R. The modulus of dielectric and conductive materials and its modification by high electric fields. J. Non Cryst. Solids 2002, 305, 29–39. [Google Scholar] [CrossRef]
  81. Aziz, S.B. Occurrence of electrical percolation threshold and observation of phase transition in chitosan(1−x):AgI x (0.05 ≤ x ≤ 0.2)-based ion-conducting solid polymer composites. Appl. Phys. A 2016, 122, 706. [Google Scholar] [CrossRef]
  82. Baskaran, R.; Selvasekarapandian, S.; Kuwata, N.; Kawamura, J.; Hattori, T. ac impedance, DSC and FT-IR investigations on (x)PVAc–(1−x)PVdF blends with LiClO4. Mater. Chem. Phys. 2006, 98, 55–61. [Google Scholar] [CrossRef]
Figure 1. XRD spectra for (a) pure PVA, (b) pure CS, (c) PVA:CS-blend (d) PVSCGP0, (e) PVSCGP1, (f) PVSCGP2, and (g) PVSCGP3 electrolyte films.
Polymers 12 02184 g001aPolymers 12 02184 g001bPolymers 12 02184 g001c
Figure 2. EIS plots for (a) PVSCGP0, (b) PVSCGP1, (c) PVSCGP2, and (d) PVSCGP3 electrolyte films.
Polymers 12 02184 g002aPolymers 12 02184 g002b
Figure 3. Dielectric constant versus log (f) for all polymer-blend electrolytes.
Polymers 12 02184 g003
Figure 4. Dielectric loss versus log (f) for all polymer-blend electrolytes.
Polymers 12 02184 g004
Figure 5. Tan δ versus log (f) for all polymer blend electrolytes.
Polymers 12 02184 g005
Figure 6. Real part of electric modulus versus log (f) for all polymer-blend electrolytes.
Polymers 12 02184 g006
Figure 7. Imaginary part of electric modulus versus log (f) for all polymer-blend electrolytes.
Polymers 12 02184 g007
Table 1. The degree of crystallinity is calculated from the deconvoluted XRD pattern.
ElectrolyteDegree of Crystallinity (%)
Pure PVA41.68
Pure CS15.97
PVA:CS15
PVSCGP014.39
PVSCGP111.01
PVSCGP27.37
PVSCGP31.34
Table 2. DC conductivity for the electrolyte systems at room temperature.
DesignationConductivity (S cm−1)
PVSCGP09.75 × 10−7
PVSCGP15.02 × 10−6
PVSCGP27.81 × 10−5
PVSCGP31.37 × 10−4
Table 3. The EEC fitting parameters for electrolyte systems at room temperature.
SampleK1 (F−1)K2 (F−1)C1 (F)C2 (F)
PVSCGP02 × 1082.3 × 1055 × 10−94.3 × 10⁻⁶
PVSCGP11.98 × 1081.7 × 1055.05 × 10−95.88 × 10⁻⁶
PVSCGP2 8.1 × 10⁴ 1.23 × 10⁻⁵
PVSCGP3 2.85 × 10⁴ 3.51 × 10⁻⁵

