The Effect of Silanization Temperature and Time on the Marching Modulus of Silica-Filled Tire Tread Compounds


Abstract

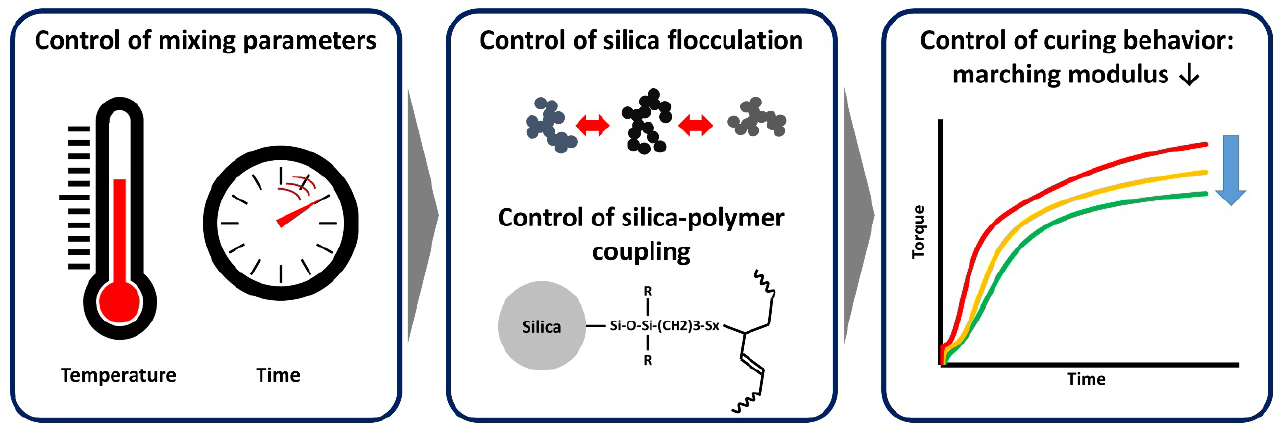
1. Introduction
2. Materials and Methods
2.1. Materials and Mixing Procedures
2.2. Filler–Filler Interaction Measured by Payne Effect
2.3. Filler Flocculation Rate
2.4. Filler–Polymer Coupling Rate
2.5. Cure Characteristics and Marching Modulus Intensity
2.6. Total Bound Rubber Content
2.7. Chemically and Physically Bound Rubber Content
3. Results and Discussion
3.1. Filler–Filler Interaction (Payne Effect) as a Function of Silanization Temperature and Time
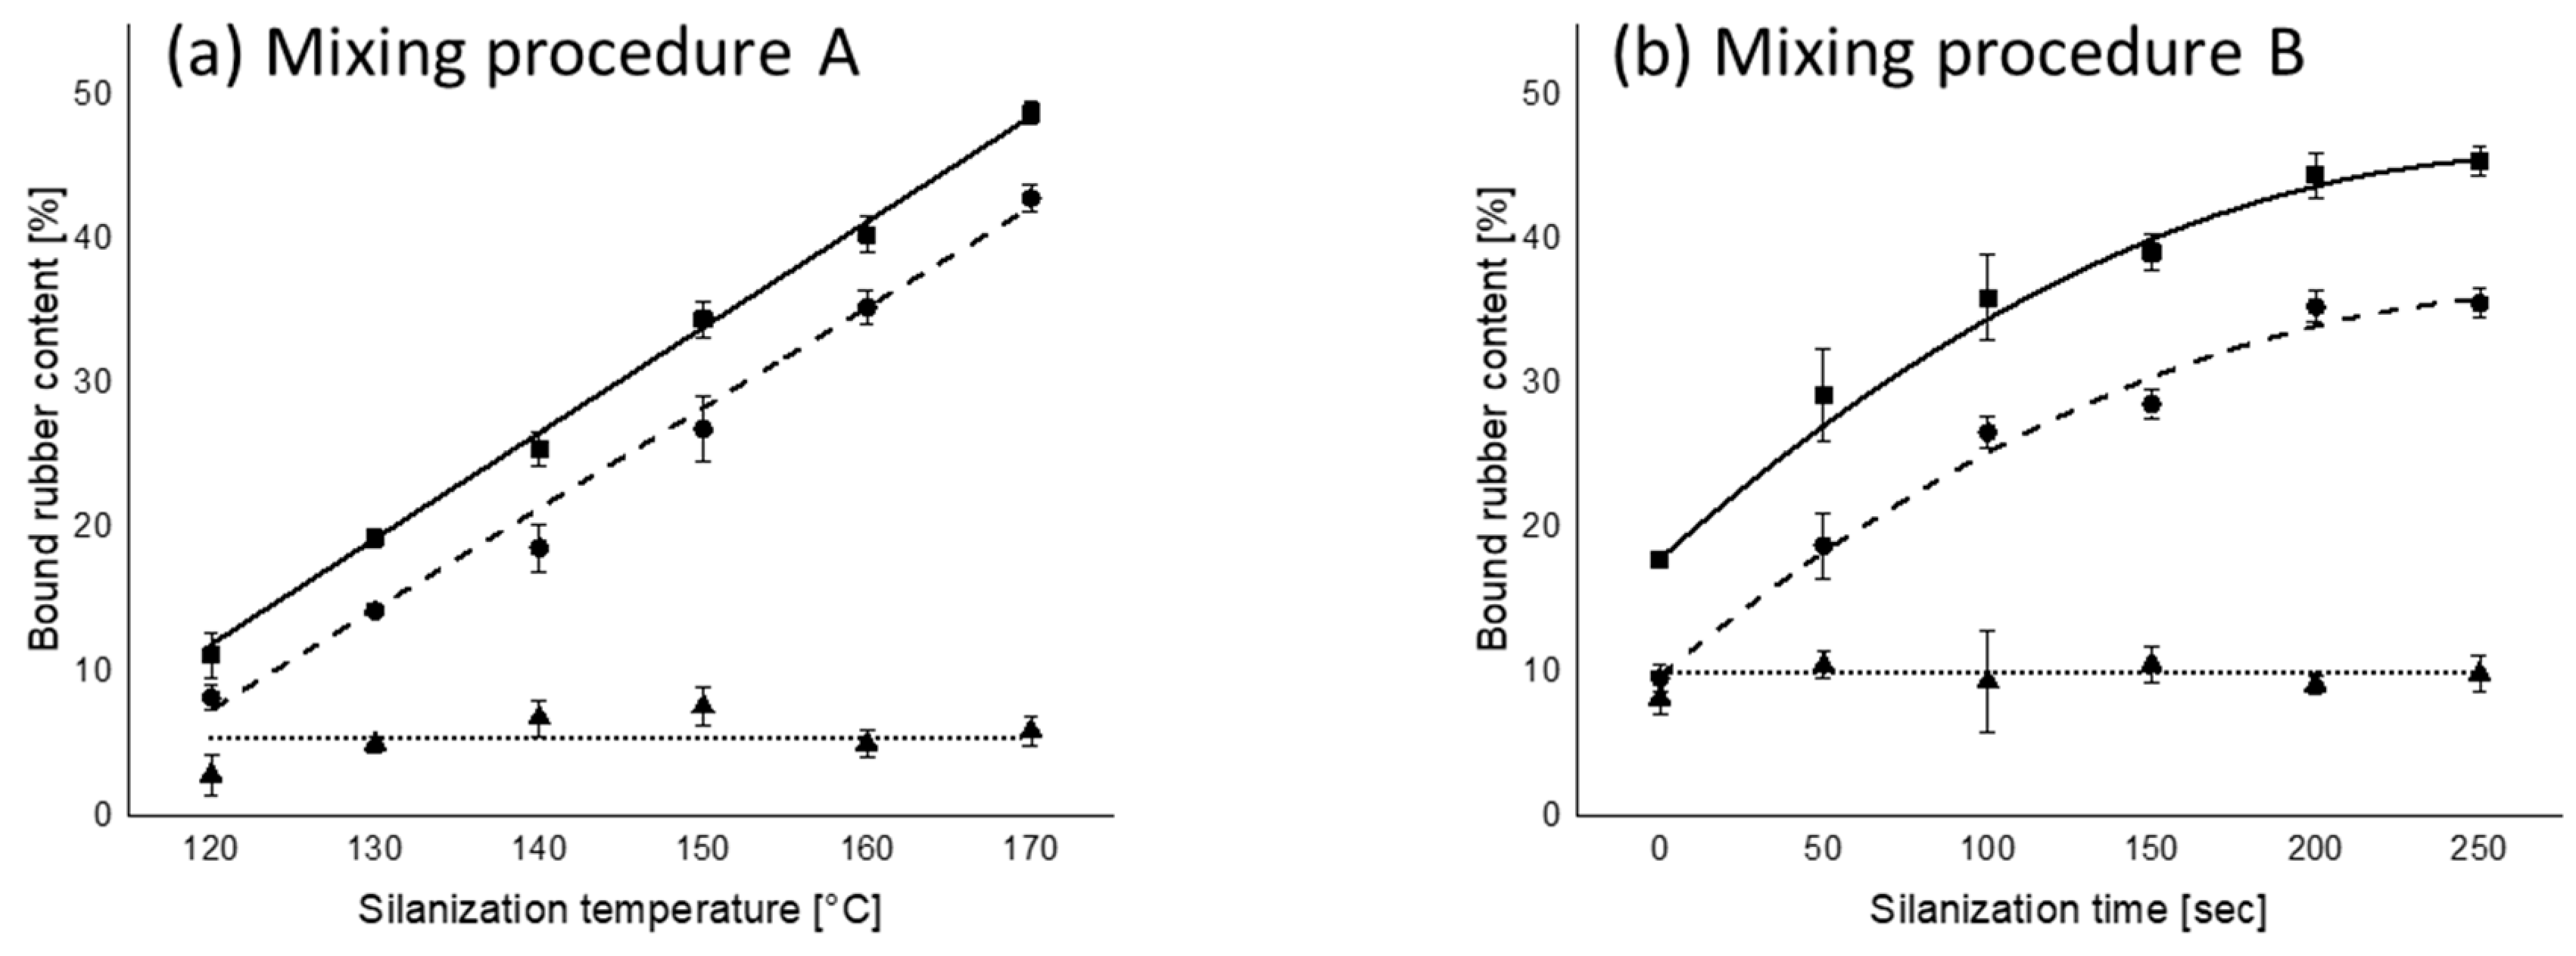
3.2. Bound Rubber Content as a Function of Silanization Temperature and Time
3.3. Silica Filler Flocculation Rate
3.4. Filler–Polymer Coupling Rate after Mixing
3.5. Marching Modulus Intensity
3.5.1. Marching Modulus Intensity at Small (ASTM Conditions, MMI 0.5°) and Large Strain (MMI 3°)
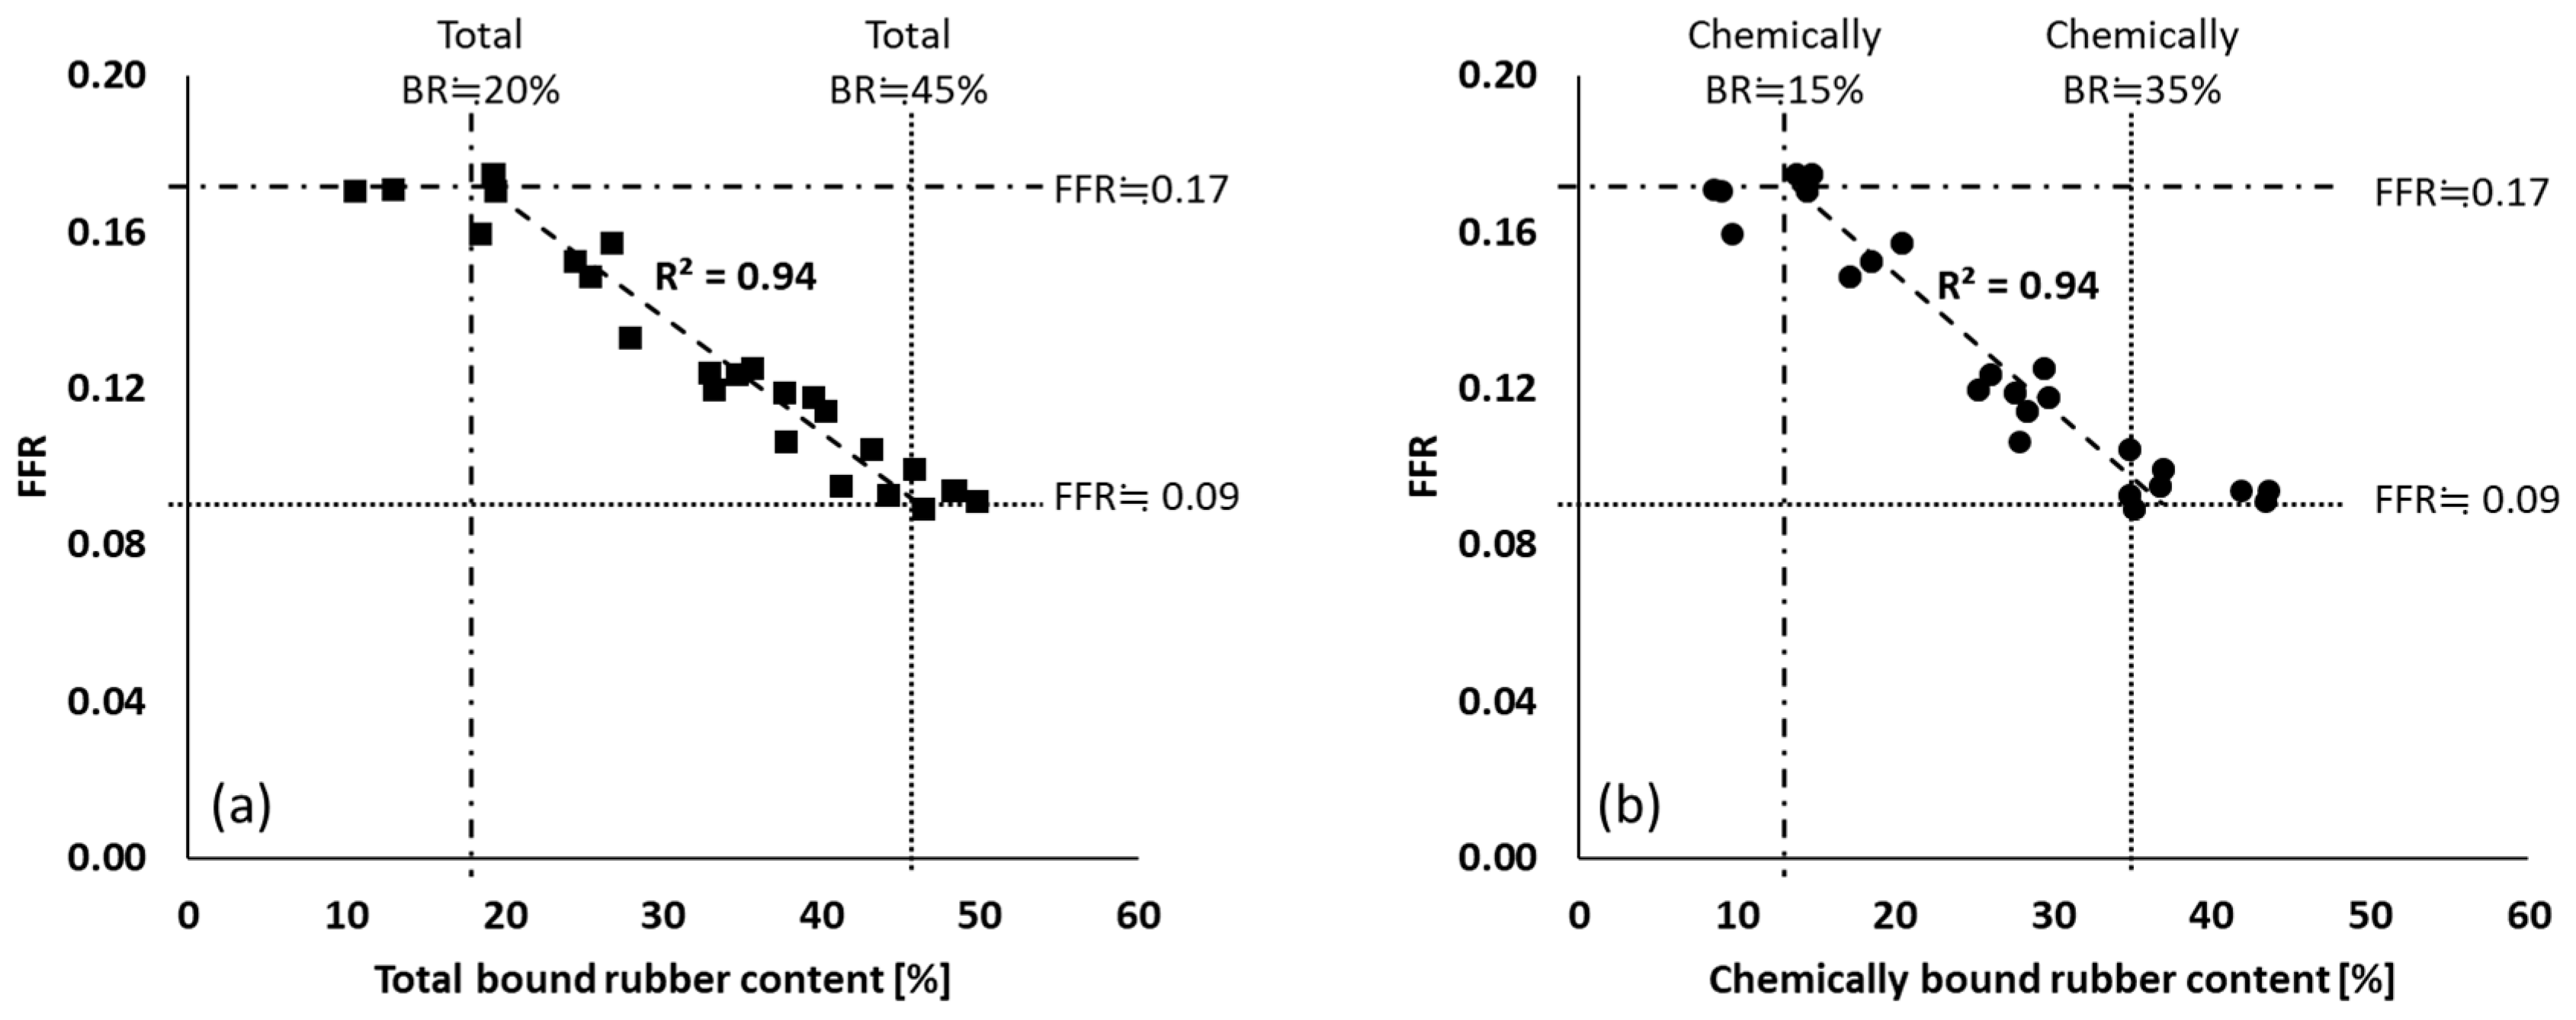
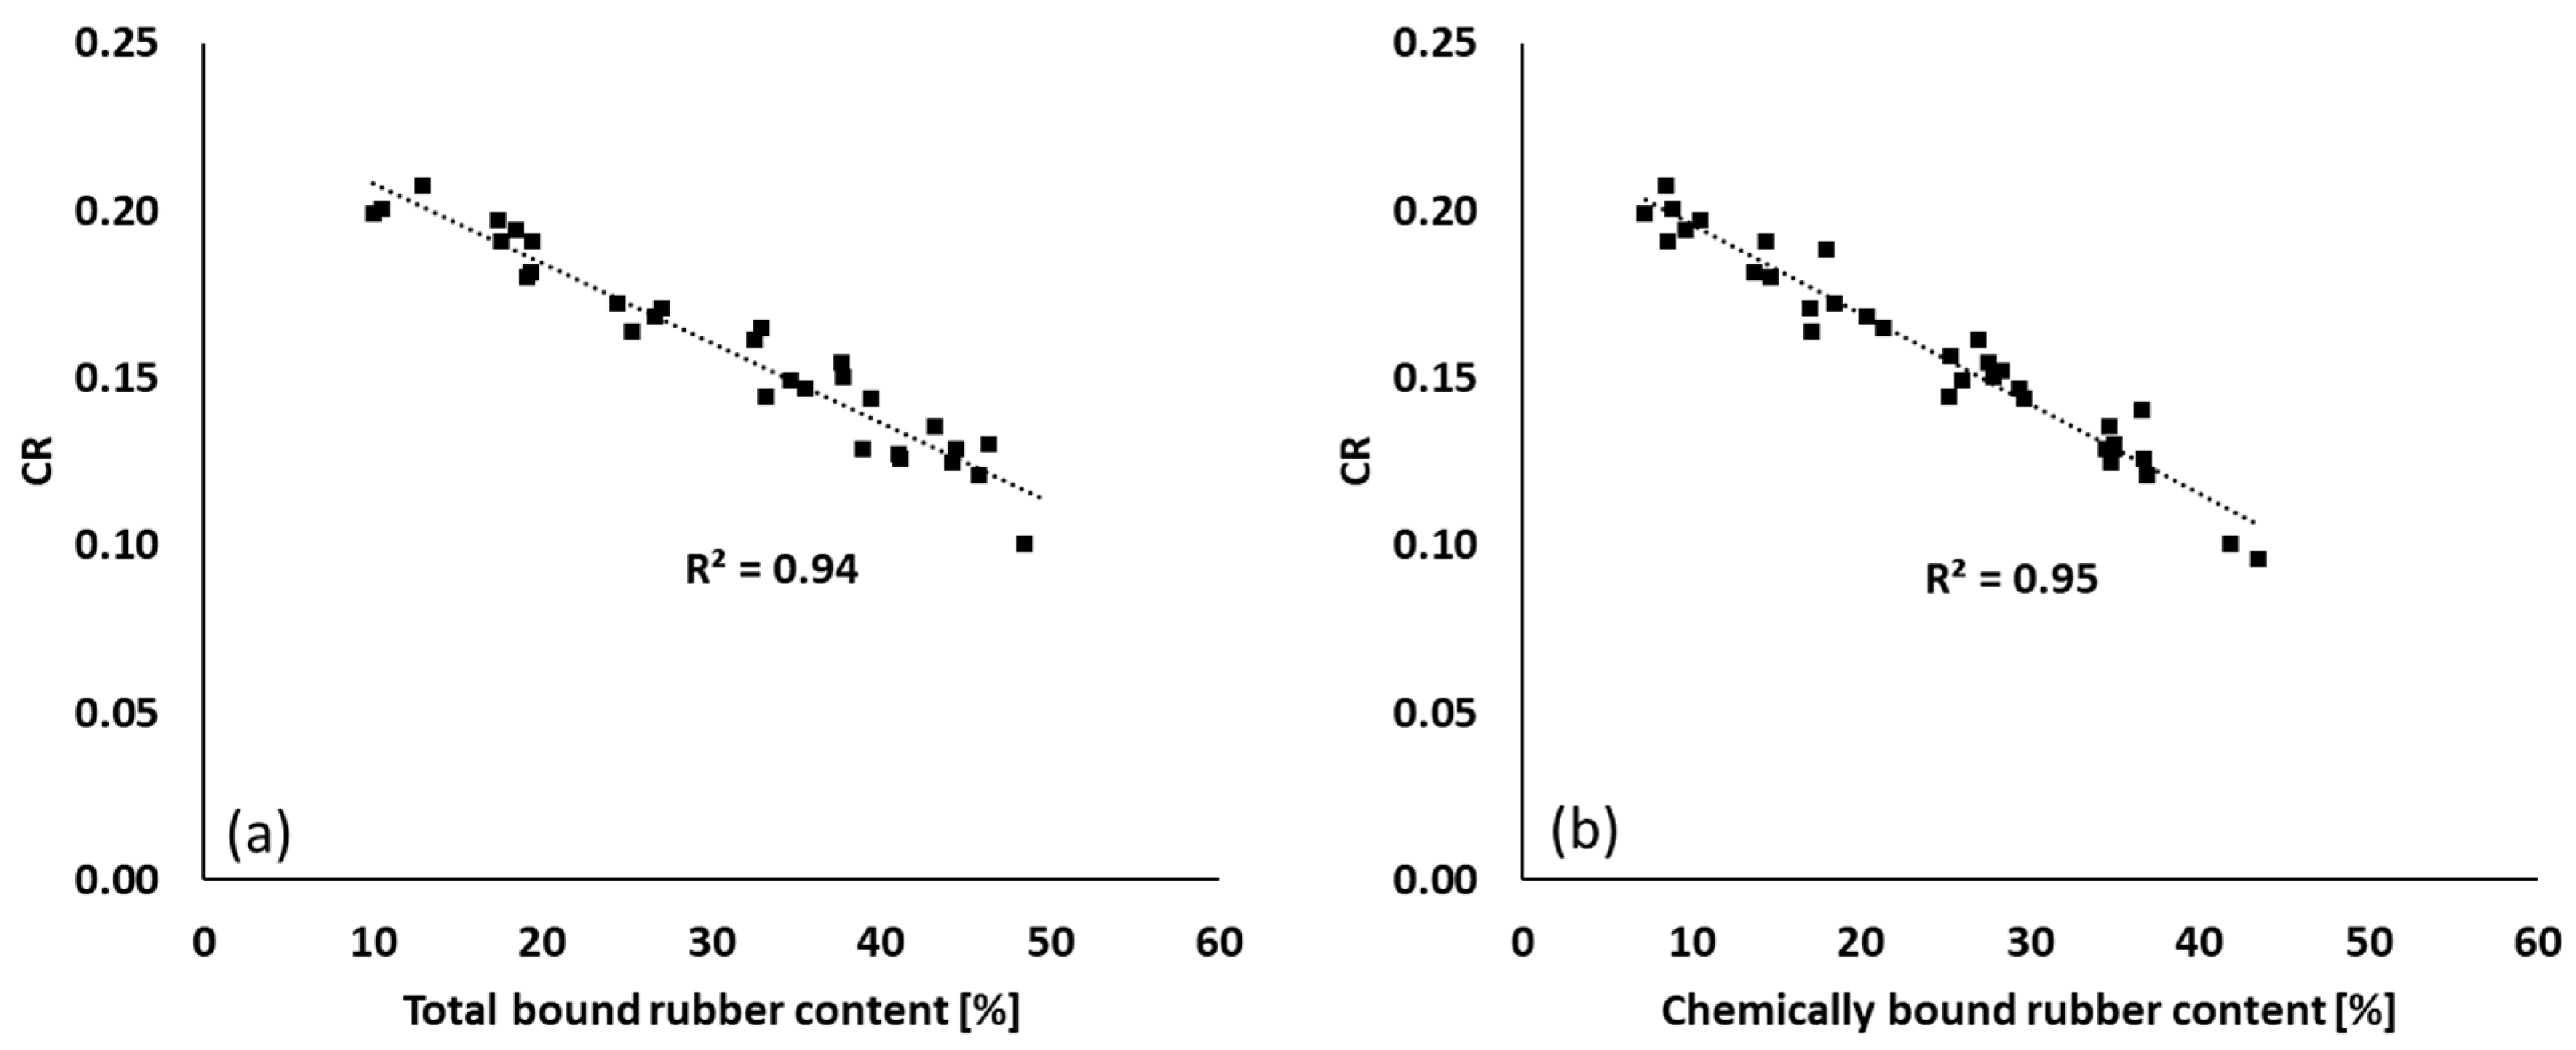
3.5.2. Marching Modulus Intensity as a Function of FFR and CR
4. Conclusions
Author Contributions
Funding
Conflicts of Interest
References
- Rauline, R. To Compagnie Generale des Etablissements Michelin—Michelin & Cie. Eur. Patent 0501227 A1, 7 September 1992. [Google Scholar]
- Collins, J.M.; Jackson, W.L.; Oubridge, P.S. Relevance of elastic and loss moduli of tire components to tire energy losses. Rubber Chem. Technol. 1965, 38, 400–414. [Google Scholar] [CrossRef]
- Dannenberg, E.M. The Effects of surface chemical interactions on the properties of filler-reinforced rubbers. Rubber Chem. Technol. 1975, 48, 410–444. [Google Scholar] [CrossRef]
- Futamura, S. Deformation index-concept for hysteretic energy-loss process. Rubber Chem. Technol. 1991, 64, 57–64. [Google Scholar] [CrossRef]
- Waddell, W.H.; Evans, L.R. Use of nonblack fillers in tire compounds. Rubber Chem. Technol. 1996, 69, 377–423. [Google Scholar] [CrossRef]
- Bomal, Y.; Touzet, S.; Barruel, R.; Cochet, P.; Dejean, B. Developments in silica usage for decreased tyre rolling resistance. Kautsch. Gummi Kunstst. 1997, 50, 434–439. [Google Scholar]
- Waddell, W.H.; Napier, R.C.; Poulter, R.R. Improved tread compound wet/winter traction using brominated isobutylene-co-para-methylstyrene. Kautsch. Gummi Kunstst. 2001, 54, 181–187. [Google Scholar]
- Goerl, U.; Hunsche, A.; Mueller, A.; Koban, H.G. Investigations into the silica/silane reaction system. Rubber Chem. Technol. 1997, 70, 608–623. [Google Scholar] [CrossRef]
- Görl, U.; Hunsche, A. Advanced Investigations into the Silica/Silane Reaction System; ACS: Louisville, KY, USA, 1996; p. 76. [Google Scholar]
- Heinrich, G.; Vilgis, T.A. Why silica technology needs S-SBR in high performance tires? Kautsch. Gummi Kunstst. 2008, 61, 368–376. [Google Scholar]
- Reuvekamp, L.A.E.M.; Ten Brinke, J.W.; Van Swaaij, P.J.; Noordermeer, J.W.M. Effects of time and temperature on the reaction of TESPT silane coupling agent during mixing with silica filler and tire rubber. Rubber Chem. Technol. 2002, 75, 187–198. [Google Scholar] [CrossRef]
- Mihara, S.; Datta, R.N.; Noordermeer, J.W.M. Flocculation in silica reinforced rubber compounds. Rubber Chem. Technol. 2009, 82, 524–540. [Google Scholar] [CrossRef]
- Jin, J.; Noordermeer, J.W.M.; Dierkes, W.K.; Blume, A. The origin of marching modulus of silica filled tire tread compounds. Rubber Chem. Technol. 2019. [Google Scholar] [CrossRef]
- Dierkes, W.K.; Noordermeer, J.W.M.; Rinker, M.; Kelting, K.-U.; Van de Pol, C. Increasing the silanisation efficiency of silica compounds: Upscaling. Kautsch. Gummi Kunstst. 2003, 56, 338–344. [Google Scholar]
- Li, Y.; Wang, M.J.; Zhang, T.; Zhang, F.; Fu, X. Study on dispersion morphology of silica in rubber. Rubber Chem. Technol. 1994, 64, 693–699. [Google Scholar] [CrossRef]
- Sarkawi, S.S.; Dierkes, W.K.; Noordermeer, J.W.M. Reinforcement of natural rubber by precipitated silica: The influence of processing temperature. Rubber Chem. Technol. 2014, 87, 103–119. [Google Scholar] [CrossRef]
- Vondrácek, P.; Hradec, M.; Chvalovsky, V.; Khanh, H.D. The effect of the structure of sulfur-containing silane coupling agents on their activity in silica-filled SBR. Rubber Chem. Technol. 1984, 57, 675–685. [Google Scholar] [CrossRef]
- Blume, A.; Uhrlandt, S. Development of HD silicas for tires: processes, properties, performance. Rubber world. 2002, 226, 30–36. [Google Scholar]
- Ten Brinke, J.W.; Van Swaaij, P.J.; Reuvekamp, L.A.E.M.; Noordermeer, J.W.M. The influence of silane sulfur and carbon rank on processing of a silica reinforced tire tread compound. Rubber Chem. Technol. 2003, 76, 12–35. [Google Scholar] [CrossRef]
- Manoharan, P.; Anagha, M.G.; Das, N.C.; Naskar, K. Influence of different specific surface area of highly dispersible silica and interfacial characteristics of green elastomer composites. Rubber Chem. Technol. 2018, 91, 548–560. [Google Scholar] [CrossRef]
- Braum, M.V.; Jacobi, M.A.M. Silica grafted with epoxidized liquid polybutadienes: Evidence for the mechanism of reinforcement. Rubber Chem. Technol. 2019, 92, 431–444. [Google Scholar] [CrossRef]
- Luginsland, H.-D.; Fröhlich, J.; Wehmeier, A. Influence of different silanes on the reinforcement of silica-filled rubber compounds. Rubber Chem. Technol. 2002, 75, 563–579. [Google Scholar] [CrossRef]
- Kaewsakul, W.; Sahakaro, K.; Dierkes, W.K.; Noordermeer, J.W.M. Optimization of mixing conditions for silica-reinforced natural rubber tire tread compounds. Rubber Chem. Technol. 2012, 85, 277–294. [Google Scholar] [CrossRef]
- Kaewsakul, W.; Sahakaro, K.; Dierkes, W.K.; Noordermeer, J.W.M. Cooperative effects of epoxide functional groups on natural rubber and silane coupling agents on reinforcing efficiency of silica. Rubber Chem. Technol. 2014, 87, 291–310. [Google Scholar] [CrossRef]
- Sarkawi, S.S.; Dierkes, W.K.; Noordermeer, J.W.M. Morphology of silica-reinforced natural rubber: The effect of silane coupling agent. Rubber Chem. Technol. 2015, 88, 359–372. [Google Scholar] [CrossRef]
- Payne, A.R. Effect of dispersion on dynamic properties of filler-loaded rubbers. Rubber Chem. Technol. 1966, 39, 365–374. [Google Scholar] [CrossRef]
- Payne, A.R.; Whittaker, R.E. Low strain dynamic properties of filled rubbers. Rubber Chem. Technol. 1971, 44, 440–478. [Google Scholar] [CrossRef]
- Bachmann, J.H.; Sellers, J.W.; Wagner, M.P.; Wolf, R.F. Fine particle reinforcing silicas and silicates in elastomers. Rubber Chem. Technol. 1959, 32, 1286–1391. [Google Scholar] [CrossRef]
- Jin, J.; Noordermeer, J.W.M.; Dierkes, W.K.; Blume, A. Factors Reducing the Marching Modulus of Silica Filled Tire Tread Compounds; Deutsche Kautschuk-Tagung: Nuremberg, Germany, 2018; p. 28. [Google Scholar]
- ASTM Standard D5289-95. Standard Test Method for Rubber Property—Vulcanization Using Rotorless Cure Meters; ASTM International: West Conshohocken, PA, USA, 2001. [Google Scholar]
- Wolff, S.; Wang, M.J.; Tan, E.-H. Filler-elastomer Interactions. Part VII. Study on bound rubber. Rubber Chem. Technol. 1993, 66, 163–177. [Google Scholar] [CrossRef]
- Hasse, A.; Klockmann, O.; Wehmeier, A.; Luginsland, H.-D. Influence of the amount of di-and polysulfane silanes on the crosslinking density of silica-filled rubber compounds. Kautsch. Gummi Kunstst. 2002, 55, 236–243. [Google Scholar]
 ): 120 °C; (
 ): 130 °C; (
 ): 140 °C; (
 ): 150 °C; (
 ): 160 °C; (
 ): 170 °C.
): 120 °C; (): 130 °C; (): 140 °C; (): 150 °C; (): 160 °C; (): 170 °C.
): 170 °C.
): 120 °C; (): 130 °C; (): 140 °C; (): 150 °C; (): 160 °C; (): 170 °C.
 ): 0 s; (
 ): 50 s; (
 ): 100 s; (
 ): 150 s; (
 ): 200 s; (
 ): 250 s.
): 0 s; (): 50 s; (): 100 s; (): 150 s; (): 200 s; (): 250 s.
): 250 s.
): 0 s; (): 50 s; (): 100 s; (): 150 s; (): 200 s; (): 250 s.

 ): total bound rubber; (
 ): chemically bound rubber; (
 ): physically bound rubber.
): total bound rubber; (): chemically bound rubber; (): physically bound rubber.
): physically bound rubber.
): total bound rubber; (): chemically bound rubber; (): physically bound rubber.

 ): silanization temperature or time range where FFR shows good correlation with those parameters; (
 ): upper plateau; (
 ): lower plateau; fitting lines for (a,b) are based on linear fit with maximum R2.
): silanization temperature or time range where FFR shows good correlation with those parameters; (): upper plateau; (): lower plateau; fitting lines for (a,b) are based on linear fit with maximum R2.
): lower plateau; fitting lines for (a,b) are based on linear fit with maximum R2.
): silanization temperature or time range where FFR shows good correlation with those parameters; (): upper plateau; (): lower plateau; fitting lines for (a,b) are based on linear fit with maximum R2.
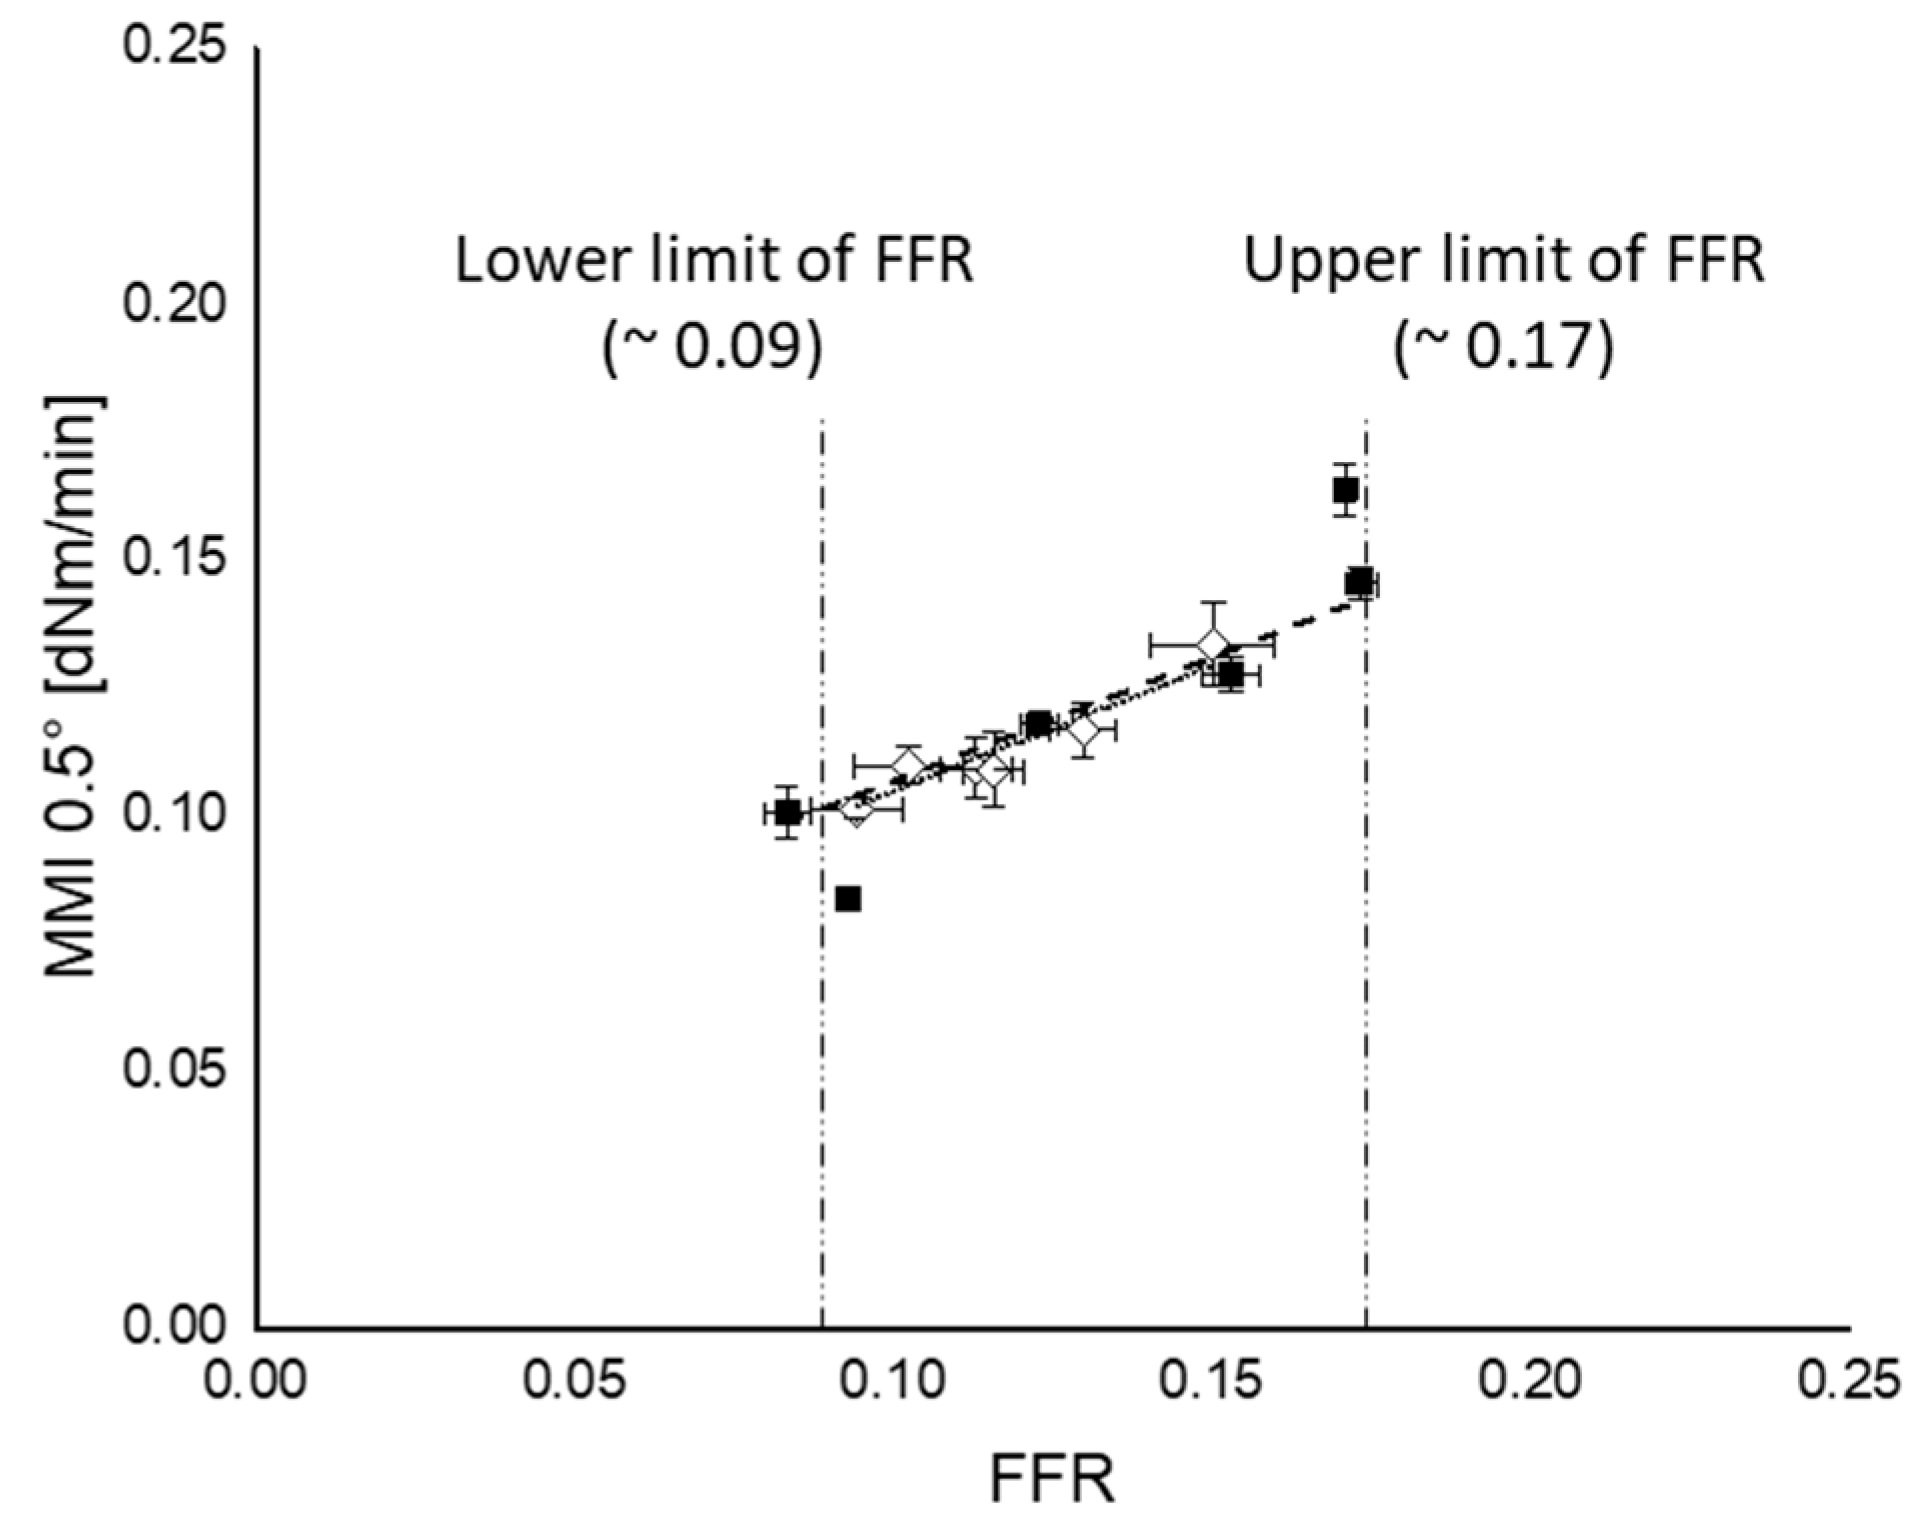
 ): silanization temperature or time range where FFR shows good correlation with those parameters; (
 ): upper limit; (
 ): lower limit; fitting lines for (a,b) are based on linear fit with maximum R2.
): silanization temperature or time range where FFR shows good correlation with those parameters; (): upper limit; (): lower limit; fitting lines for (a,b) are based on linear fit with maximum R2.
): lower limit; fitting lines for (a,b) are based on linear fit with maximum R2.
): silanization temperature or time range where FFR shows good correlation with those parameters; (): upper limit; (): lower limit; fitting lines for (a,b) are based on linear fit with maximum R2.


 ): 120 °C; (
 ): 130 °C; (
 ): 140 °C; (
 ): 150 °C; (
 ): 160 °C; (
 ): 170 °C.
): 120 °C; (): 130 °C; (): 140 °C; (): 150 °C; (): 160 °C; (): 170 °C.
): 170 °C.
): 120 °C; (): 130 °C; (): 140 °C; (): 150 °C; (): 160 °C; (): 170 °C.
 ): 0 s; (
 ): 50 s; (
 ): 100 s; (
 ): 150 s; (
 ): 200 s; (
 ): 250 s.
): 0 s; (): 50 s; (): 100 s; (): 150 s; (): 200 s; (): 250 s.
): 250 s.
): 0 s; (): 50 s; (): 100 s; (): 150 s; (): 200 s; (): 250 s.
 ): MMI 0.5°; (
 ): MMI 3°; fitting lines for each MMI in (a,b) are based on linear or polynomial fit with maximum R2.
): MMI 0.5°; (): MMI 3°; fitting lines for each MMI in (a,b) are based on linear or polynomial fit with maximum R2.
): MMI 3°; fitting lines for each MMI in (a,b) are based on linear or polynomial fit with maximum R2.
): MMI 0.5°; (): MMI 3°; fitting lines for each MMI in (a,b) are based on linear or polynomial fit with maximum R2.
 ): mixing procedure A; (
 ): mixing procedure B.
 ): mixing procedure A; (
 ): mixing procedure B.

| Mixing Stage | Ingredient | Product Name | Company | Content (phr 8) |
|---|---|---|---|---|
| Master batch | S-SBR 1,2 | VSL5025-2HM | Lanxess (Cologne, Germany) | 110 |
| BR 3 | BUNA CB24 | Lanxess (Cologne, Germany) | 20 | |
| Silica | ULTRASIL7005 (CTAB:164 m2/g) | Evonik (Wesseling, Germany) | 90 | |
| Silane (TESPT) | Si69 | Evonik (Wesseling, Germany) | 8.1 | |
| TDAE oil 4 | Vivatec 500 | Hansen & Rosenthal (Hamburg, Germany) | 5 | |
| Stearic acid | Stearic acid | Merck (Darmstadt, Germany) | 1 | |
| Zinc oxide | ZnO | Merck (Darmstadt, Germany) | 2 | |
| DPG 5 | Perkacit DPG | Flexsys (Deventer, Netherland) | 1.5 | |
| Final | Sulfur | S | J. T. Baker (Landsmeer, Netherlands) | 0.7 |
| ZBEC 6 | Vulkacit ZBEC | Lanxess (Cologne, Germany) | 0.2 | |
| CBS 7 | Santocure CBS | Flexsys (Deventer, Netherland) | 2.2 |
| Mixing Procedure A | Mixing Procedure B | ||
|---|---|---|---|
| Action | time (mm:ss) | Action | time (mm:ss) |
| Add polymer | 00:00 to 00:20 | Add polymer | 00:00 to 00:20 |
| Mastication | 00:20 to 01:20 | Mastication | 00:20 to 01:20 |
| ½ Silica, Silane | 01:20 to 01:40 | ½ Silica, Silane | 01:20 to 01:40 |
| Mixing | 01:40 to 02:40 | Mixing | 01:40 to 02:40 |
| ½ Silica, remaining ingredients | 02:40 to 03:10 | ½ Silica, remaining ingredients | 02:40 to 03:10 |
| Mixing till target temperature: 120, 130, ...., 170 °C | 03:10 to 04:10 | Mixing till 150 °C | 03:10 to 04:10 |
| Ram sweep | 04:10 to 04:14 | Ram sweep | 04:10 to 04:14 |
| Mixing (at target temperature) | 04:14 to 06:40 | Mixing for various time laps: 0, 50, 100, …., 250 s | 04:14 to 08:20 |
| Discharge and sheeting | - | Discharge and sheeting | - |
| Action | Time (mm:ss) |
|---|---|
| Add master batch | - |
| Mixing | 00:00 to 02:00 |
| Add curatives | 02:00 to 02:30 |
| Mixing | 02:30 to 09:00 |
| Discharge |
| Bound Rubbers | Mixing Procedure A | Mixing Procedure B |
|---|---|---|
| Chemically | 27% | 29% |
| Physically | 8% | 11% |
| Total | 35% | 40% |
© 2020 by the authors. Licensee MDPI, Basel, Switzerland. This article is an open access article distributed under the terms and conditions of the Creative Commons Attribution (CC BY) license (http://creativecommons.org/licenses/by/4.0/).
Share and Cite
Jin, J.; Noordermeer, J.W.M.; Dierkes, W.K.; Blume, A. The Effect of Silanization Temperature and Time on the Marching Modulus of Silica-Filled Tire Tread Compounds. Polymers 2020, 12, 209. https://doi.org/10.3390/polym12010209
Jin J, Noordermeer JWM, Dierkes WK, Blume A. The Effect of Silanization Temperature and Time on the Marching Modulus of Silica-Filled Tire Tread Compounds. Polymers. 2020; 12(1):209. https://doi.org/10.3390/polym12010209
Chicago/Turabian StyleJin, Jungmin, Jacques W. M. Noordermeer, Wilma K. Dierkes, and Anke Blume. 2020. "The Effect of Silanization Temperature and Time on the Marching Modulus of Silica-Filled Tire Tread Compounds" Polymers 12, no. 1: 209. https://doi.org/10.3390/polym12010209
APA StyleJin, J., Noordermeer, J. W. M., Dierkes, W. K., & Blume, A. (2020). The Effect of Silanization Temperature and Time on the Marching Modulus of Silica-Filled Tire Tread Compounds. Polymers, 12(1), 209. https://doi.org/10.3390/polym12010209