Article

A Green, Rapid and Efficient Dual-Sensors for Highly Selective and Sensitive Detection of Cation (Hg2+) and Anion (S2−) Ions Based on CMS/AgNPs Composites

1
College of Chemistry and Chemical Engineering, Qingdao University, Qingdao 266071, China
2
College of Life Sciences, Qingdao University, Qingdao 266071, China
*
Author to whom correspondence should be addressed.
Polymers 2020, 12(1), 113; https://doi.org/10.3390/polym12010113
Submission received: 7 November 2019 / Revised: 17 December 2019 / Accepted: 18 December 2019 / Published: 5 January 2020

Abstract

:
Detection of mercury (Hg2+) and sulfide (S2−), universal and well-known toxic ions, is crucial in monitoring several diseases. How to design and fabricate the high-performance sensor for simultaneously and accurately detecting the Hg2+ and S2− is critical. Herein, we proposed a novel and convenient strategy for optical detection of Hg2+ and S2− by employing a carboxymethyl cellulose sodium/silver nanoparticle (CMS/AgNPs) colloidal solution, in which AgNPs were used as monitor for Hg2+ and S2−, and the CMS was utilized as both the stabilizer and the hydrophilic substrate for AgNPs. Well-identifiable peaks for Hg2+ and S2– were obtained in water based on UV–VIS absorption spectra, the absorbance intensity and/or position of nano-silver vary with the addition of Hg2+ cation and S2– anion, accompanying with color change. Impressively, the optimal AgNPs anchored CMS exhibited a high sensitivity and selectivity toward Hg2+ and S2−, the change in absorbance was linear with the concentration of Hg2+ (0–50 μM) and S2− (15–70 μM), and the lowest limits of detection (LOD) were 1.8 × 10⁻⁸ M and 2.4 × 10⁻⁷ M, respectively. More importantly, owing to the superior properties in testing Hg2+ and S2−, the fabricated sensor was successfully applied for detection of target ions in lake and tap water samples. All these good results implied that the designed strategy and as-designed samples is promising in detecting cation (Hg2+) and anion (S2−) ions and open up new opportunities for selecting other kinds of ions.

Graphical Abstract

1. Introduction

Nowadays, water pollution has been considered as one of the most serious and dangerous forms of pollution, which has aroused numerous environmental problems and drawn growing attention [1,2,3,4]. Mercury (Hg2+) and sulfide (S2−) are well-known toxic ions and hazardous chemicals. Hg2+ exists widely in air, soil, and water [5,6]. It is very detrimental to human health, even at low concentrations, causing serious diseases to the heart, liver, kidneys, endocrine, brain, and nervous system [7,8]. S2− not only exists as a hazard to living systems but can also easily convert into H2S in acidic media [9], and H2S is harmful to our eyes, causing conjunctivitis and other related eye diseases [10]. At certain concentrations, it will bind to hemoglobin in the blood and cause poisoning and even death [11]. Thus, the development of efficient sensors for the detection of S2− and Hg2+ is of considerable urgency.
Up to now, sophisticated instruments, such as cold vapor atomic absorption spectrometers (CVAAS), atomic fluorescence spectrometers (AFS), inductively coupled plasma mass spectrometers (ICP-MS), stripping voltammeters, and inductively coupled plasma optical emission spectrometers (ICP-OES) have been used for the analysis of Hg2+ [12,13]. Infrared absorption spectroscopy, ICP-OES, ultraviolet fluorescence method (GC-TS), and X-ray fluorescence spectrometry are used for analyzing S2− [14]. However, these methods always need a long analysis time, precision equipment, complicated procedures, some technical professionals, or significant special skill. Therefore, it is very necessary to develop some simple, routinely-monitored selective and sensitive techniques for Hg2+ and S2− in environmental water samples.
In recent years, nanoparticle-based colorimetric probes have received significant attention due to their high selectivity and sensitivity [15,16,17,18,19]. Various functionalized Ag and Au nanoparticles have been extensively developed for the selective and sensitive detection of S2− and Hg2+ [20,21,22,23,24]. Nevertheless, such strategies also suffer from some drawbacks, including complicated synthesis, high detection limit, and single ion detection [25,26,27,28]. UV–VIS spectra, in stark contrast, have been verified to be a more-powerful optical technique for the exploitation of rapid, efficient, and low concentration analyses due to their reliable, low cost, and rapid implementation. From the viewpoint of practical application, an excellent sensor should not only have highly sensitive and selective performance, an environmentally friendly synthetic route, and have a simple and economical operation, but also show rapid and efficient detection toward multiple ions simultaneously. To fulfill the above requirements, we propose a novel CMS/AgNPs colloidal optical sensor to analyze Hg2+ and S2− in aqueous samples. Notably, our method has several advantages: Firstly, all material reagents are green, non-toxic, and low-cost. Secondly, the synthesis and detection reactions are simple, environmental-friendly, and rapid. Thirdly, the prepared material can act directly as a sensor, which is highly sensitive and has selective detection for multiple ions, cations (Hg2+) and anions (S2−). Fourthly, the LOD is low and the color changes are obvious and visible by the naked eye. Furthermore, the system can be utilized directly in lake and tap water without any other treatment.

2. Experimental

2.1. Reagents and Apparatus

AgNO3, NH3·H2O, ascorbic acid (Vc), carboxymethyl cellulose sodium (CMS), Al(NO3)3·9H2O, Cu(NO3)2·3H2O, Bi(NO3)3·5H2O, Ba(NO3)2, Ca(NO3)2·4H2O, Cd(NO3)2·4H2O, Co(NO3)2·6H2O, Fe(NO3)2·6H2O, Fe(NO3)3·9H2O, KNO3, Mg(NO3)2·6H2O, Ni(NO3)2·6H2O, Pb(NO3)2, Zn(NO3)2·6H2O, HgCl2, NaNO3, NaNO2, Na2CO3, NaHCO3, Na2HPO4, NaH2PO4, Na3PO4, NaF, NaCl, NaBr, NaI, Na2S, Na2SO3, Na2S2O8, and Na2SO4 are of analytical reagent grade and were purchased from Sinopharm Chemical Reagent Co., LN (Shanghai, China). The concentration of salt solution is 1 × 10⁻² M. All glassware used in the experiment were cleaned well using HNO3 and rinsed with distilled water, followed by oven drying at 100 °C for use.

2.2. Synthesis of CMS/AgNPs Colloidal Solution

The AgNPs aqueous dispersion was synthesized by the chemical reduction of Tollens’ reagent using Vc as an environmentally benign reducing agent, and CMS as a non-toxic stabilizing agent, respectively. A total of 100 μL of 0.1 M Tollens’ reagent was added to CMS aqueous solution (0.1% (w/v), 100 mL) under constant stirring. The mixture was continued to be stirred for 10 min to allow the diffusion of metal ions into the stabilizing agent. After that, Vc (0.1 M, 100 μL) was added under continuous stirring for 20 min. The entire process was carried out at a constant temperature of 70 °C.

2.3. Characterization of CMS/AgNPs Colloidal Solution

The UV–VIS absorption spectra were recorded via UV–VIS spectrophotometer (UV-2450, Shimadzu, Kyoto, Japan) with a variable wavelength between 300 and 600 nm at room temperature. X-ray diffractometer (XRD) measurements was carried out on a powder X-ray diffractometer (D/MAX-RB, Tokyo, Japan) using CuKα radiation (λ = 0.15418 nm) over the 2θ range of 5°–80° with a step size of 0.05°. Transmission electron microscopy (TEM) images were obtained by a JEOL JEM-2100 Plus microscope (JEOL, Tokyo, Japan) at an accelerating voltage of 200.0 kV, the samples were prepared by dropping the solution containing CMS/AgNPs colloidal solution onto the carbon-coated copper grid and dried in vacuum.

2.4. Colorimetric Detection of Hg2+ and S2−

The CMS/AgNPs colloidal solution was diluted three times using ultra-pure water for the colorimetric determination of Hg2+. To investigate the sensitivity and selectivity of CMS/AgNPs colloidal solution; Firstly, 15 kinds of metal ions (15 µL, 10−2 M) including Mg2+, Co2+, Cu2+, Ni2+, Zn2+, Ca2+, Cd2+, Fe3+, Fe2+, K+, Ba2+, Na+, Hg2+, Al3+, and Pb2+ ions were respectively added into the CMS/AgNPs colloidal solution (3 mL). Secondly, in order to obtain the detection limit, Hg2+ ions of different concentrations (0.3–360 µL, 1 mM) were added into the CMS/AgNPs colloidal solution (3 mL). Finally, the absorption spectra of CMS/AgNPs with various metal ions (50 µM) were obtained by a UV–VIS spectrophotometer and color changes were observed by the naked eye. The Hg2+ or Cu2+ ions (50 µM) were added to CMS/AgNPs colloidal solution (3 mL) for TEM test.
In order to detect S2−, the CMS/AgNPs colloidal solution was diluted twice with ultra-pure water. The detection method is similar with that of Hg2+, 15 kinds of negative ions (30 µL, 10−2 M), including NO3, NO2, CO32−, HCO3−, HPO42−, H2PO4, PO43−, F, Cl, Br, I, SO32−, S2O82−, S2−, and SO42−, were added into the CMS/AgNPs colloidal solution (3 mL), respectively. Then, different concentrations of S2− ions (3–210 µL, 1 mM) were added to the CMS/AgNPs colloidal solution (3 mL). Finally, color changes were observed by the naked eye and the absorption spectra of the above solutions were obtained by UV–VIS spectrophotometer. The TEM was obtained by CMS/AgNPs colloidal solution containing S2− or SO42− ions with a concentration of 50 µM. The LOD is the lowest concentration of the measured sample, using the formula [16,20]: LOD = 3 S/N (S: the standard deviation of the blank sample, N: the slope of the standard linear).

3. Results and Discussion

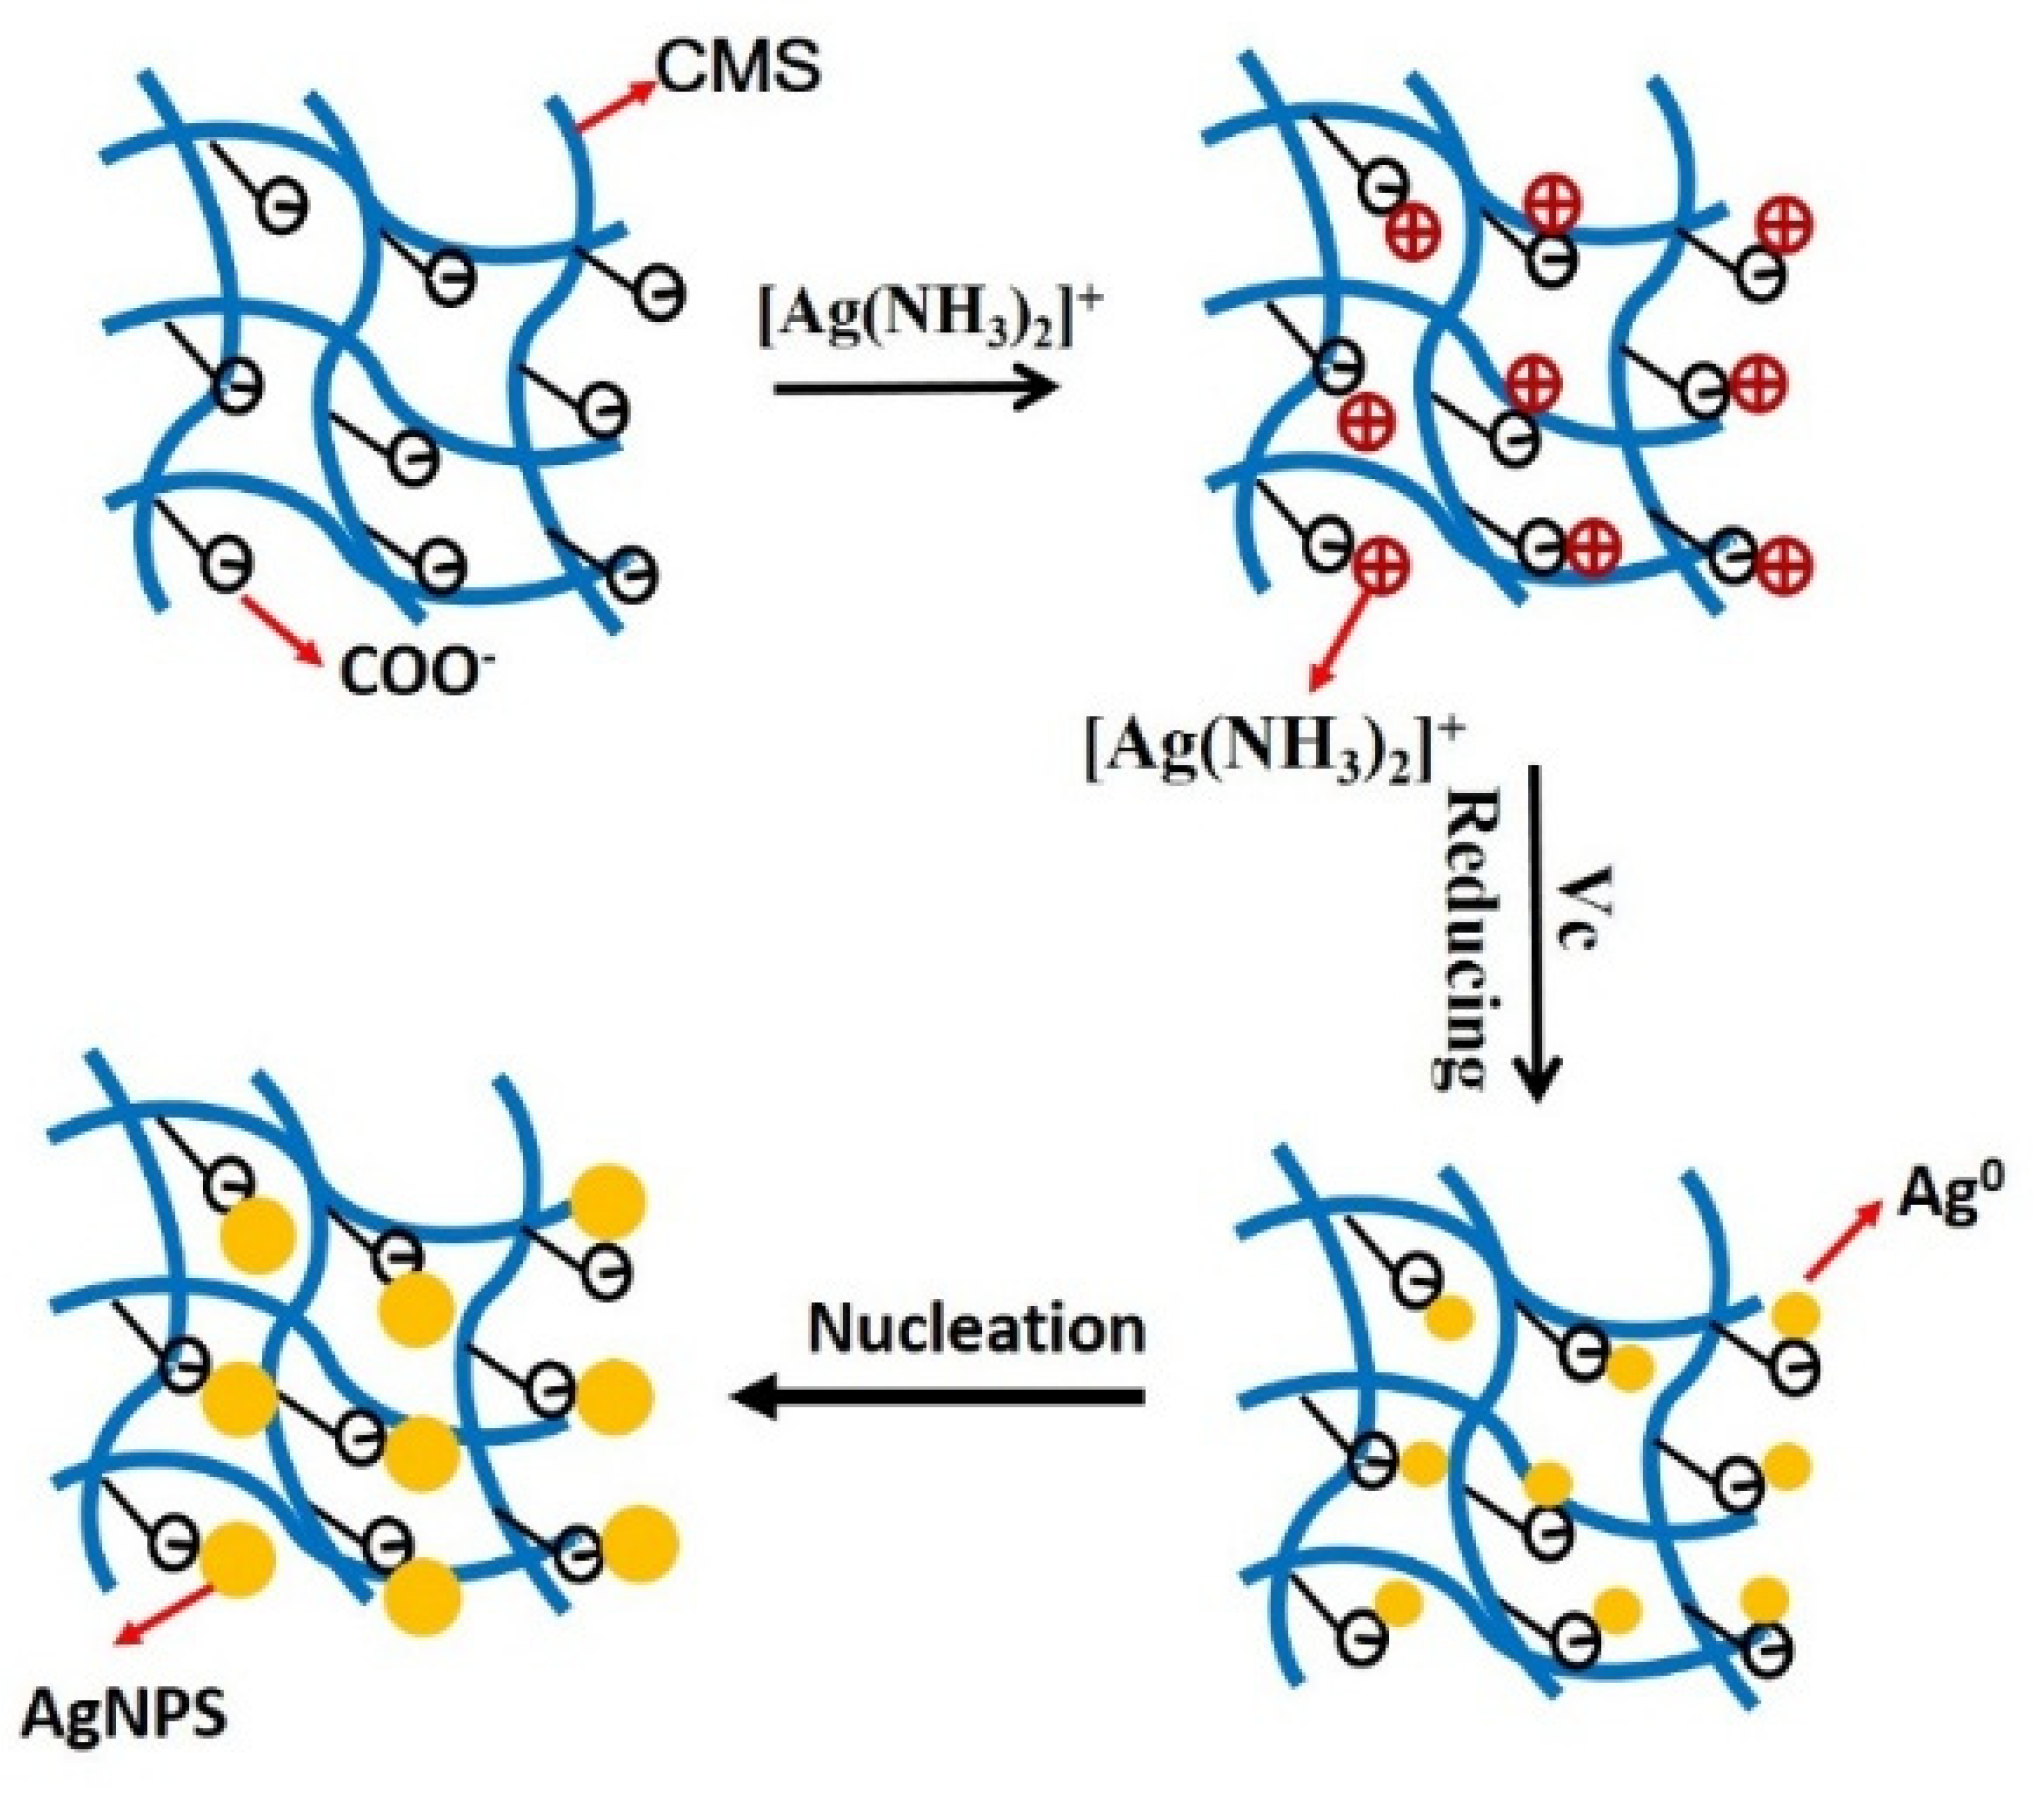
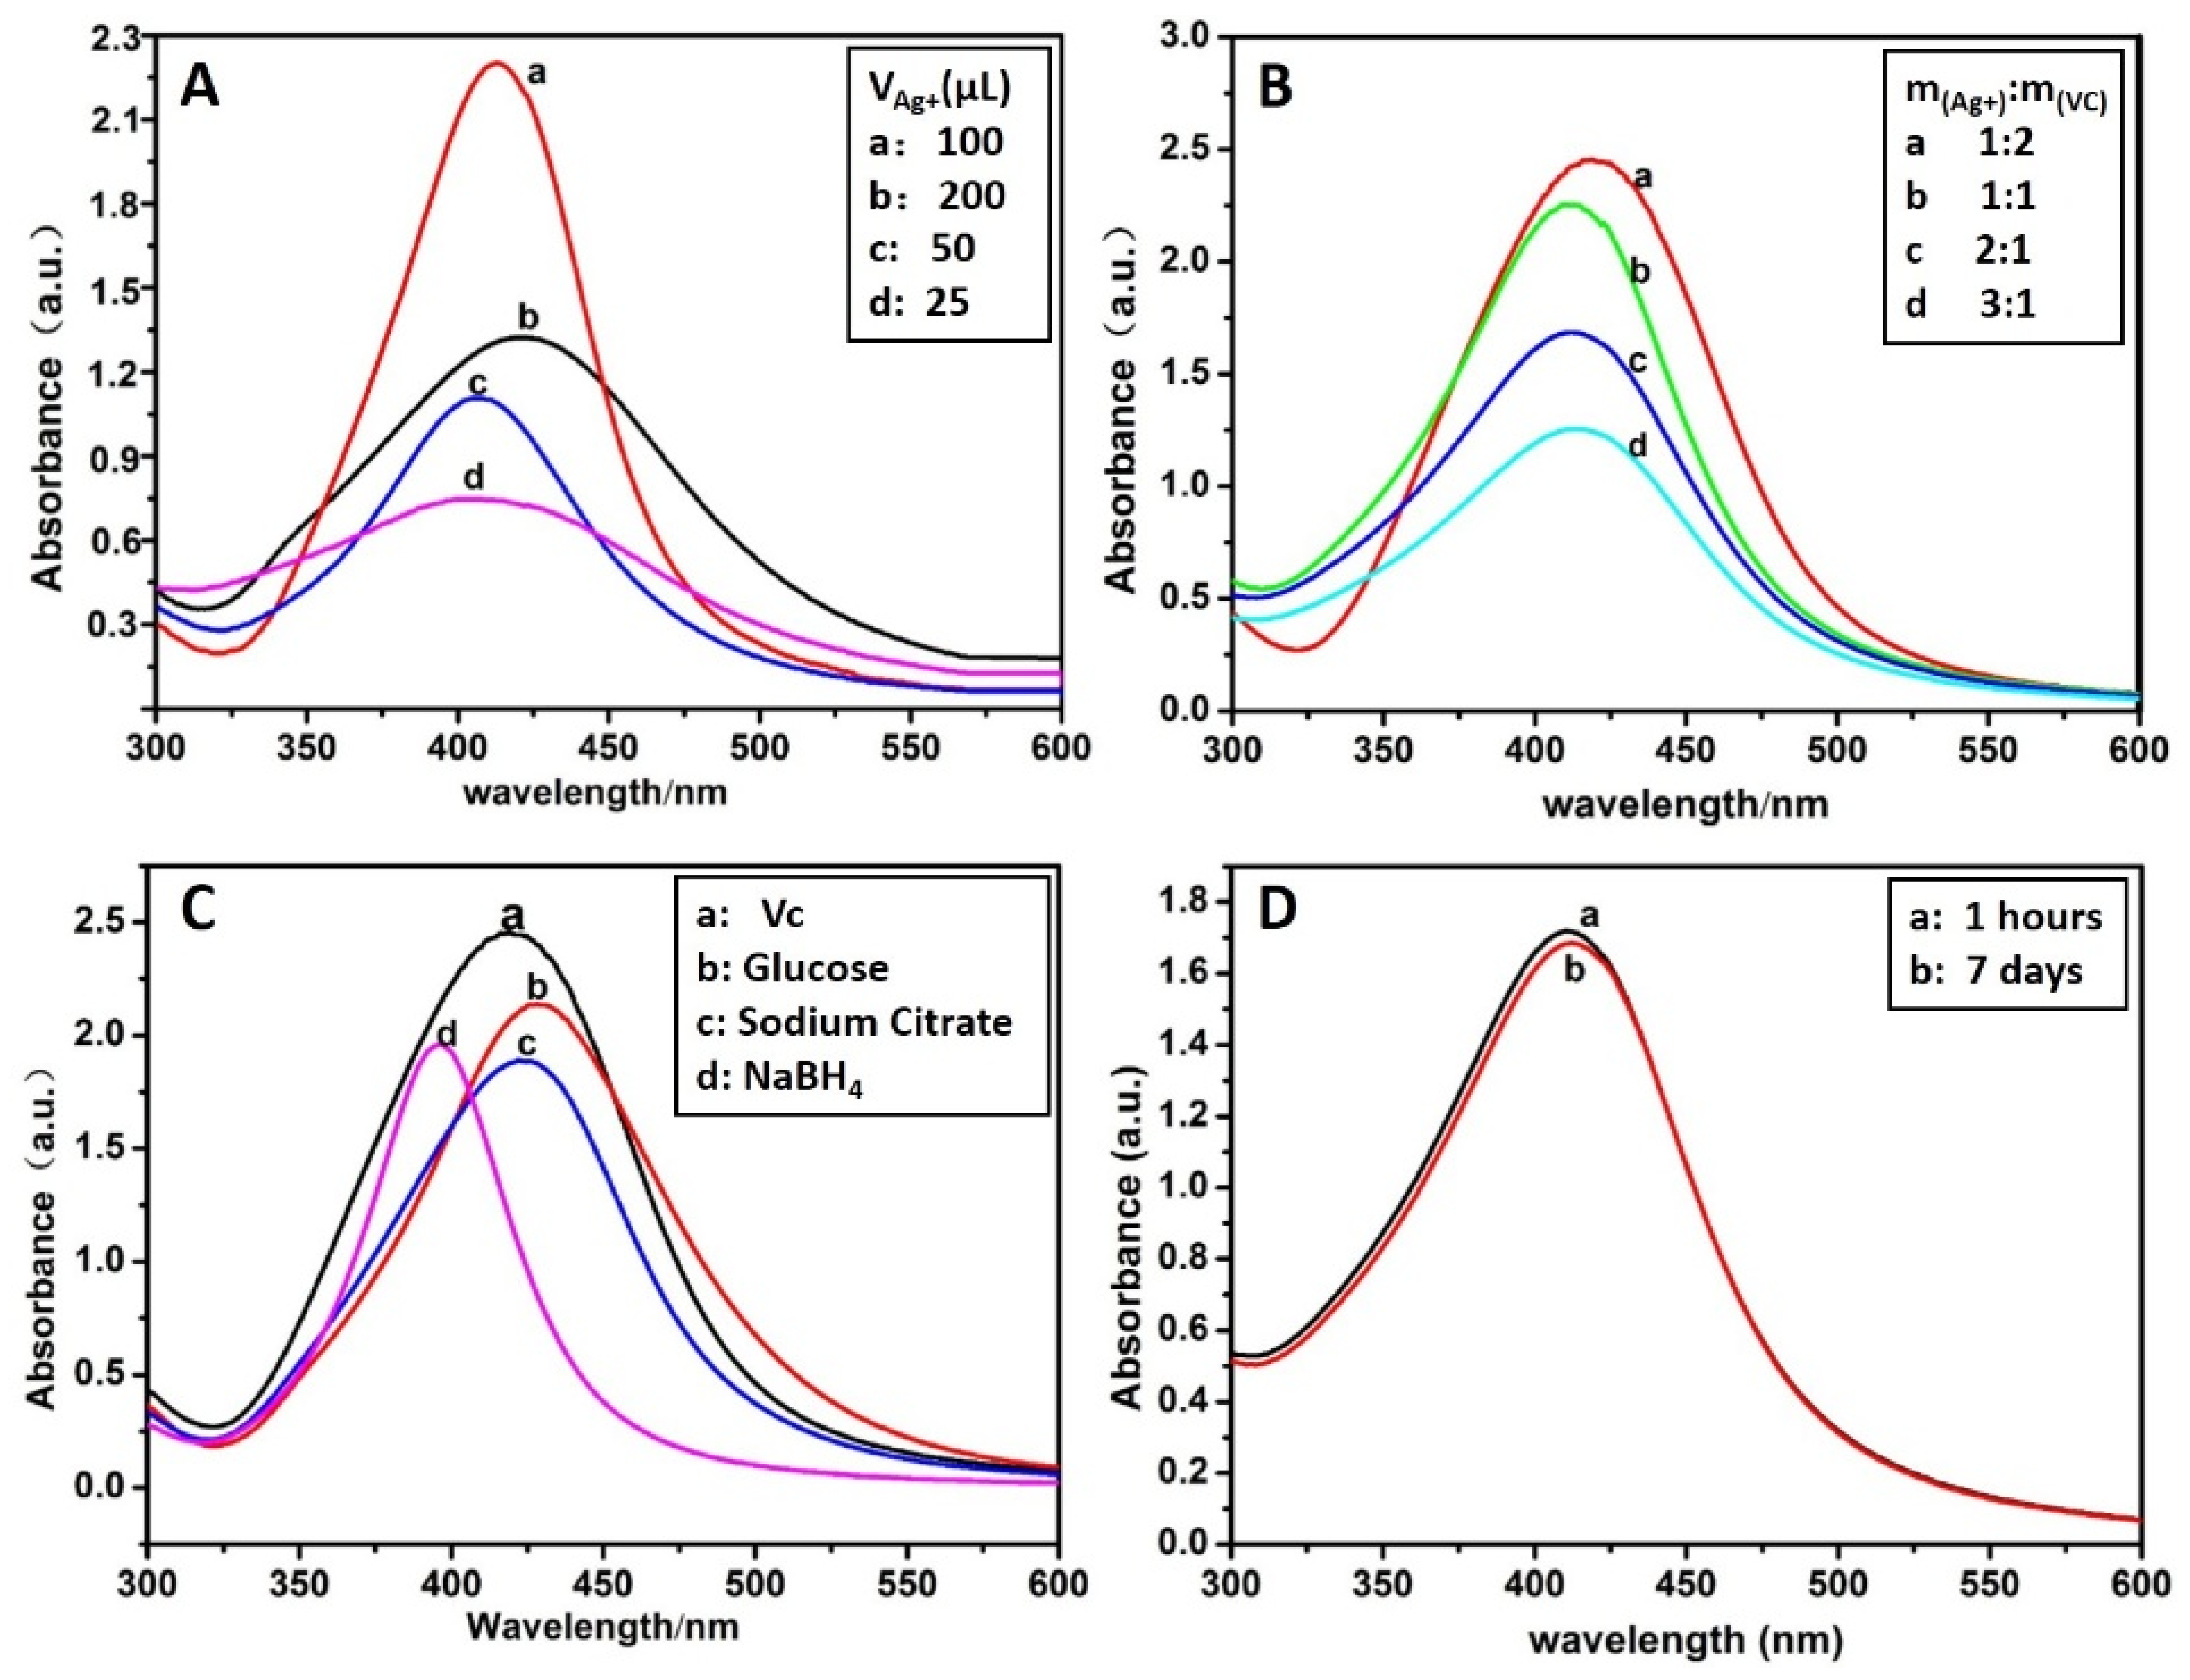
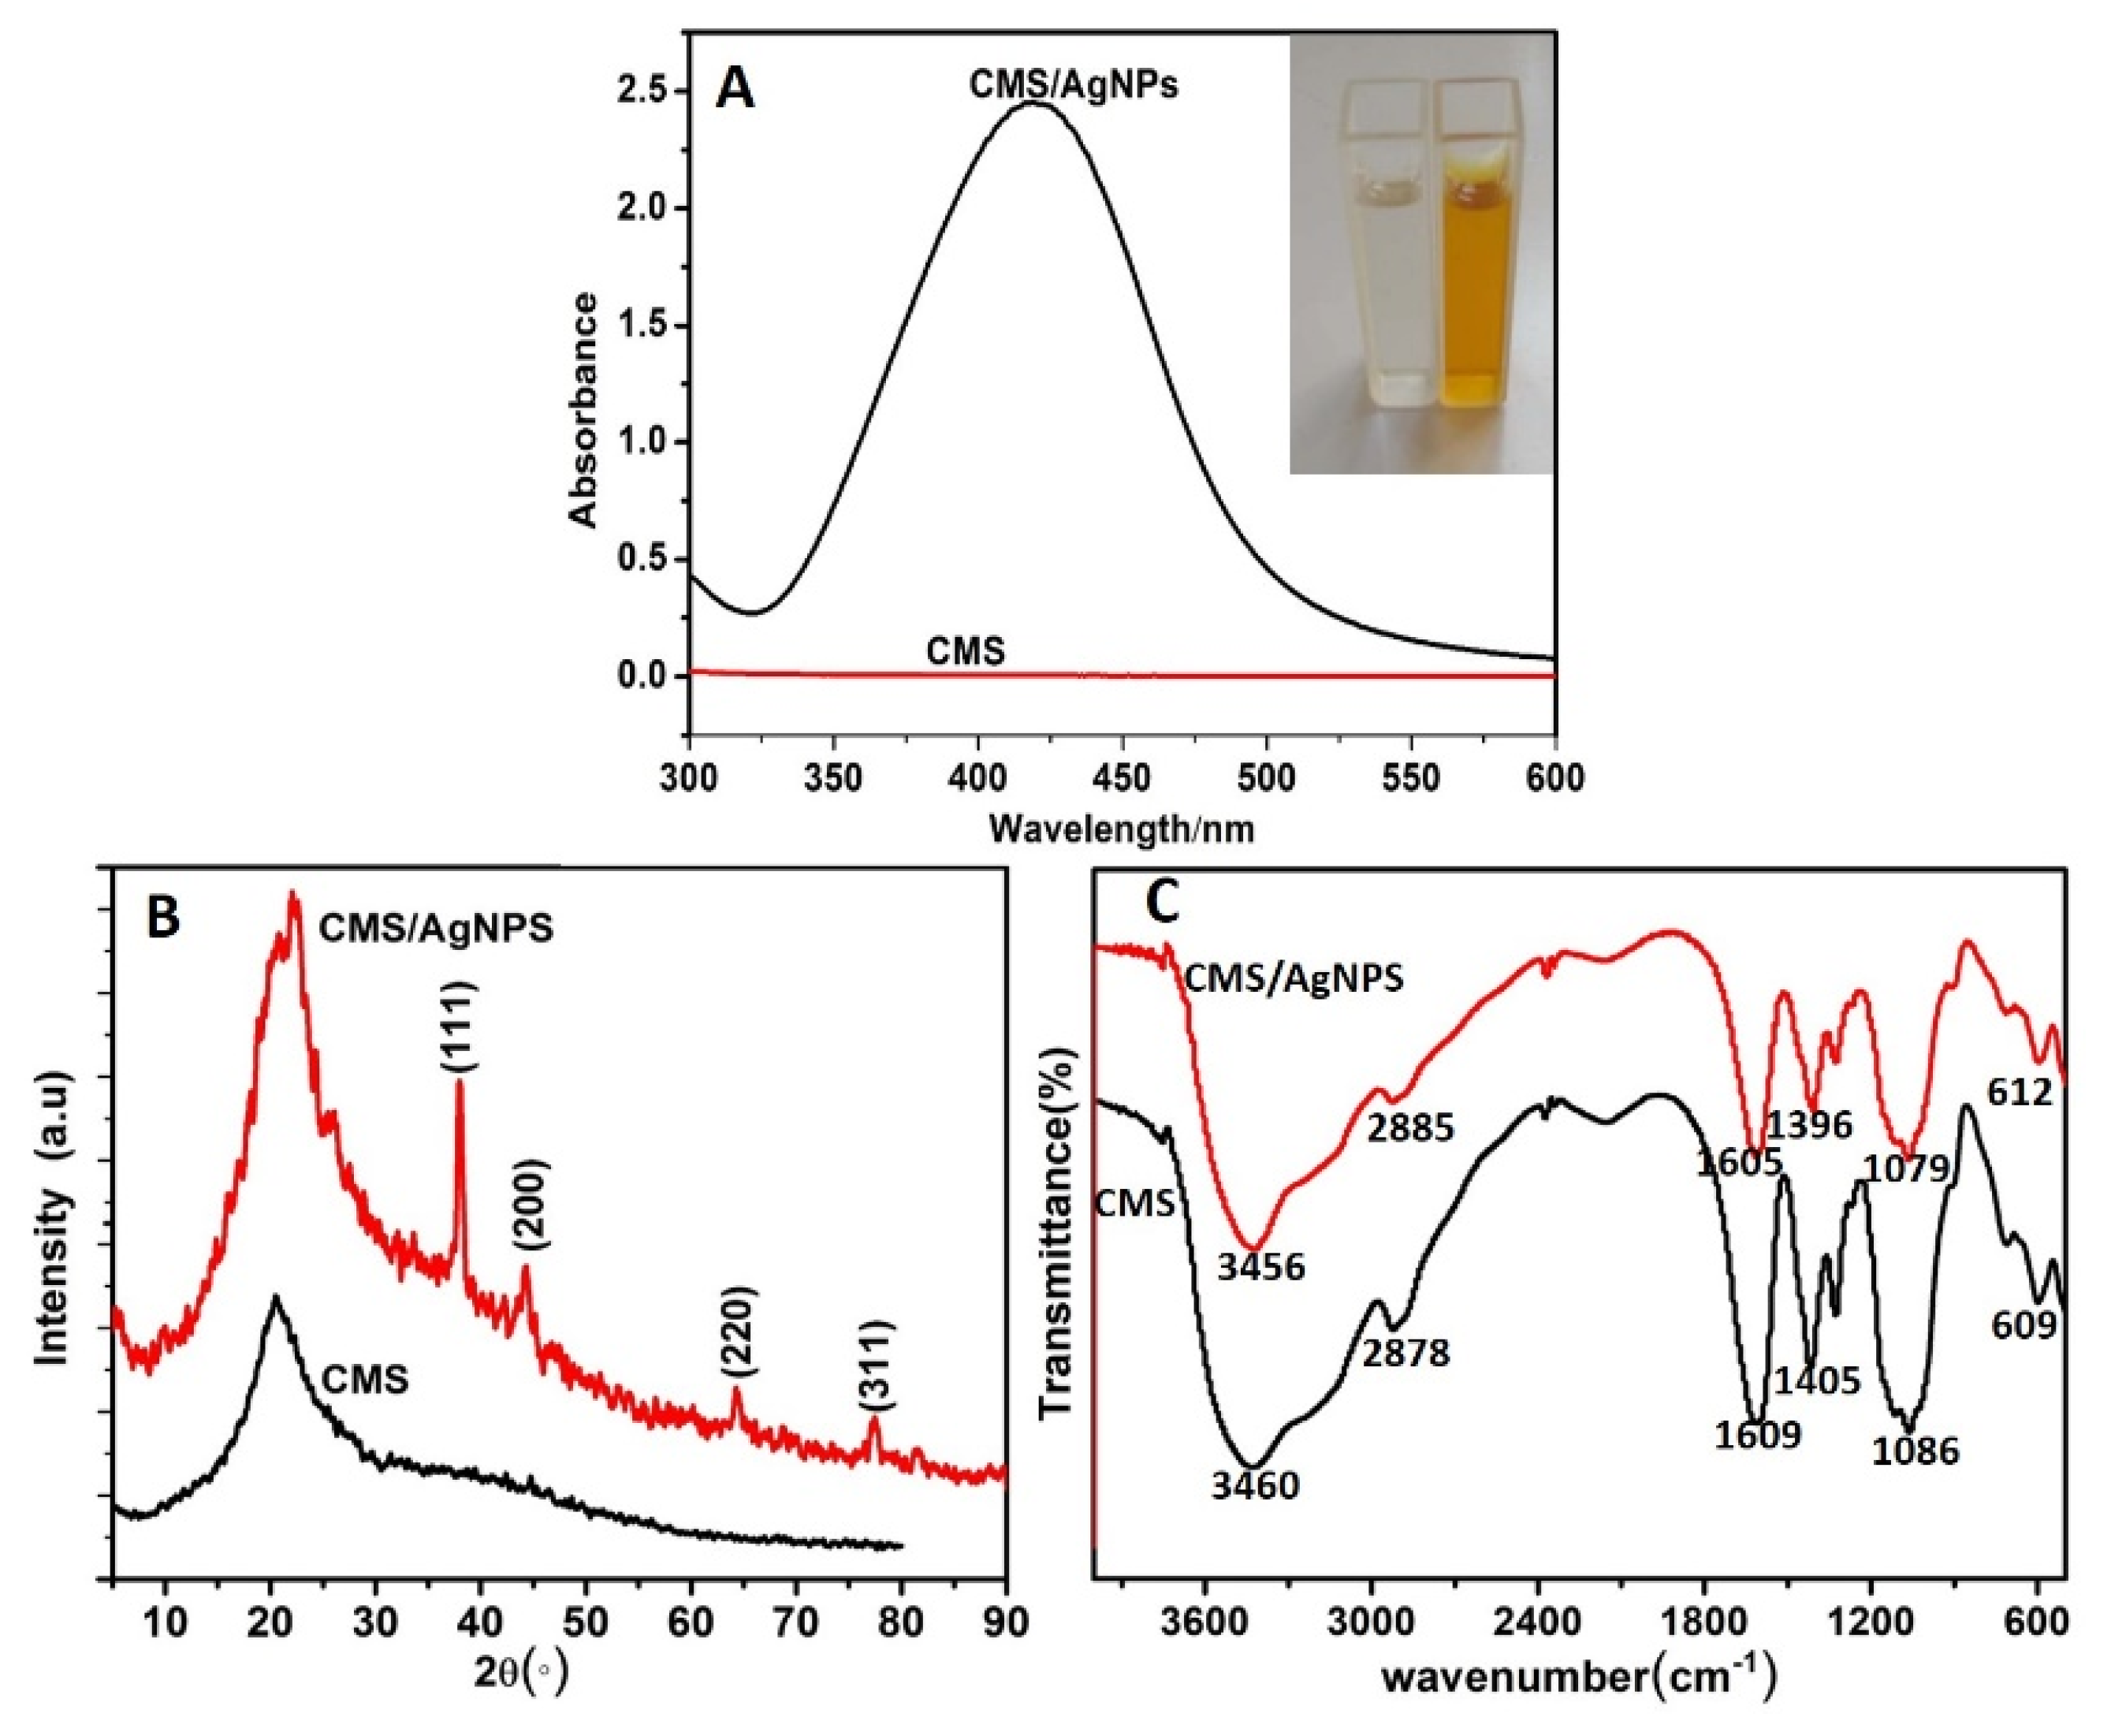
3.1. Preparation of CMS/AgNPs Colloidal Solution

When mixed with water, the CMS will form a gel because of the abundance of carboxyl groups on the surface of the CMS. The negative charge, such as that caused by carboxyl groups, can attract a positive charge [Ag(NH3)2]+ toward its polymer chains. Then the [Ag(NH3)2]+ around the carboxyl group was reduced in the presence of the reducing agent Vc and nucleated silver nanoparticles (Figure 1). The concentration of nano-silver is about 10−4 M in CMS/AgNPs colloidal solution. Furthermore, the UV–VIS spectral responses of the CMS/AgNPs were recorded at different pH in Figure S1. The pH of the synthesized CMS/AgNPs sol is 8.39. The CMS/AgNPs shows no noticeable effects with the change in pH from 6.59 to 10.51. However, the CMS/AgNPs shows spectral changes at low pH (<2.48) due to the COO in the CMS combined with H+ to form COOH, which reduced the stabilizing of AgNPs. These results confirm that CMS can stabilize AgNPs because of electrostatic adsorption between COO and [Ag(NH3)2]+.
Figure 2 is the optimal screening of the experiment. The absorbance of AgNPs increases with the increase of the amount of silver ions in Figure 2A. The absorbance of AgNPs decreases and red shift occurs in 200 μL of Tollens’ reagent, indicating that the nano-silver particles become larger at a higher concentration, so the optimal amount is 100 μL of Tollens’ reagent. The absorbance of AgNPs increases with the increase in the amount of Vc in Figure 2B. The absorbance of AgNPs decreases and red shift occurs in 200 μL Tollens’ reagent, indicating that the nano-silver particles become larger at a higher concentration, so the optimal amount is 100 μL of Tollens’ reagent. Figure 2C shows the UV–VIS spectra of CMS/AgNPs by synthesis with different reducing agents, indicating that Vc is weaker in reducing ability than NaBH4, but stronger than glucose and sodium citrate. The latter two require a catalyst for the reaction to synthesize AgNPs. The synthesized AgNPs with NaBH4 was weaker in stability than Vc, so Vc was the best, green reducing agent. The stability of the synthesized AgNPs is optimal in Figure 2D. We can see from Figure 2 that the best experimental conditions are CMS aqueous solution (0.1% (w/v), 100 mL) and 1:1 molar ratio of Tollens’ reagent (0.1 M, 100 μL) to Vc (0.1 M, 100 μL).

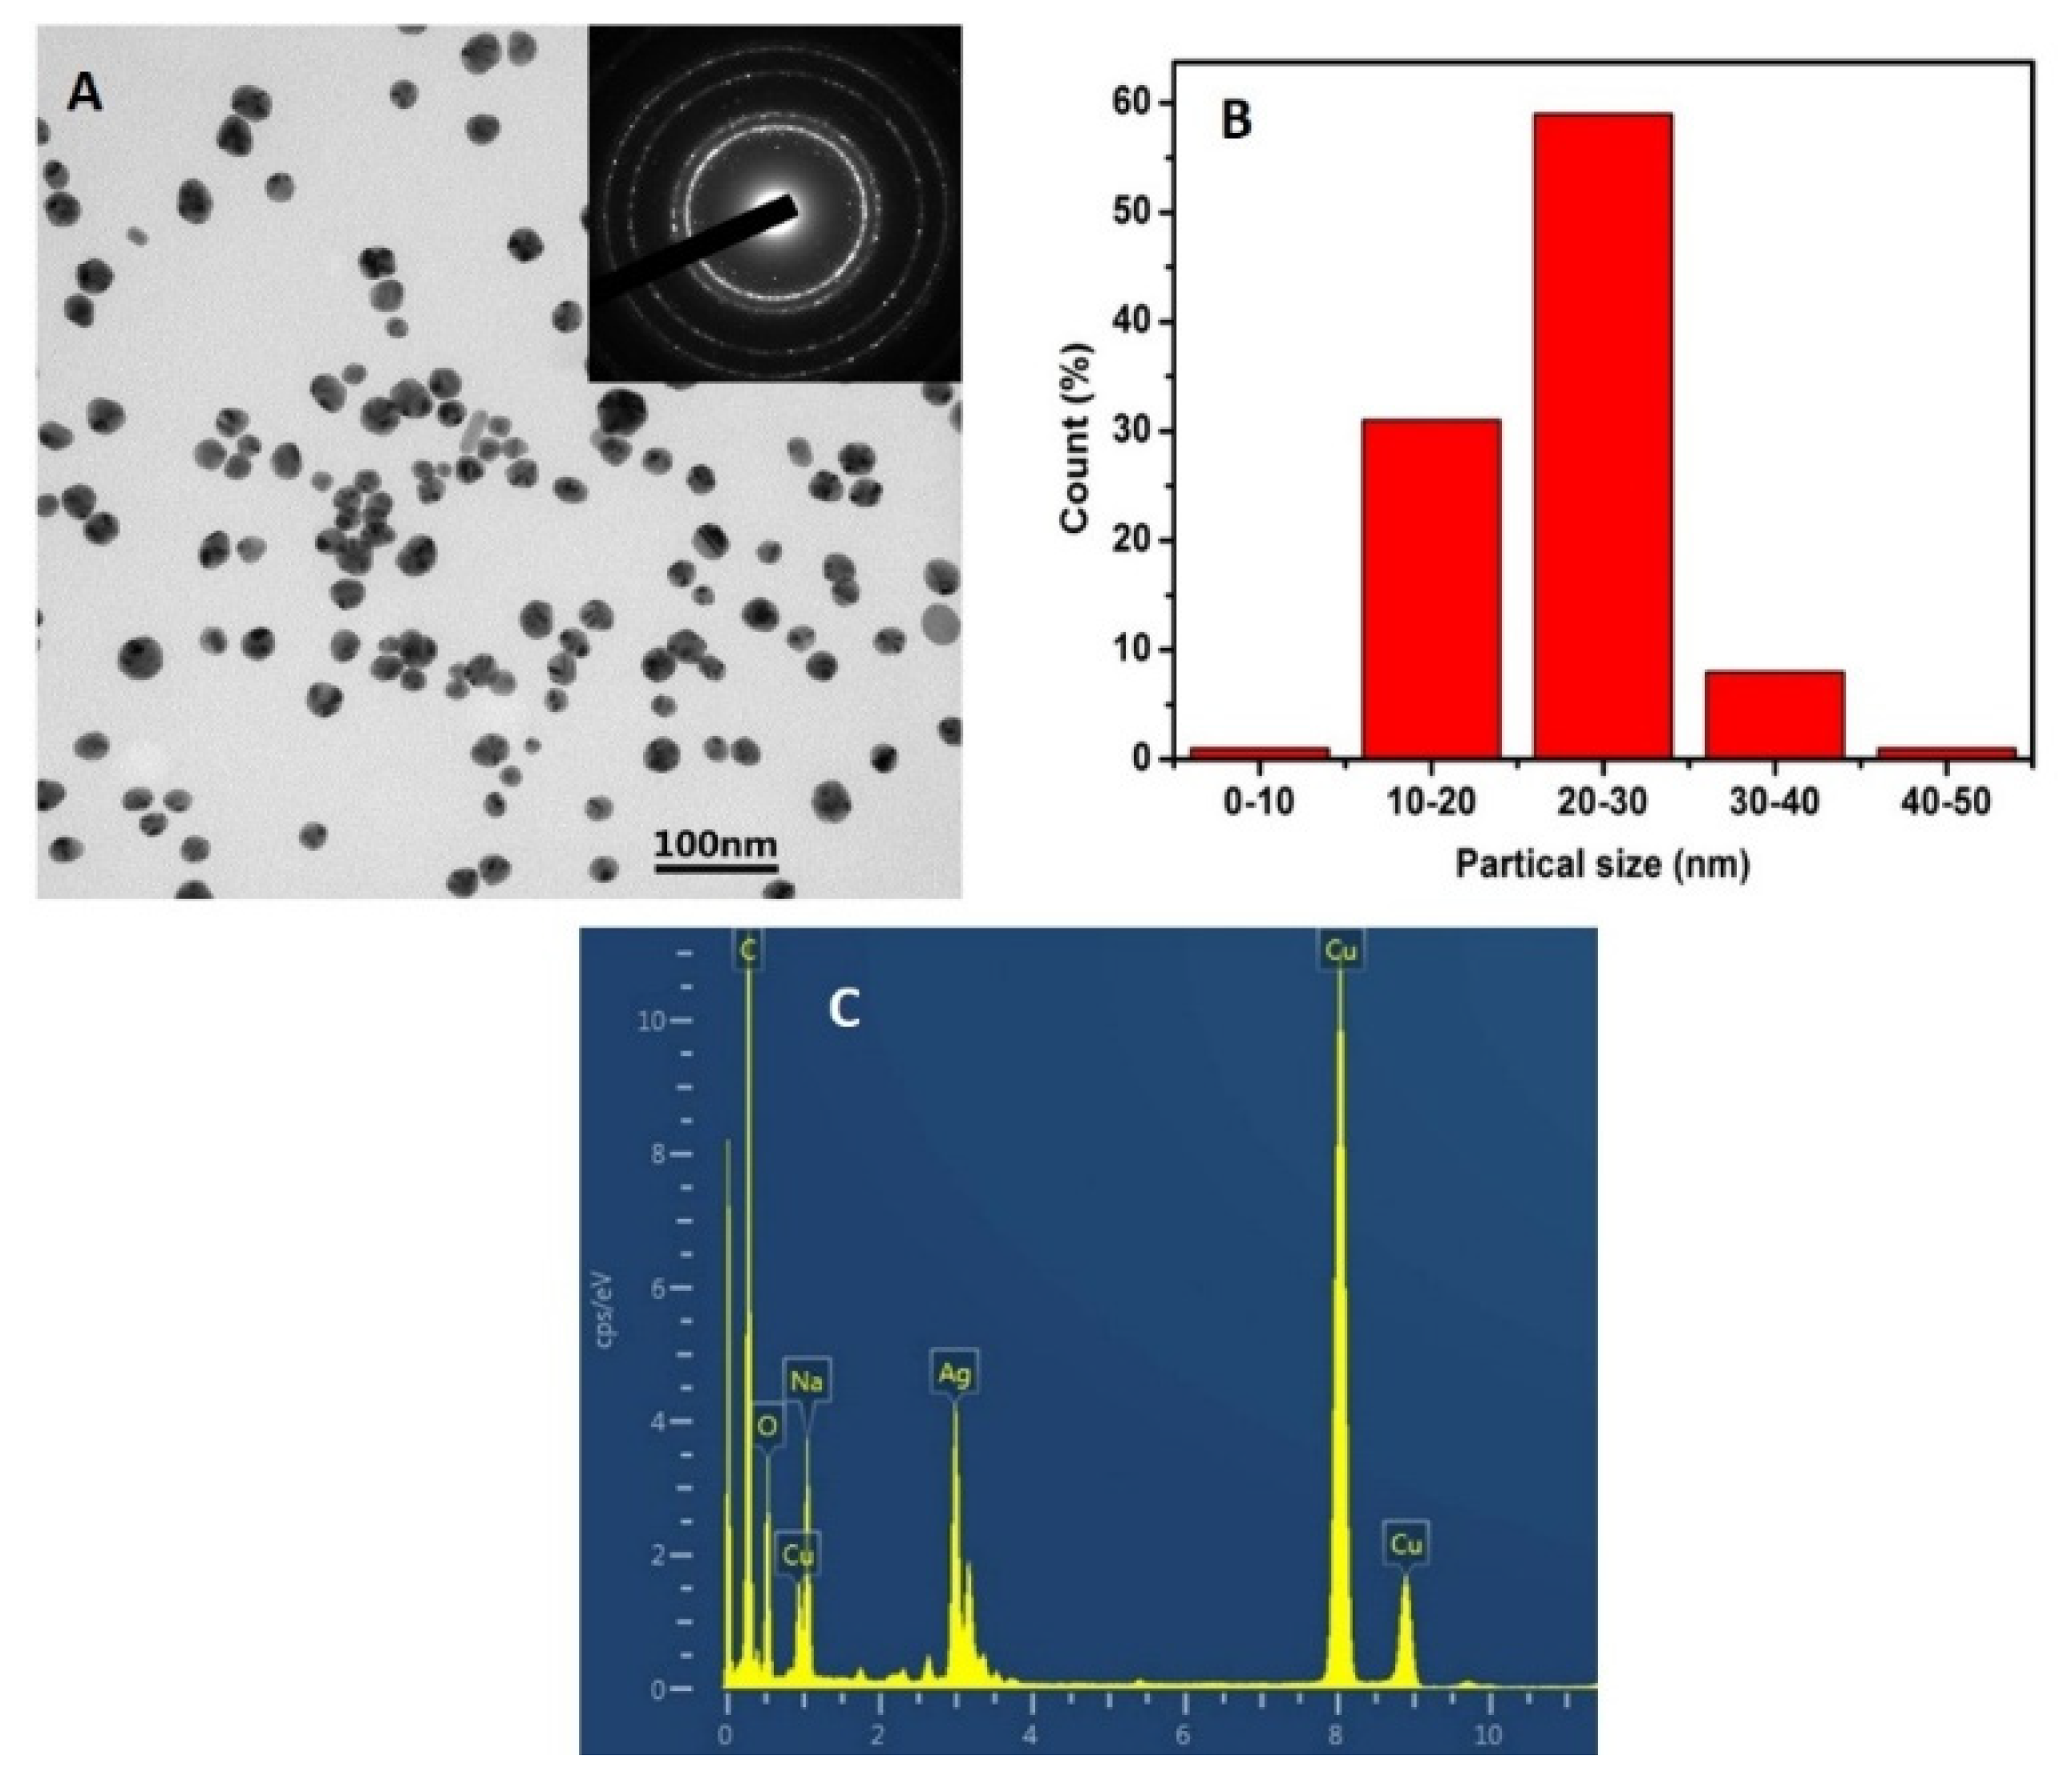
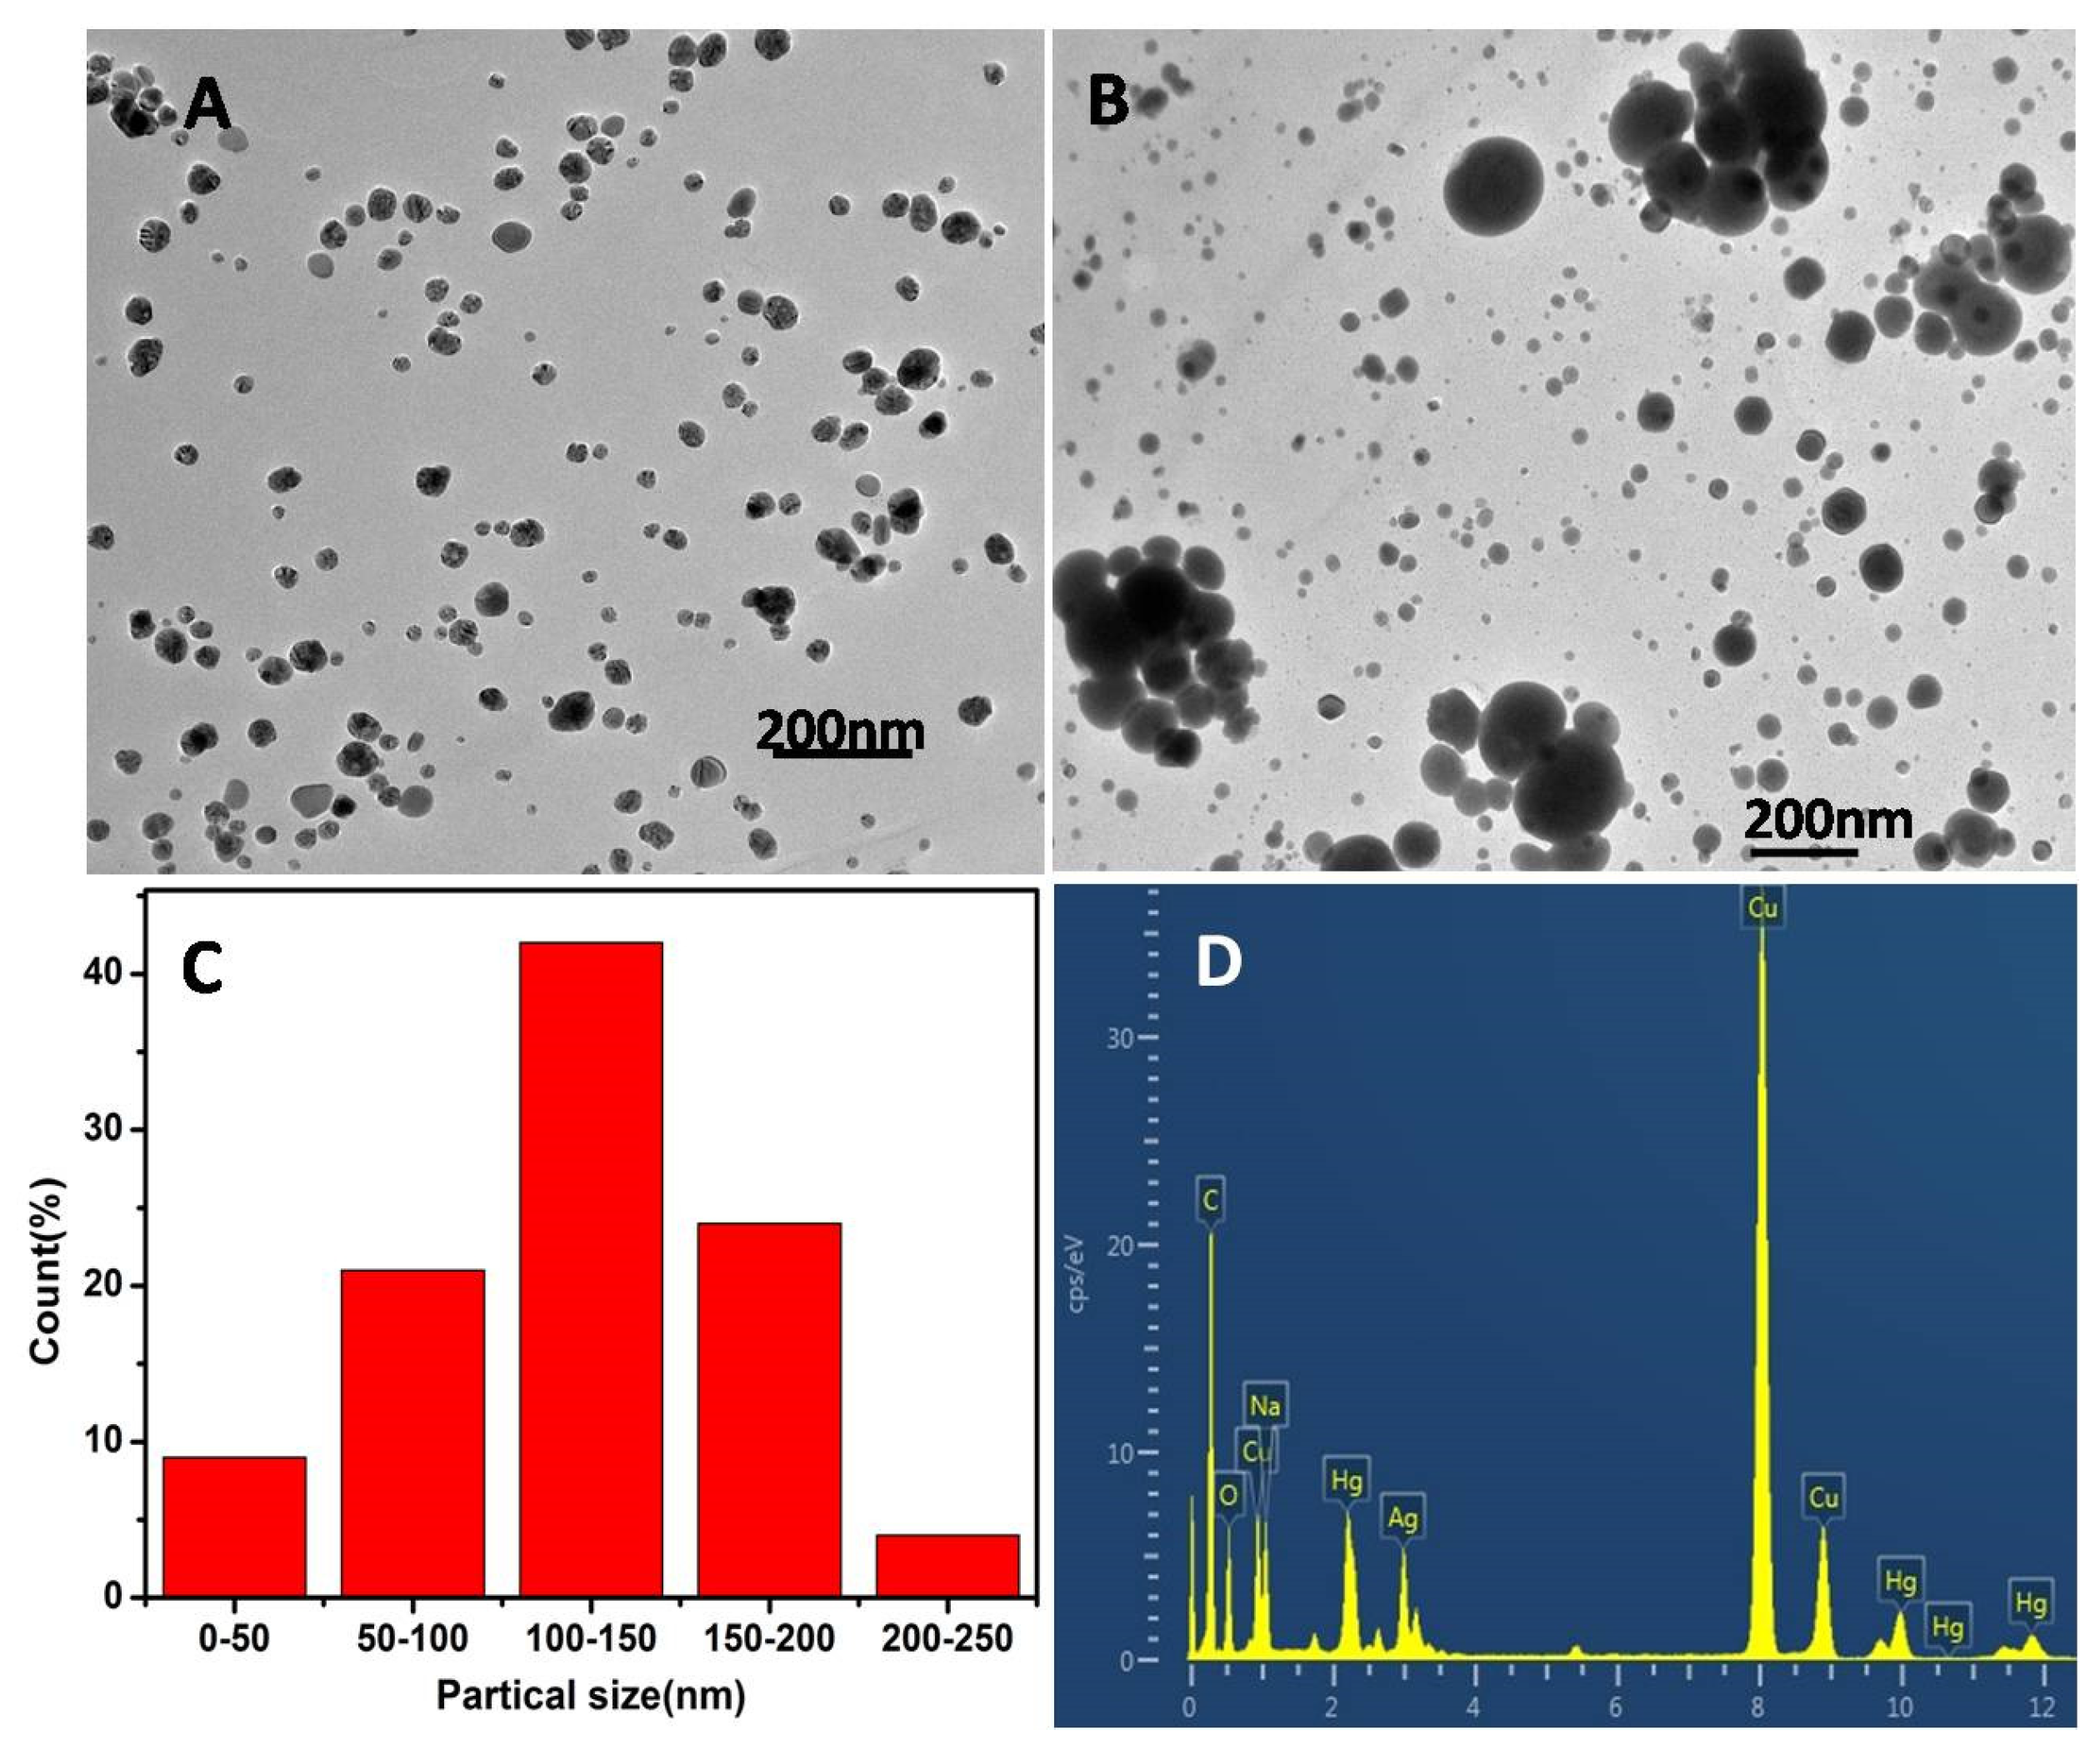
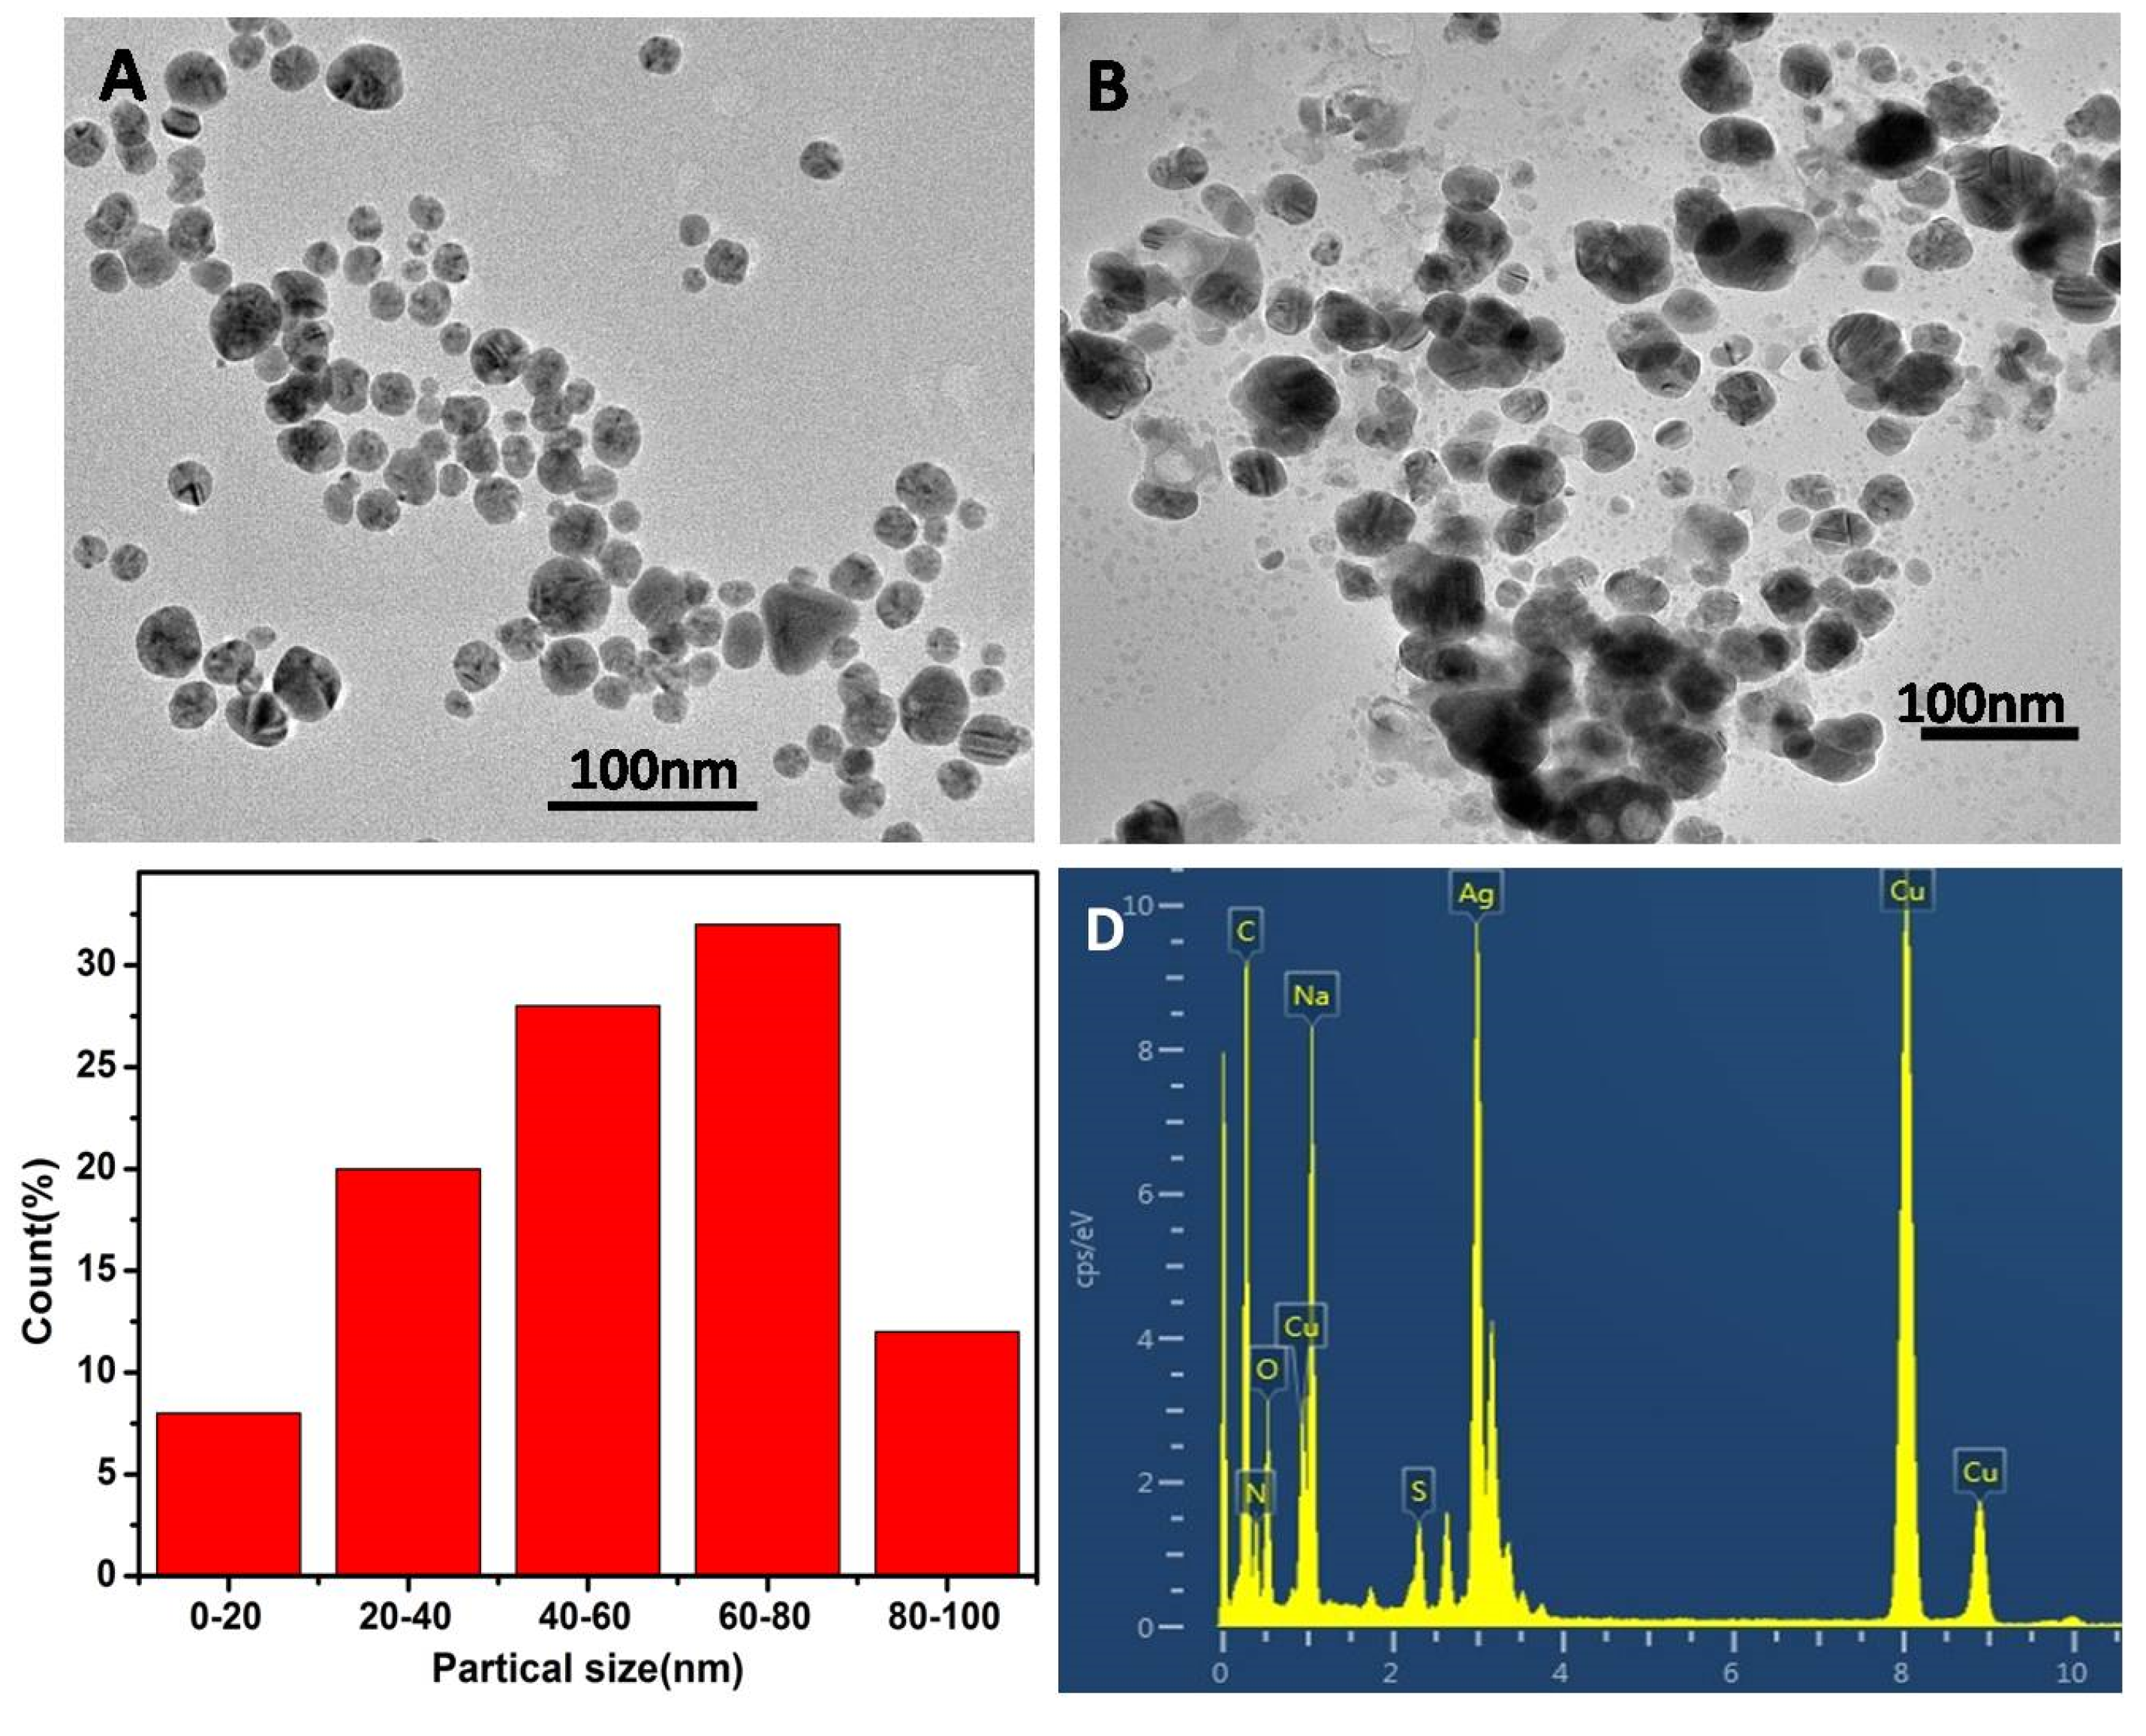
3.2. Characterization Studies of AgNPs

UV–VIS spectra demonstrated that AgNPs displayed a strong characteristic absorption peak within the visible region from 410 to 430 nm by comparing to CMS. The maximum absorption peak was located at 420 nm (Figure 3A) and the CMS/AgNPs colloidal solution was transparent yellow (inset, Figure 3A). The XRD pattern of AgNPs is represented in Figure 3B. The 2θ diffraction peaks at 38.10°, 44.26°, 64.61°, and 77.46° were assigned to the (111), (200), (220), and (311) planes of crystallized silver with face-centered cubic (fcc) AgNPs, which suggest that silver nanoparticles were prepared. Figure 3C shows the FT-IR spectra of CMS and CMS/AgNPs. For CMS/AgNPs, the band centered at around 3456 cm−1 can be attributed to the stretching vibration of the hydroxyl group; the band at about 2885 cm−1 is assigned to the C–H group; the band at around 1605 cm−1 is attributed to the stretching vibration of the carboxyl group; the band at around 1396 cm−1 corresponds to the C–H bending mode; the absorption band at 1079 cm−1 is ascribed to C–O–C stretching mode from the glucosidic units; the peak at 612 cm−1 is related to the deformation vibration of hydrogen bond. Figure 3C shows the FT-IR spectra of CMS which is similar to the CMS/AgNPs, indicating that there is no chemical reaction between the formed AgNPs and the CMS.
TEM image showed that the spherical AgNPs crystals were well dispersed into CMS 3D nano networks (Figure 4A). The diameters of the AgNPs were in the range of 10–30 nm and the average particle size was 20 nm (Figure 4B). The selected area electron diffraction (SAED) image of CMS/AgNPs with bright circular rings confirmed the polycrystalline nature of the synthesized AgNPs (inset, Figure 4A). As shown in Figure 4C, energy dispersive spectroscopy (EDS) was further implemented to analyze the exist of Ag (3.0 KeV).

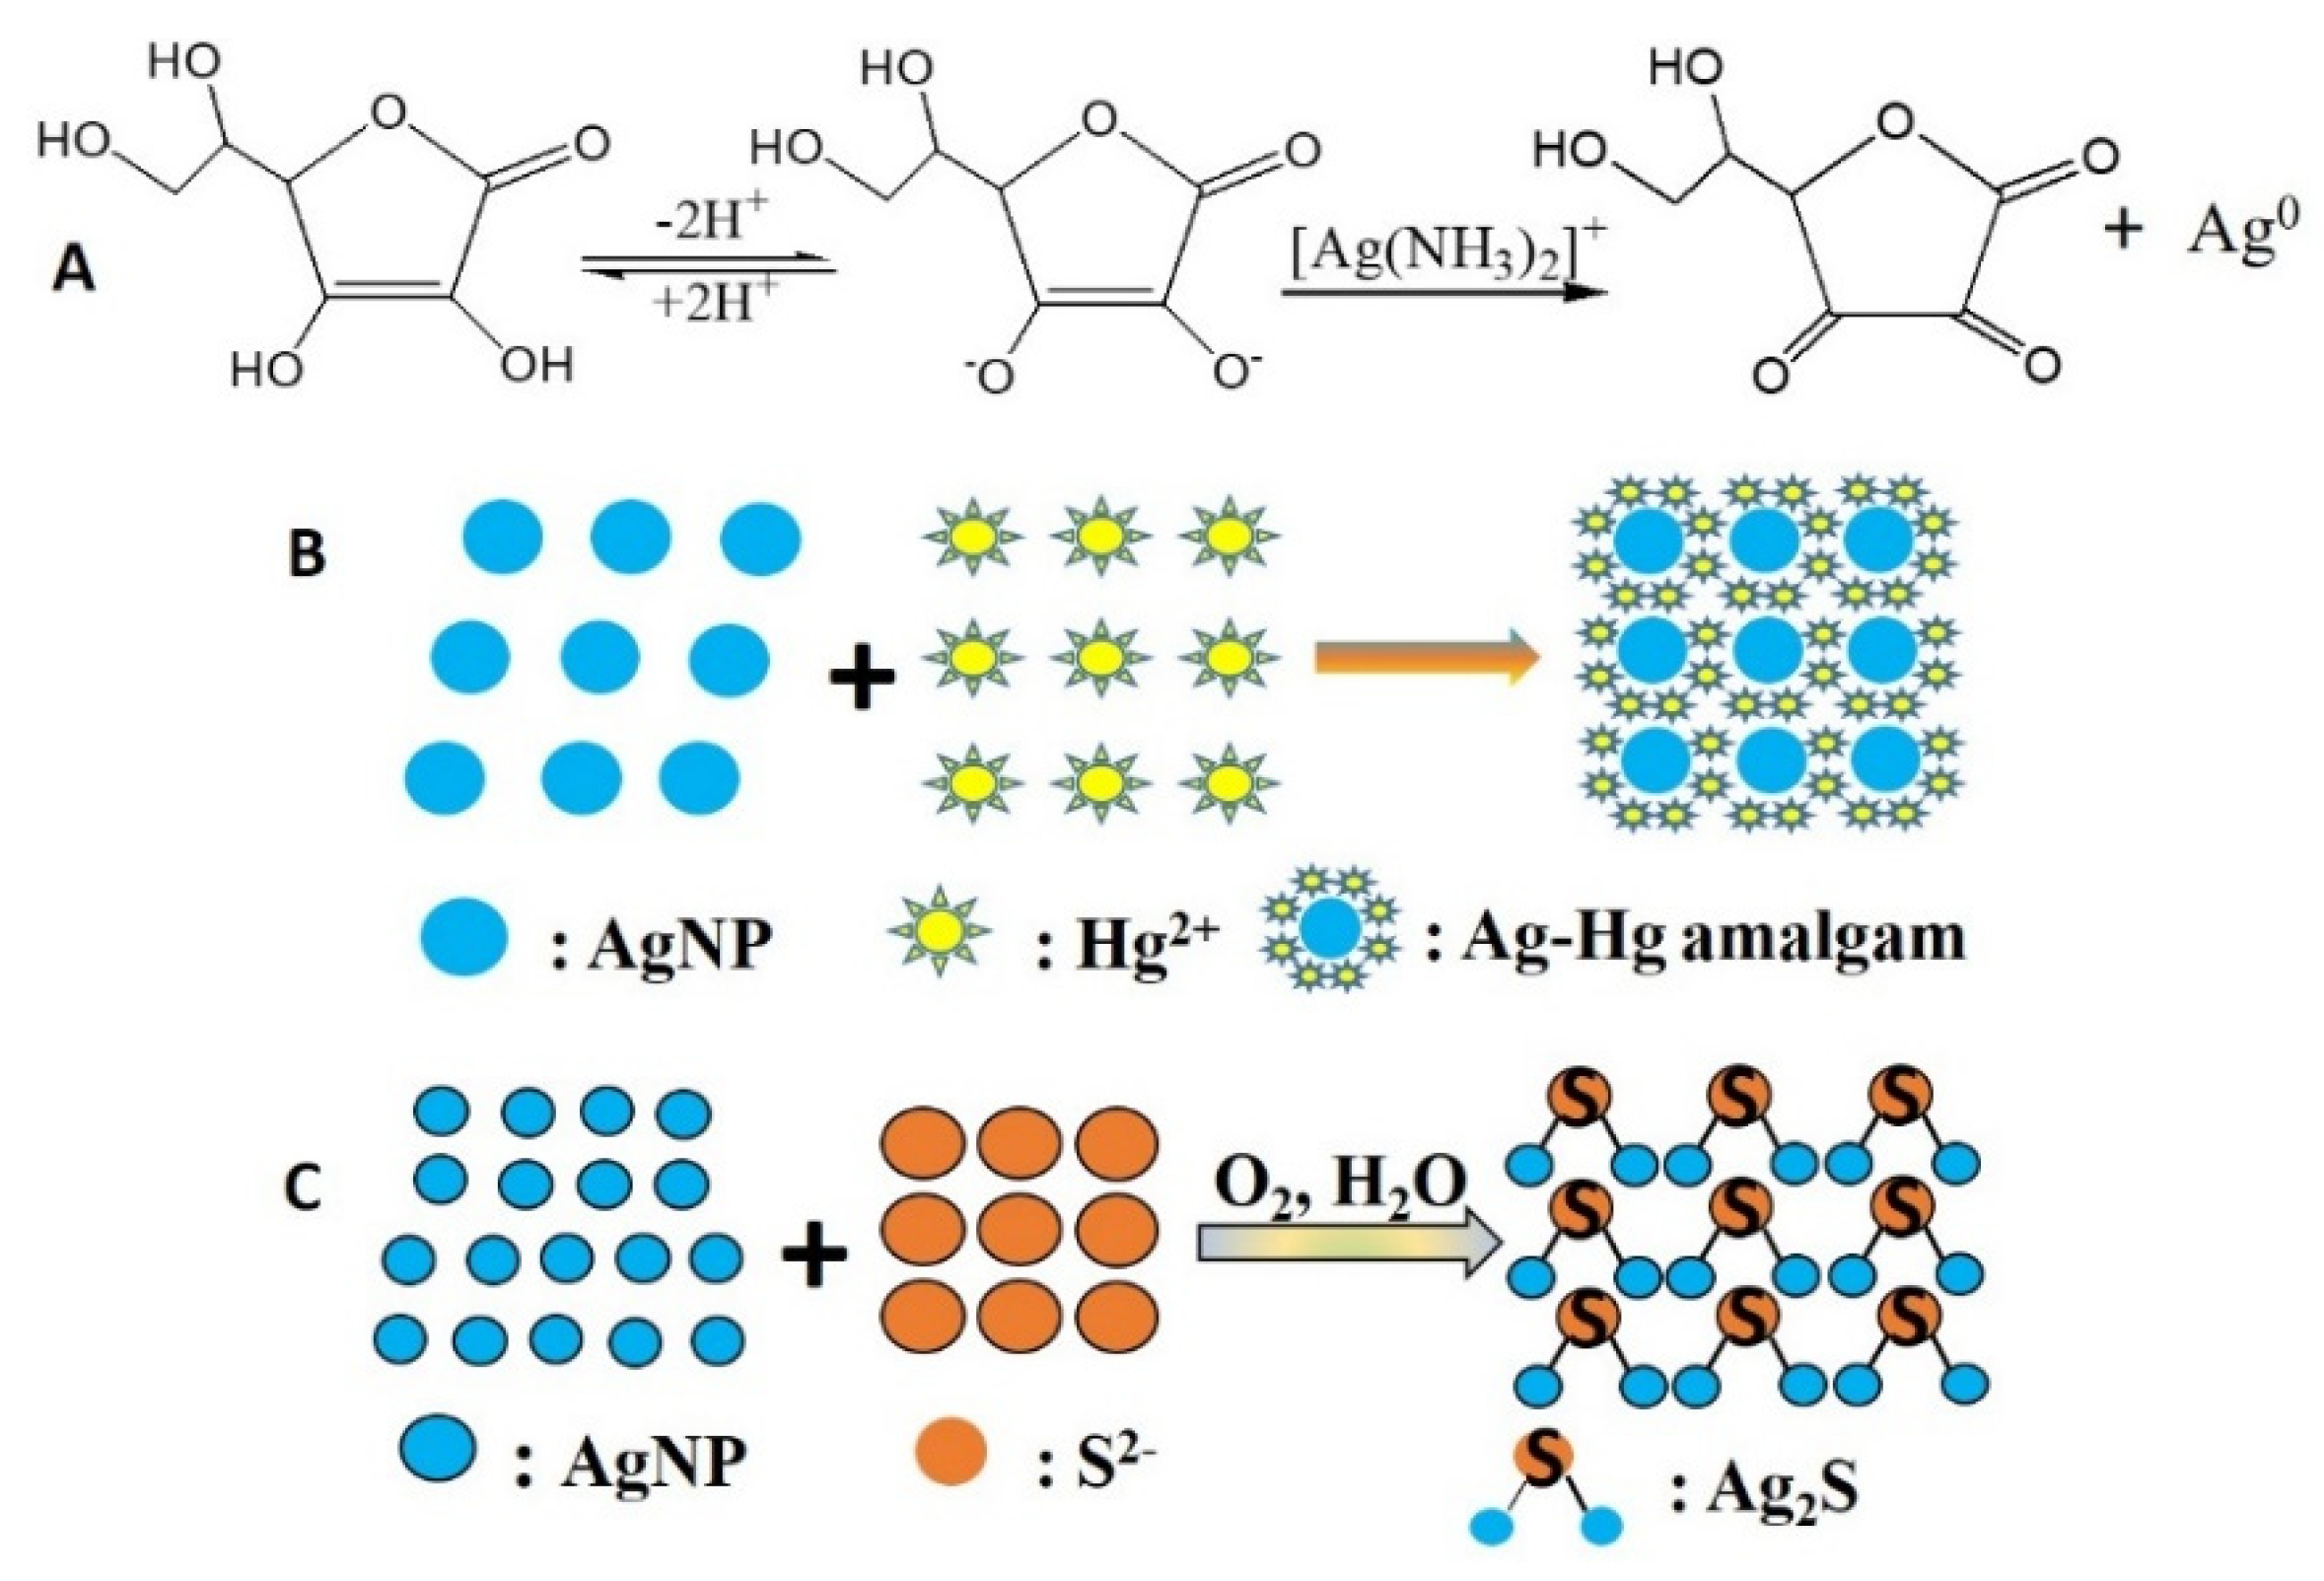
3.3. Mechanism for CMS/AgNPs Composites and the Detection of Hg2+ and S2−

CMS/AgNPs colloidal solution was prepared using ascorbic acid as the beginning reducing agent and Tollens’ reagent as the silver provider. The CMS was utilized as the stabilizer and reducing agent. Vc is a water-soluble vitamin and non-toxic reducing agent. There are double O–H with C=C bonds in the structure of Vc, so it has strong reducing ability. The synthesis process was carried out in an aqueous solution, and the synthesis method used a chemical in situ reduction method in Figure 5A. The synthesized raw materials were very cheap and green. Furthermore, the CMS/AgNPs colloidal solution could detect Hg2+ and S2− ions as the colorimetric dual-sensors. As the concentration of mercury ions increased, it was observed that the color of CMS/AgNPs colloidal solution gradually changed from yellow to colorless by the naked eye, and the morphology also changed, as shown in Figure 8B. The size of AgNPs was changed from 10–30 nm to 100–200 nm in Figure 8C and induced the aggregation of AgNPs. The reason is that Ag and Hg2+ ions on the surface of AgNPs undergo a redox reaction to form an Ag–Hg amalgam [29]. The mechanism that Ag0 and Hg2+ undergo a redox reaction to form Ag+ and Hg0 on the surface of AgNPs is shown in Figure 5B. Since the generated Hg adheres to the surface of AgNPs, AgNPs become larger and agglomerate. The addition of S2− ions results in a gradual color change of CMS/AgNPs from clear yellow to brown and even colorless, and the morphology of the CMS/AgNPs also changed from the original spheres to = amorphous particles. From TEM images (Figure 11B), we could see that the addition of S2− ions induced the aggregation of AgNPs and the size of AgNPs was changed from 10–30 nm to 40–80 nm, as shown in Figure 11C. The reason is that the addition of S2− induced the formation of Ag2S between Ag and S, as shown in Figure 5C and the aggregation of AgNPs [22]. The possible mechanism is as follows: Na2S is highly alkaline salt, S2− ions is hydrolyzed in aqueous solution to form HS, Ag0 is oxidized to Ag+ in the presence of O2 and HS, then Ag+ and S2− form Ag2S. However, the aggregation of AgNPs did not occur in the presence of any other ions, such as cations (Cu2+) and anions (SO42−). This shows that the selectivity of CMS/AgNPs colloidal solution for Hg2+ and S2− is very good.

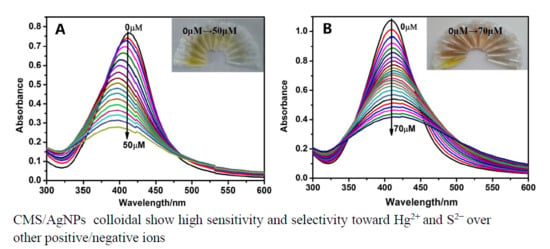
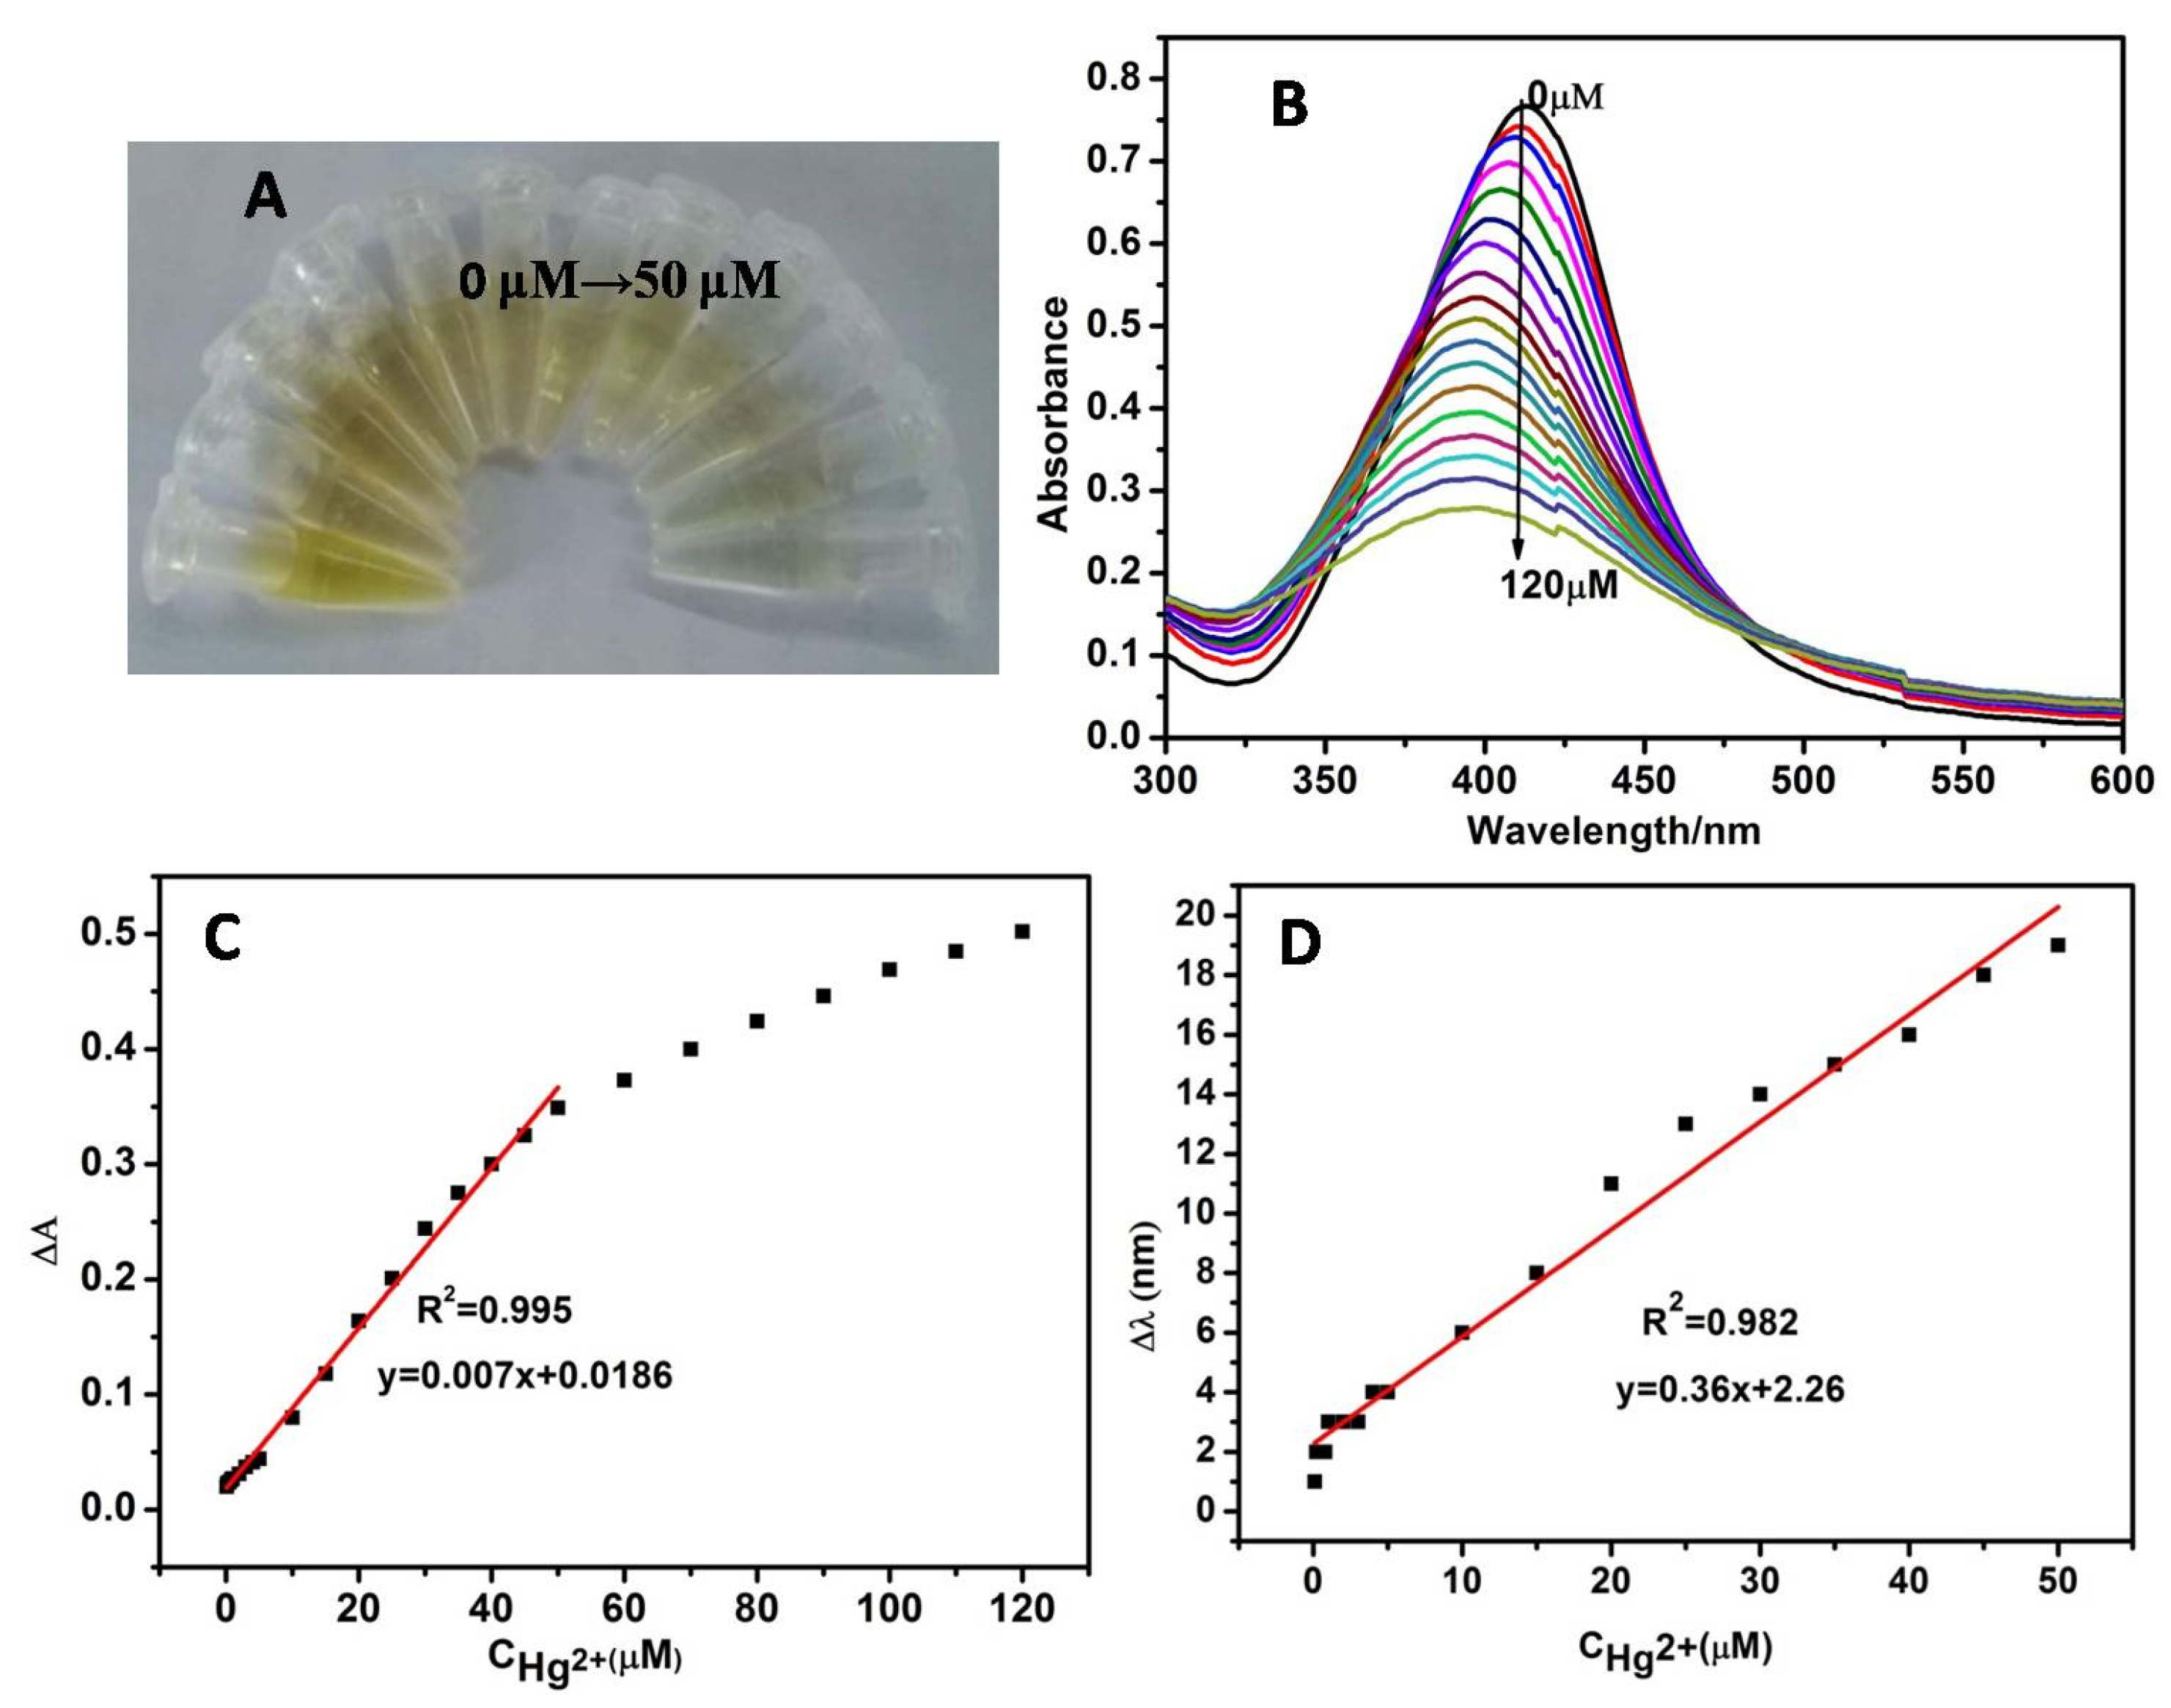
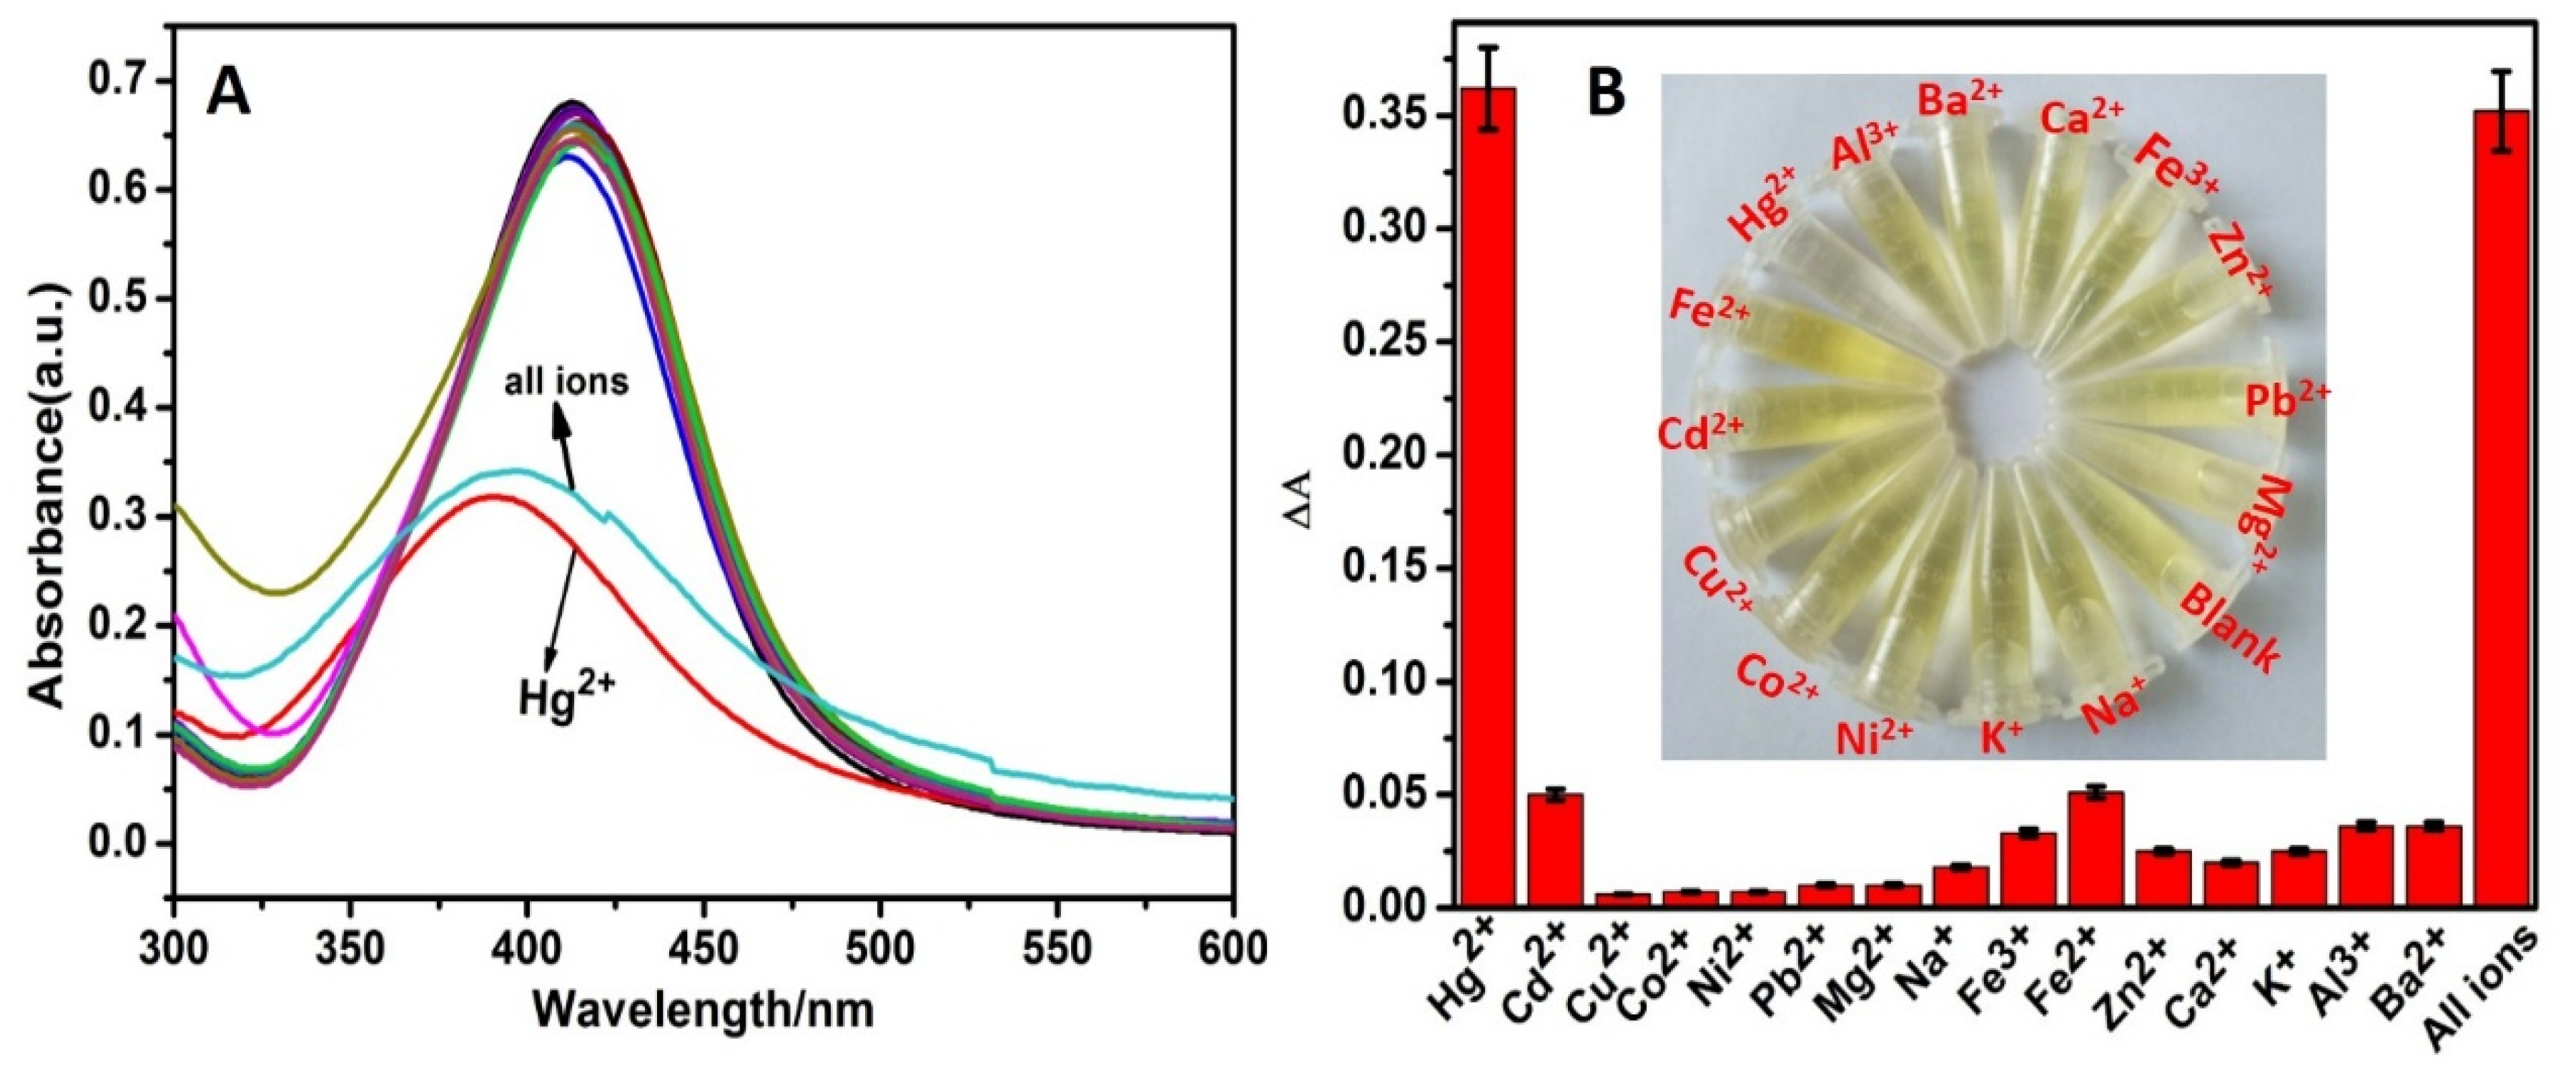
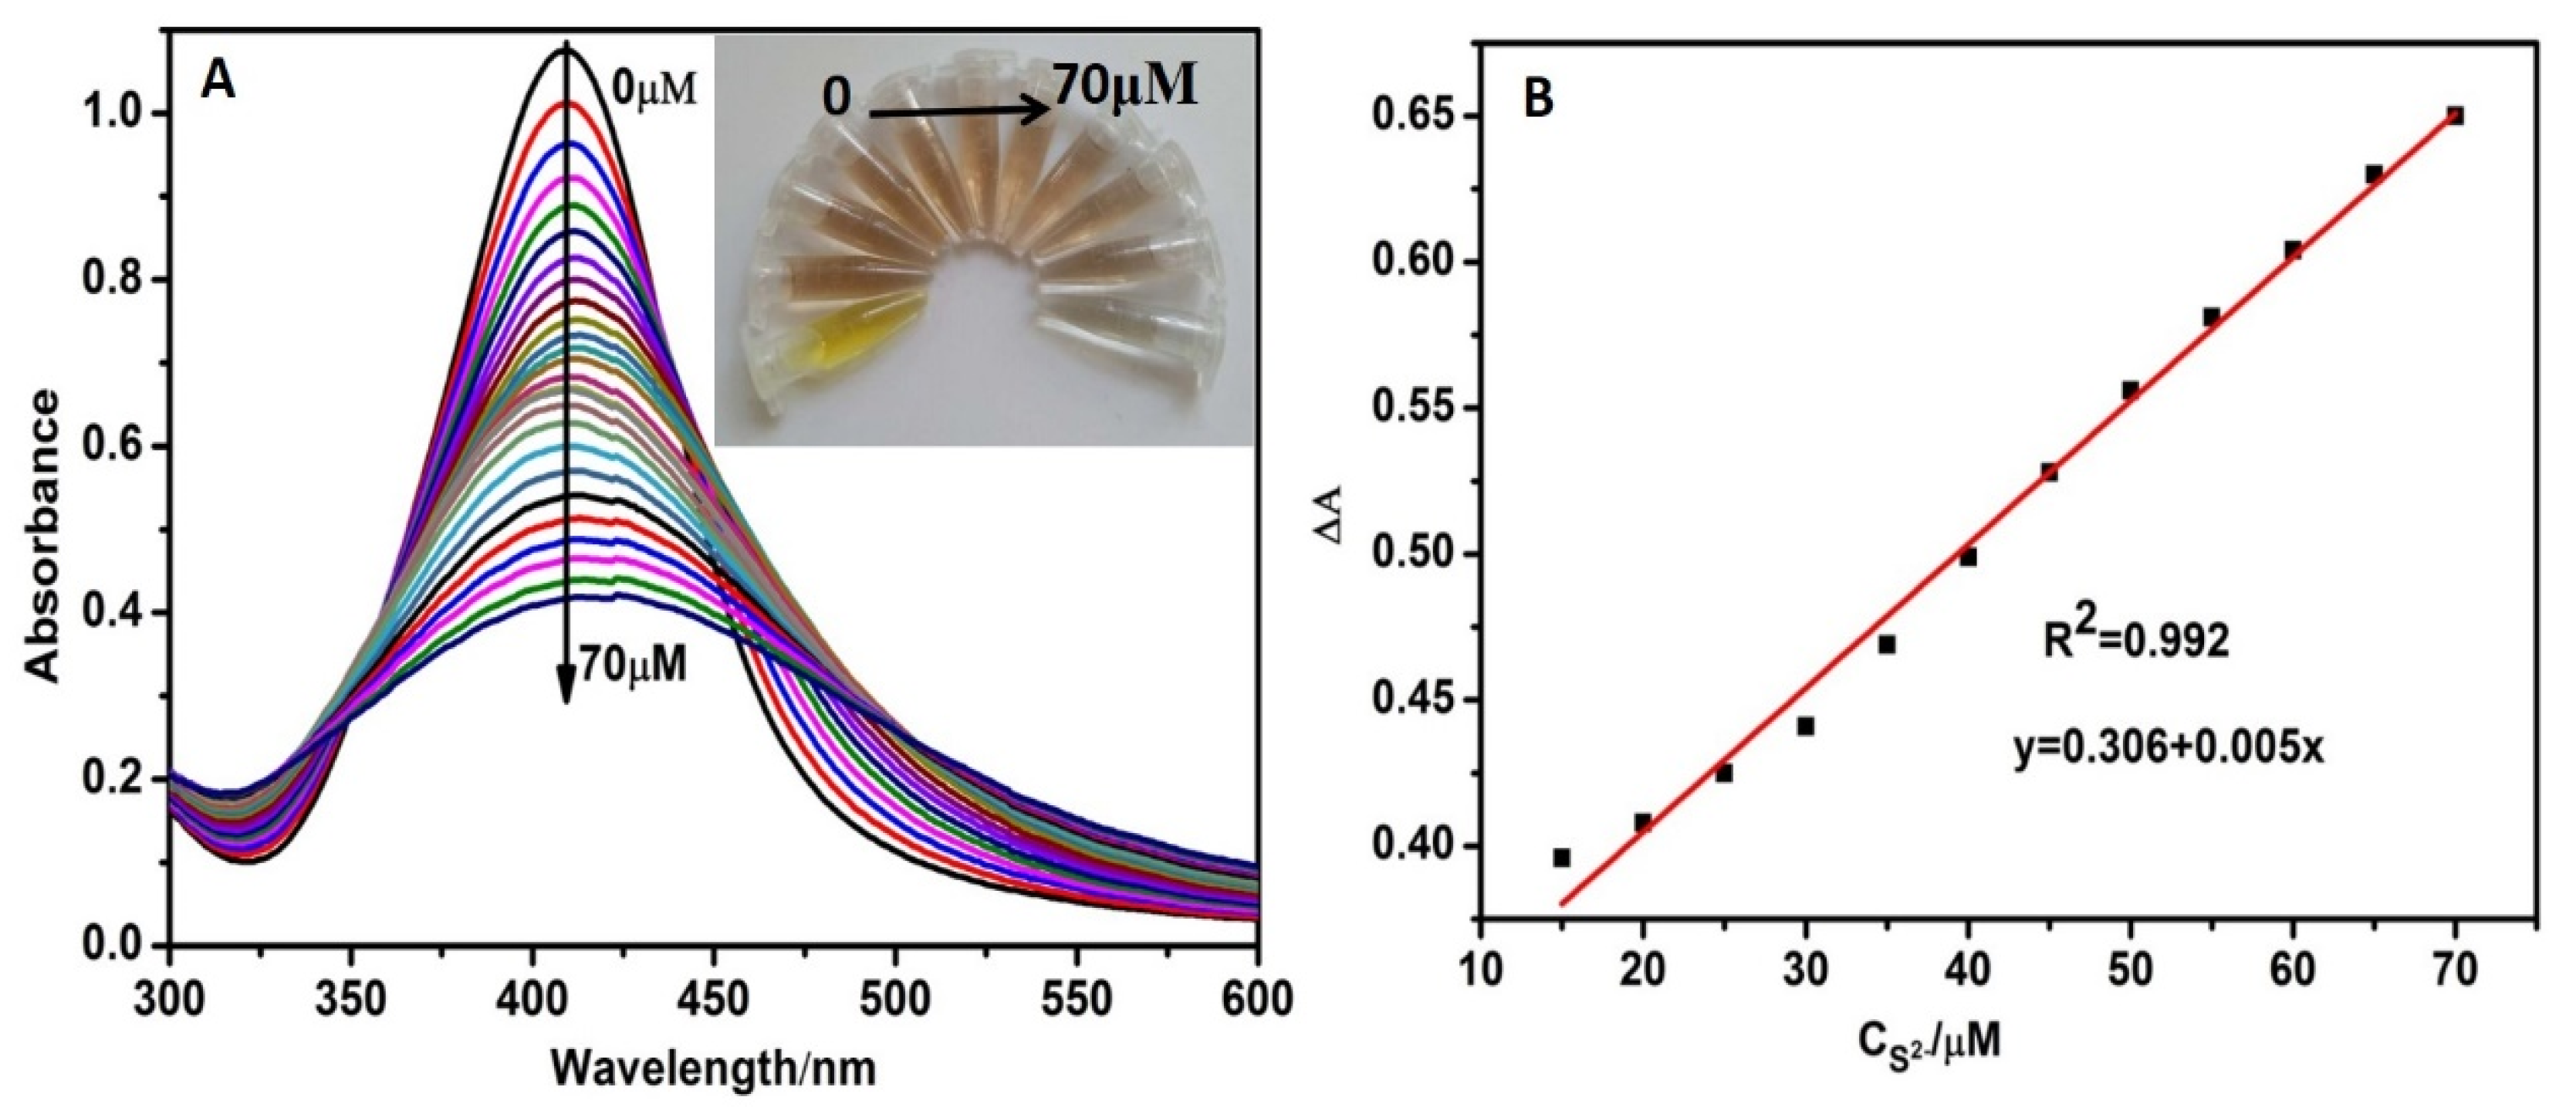
3.4. Detection Selectivity and Sensitivity of Hg2+

Under optimum conditions, the sensitivity of CMS/AgNPs colloidal solution for Hg2+ was investigated. As observed in Figure 6A, the color of the sensing system gradually faded away with increasing amount of Hg2+ and the color changed to colorless when the concentration of Hg2+ was 50 μM, thus providing a platform for a colorimetric detection of Hg2+ by naked eyes. The absorption peak of AgNPs decreased gradually following the addition of Hg2+ and the maximum absorption wavelength of AgNPs displayed a distinct blue shift (Figure 6B). The reason is that Ag and Hg2+ ions on the surface of AgNPs undergo a redox reaction to form a Ag-Hg amalgam, which caused the reduction of the nano-silver concentration and smaller AgNPs, resulting in a decrease in the absorbance and a blue shift in the wavelength [29]. In order to analyze the correlation between ΔA and the Hg2+ concentration, the absorption changes with the addition of the ion concentration in the range of 0–120 µΜ were conducted. Based on these data, as shown in Figure 6C, there is a good linear relationship (R = 0.995) between ΔA and the Hg2+ (0–50 μM) concentration, and the LOD for Hg2+ was estimated to be 18 nM. Meanwhile, from Figure 6D, we can see a good linear relationship (R = 0.982) between Δl and the Hg2+ concentration in the range of 0-50 μM and the LOD was approximately 3.3 nM. From Figure S2, we can see that the stronger the reducing ability of the reducing agent, the smaller the average particle size of the synthesized AgNPs. Table S1 shows that the smaller the particle size of AgNPs, the lower the LOD of Hg2+. This phenomenon could be attributed to the high specific surface areas and surface energy of smaller size of AgNPs, when Hg2+ ions were added to the CMS/AgNPs colloid solution, the contact area and reactivity between AgNP and Hg2+ increases along with the size decrease of AgNPs, thus quickening the adsorption and reaction speed. Even at a low concentration of Hg2+, obvious absorbance signals can be obtained in the CMS/AgNPs colloid solution. These results indicated that the small nanoparticles have good sensitivity and lower LOD.
To evaluate the selectivity of CMS/AgNPs colloidal solution, besides Hg2+, 14 other kinds of metal ions, including Cd2+, Co2+, Cu2+, Fe3+, Fe2+, K+, Al3+, Ba2+, Ca2+, Mg2+, Na+, Ni2+, Pb2+, and Zn2+, were selected. The absorption spectra of AgNPs with various metal ions are given in Figure 7A. Comparing these plots, only Hg2+ had a response to AgNPs, and upon the addition of Hg2+, the absorption peak decreased and exhibited an obvious blue shift. For the 14 other metal ions, the absorption spectra were almost unchanged even at the maximum concentration (50 μM). As shown in Figure 7B, the change of ΔA was 0.36 in the presence of Hg2+, but there was no obvious change observed in the presence of other metal ions. The color of the sensing system did not change after the addition of other metal ions (50 μM) except for Hg2+, which made the system change from yellow to colorless (inset, Figure 7B). In addition, in the presence of all anions, the relative absorbance values were analogous to that of the Hg2+ value. These results clearly indicated that other related anions did not interfere with the spectral and colorimetric detection of Hg2+. The experimental results verify that our proposal shows unique selectivity for Hg2+.
Transmission electron microscopy (TEM) was used to study the nanoparticles’ size and the morphology of AgNPs. It can be seen from Figure 8A that the addition of copper ions had little effect on the morphology of nano-silver. Figure 8B showed TEM images of AgNPs in the presence of Hg2+, the addition of Hg2+ induced the increase in size and the aggregation of nanoparticles, The diameters of the AgNPs were in the range of 50–200 nm and the average particle size was 150 nm, as shown in Figure 8C. EDS showed three peaks in the elemental analysis in Figure 8D, which was consistent with our analysis.

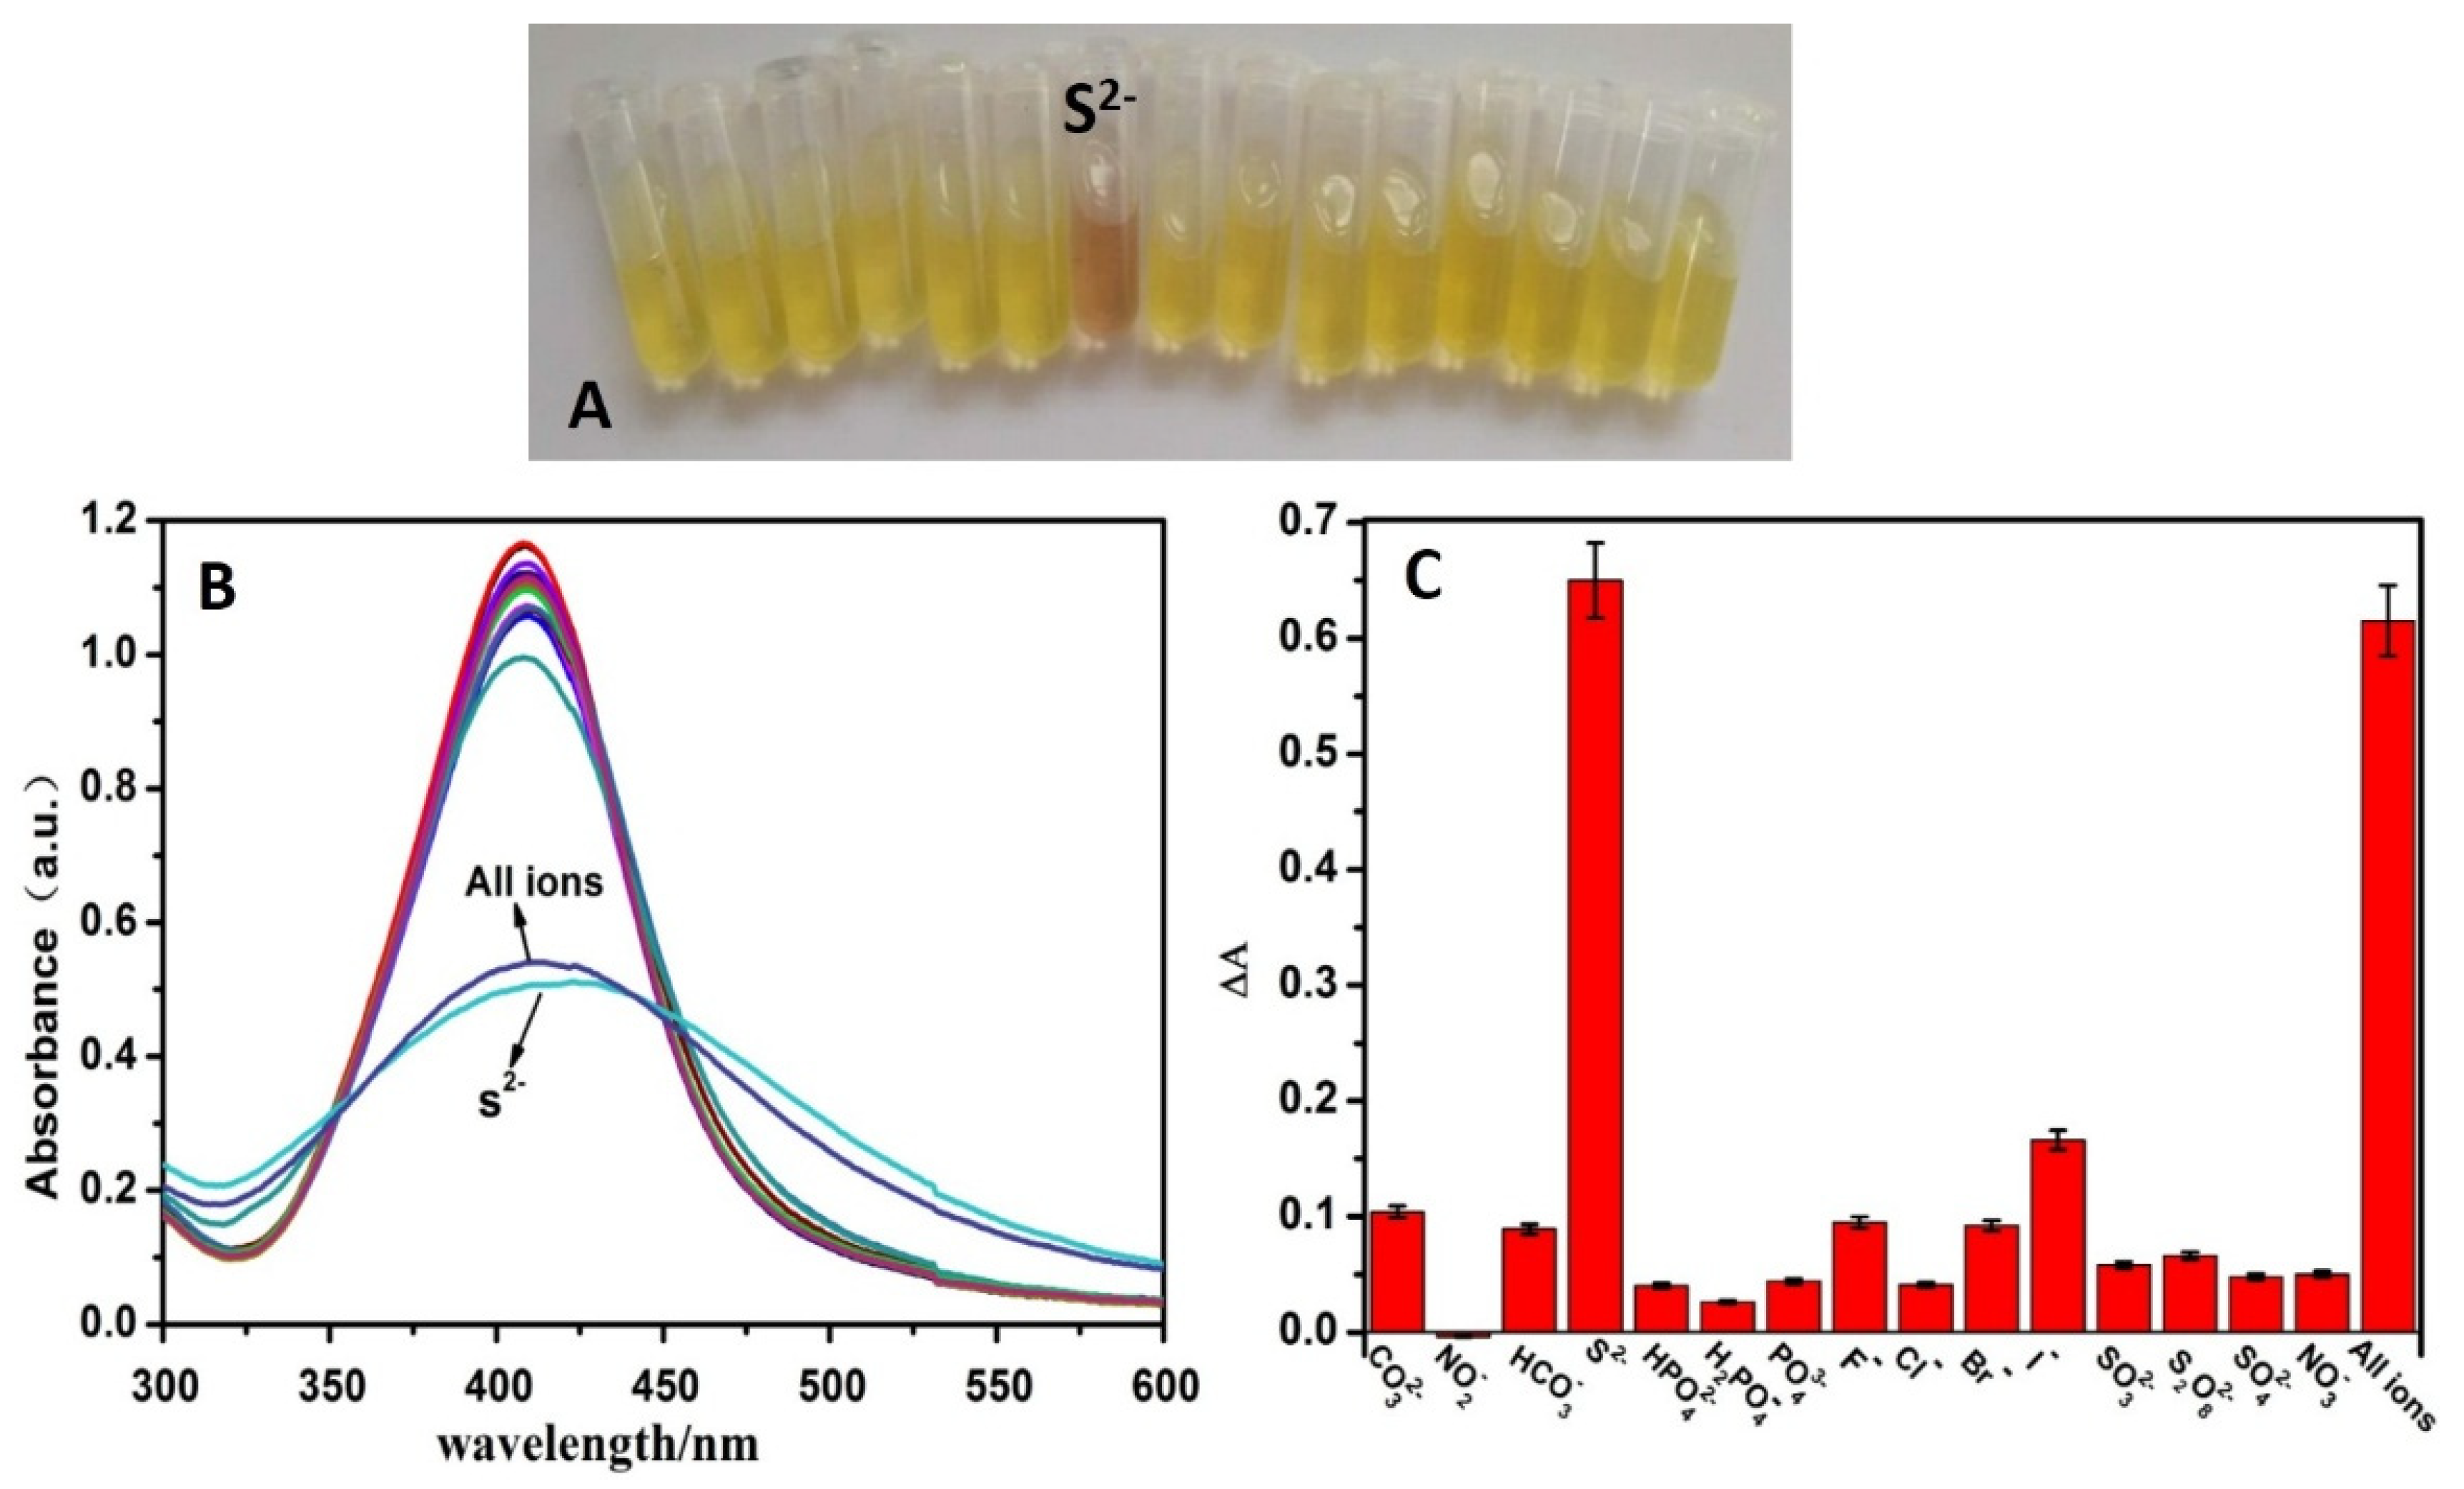
3.5. Sensitivity and Selectivity for S2− Detection

The sensitivity of CMS/AgNPs colloidal solution for S2− was investigated. The absorption intensity of AgNPs decreases gradually along with the addition of S2− (Figure 9A), owing to the formation of Ag2S [23,26]. Based on Figure 9A, a favorable linear correlation (R = 0.992) can be obtained with the S2− concentration from 15 to 70 μM (Figure 9B), and the LOD for S2− was estimated to be 2.4 × 10⁻⁷ M. It can be seen in inset Figure 9A that the color of the sensing system changed from clear yellow to brown with increasing concentration of S2− and, finally, the color changed to colorless when the addition of S2− (70 μM), which provides a platform for a colorimetric method for S2− detection by the naked eyes.
To evaluate the selectivity of this sensing system, 15 kinds various negative ions, such as NO3, NO2, CO32−, HCO3, HPO42−, H2PO4, PO43−, F, Cl, Br, I, SO32−, S2O82−, S2− and SO42− ions (50 μM), were added to CMS/AgNPs colloidal solution, respectively. Figure 10B gave the absorption spectra changes of AgNPs after the addition of negative ions. Followed by the addition of S2−, the absorption peak of AgNPs decreased significantly, the ΔA was 0.65 in Figure 10C, with the color changing from yellow to brown (Figure 10A), while there were no obvious changes for other negative ions. In addition, the relative absorbance values were analogous to that of the S2− value in the presence of all anions. These results clearly indicated that other related anions did not interfere with the spectral and colorimetric detection of S2−. These results demonstrate that our proposal shows distinguishing selectivity toward S2−.
It can be seen from Figure 11A that the addition of SO42− had little effect on the morphology of nano-silver. From Figure 11B, we can see that the morphology of the nano-silver particles had changed from the original sphere to the amorphous and the particles became larger in the presence of S2−. The diameters of the AgNPs were in the range of 40–80 nm and the average particle size was about 60 nm, as shown in Figure 11C. EDS showed a peak for S was observed in the elemental analysis in Figure 11D, which further indicated the presence of silver sulfide.

3.6. Detection of Hg2+ and S2− in Tap Water and Lake Water

To test the feasibility and practicability of this method, the prepared product was applied to monitor the tap water and lake water. The tap water and lake water samples were taken from our lab and Jian Lake of our university, and then used directly without any pretreatment. The tested water samples (150 µL) were added to CMS/AgNPs colloidal solution (3 mL) with constant stirring, and then were measured with UV–VIS spectrophotometer. However, we have not found any color changes and absorption spectra, indicating that there are no Hg2+ and S2− in the tested water samples. Then, we measured the recoveries of Hg2+ and S2− in real samples, and the analytical result is in line with our acceptable range in 95.6%–103.8% (Table 1). The performance of our synthesized sensor identified for selective Hg2+ and S2− detection was also compared with some previously reported results (Table S2). This result indicates that our proposed strategy offers the promise for broader practical application in detecting Hg2+ and S2−, suggesting that the academic study could eventually drive real application and benefit for our environment.

4. Conclusion

In summary, we have demonstrated a CMS/AgNPs colloidal colorimetric sensor for highly sensitive and selectivity toward Hg2+ and S2− over other positive/negative ions, which showed good linear relationships for Hg2+ (0–50 μM) and S2− (15–75 μM), with a low LOD of 1.8 × 10⁻⁸ M and 2.4 × 10⁻⁷ M, respectively. Impressively, compared with other tactics, this proposed strategy displayed general fabrication, higher selectivity, wider linear range, lower detection limit, high stability, and environmental friendship. In addition, the fabricated sensor was employed to detect of the target ions of tap and lake water specimens with a satisfactory testing result. Hence, a simple, high selectivity, rapid and efficient strategy could be easily applied for detecting cations (Hg2+) and anions (S2−) and open up new opportunities for selecting other kinds of ions.

Supplementary Materials

The following are available online at https://www.mdpi.com/2073-4360/12/1/113/s1, Figure S1: (A) UV–vis spectra of CMS/AgNPs and (B) ΔA under different pH, Figure S2: TEM images of different reducing agent: (A) NaBH4, (B) Sodium Citrate and (C) G lucose, Table S1: Comparison of the proposed Hg2+ detection method with different reducing agent, Table S2: Comparison of the proposed Hg2+/S2− detection method with other reported methods.

Author Contributions

Y.X. and Q.L. conceived and designed the experiments; Y.X., L.M. and L.Z. performed the experiments; Y.X., L.Z., W.Z., L.M. and Z.L. analyzed the data; Y.X. and L.M. wrote the paper. All authors have read and agreed to the published version of the manuscript.

Funding

This work was supported by the National Natural Science Foundation of China (grant number 51773102, 51503110), and the Natural Science Foundation of Shandong Province (grant number ZR2014JL010).

Conflicts of Interest

The authors declare no conflict of interest.

References

  1. Chen, S.; Wu, D. Adapting ecological risk valuation for natural resource damage assessment in water pollution. Environ. Res. 2018, 164, 85–92. [Google Scholar] [CrossRef] [PubMed]
  2. Chen, Z.; Kahn, M.E.; Liu, Y.; Wang, Z. The consequences of spatially differentiated water pollution regulation in China. J. Environ. Econ. Manag. 2018, 88, 468–485. [Google Scholar] [CrossRef]
  3. Wang, Q.; Yang, Z. Industrial water pollution, water environment treatment, and health risks in China. Environ. Pollut. 2016, 218, 358–365. [Google Scholar] [CrossRef] [PubMed]
  4. Wu, Z.; Guo, X.; Lv, C.; Wang, H.; Di, D. Study on the quantification method of water pollution ecological compensation standard based on emergy theory. Ecol. Indic. 2018, 92, 189–194. [Google Scholar] [CrossRef]
  5. Xun, Y.; Feng, L.; Li, Y.; Dong, H. Mercury accumulation plant Cyrtomium macrophyllum and its potential for phytoremediation of mercury polluted sites. Chemosphere 2017, 189, 161–170. [Google Scholar] [CrossRef] [PubMed]
  6. Yin, R.; Zhang, W.; Sun, G.; Feng, Z.; Hurley, J.P.; Yang, L.; Shang, L.; Feng, X. Mercury risk in poultry in the Wanshan Mercury Mine, China. Environ. Pollut. 2017, 230, 810–816. [Google Scholar] [CrossRef]
  7. Wells, E.M.; Herbstman, J.B.; Lin, Y.H.; Hibbeln, J.R.; Halden, R.U.; Witter, F.R.; Goldman, L.R. Methyl mercury, but not inorganic mercury, associated with higher blood pressure during pregnancy. Environ. Res. 2017, 154, 247–252. [Google Scholar] [CrossRef] [Green Version]
  8. Aaseth, J.; Hilt, B.; Bjorklund, G. Mercury exposure and health impacts in dental personnel. Environ. Res. 2018, 164, 65–69. [Google Scholar] [CrossRef]
  9. Hancock, J.T. Hydrogen sulfide and environmental stresses. Environ. Exp. Bot. 2019, 161, 50–56. [Google Scholar] [CrossRef]
  10. Godoi, A.F.L.; Grasel, A.M.; Polezer, G.; Brown, A.; Potgieter-Vermaak, S.; Scremim, D.C.; Yamamoto, C.I.; Godoi, R.H.M. Human exposure to hydrogen sulphide concentrations near wastewater treatment plants. Sci. Total Environ. 2018, 610–611, 583–590. [Google Scholar] [CrossRef]
  11. Paul, B.D.; Snyder, S.H. Gasotransmitter hydrogen sulfide signaling in neuronal health and disease. Biochem. Pharm. 2018, 149, 101–109. [Google Scholar] [CrossRef] [PubMed]
  12. Da Silva, D.L.F.; Da Costa, M.A.P.; Silva, L.O.B.; Dos Santos, W.N.L. Simultaneous determination of mercury and selenium in fish by CVG AFS. Food Chem. 2019, 273, 24–30. [Google Scholar] [CrossRef] [PubMed]
  13. Erdogan, B.; Karlitepe, F.; Ocalan, T.; Tunalioglu, N. Performance analysis of Real Time PPP for transit of Mercury. Measurement 2018, 129, 358–367. [Google Scholar] [CrossRef]
  14. Zhou, X.; Liu, J.; Yuan, C.; Chen, Y. Speciation analysis of silver sulfide nanoparticles in environmental waters by magnetic solid-phase extraction coupled with ICP-MS. J. Anal. At. Spectrom. 2016, 31, 2285–2292. [Google Scholar] [CrossRef]
  15. Gan, T.; Lv, Z.; Sun, J.; Shi, Z.; Liu, Y. Preparation of graphene oxide-wrapped carbon sphere@silver spheres for high performance chlorinated phenols sensor. J. Hazard. Mater. 2016, 302, 188–197. [Google Scholar] [CrossRef]
  16. Cheon, J.Y.; Park, W.H. Green synthesis of silver nanoparticles stabilized with mussel-inspired protein and colorimetric sensing of lead(II) and copper(II) ions. Int. J. Mol. Sci. 2016, 17, 2006. [Google Scholar] [CrossRef] [Green Version]
  17. Tachapermpon, Y.; Chaneam, S.; Charoenpanich, A.; Sirirak, J.; Wanichacheva, N. Highly Cu2+-sensitive and selective colorimetric and fluorescent probes: Utilizations in batch, flow analysis and living cell imaging. Sens. Actuators B Chem. 2017, 241, 868–878. [Google Scholar] [CrossRef]
  18. Chavada, V.D.; Bhatt, N.M.; Sanyal, M.; Shrivastav, P.S. Pyrophosphate functionalized silver nanoparticles for colorimetric determination of deferiprone via competitive binding to Fe(III). Microchim. Acta 2017, 184, 4203–4208. [Google Scholar] [CrossRef]
  19. Ly, N.H.; Joo, S.W. Silver nanoparticle-enhanced resonance raman sensor of chromium(III) in seawater samples. Sensors 2015, 15, 10088–10099. [Google Scholar] [CrossRef] [Green Version]
  20. Liu, T.; Dong, J.X.; Liu, S.G.; Li, N.; Lin, S.M.; Fan, Y.Z.; Lei, J.L.; Luo, H.Q.; Li, N.B. Carbon quantum dots prepared with polyethyleneimine as both reducing agent and stabilizer for synthesis of Ag/CQDs composite for Hg2+ ions detection. J. Hazard. Mater. 2017, 322 Pt B, 430–436. [Google Scholar] [CrossRef]
  21. Zeng, Y.; Wang, L.; Zeng, L.; Shen, A.; Hu, J. A label-free SERS probe for highly sensitive detection of Hg2+ based on functionalized Au@Ag nanoparticles. Talanta 2017, 162, 374–379. [Google Scholar] [CrossRef] [PubMed]
  22. Ahmed, K.B.A.; Mariappan, M.; Veerappan, A. Nanosilver cotton swabs for highly sensitive and selective colorimetric detection of sulfide ions at nanomolar level. Sens. Actuators B Chem. 2017, 244, 831–836. [Google Scholar] [CrossRef]
  23. Zhao, L.; Zhao, L.; Miao, Y.; Liu, C.; Zhang, C. A colorimetric sensor for the highly selective detection of sulfide and 1,4-dithiothreitol based on the in situ formation of silver nanoparticles using dopamine. Sensors 2017, 17, 626. [Google Scholar] [CrossRef] [PubMed] [Green Version]
  24. Bothra, S.; Solanki, J.N.; Sahoo, S.K. Functionalized silver nanoparticles as chemosensor for pH, Hg2+ and Fe3+ in aqueous medium. Sens. Actuators B Chem. 2013, 188, 937–943. [Google Scholar] [CrossRef]
  25. Li, L.; Gui, L.; Li, W. A colorimetric silver nanoparticle-based assay for Hg(II) using lysine as a particle-linking reagent. Microchim. Acta 2015, 182, 1977–1981. [Google Scholar] [CrossRef]
  26. Shanmugaraj, K.; Ilanchelian, M. Colorimetric determination of sulfide using chitosan-capped silver nanoparticles. Microchim. Acta 2016, 183, 1721–1728. [Google Scholar] [CrossRef]
  27. Vasileva, P.; Alexandrova, T.; Karadjova, I. Application of starch-stabilized silver nanoparticles as a colorimetric sensor for mercury(II) in 0.005 mol/L nitric acid. J. Chem. 2017, 2017, 6897960. [Google Scholar] [CrossRef] [Green Version]
  28. Ma, P.; Liang, F.; Yang, Q.; Wang, D.; Sun, Y.; Wang, X.; Gao, D.; Song, D. Highly sensitive SERS probe for mercury(II) using cyclodextrin-protected silver nanoparticles functionalized with methimazole. Microchim. Acta 2014, 181, 975–981. [Google Scholar] [CrossRef]
  29. Deng, L.; Ouyang, X.; Jin, J.; Ma, C.; Jiang, Y.; Zheng, J.; Li, J.; Li, Y.; Tan, W.; Yang, R. Exploiting the higher specificity of silver amalgamation: Selective detection of mercury(II) by forming Ag/Hg amalgam. Anal. Chem. 2013, 85, 8594–8600. [Google Scholar] [CrossRef]
Figure 1. Reaction mechanisms for CMS/AgNPs synthesis.
Polymers 12 00113 g001
Figure 2. UV–VIS spectra of CMS/AgNPs: (A) Different volumes of Tollens’ reagent (0.1 M), (B) different proportion of VC, (C) different reducing agents, and (D) reduction stability of Vc.
Polymers 12 00113 g002
Figure 3. (A) UV–VIS spectroscopy, (B) XRD pattern, and (C) FT-IR spectra of CMS/AgNPs.
Polymers 12 00113 g003
Figure 4. (A) TEM images (inset: SAED pattern), (B) size distribution, and (C) EDS spectrum of CMS/AgNPs.
Polymers 12 00113 g004
Figure 5. Reaction mechanisms for Vc and Tollens’ reagent (A), reaction scheme of AgNPS and Hg2+ ions (B), and AgNPS and S2− ions (C).
Polymers 12 00113 g005
Figure 6. (A) The picture of color change and (B) UV–VIS spectroscopy of CMS/AgNPs colloidal solution with different concentration of Hg2+, (C) the liner relative absorption intensity ΔA, and (D) the SPR band shift Δl over the concentration of Hg2+ is within the range of 0–50 μM.
Polymers 12 00113 g006
Figure 7. (A) UV–VIS absorption spectra and, (B) ΔA of the proposed sensing system in the presence of 15 kinds various metal ions and mixed all ions (the concentrations of all metal ions are 50 μM).
Polymers 12 00113 g007
Figure 8. (A) TEM of CMS/AgNPs colloidal solution in the presence of Cu2+ and (B) Hg2+ (30 μM), (C) size distribution, and (D) EDS spectrum of CMS/AgNPs with addition of Hg2+.
Polymers 12 00113 g008
Figure 9. (A) UV–VIS spectroscopy of CMS/AgNPs colloidal solution with different concentration of S2−, and (B) the linear relative absorption intensity ΔA over the concentration of S2− is within the range of 15–70 μM.
Polymers 12 00113 g009
Figure 10. (A) The color changes picture, (B) UV–VIS absorption spectra, and (C) ΔA of the proposed sensing system in the presence of 15 kinds various negative ions and mixed all ions (the concentrations of all negative ions are 50 μM).
Polymers 12 00113 g010
Figure 11. (A) TEM of CMS/AgNPs colloidal solution in the presence of SO42− and (B) S2− of 50 μM, (C) size distribution, and (D) EDS spectrum of CMS/AgNPs with addition of S2−.
Polymers 12 00113 g011
Table 1. Analytical results of Hg2+ and S2− in tap water and lake water samples (n = 3).
SampleHg2+ Added(μM) FoundRecovery (%)S2− Added(μM) FoundRecovery (%)
Tap water00-00-
5.005.06101.205.004.8797.40
10.009.8698.6010.0010.34103.40
Lake water00-00-
5.004.7895.605.005.19103.80
10.009.6196.1010.009.8398.30

