Article

Foaming of Polycaprolactone and Its Impregnation with Quercetin Using Supercritical CO2

by
Ignacio García-Casas
,
Antonio Montes
*,
Diego Valor
,
Clara Pereyra
and
Enrique J. Martínez de la Ossa
Department of Chemical Engineering and Food Technology, Faculty of Science, University of Cádiz, International Excellence Agrifood Campus (CeiA3), 11510 Puerto Real (Cádiz), Spain
*
Author to whom correspondence should be addressed.
Polymers 2019, 11(9), 1390; https://doi.org/10.3390/polym11091390
Submission received: 16 July 2019 / Revised: 12 August 2019 / Accepted: 14 August 2019 / Published: 23 August 2019
(This article belongs to the Special Issue Supercritical Fluid Processing of Polymers)

Abstract

:
Foamed polycaprolactone impregnated with quercetin was carried out with a batch foaming technique using supercritical CO2. The experimental design was developed to study the influence of pressure (15–30 MPa), temperature (308–333 K), and depressurization rate (0.1–20) on the foam structure, melting temperature, and release tests of composites. The characterization of the experiments was carried out using scanning electron microscopy, X-ray diffractometer, and differential scanning calorimetry techniques. It was observed that the porosity created in the polymer had a heterogeneous structure, as well as the impregnation of the quercetin during the process. On the other hand, controlled release tests showed a significant delay in the release of quercetin compared to commercial quercetin.

Graphical Abstract

1. Introduction

The use of CO2 as a blowing agent in foaming has become increasingly popular in the scientific community to encapsulate, fabricate scaffolds, and produce delivery-controlled systems. This is due to the fact of CO2’s properties as non-toxic, inexpensive, and reusable, as well as its high dissolution in polymers [1].
The supercritical foaming process has certain advantages; for example, the use of CO2 over other blowing agents, such as chlorofluorocarbon (CSF) or the non-use of co-solvent, make this technique an environmentally friendly process. This process exploits the compressibility power of CO2 on the polymer to create a porous structure in the polymer. Initially, the polymer is saturated with a gas at constant conditions of pressure and temperature. Once saturated, the system is driven (i.e., quenched) to a supersaturated state, usually decreasing the pressure, although if the process has been taken to low temperatures, the temperature could be increased. This causes nucleation and growth of the porous cells within the polymeric matrix [2]. There are different aspects to consider when a polymer is under supercritical conditions, such as the swelling, the melting point variation, and foaming [3,4,5]. Particularly in the case of semi-crystalline polymers, when the CO2 molecules are dissolved, they facilitate the mobility of the chains. This favors the reorganization of the polymer chains, lowering the crystallization temperature and improving crystallinity [6]. In the case of the effect caused by swelling in the matrix, this leads the polymer chains to reorganize into a more extended configuration. All this causes a greater facility in the formation of crystalline structures and, therefore, it usually decreases the melting temperature [7].
Polycaprolactone (PCL) is a semi-crystalline polyester with a melting point (Tm) of 329–334 K and a glass transition temperature (Tg) of 213 K [8]. Many studies have investigated the effect of pressure, temperature, time, and, to a lesser extent, the depressurization rate on the foaming and impregnation processes [3,9,10,11] of PCL with supercritical CO2 (scCO2). Several studies have reported that a polymer could be impregnated by an active substance by a swelling process when scCO2 is vented. Since the lower diffusivity of the active substance regarding to the scCO2, it can be trapped by the polymeric matrix [3,12]. This fact provokes the idea that the foaming and impregnation processes happen during a one-step process. Growth factors were impregnated into hybrid PCL-starch scaffolds to study its delivery [13]: dexamethasone was impregnated into PCL/silica nanoparticles [14] and into silk fibroin aerogel/PCL for bone regeneration [15], nimesulid was impregnated into PCL via a one-step foaming/impregnation process [16], strontium was impregnated into PCL scaffolds [17], and TiO2 was impregnated into PCL for removal textile dyes [18]. Even Tsivintzelis et al. [19] reported the use of co-solvent (ethanol) in the formation of more homogenous scaffolds with PCL.
Quercetin (Q) is a flavonoid present in many fruits and vegetables [20]. This flavonoid is highlighted for its antioxidant action, but it has different benefits such as anti-inflammatory, antibacterial, cardiovascular health, and anticancer effects [21,22]. This antioxidant compound has been used by several authors with scCO2 in addition to different supercritical techniques, such as a supercritical antisolvent process to co-precipitate or encapsulate the quercetin with polymer [23,24] and a supercritical impregnation process (SSI) to impregnate the quercetin into different polymers or a porous matrix [25,26]. The SSI processes substitutes the liquid organic solvent with a supercritical fluid giving it the advantage that the final product is completely free of any residual solvent contamination. Thus, controlled quercetin release could be prepared as a safe process.
This paper focused on the use of a biodegradable polymer PCL as a coating agent for a delivery system to control the release of an active substance. In this article, a one-step foaming/impregnation process with PCL and quercetin was conducted. Moreover, the effect of pressure, temperature, and depressurization rate on the foaming process, the melting temperature and melting heat of the composites, and on the release profiles of quercetin were evaluated.

2. Materials and Methods

2.1. Materials

Polycaprolactone (pellets, average Mn 45.000 g mol−1) was provided by Sigma–Aldrich (Madrid, Spain). Quercetin (C15H10O7) was purchased from Sigma–Aldrich (Madrid, Spain). CO2 with a minimum purity of 99.8% was supplied by Linde (Barcelona, Spain).

2.2. Experimental Design

A design of experiment (DOE) was carried out in order to identify the main factors that should be taken into account in the foamed PCL–quercetin preparation using supercritical CO2. A full factorial design 23 was performed. The complete design consisted of 11 experimental points that included 8 factor points and three replications at the center point (experiments 1, 2 and 8). The main factors were selected with adequate ranges for this design. The responses of the design were melting temperature (Tm), mg of released quercetin with regard to g of PCL, and melting heat (Hm). The design was conducted with Modde 5.0 software.
Pressure (P), temperature (T), and depressurization rate (Dr) were identified as the main factors that can directly influence the foaming process of the features of the formed composites and, thus, on quercetin release profiles. The two levels for each factor are shown in Table 1. The levels of pressure and temperature were selected to evaluate the influence of different supercritical CO2 densities on the achievement of different degrees of plasticization of the polymer in including quercetin into its structure. Depressurization rate levels were selected according to the minimum and maximum set points available from the equipment supplier. The contact times were fixed to 1 h in order to ensure that there was enough time to form a polymer plasticization and to keep the costs reasonable.

2.3. Foaming and Impregnation with scCO2

The experimental setup of the apparatus used to foam and impregnate is represented in Figure 1. The plant consisted of a CO2 bottle, a high-pressure pump to boost the CO2, a thermal bath to cool the CO2 to its liquid state, a heat exchanger to fix the temperature, a stainless-steel cell with a volume of 257 mL where the foaming and impregnation was carried out. Initially, each sample was formed by 500 mg of PCL and 10 mg of quercetin mixed physically into an aluminum foil support (ratio 50:1 PCL:Q). Then, it was introduced into a stainless-steel cell, after which CO2 was pumped into the cell to reach the optimum conditions for the foaming process at the same time that the temperature was adjusted. This study was carried out in the range of 15–30 MPa of pressure, temperatures of 308–333 K, and a foaming/impregnation time of 1 h. Once the process time had finished, the output valve was opened to vent the CO2 in a depressurization range of 0.1–20 MPa min−1.

2.4. Sample Characterization

2.4.1. Scanning Electron Microscopy

Foamed/impregnated polymer samples were processed with a FEI TENEO scanning electron microscope (SEM) in order to analyze morphology. The images were obtained on a cross-section of the sample on a carbon tape and then coated with a 12 nm film of gold prior to analysis.

2.4.2. X-Ray Diffraction

X-ray diffraction (XRD) analysis was performed on a Bruker D8 Advance diffractometer in order to determine the amorphous or crystalline nature of the foamed polymer loaded with quercetin after the supercritical foaming/impregnation process. All diffraction patterns were scanned from 10° to 50° in 2 θ angles with a step size of 0.02° and 1 s as the step time. CoKa was the used source.

2.4.3. Differential Scanning Calorimetry

Thermal property measurements were taken with a DSC Q100 (TA Instruments). Samples were heated to 373 K at a heating rate of 10 K min−1, then samples were cooled at 10 K min−1, and finally heated to 373 K at the same rate. All tests were carried out under the protection of a nitrogen (99.999%) atmosphere and following the standards for DSC, ISO 11357-3 [2018].

2.5. In Vitro Release Test

Simulated fluid (SF) was produced in the laboratory, which was a solution of 6.8 g/L of monobasic potassium phosphate in distilled water and adjusted to pH 6.8 ± 0.1 with 0.2 N NaOH.
An amount of 0.25 g of the polymer impregnated with quercetin was dissolved in 40 mL of SF in order to carry out the release test. The release tests were carried out at a temperature of 310 K and a stirring speed of 165 rpm, and 3 mL aliquots were withdrawn and filtered at time intervals of 5, 15, 30, 60 min, and then every hour until 480 min. Finally, an extra aliquot was withdrawn after 24 h. The released quercetin was measured with a Shimadzu UV-VIS mini spectrophotometer at λ = 365. The calculation was based on that reported by Zhu et al. [27] to calculate correctly the concentration of released quercetin.

3. Results and Discussion

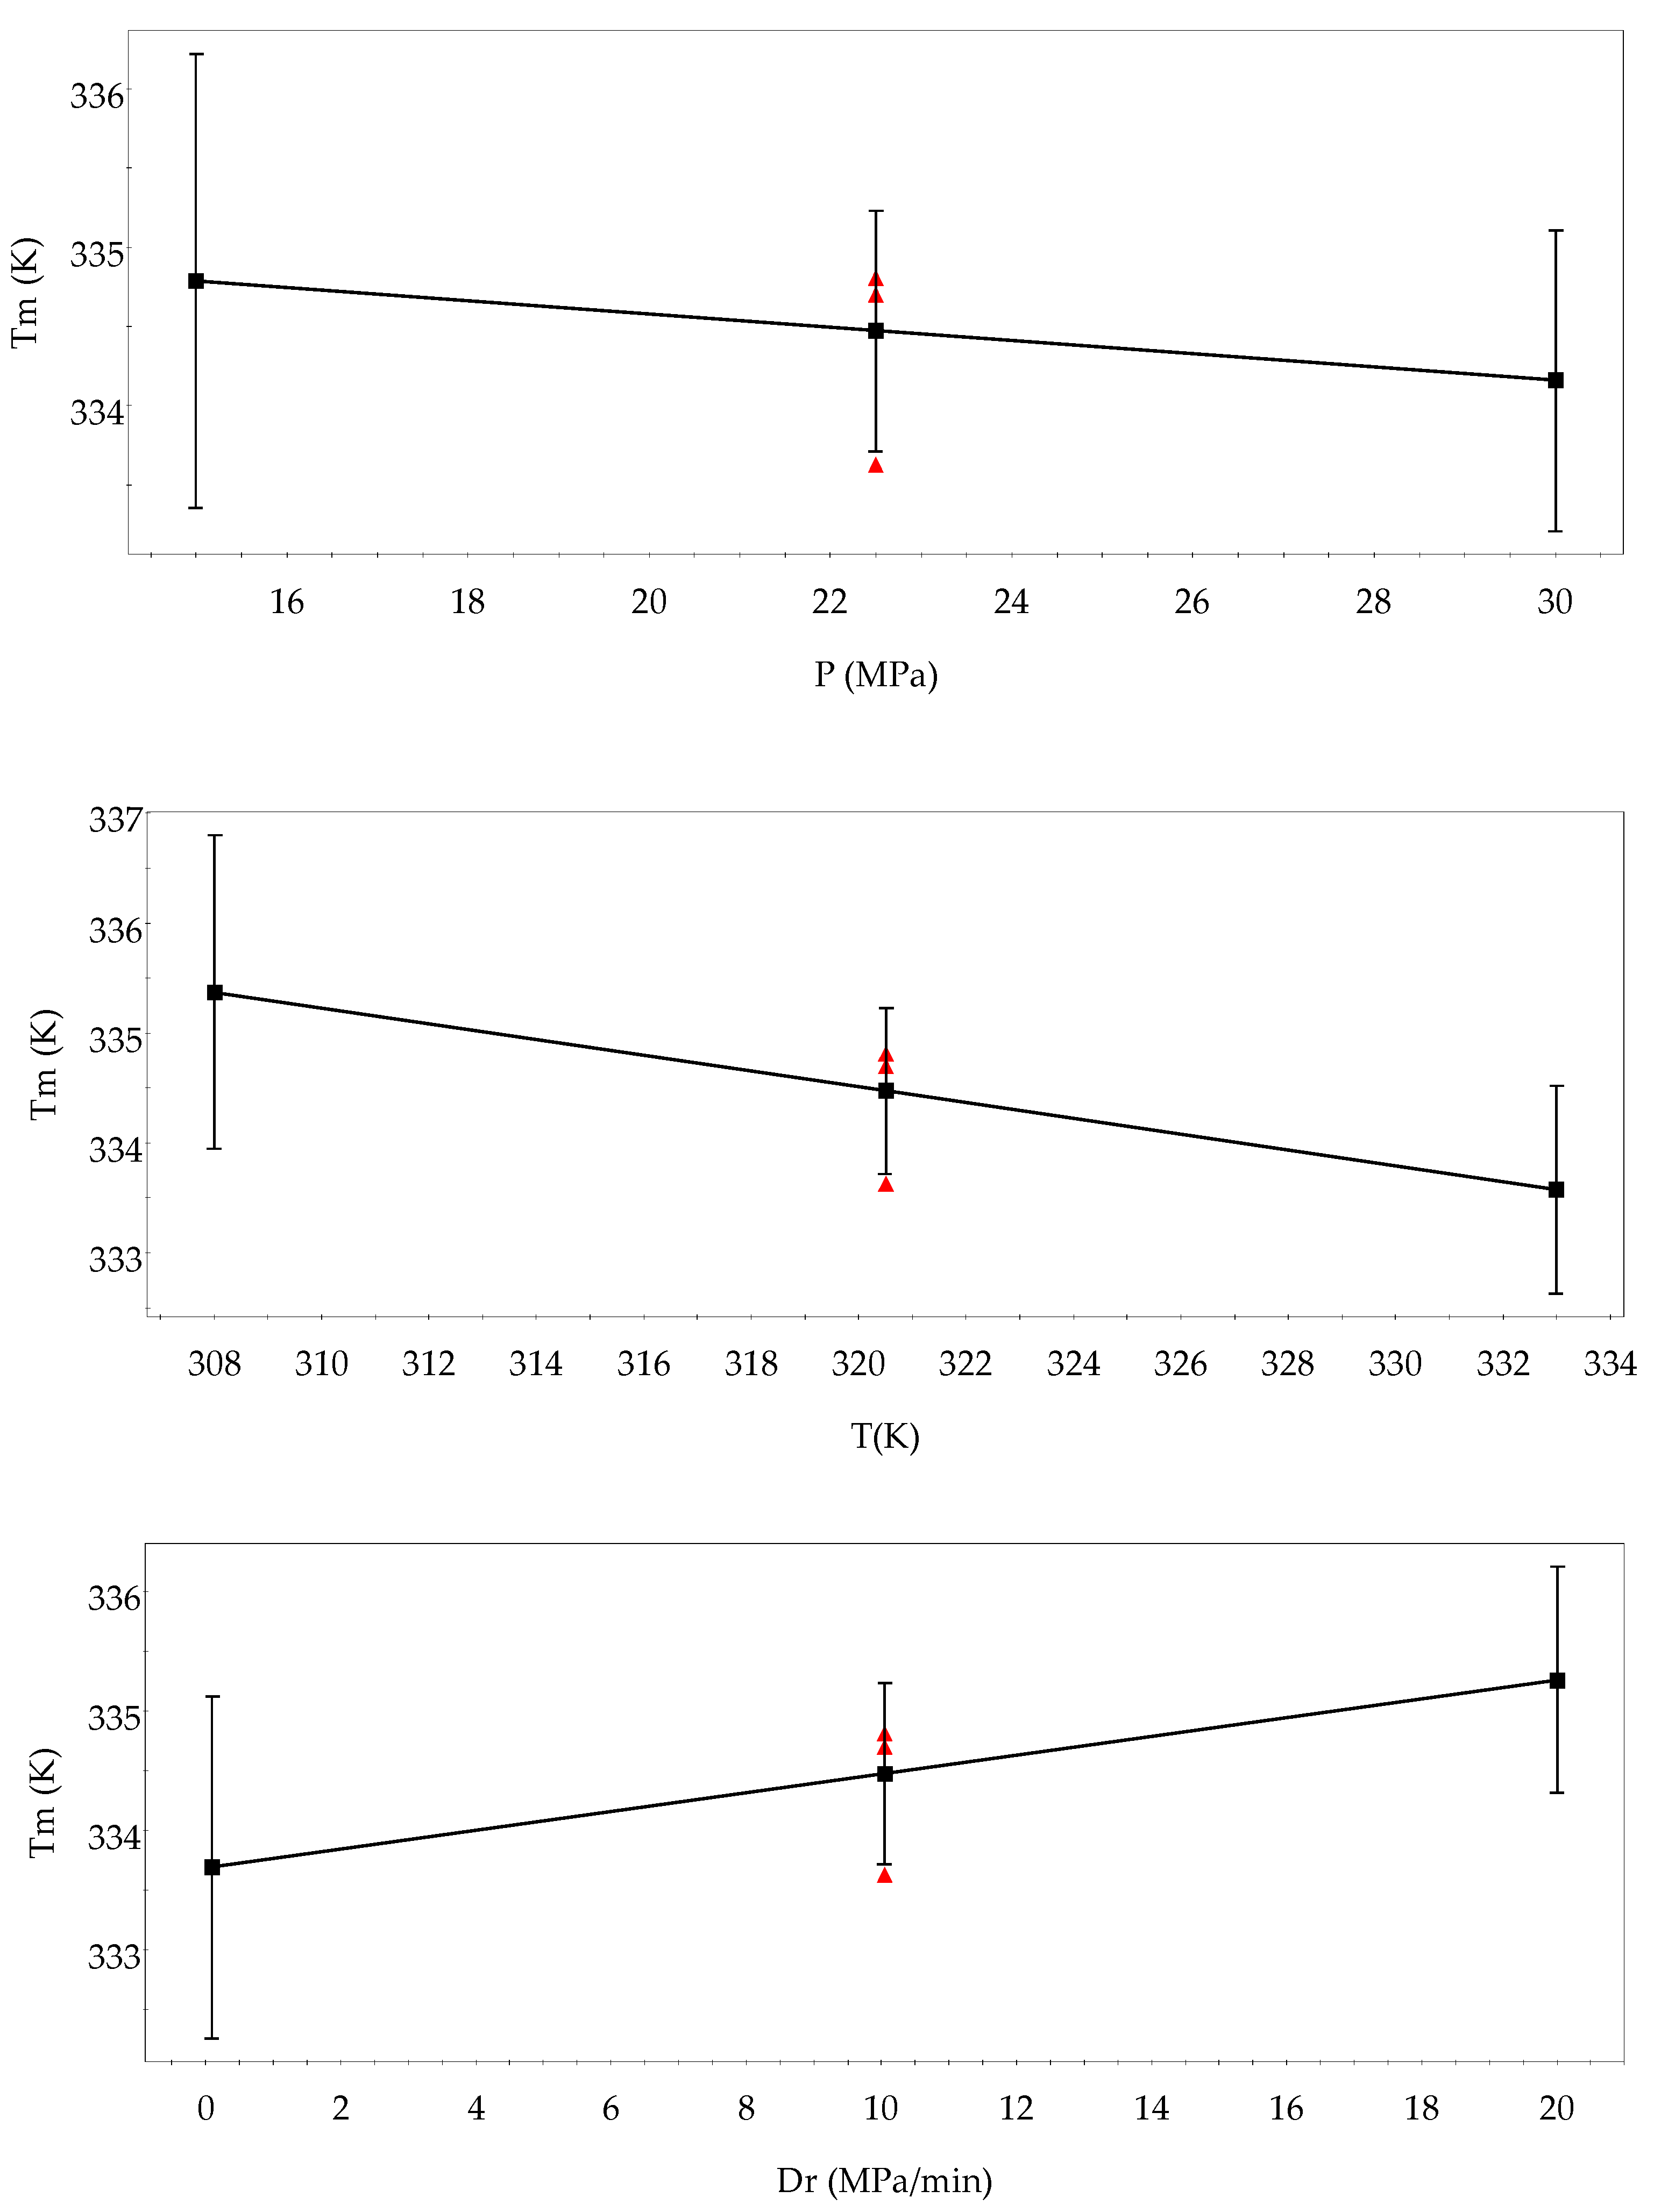
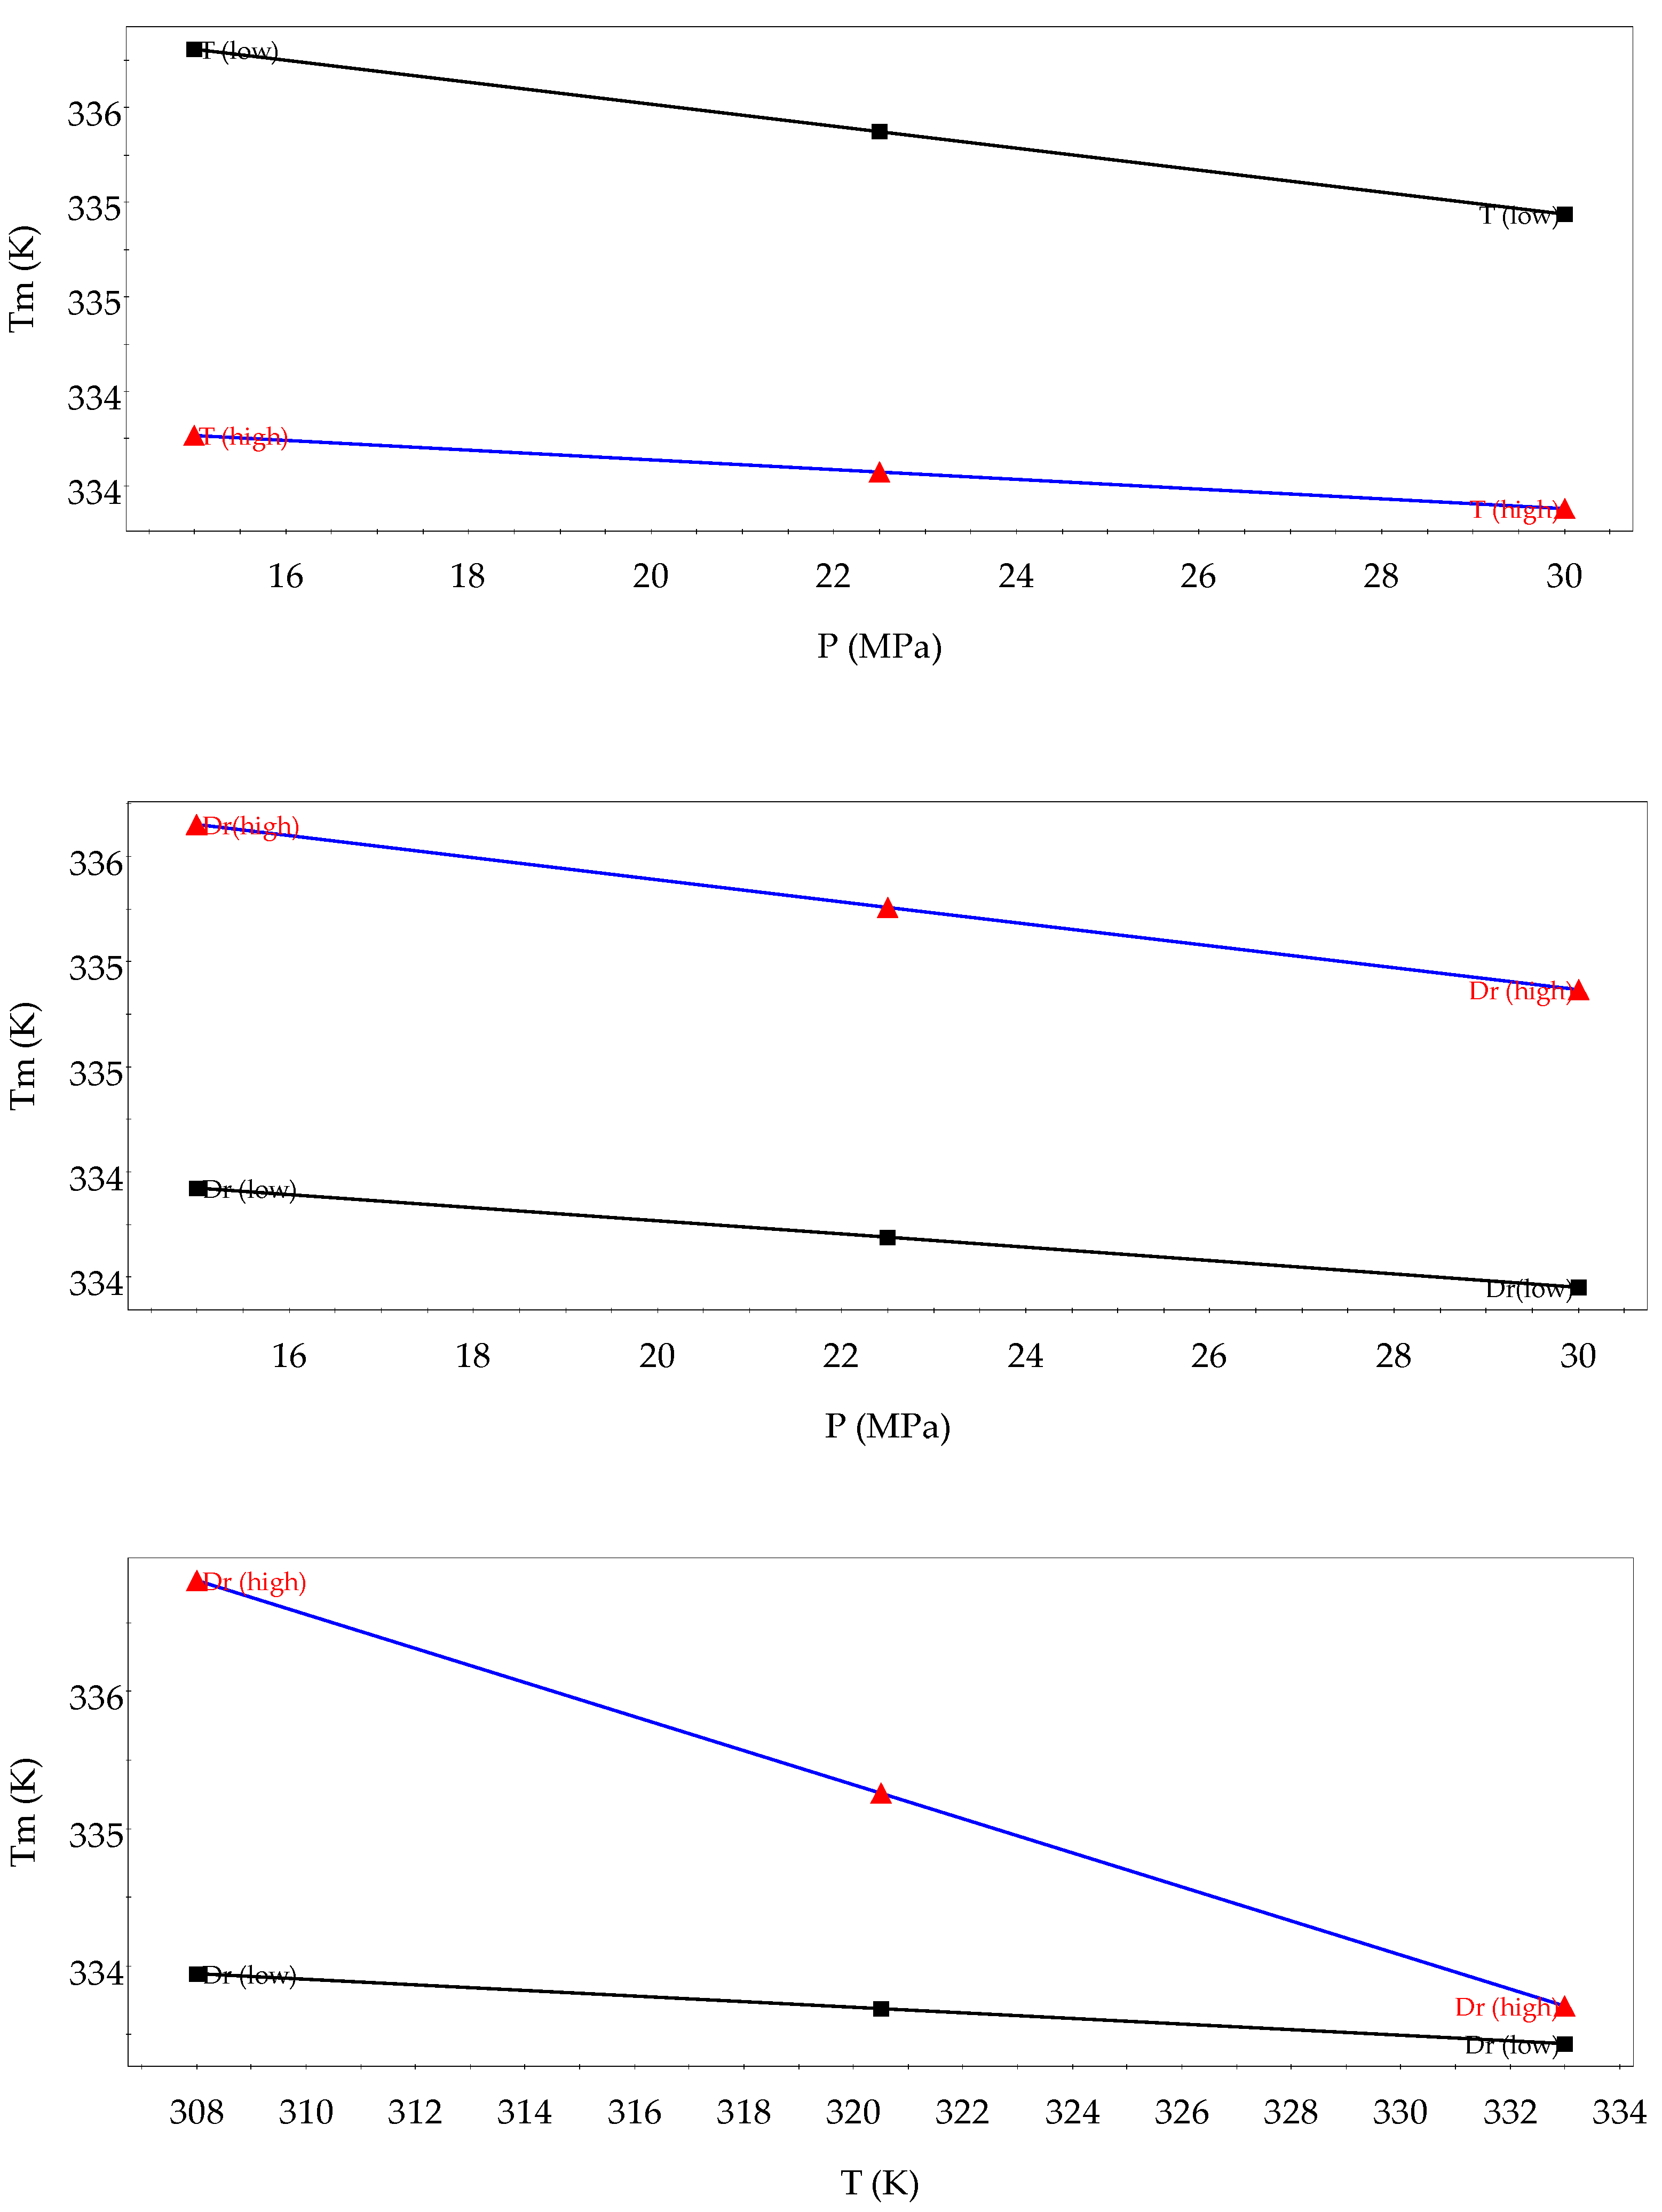
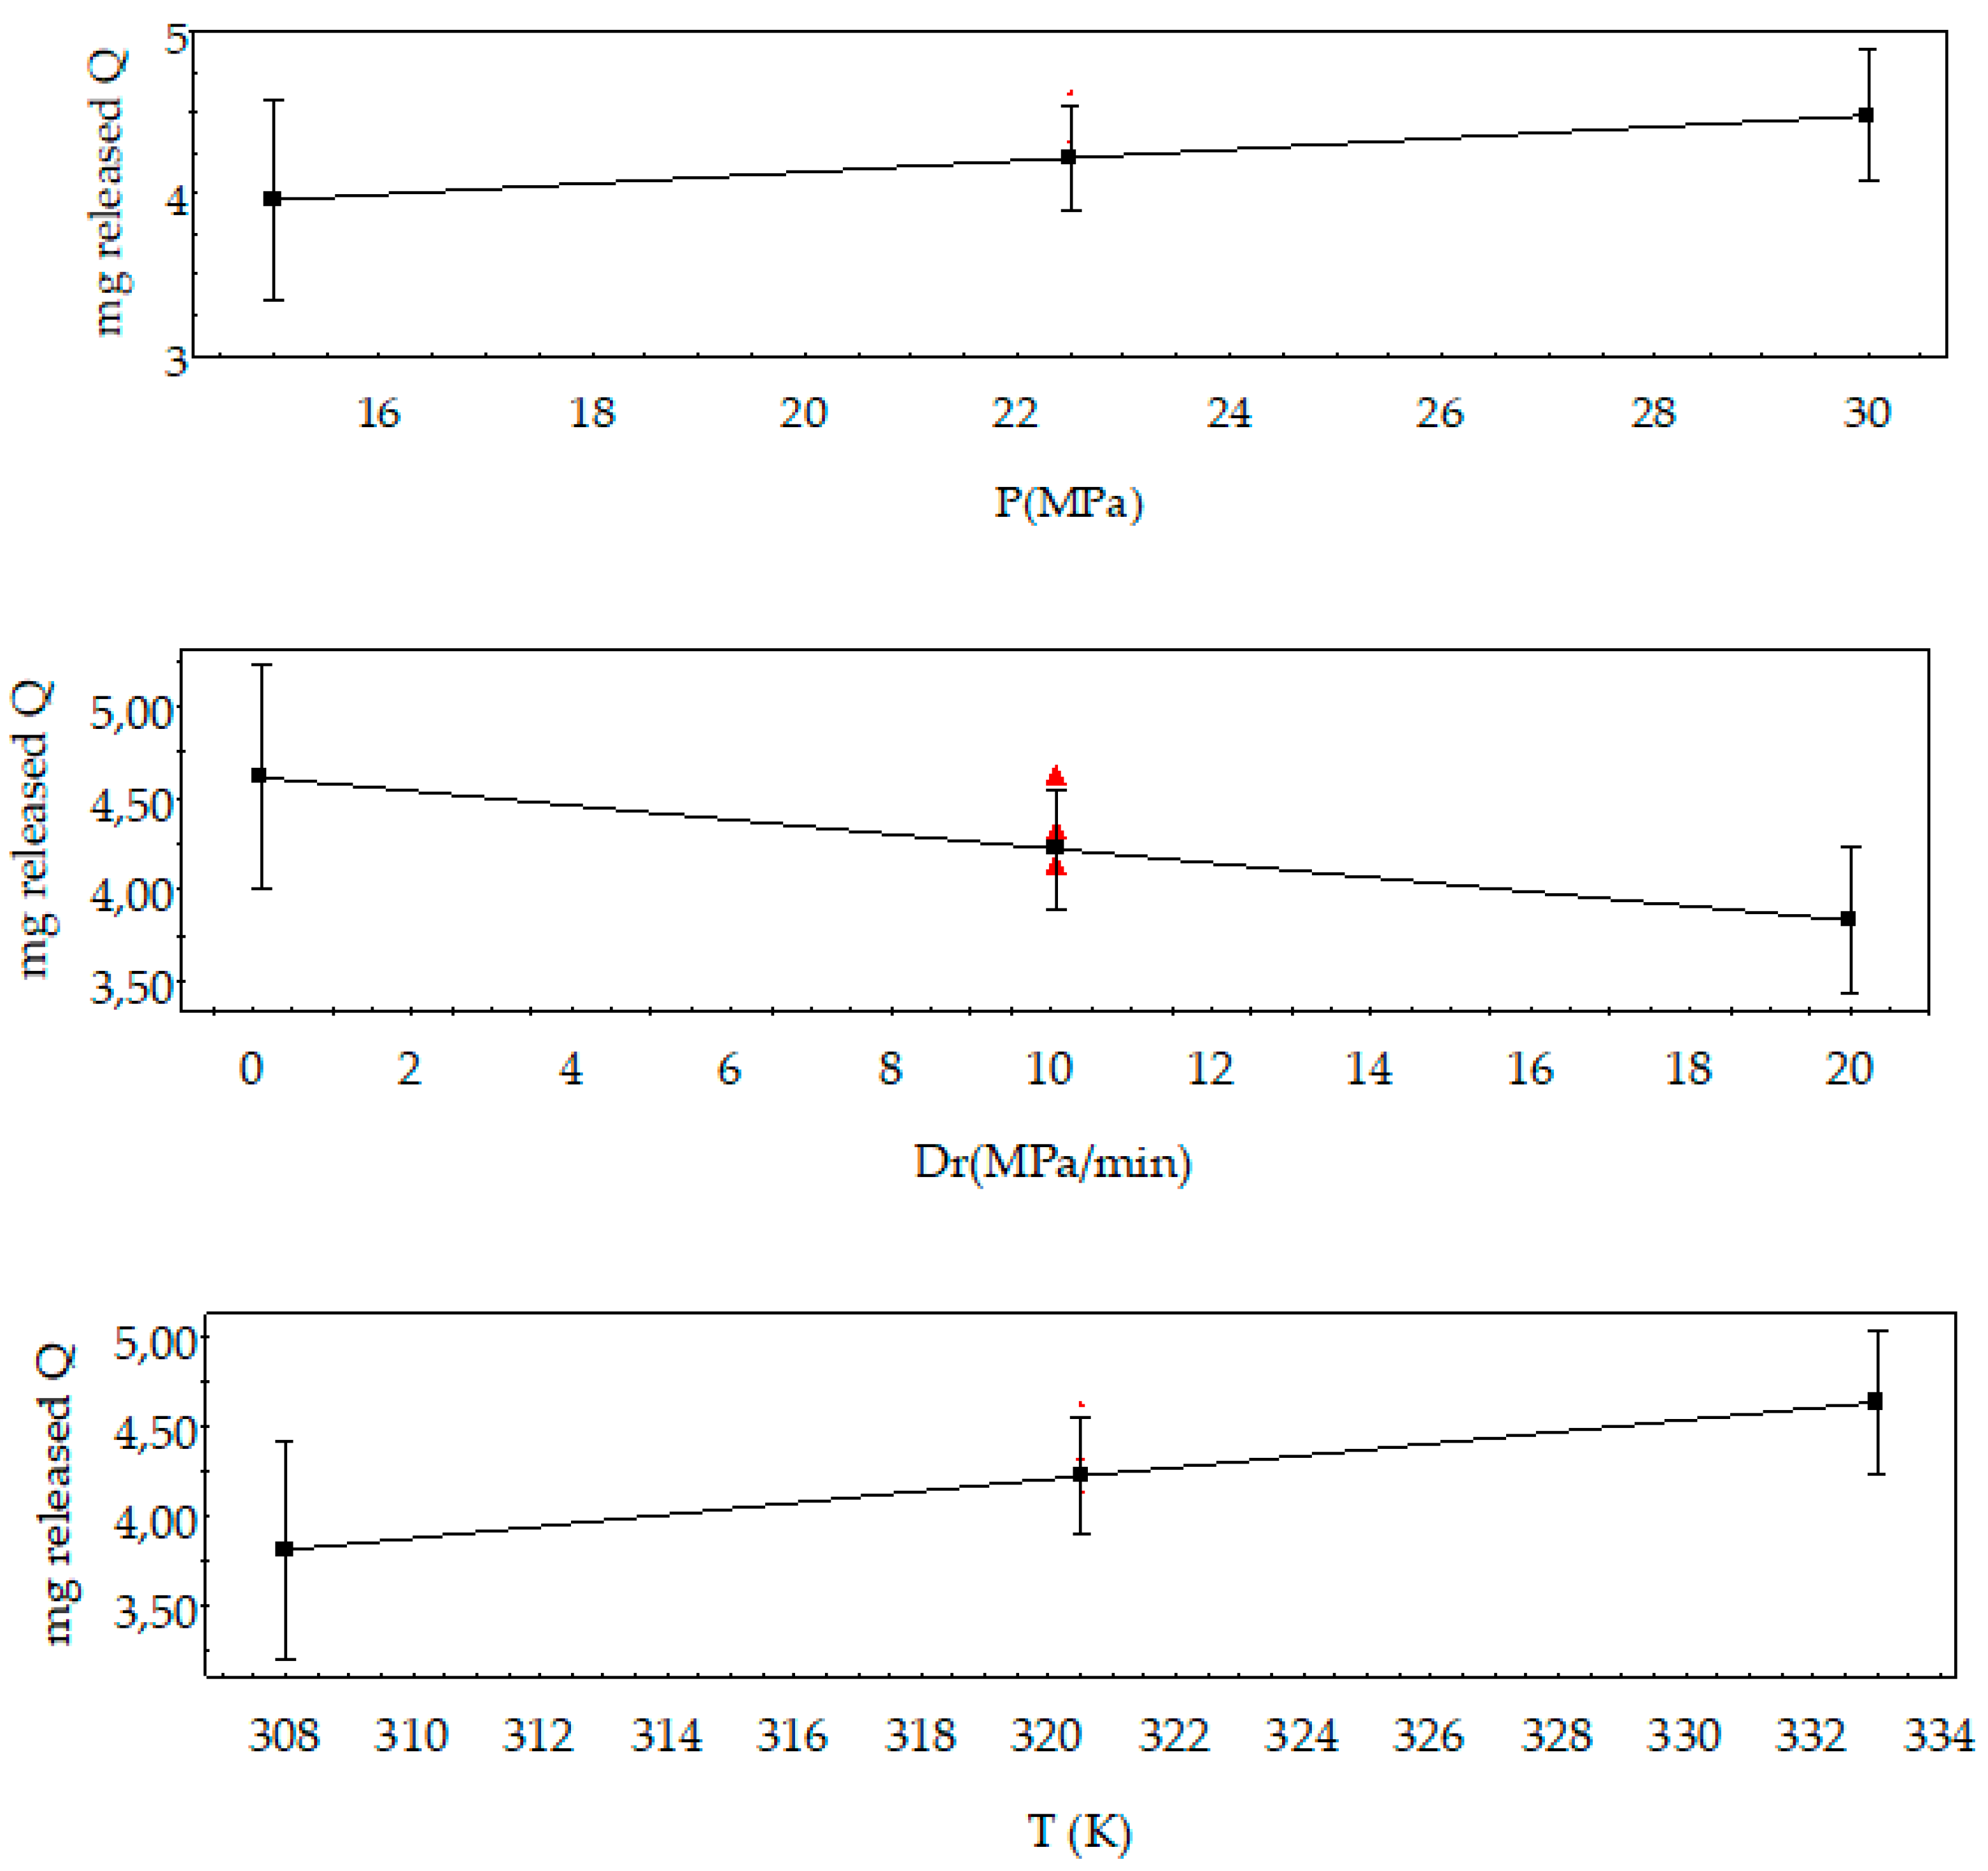
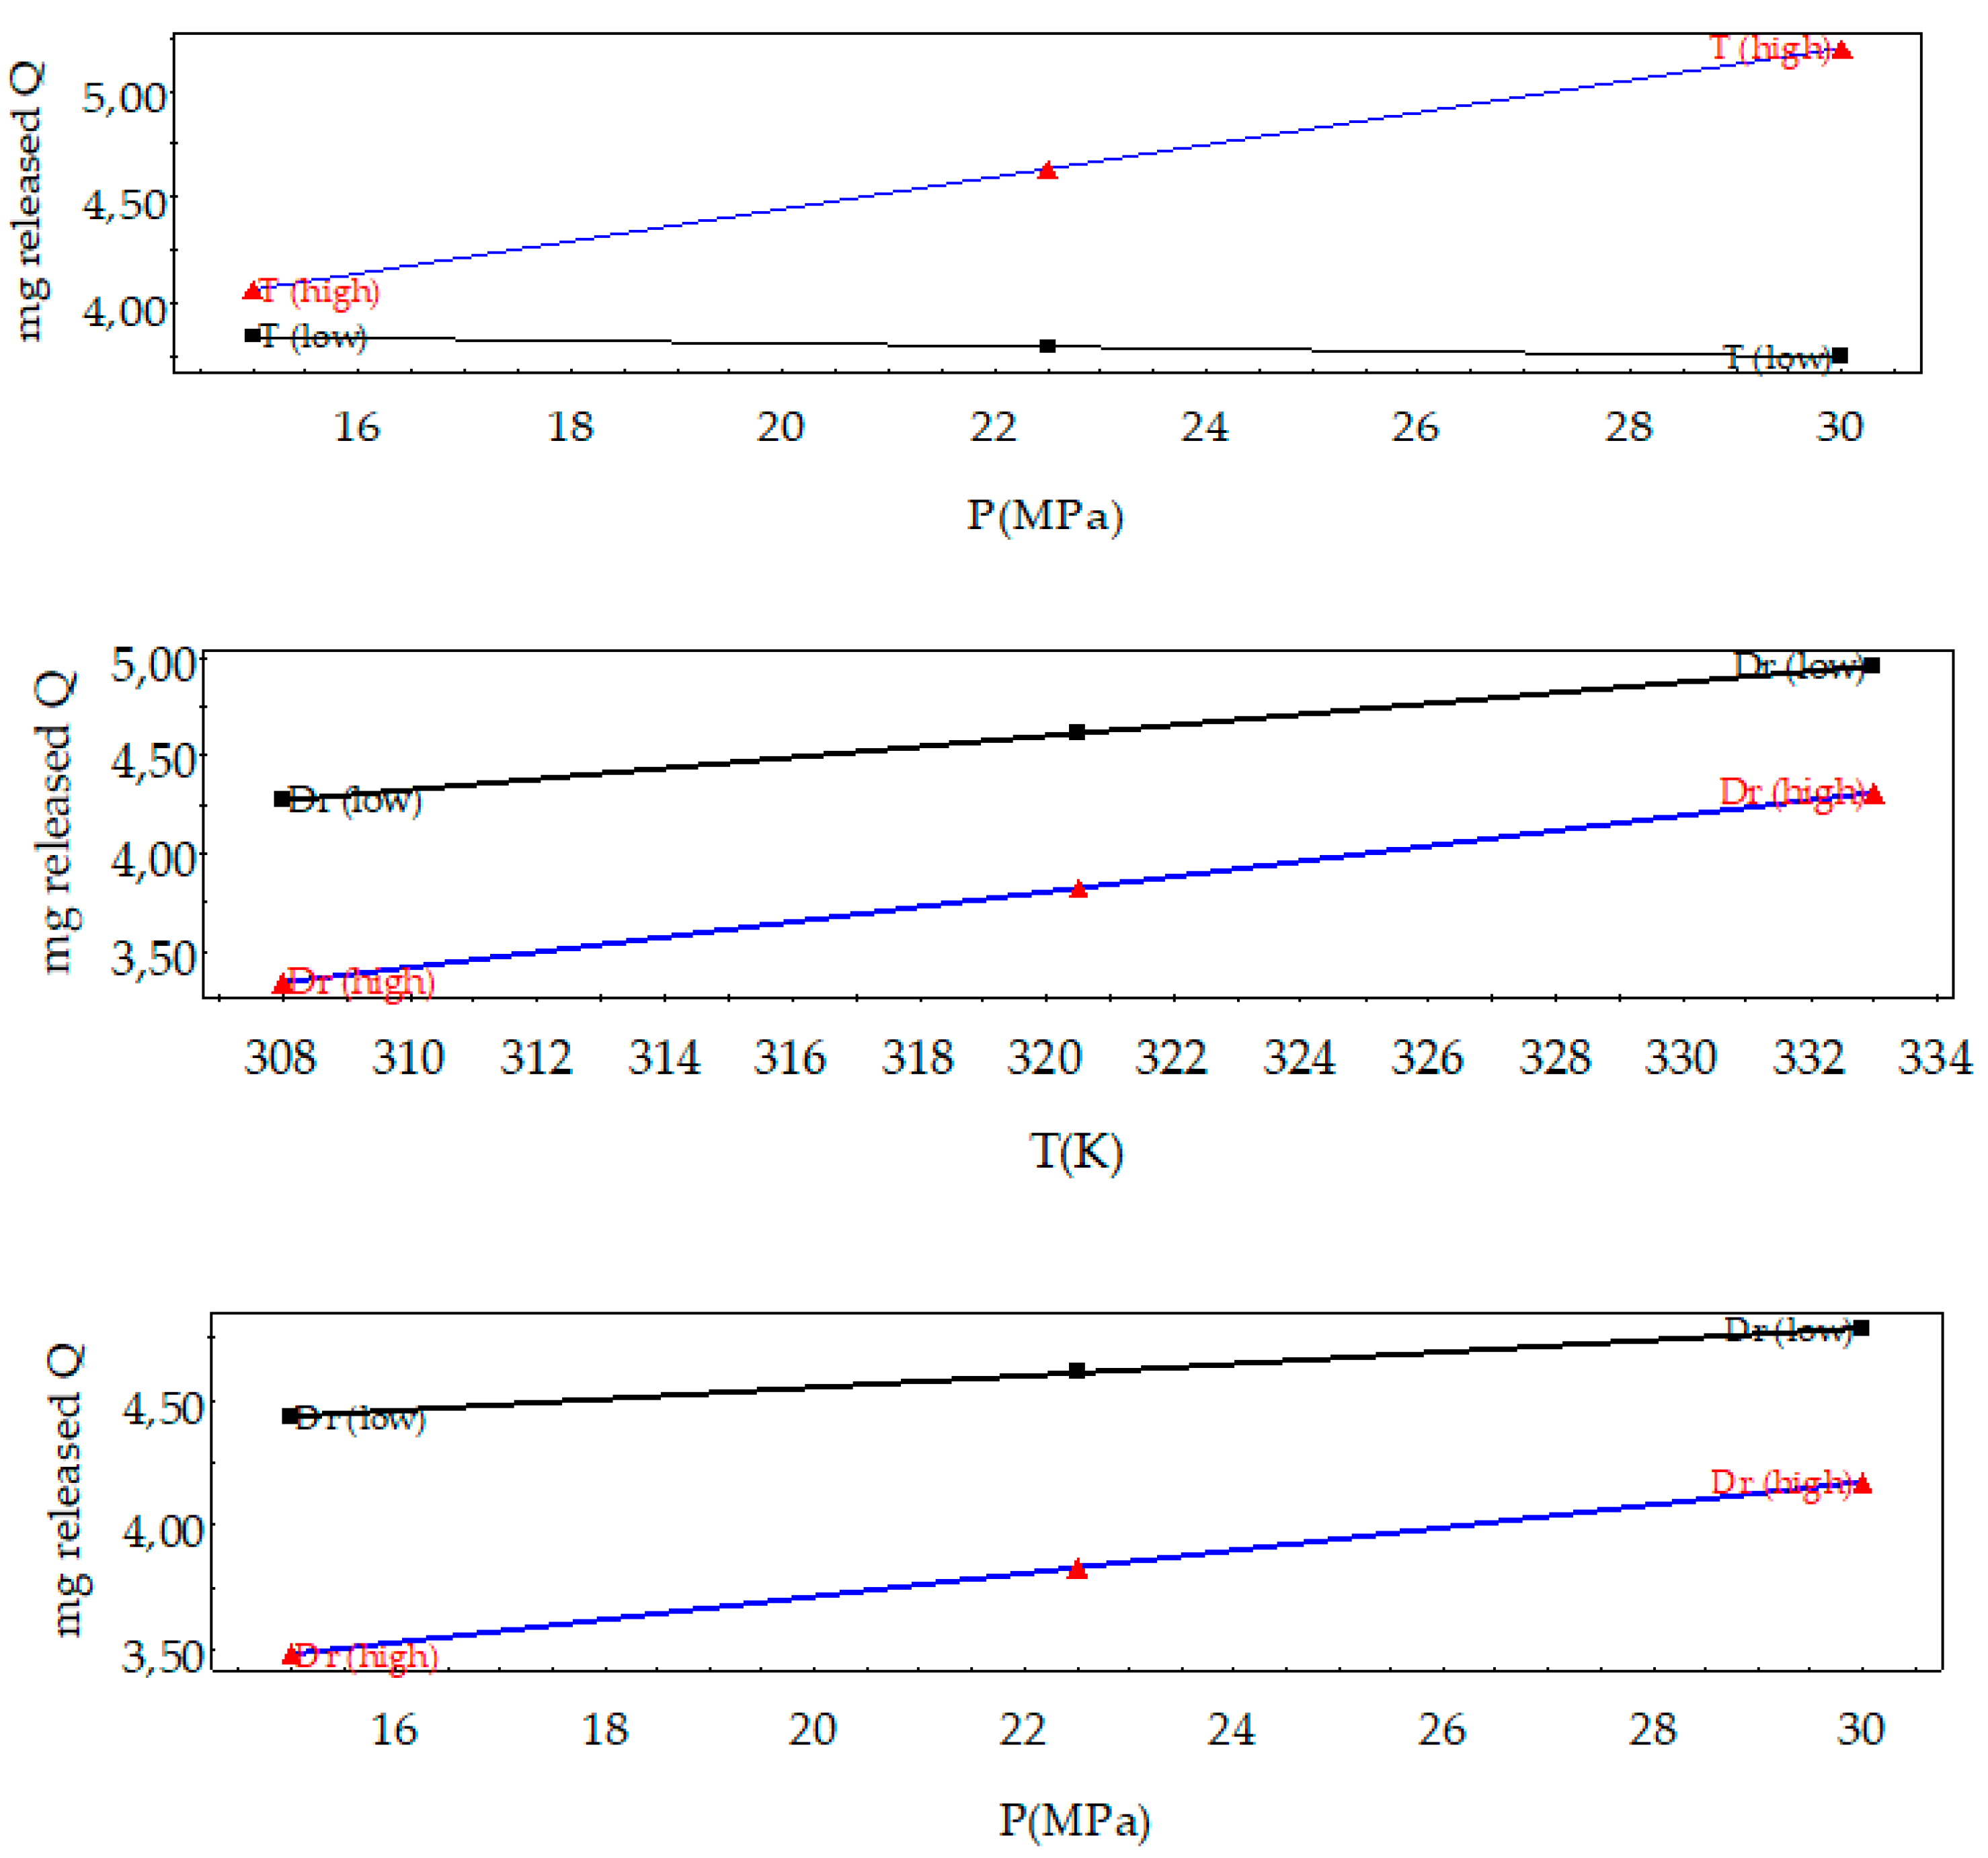
3.1. Analysis of the Design of Experiments

The values for the coefficient of determination R2 (goodness of fit), Q2 (goodness of prediction), degree of freedom (DF), sum of squares (SS), and mean square (MS) are shown in Table 2. According to R2, the model was well adjusted and the goodness of prediction (Q2) was good for Tm and mg of released Q. However, Hm was badly adjusted, thus, no conclusions can be established from the model for this response. Analyzing the values of F and p (a high F-value and a low p-value less than 0.05), it can be ensured that the model was significant for the two first responses [28], but not significant for Hm. It can be seen from Table 2 that, statistically, the model’s lack of fit was due to the probability of a lack of fit being non-significant at 95%. The experimental design and the responses of the experiments are provided in Table 3.
The effects on responses had positive and negative signs, as can be seen in Table 1. The sign of each effect indicates whether the response increased or decreased when the experiments changed from a low to a high level. For instance, an increase in temperature from low to high led to a considerable decrease in Tm. Depressurization rate had the second most marked effect on Tm but, in this case, the trend was the opposite: an increase in Dr led to an increase in Tm. With regard to the released quercetin, the most marked effect was observed for temperature followed by Dr and pressure but, in this case, the effect’s difference was lower. These effects had different signs, which indicate that released quercetin increased with pressure and temperature and decreased with Dr.
Taking into account the calculated effects in Table 1, Hm decreased when pressure and temperature decreased and increased when Dr decreased. However, according to Table 2, no significant difference in Hm was found and it was not possible to establish any trends.
Coefficients of the linear model for the significant responses, Tm and released quercetin given in Table 4 show that temperature and Dr were the main significant variables for both responses (p < 0.05).

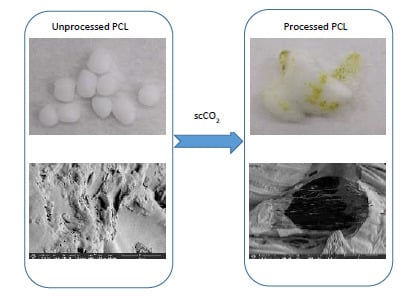
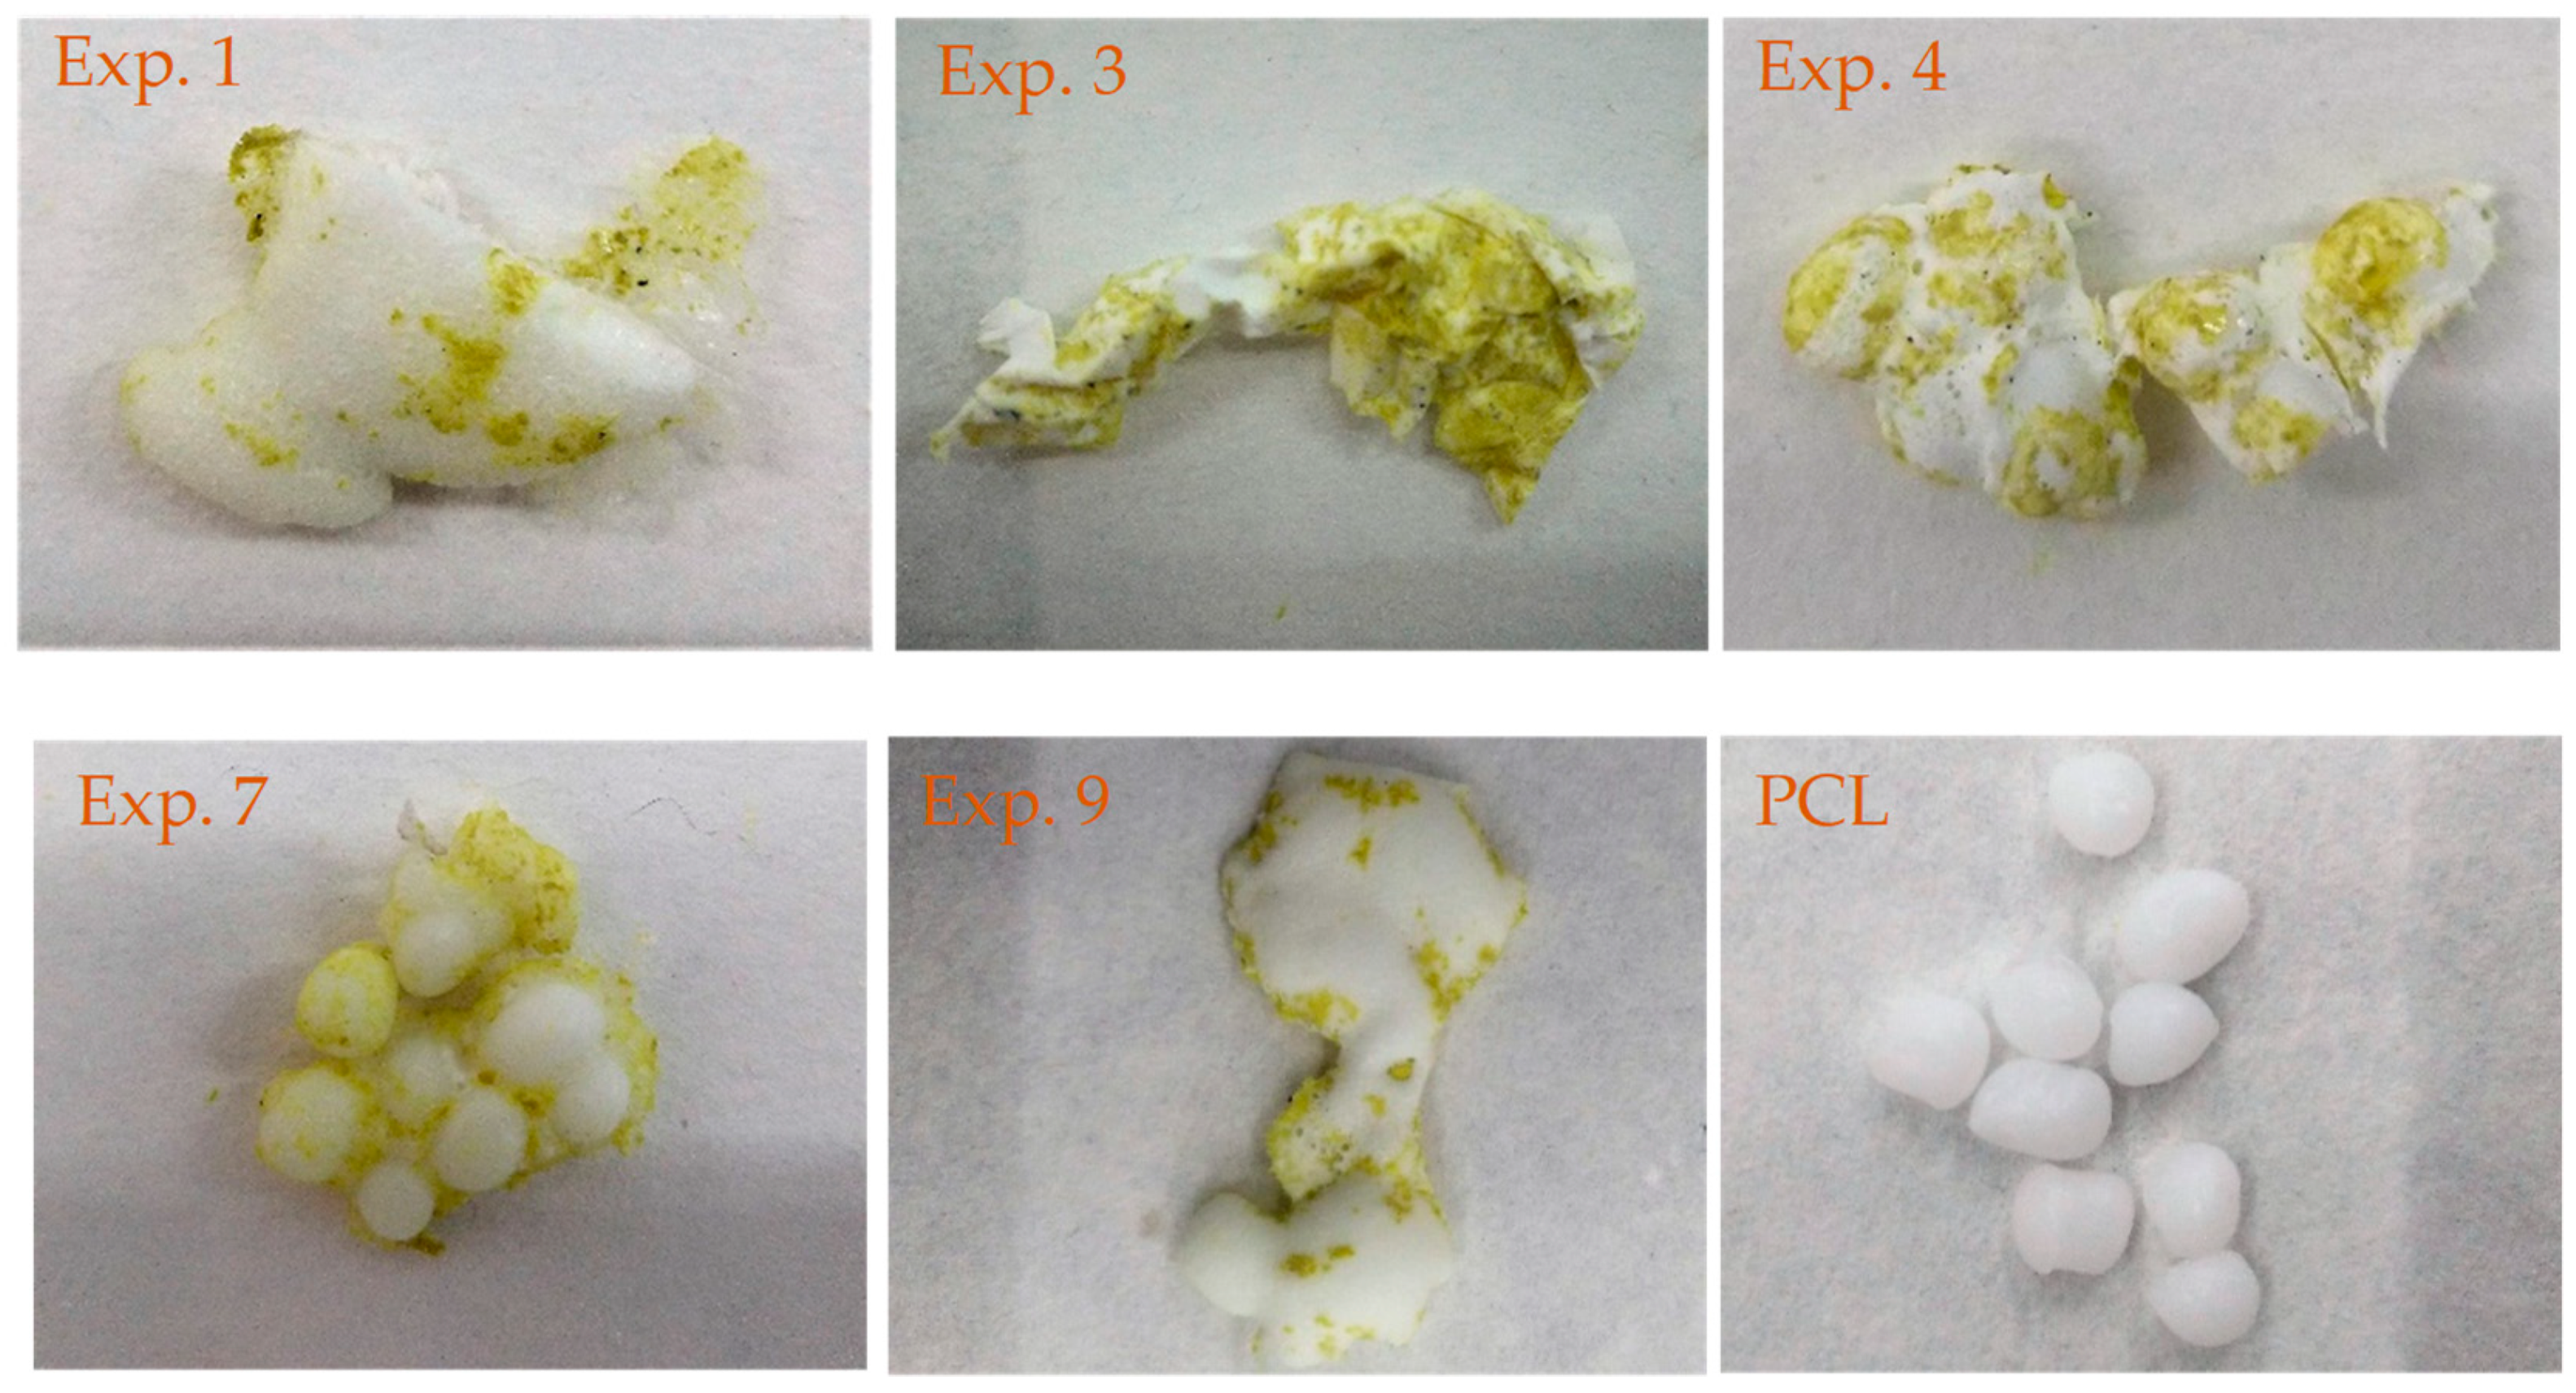
3.2. Foaming and Impregnation Experiments

All experiments showed visually an inhomogeneous impregnation along the structure of the PLC, as can be seen in Figure 2. The bottom of the polymers seemed to accumulate the highest quantity of Q. The low solubility of Q in scCO2 [29] may have contributed to the higher amounts of Q found at the bottoms. Experiments 5 and 10, conducted at the maximum temperature (333 K) and at the lowest depressurization rate (0.1 MPa) but with different pressures (15 and 30 MPa, respectively), showed the same external texture, presenting the highest foaming effect. Furthermore, experiments 3, 4, 7, and 11 exhibited the lowest foaming effect. These experiments were carried out at the minimum level of temperature (308 K) revealing the importance of temperature in the foaming process. Finally, experiments 6 and 9, conducted at the maximum temperature (333 K) and the fastest depressurization rate (0.1 MPa), exhibited a similar aspects to experiments 1, 2, and 8 (central point experiments at 22.5 MPa, 320.5 K and 2.5 MPa min−1) with foaming, a surface formed by small bubbles and a lower volume than experiments 5 and 10.

3.3. Characterization

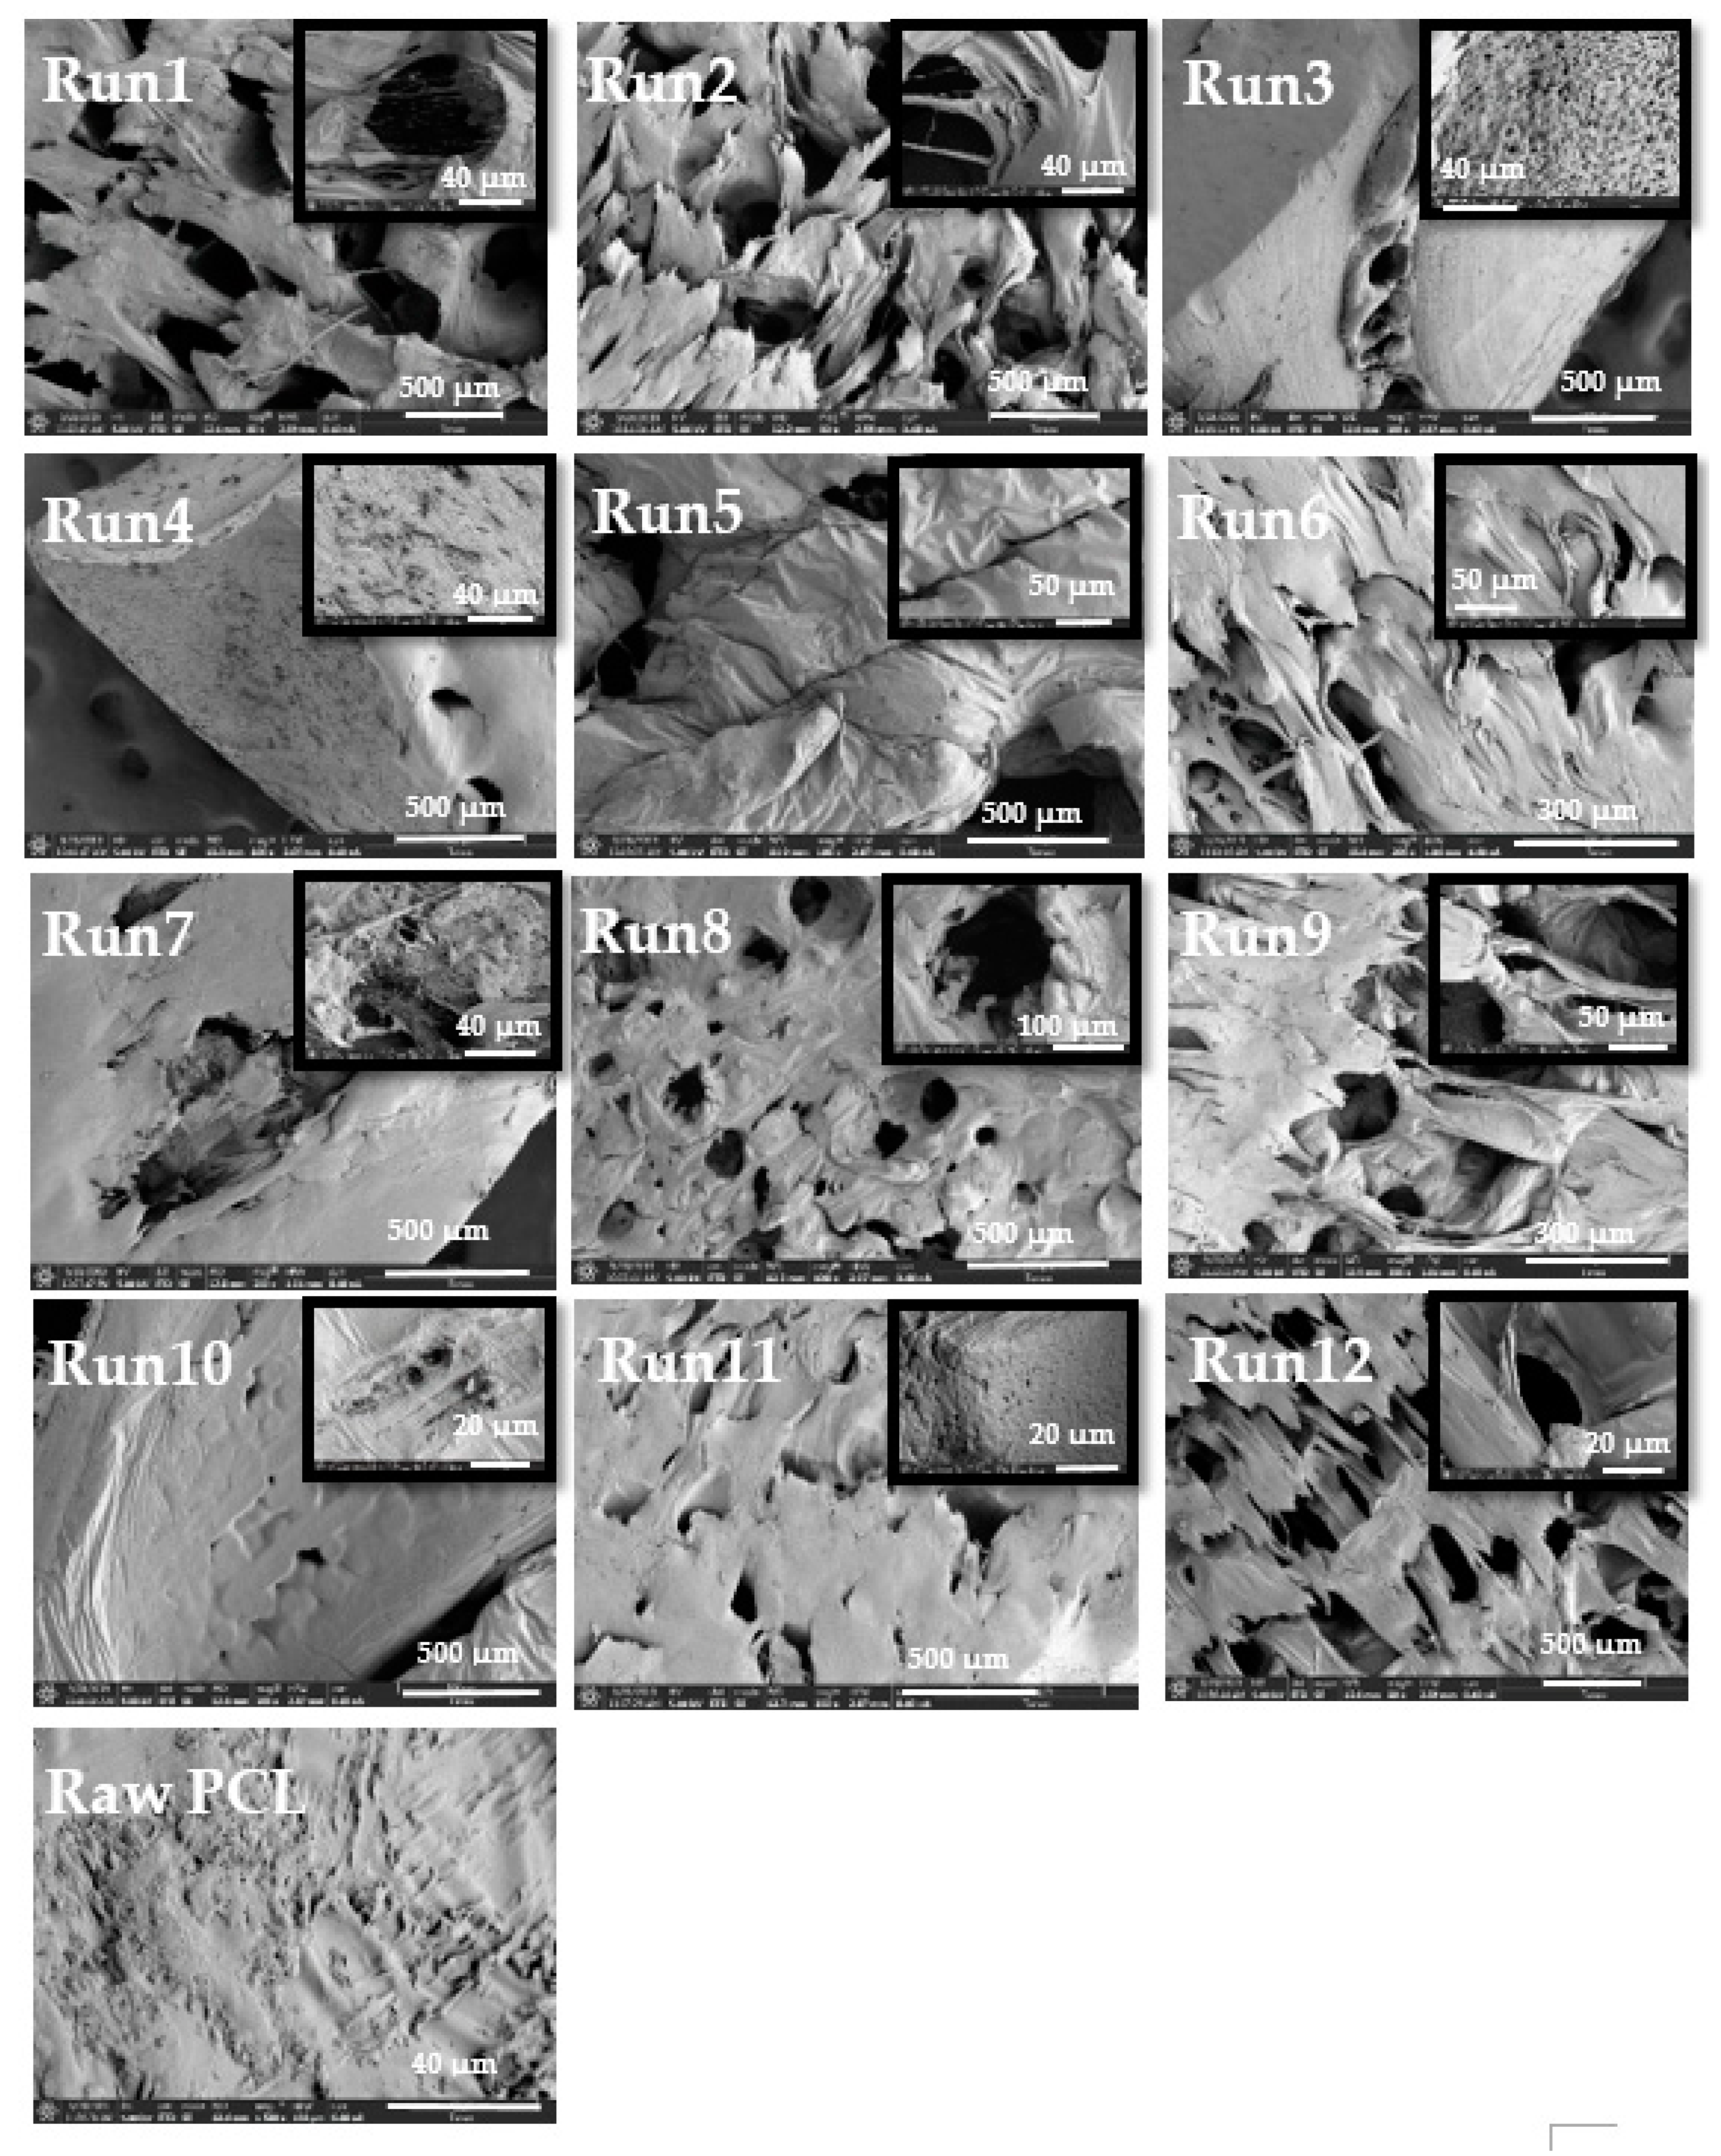
3.3.1. Scanning Electron Microscope (SEM)

The experiments conducted were screened with SEM (Figure 3). Raw PCL was also analyzed in order to compare possible changes in the porosity structure. Unlike raw PCL, the images of the composites show the formation of unstructured porous structures due to the adsorption of scCO2 into the semi-crystalline polymer, and the subsequent heterogeneous nucleation at the interface between the crystalline and amorphous regions and the homogeneous nucleation in the amorphous phase [30]. A structural difference depending on the depressurization rate was observed. Experiments 5, 7, 10, and 11 (Figure 3), carried out at a low depressurization rate (0.1 MPa min−1), present a surface with big pores (around 100 µm) and lower cell number densities. However, the experiments 3, 4, 6, and 9 (Figure 3), conducted at a fast depressurization rate (20 MPa min−1), showed a high presence of micro and nano pores with higher cell number densities. Given the impact of pressure and temperature, experiments 3 and 4 had the higher density of pores, with an abundance of pores on the surface area, as can be seen in Figure 3. This was expected because experiments 3 and 4 were carried out at a lower temperature than experiments 6 and 9 (from 333 to 308 K). Particular attention should be paid to experiment 3, carried out at a higher pressure (30 MPa) and at the same temperature (308 K) and depressurization rate (20 Mpa min−1), where a higher cell density can be observed. It is known [3,19,31] that the solubility of CO2 in the polymer increases when the temperature decreases and pressure increases; this causes an increase in the amount of CO2 in the PCL, causing higher cell density and smaller cell diameter. Also, the nucleation theory [2] explains that, at higher temperatures and lower pressures, the energy barrier to nucleation increases; consequently, the generation of nuclei is rougher, causing the reduction in the final cell density.

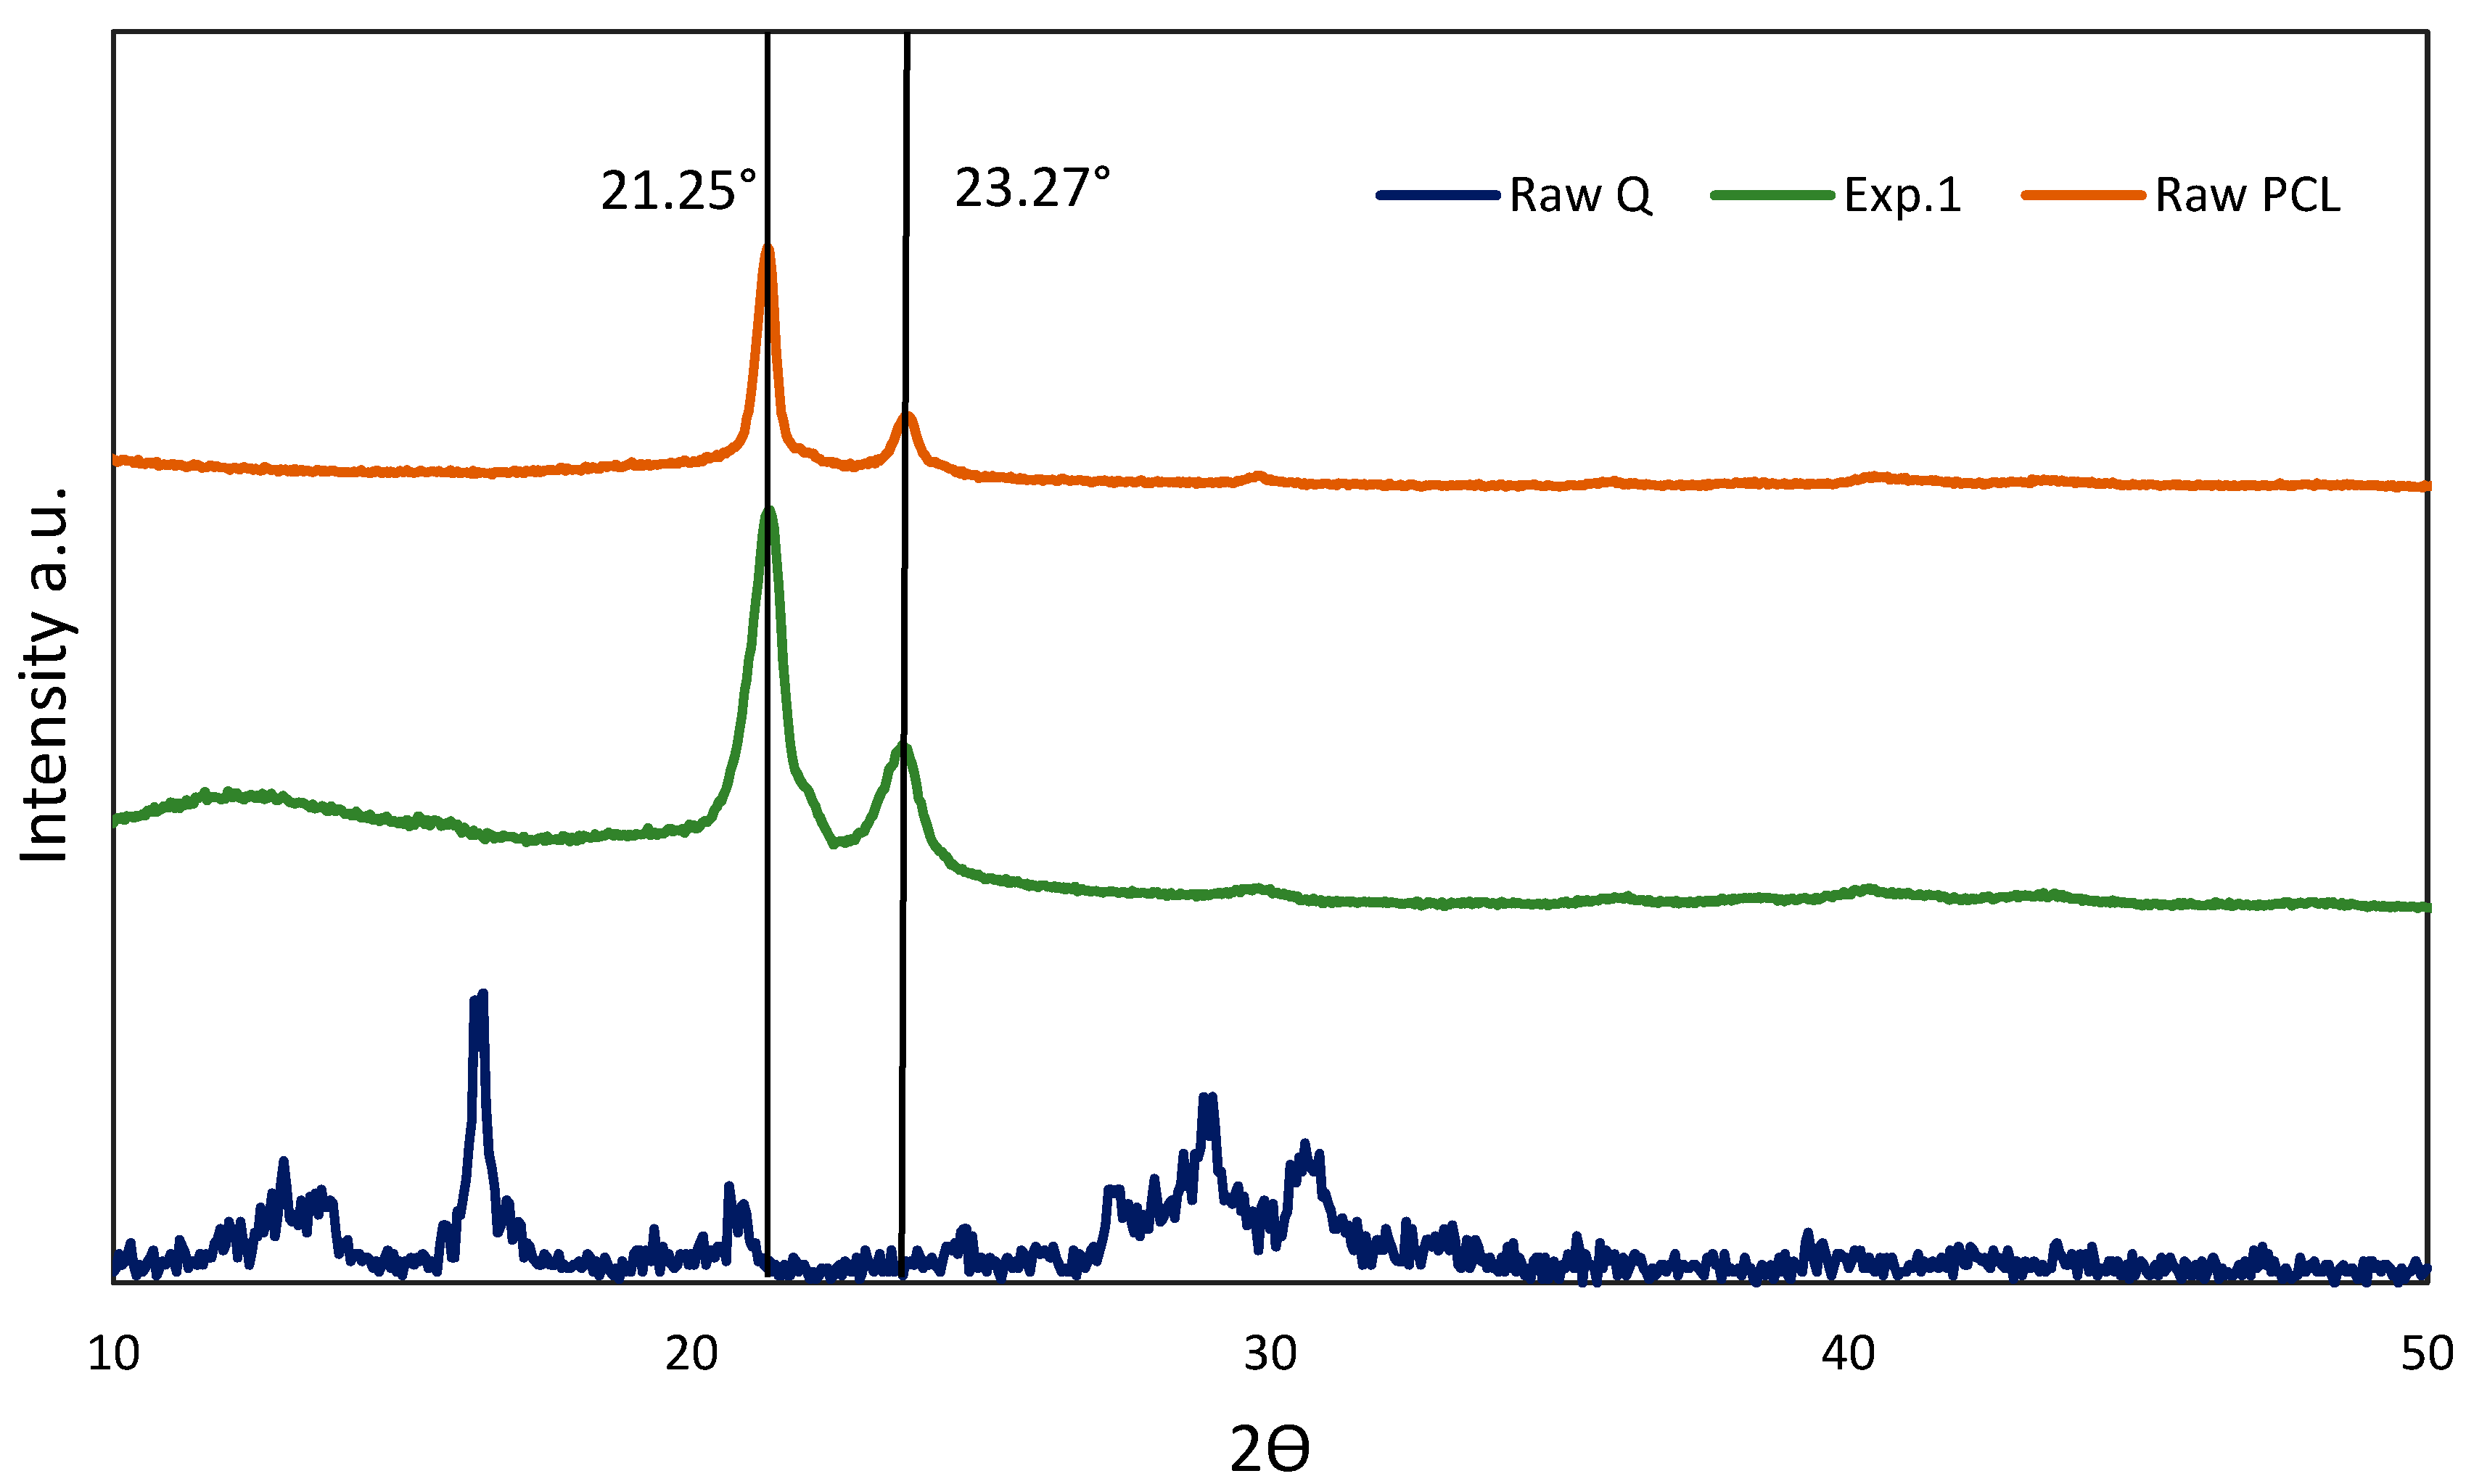
3.3.2. X-ray Diffraction

The XRD analysis (Figure 4 and Supplementary Materials) shows all experiments with a typical XRD diffraction pattern of raw PCL, and the same pattern for the treated PCL and foamed/impregnated samples. The PCL is a semi-crystalline polymer with peaks of high intensity at 21.25° and 23.7°. The supercritical foaming process increases the intensity of the crystallinity peak and decreases the presence of quercetin, reducing its crystallinity. This occurs because the presence of quercetin blocks the formation of large crystallites [14,32]. The peak of raw Q showed a wide quantity of characteristic peaks situated at 2θ = 12.3°, 12.9°, 17.75°, 21.95°, 24.5°, 26.5°, and 27.4° [22,33]. Comparing the PCL foamed/impregnated diffraction patterns with the quercetin diffraction pattern (Figure 4), it is observed that the peaks of raw Q are not presented. It could be due to the fact that Q was changed to an amorphous nature, although this seems to be unlikely. Thus, it was probably caused due to the inhomogeneous impregnation of quercetin or the quite higher ratio polymer: quercetin.

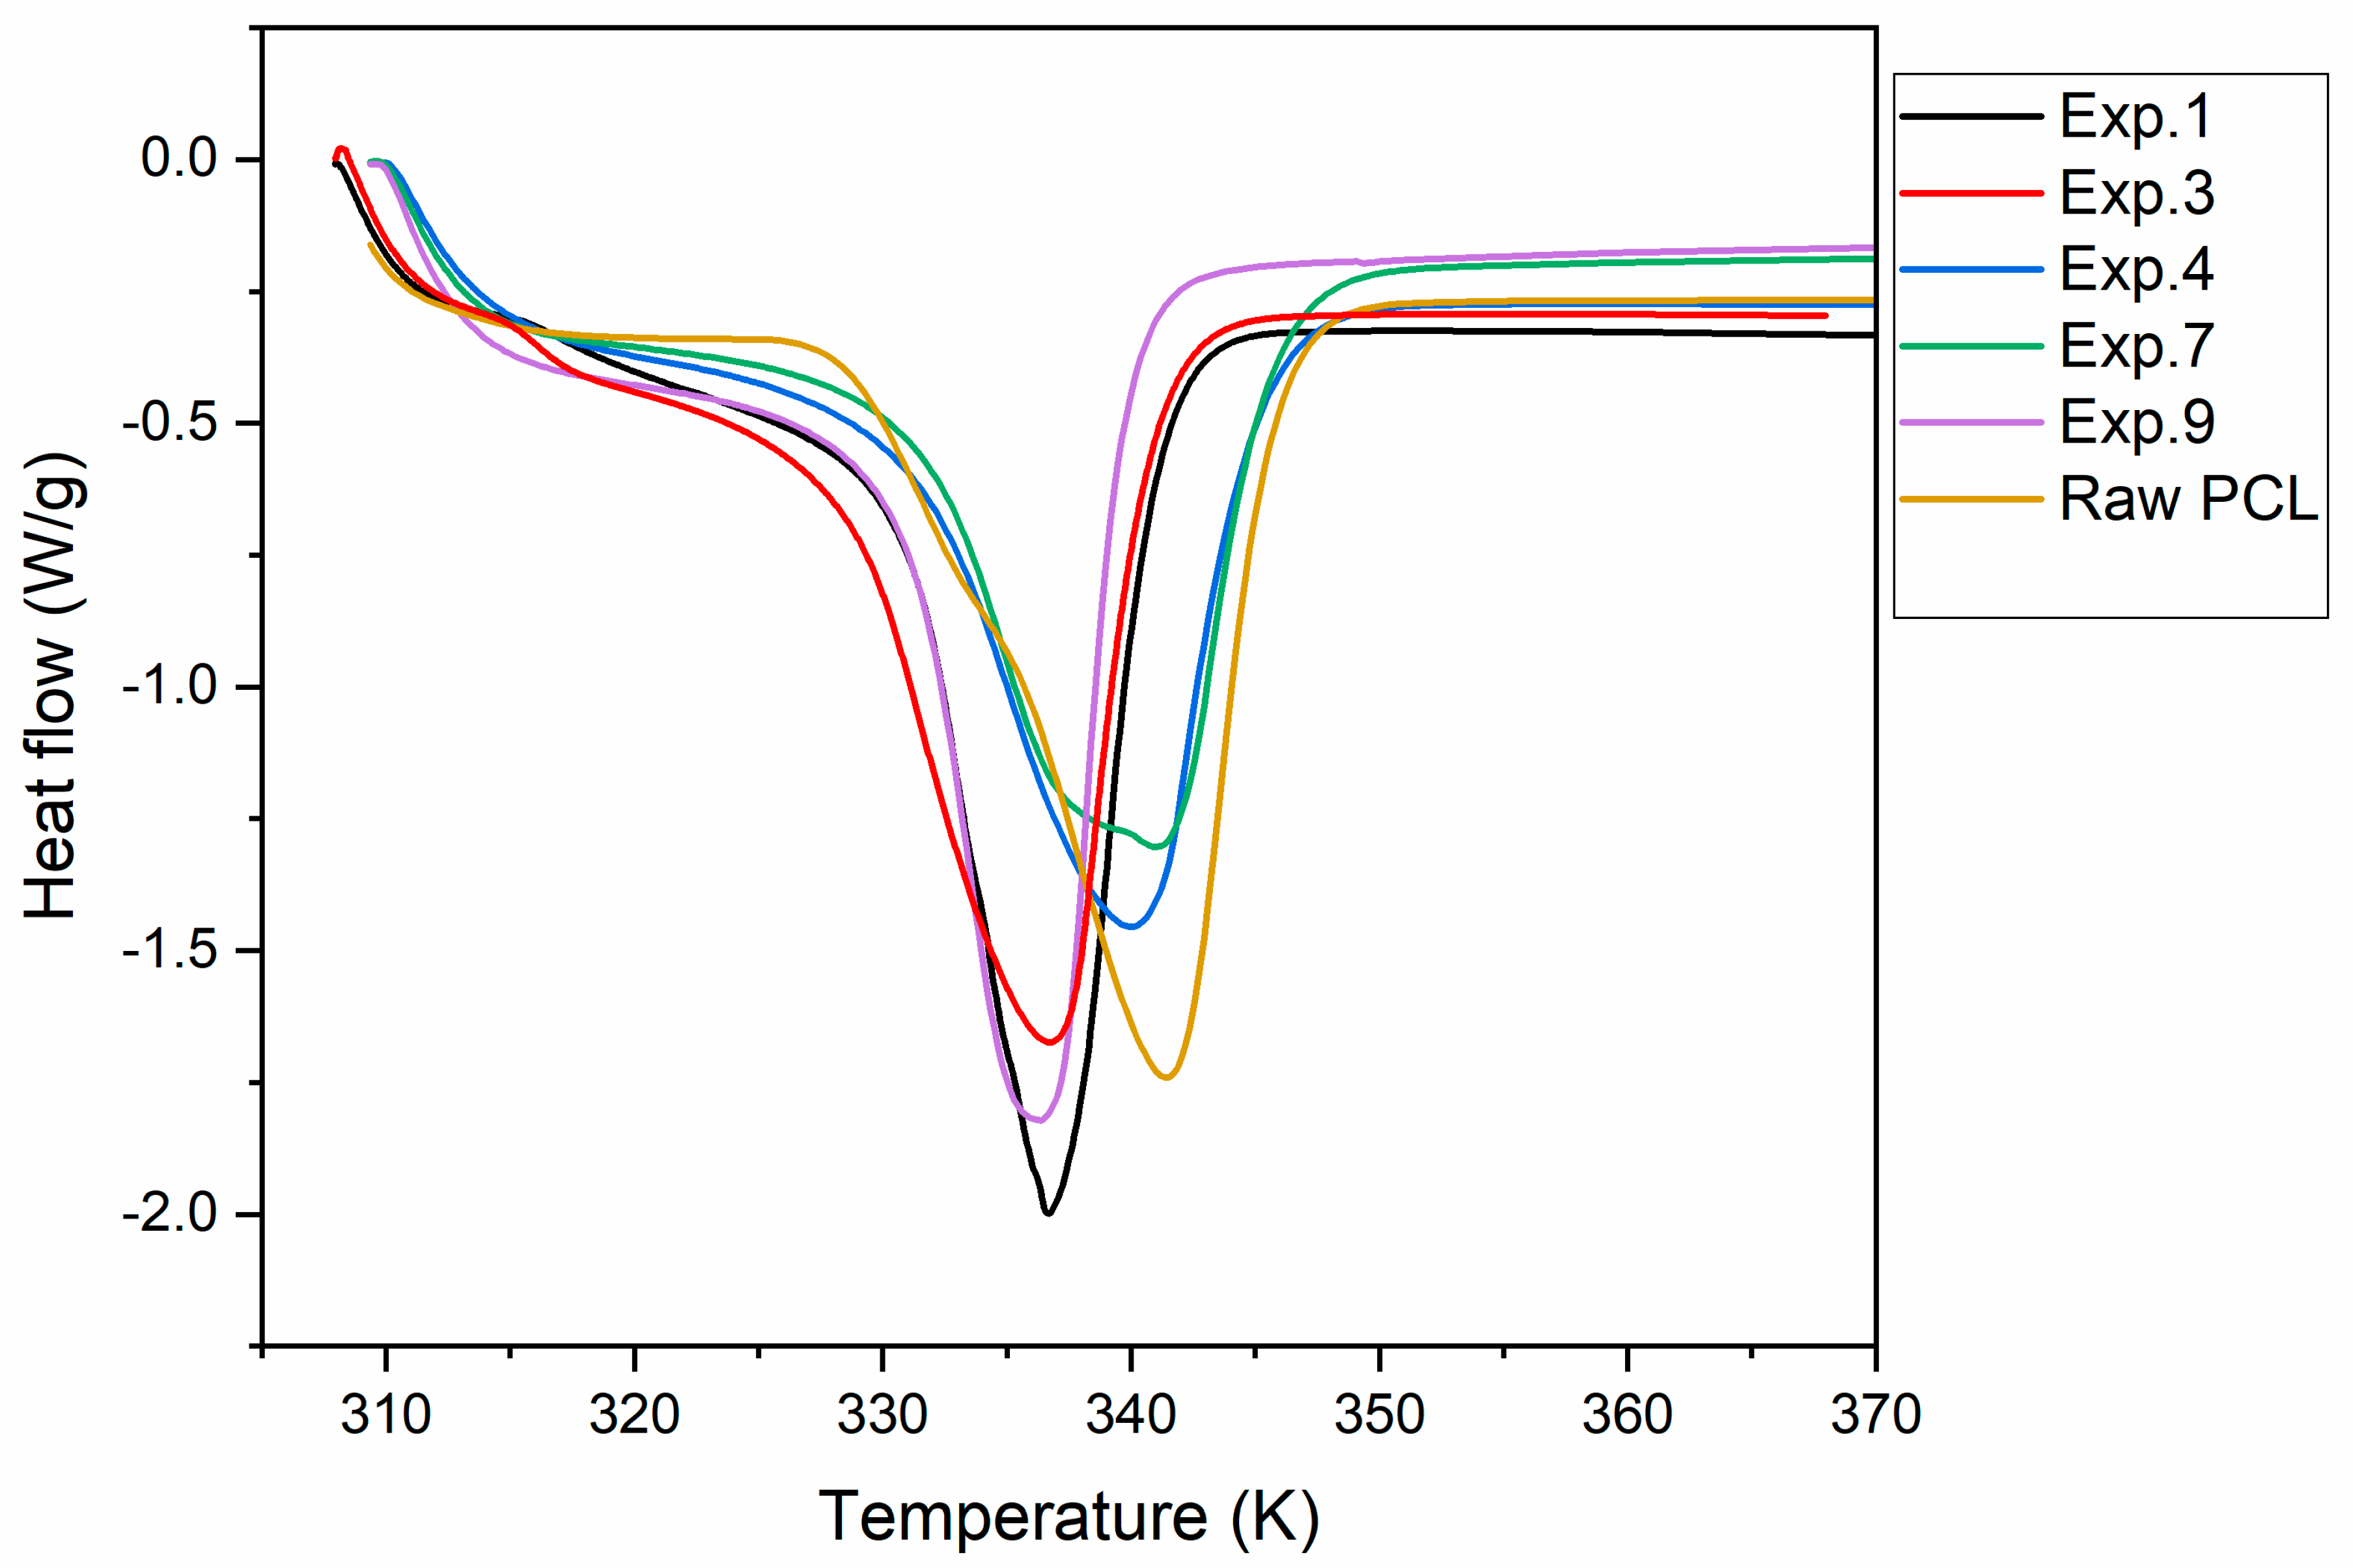
3.3.3. Differential Scanning Calorimetry

Figure 5 represents the DSC analyses of the samples, which are more different. In every plot, a simple peak corresponding to the melting temperature is shown. Moreover, melting heat (Hm) was proportioned by DSC. Both Tm and Hm are collected in Table 3. In general, it must be taken into account that the pressurization of CO2 including quercetin leads to a polymer with a Tm, in some cases, with eight degrees of difference. With regard to Hm, it was not possible to establish parameter trends due to the statistical parameter collected in the ANOVA table, which pointed to quite bad adjustment and prediction (Table 3). Besides, the highest Hm was found when the highest values of pressure, temperature, and Dr were set (Experiment 9). In Figure 6, the main effect plots on Tm can be seen. An increase in temperature led to a composite with notably lower Tm, and an increase in pressure had the same trend but with lower influence. This can be explained due to the fact that when higher operating conditions are set, CO2 is able to penetrate into the polymer chain where Q can be located, leading to a less stable structure and, thus, lower Tm. Moreover, the soaking of CO2 into the polymer structure improves the crystallinity and then decreases Tm [6,7]. However, the depressurization rate had the opposite trend, so when Dr increased, composites with higher Tm formed. In the depressurization step, nucleation of the bubbles and diffusion of the CO2 through the polymer competed. At a rapid depressurization rate, more nuclei were formed and the growth and coalescence of pores were minimized before vitrification led to a more uniform pore size distribution [34,35]. This pore structure was related to the more thermal stability (higher Tm) of composites according to the obtained results.
The nature of interaction among variables was also explored, as can be seen in Figure 7 where interaction plots are shown. In general, no interaction was observed between pressure and temperature and pressure and Dr. It seems that only Dr and temperature had a mild interaction, so at a low level of temperature, Dr had a significant influence on Tm, increasing when Dr was augmented. However, at a high temperature, the Dr effect was neglected.
Two main effects plots are shown in Figure 8. The surface slope was made by two main effects and the possible twist by their two-factor interaction. The twist was observed as expected when Dr and temperature were plotted. In general, lower pressure and lower temperature together with higher Dr lead to composites with higher Tm.

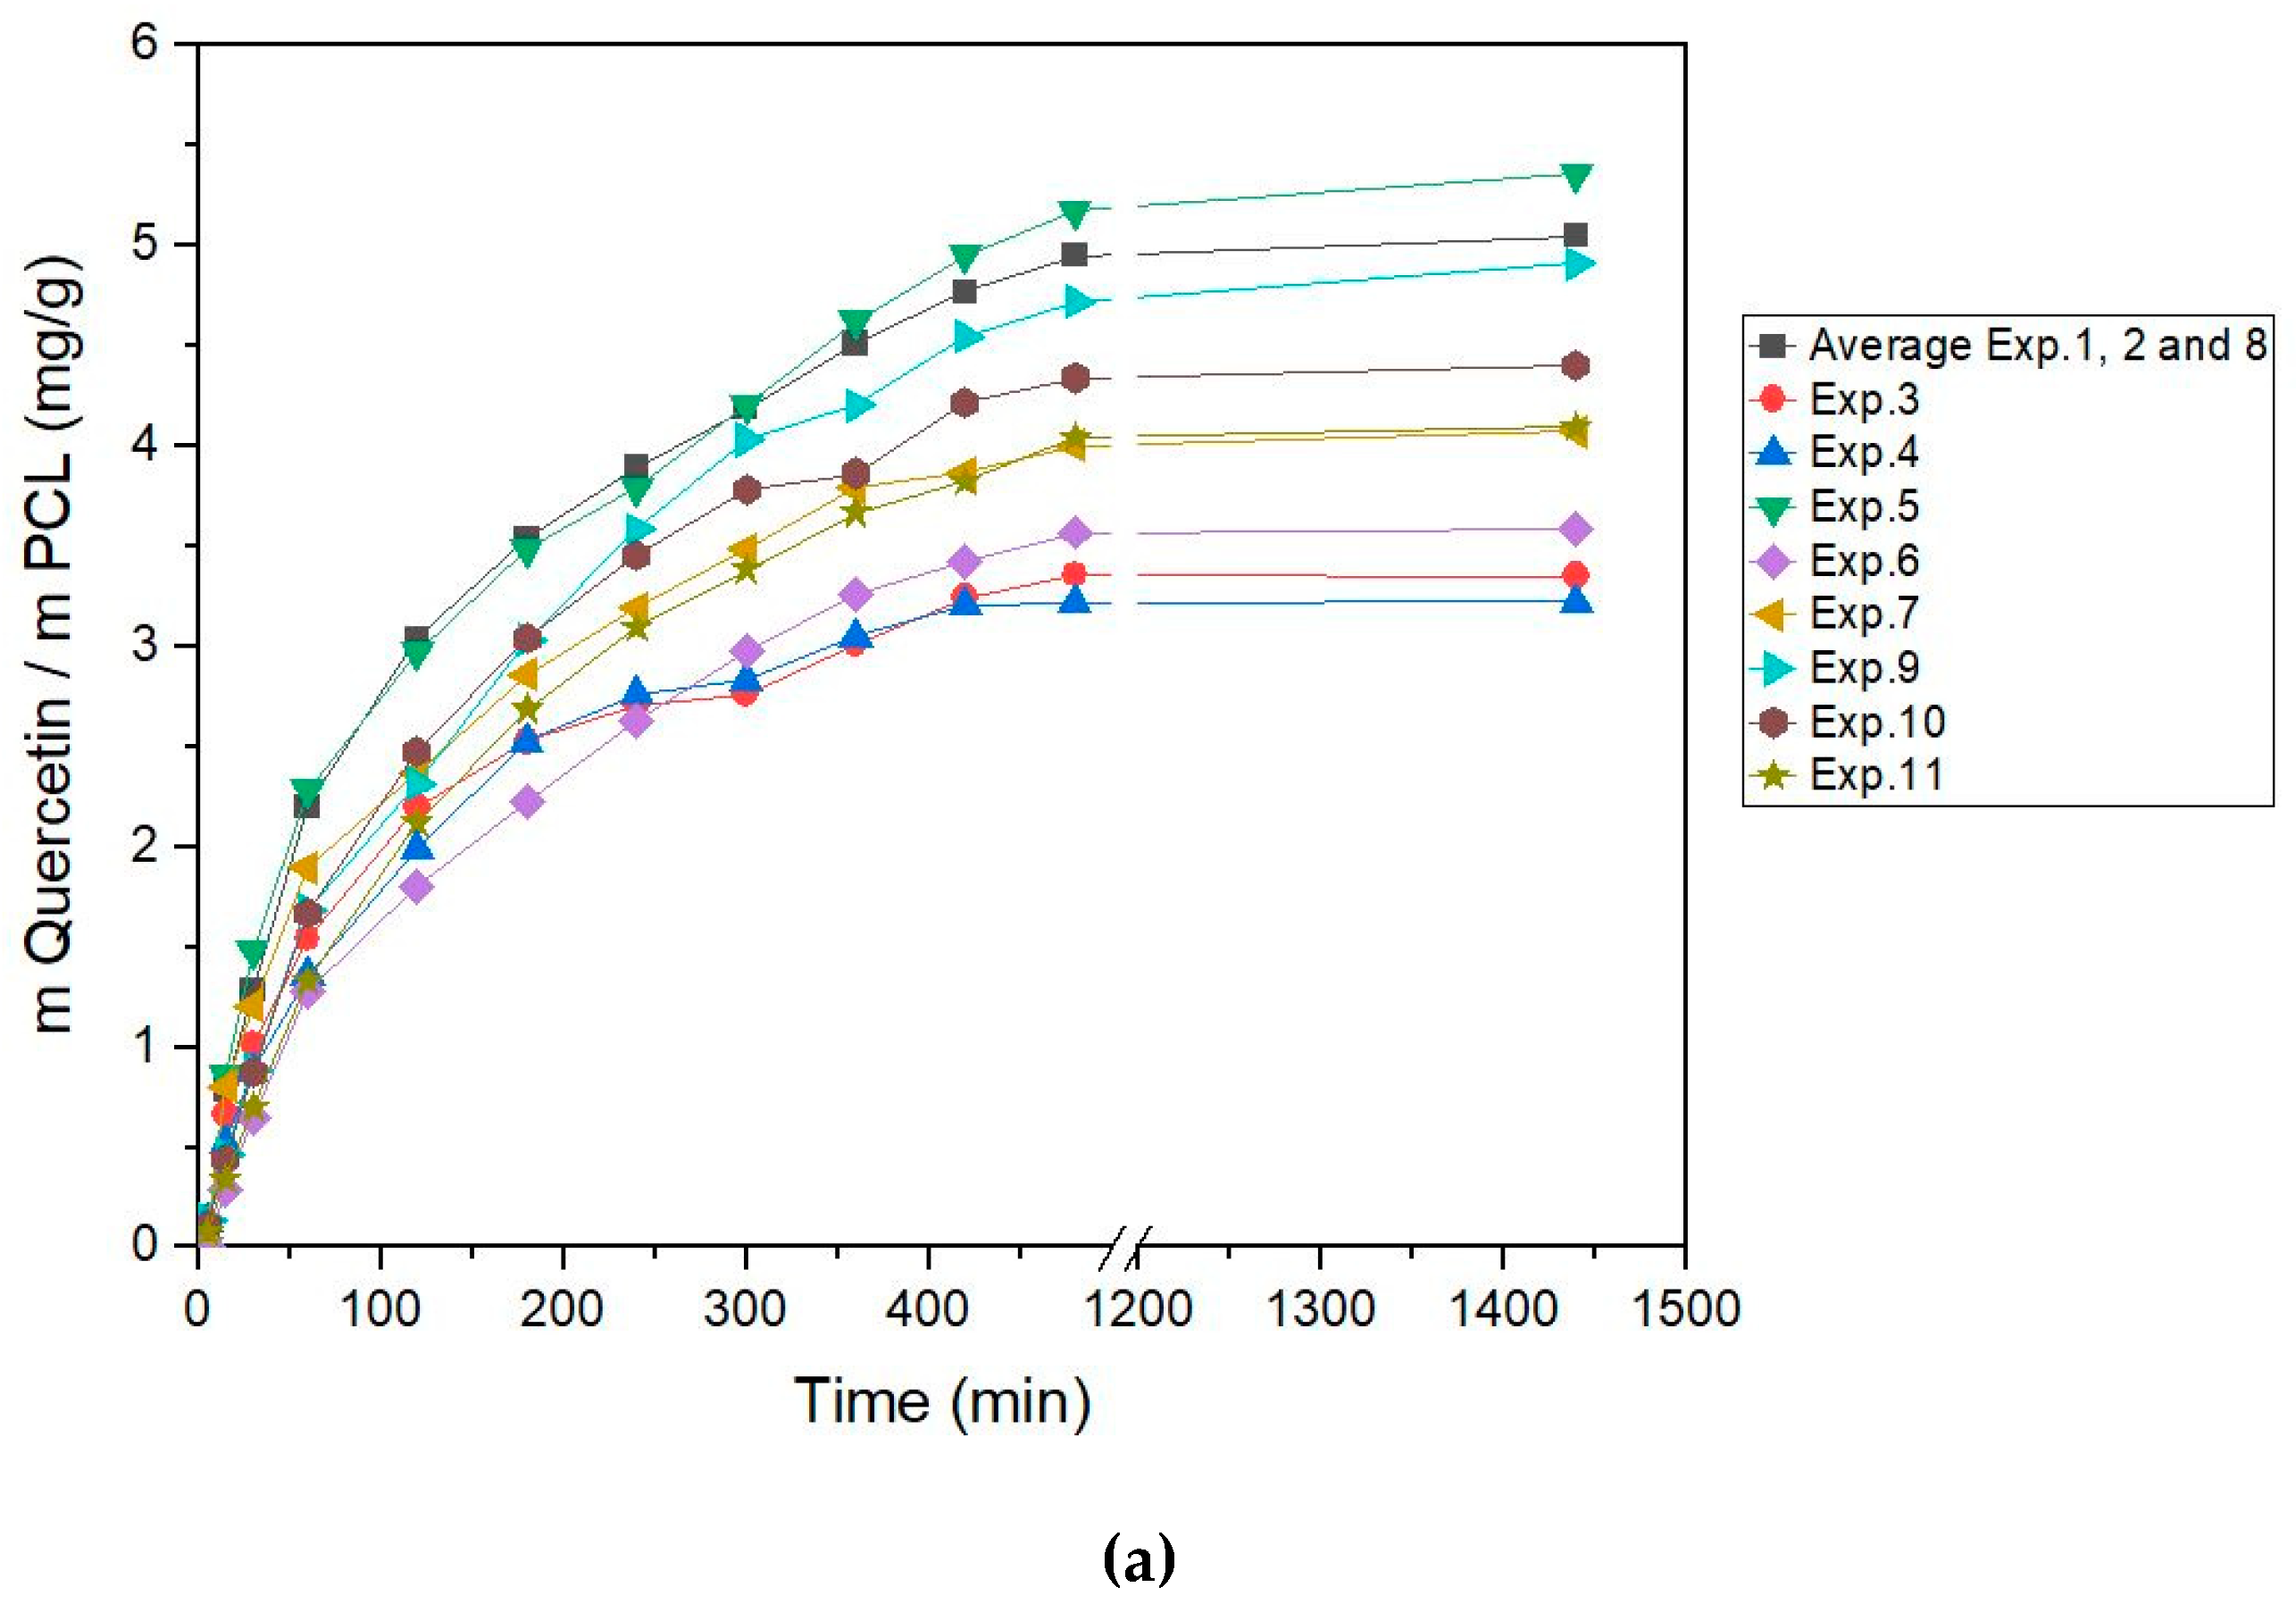
3.4. In Vitro Release Test

The release of Q from polymer was studied for all experiment (Figure 9a) and compared with raw quercetin (Figure 9b). In general, the release of Q from polymer was slower than pure dissolution of quercetin alone. Release of Q from polymer depends on the formed composites and, thus, on pressure, temperature, and Dr. For instance, experiment 3 and 6 differed almost two times in mg of released Q. It is necessary to investigate the main effects, interactions, and response surface plots to shed light on the parameter influence on release profiles.
In Figure 10, the main effect plots on released quercetin can be seen. An increase in pressure leads to a composite, where the mg of the released quercetin is increased. Temperature had the same trend due to the increase in cell diameter and lower cell density at a higher temperature process. In the same way, at higher conditions, CO2 penetrates more easily into the polymer structure increasing the space between polymer chains where quercetin can be located. In this sense, part of the quercetin would be more accessible and not entrapped in the rigid polymer structure to release into the media. However, Dr had the opposite trend, so an increase in Dr led to a lower amount of released quercetin. It was expected due to the fact that the samples obtained with higher Dr presented high densities of porosity in their surface areas and the sizes of the pores were smaller than in the other experiments.
All this supports that experiment 5, with the higher pressure, temperature, and low depressurization rate (30 MPa, 333 K, and 0.1 MPa min−1), was the sample with the highest released Q after 8 and 24 h. Figure 9b shows the release of raw Q in comparison with experiment 1, processes under the supercritical condition of 22.5 MPa, 320.5 K, and 2.5 MPa min−1. The release profile shows a significant difference; while the raw Q needed 1 h to dissolve, the Q impregnated in the foamed PCL needed 8 h to release and dissolve the same quantity of Q; this means it was eight times slower. This demonstrates the utility of PCL to coat an active principle, in this case Q, to control the release process for in vitro tests in simulated fluids with a pH around 7.
The nature of interaction among factors was also explored, as can be seen in Figure 11. In general, no interaction was observed between Dr and pressure and temperature. However, a mild interaction was observed between pressure and temperature, so at low pressure, the temperature effect was almost neglected on the released quercetin. This fact could be observed in the two main effects plots (Figure 12). It can be seen that higher pressure and temperature and lower Dr are recommended to release the highest amount of quercetin from the composites.

4. Conclusions

The foaming and impregnation one-step process of PCL and quercetin was successfully conducted. Pressure, temperature, and depressurization rate were evaluated for the foaming, melting temperature, melting heat, and the amount of released quercetin. Melting heat data had no significant differences and no trends were established. A high temperature is recommended to obtain a pronounced effect of foaming. Pressure and depressurization rate have an important influence on responses. The generated PCL/quercetin composites with higher pore density and smaller size were achieved for higher pressure and depressurization rate and lower temperatures (300 bar, 308 K, and 20 MPa min−1). This study also showed that experiments carried out at lower pressure and temperature together with a higher depressurization rate lead to a higher melting temperature. An increase in pressure and temperature lead to a composite which releases higher amounts of quercetin. However, the depressurization rate had the opposite trend; thus, an increase in the depressurization rate led to lower amounts of released quercetin. Release profiles showed that quercetin takes five times longer to dissolve the same amount of quercetin in the first 8 h, demonstrating the efficacy of using PCL to control quercetin release and its possible use with other medical or pharmaceutical compounds.

Supplementary Materials

The following are available online at https://www.mdpi.com/2073-4360/11/9/1390/s1. XRD patterns of experiments 1–11 and raw PCL.

Author Contributions

Investigation, I.G.-C. and D.V.; Methodology, A.M.; Project administration, E.J.M.d.l.O.; Supervision, C.P.

Funding

This research was funded by Ministerio de Ciencia y Tecnología: CTQ2017-86661-R and European Regional Development Funds: UNCA10-1E-1125 and 18INIA1103. 2011.

Acknowledgments

We gratefully acknowledge the Spanish Ministry of Science and Technology (Project CTQ2017-86661-R) and European Regional Development Funds (UNCA10-1E-1125 and 18INIA1103. 2011) for the financial support, and the Central Services of Science and Technology of University of Cádiz for the analyses.

Conflicts of Interest

The authors declare no conflict of interest.

References

  1. Kuang, T.; Chen, F.; Chang, L.; Zhao, Y.; Fu, D.; Gong, X.; Peng, X. Facile Preparation of Open-Cellular Porous Poly(l-lactic acid) Scaffold by Supercritical Carbon Dioxide Foaming for Potential Tissue Engineering Applications. Chem. Eng. J. 2017, 307, 1017–1025. [Google Scholar] [CrossRef]
  2. Goel, S.K.; Beckman, E.J. Generation of Microcellular Polymeric Foams Using Supercritical Carbon Dioxide. II: Cell Growth and Skin Formation. Polym. Eng. Sci. 1994, 34, 1137–1147. [Google Scholar] [CrossRef]
  3. Fanovich, M.A.; Jaeger, P. Sorption and Diffusion of Compressed Carbon Dioxide in Polycaprolactone for the Development of Porous Scaffolds. Mater. Sci. Eng. C 2012, 32, 961–968. [Google Scholar] [CrossRef]
  4. Lian, Z.; Epstein, S.A.; Blenk, C.W.; Shine, A.D. Carbon Dioxide-Induced Melting Point Depression of Biodegradable Semicrystalline Polymers. J. Supercrit. Fluids 2006, 39, 107–117. [Google Scholar] [CrossRef]
  5. Yoganathan, R.; Mammucari, R.; Foster, N.R. Impregnation of Ibuprofen into Polycaprolactone Using Supercritical Carbon Dioxide. J. Phys. Conf. Ser. 2010, 215, 6–11. [Google Scholar] [CrossRef]
  6. Takada, M.; Hasegawa, S.; Ohshima, M. Crystallization Kinetics of Poly(l-lactide) in Contact with Pressurized CO2. Polym. Eng. Sci. 2004, 44, 186–196. [Google Scholar] [CrossRef]
  7. Zhang, Z.; Handa, Y.P. CO2-Assisted Melting of Semicrystalline Polymers. Macromolecules 1997, 30, 8505–8507. [Google Scholar] [CrossRef]
  8. Sinha, V.R.; Bansal, K.; Kaushik, R.; Kumria, R.; Trehan, A. Poly-ϵ-Caprolactone Microspheres and Nanospheres: An Overview. Int. J. Pharm. 2004, 278, 1–23. [Google Scholar] [CrossRef]
  9. Moghadam, M.Z.; Hassanajili, S.; Esmaeilzadeh, F.; Ayatollahi, M.; Ahmadi, M. Formation of Porous HPCL/LPCL/HA Scaffolds with Supercritical CO2 Gas Foaming Method. J. Mech. Behav. Biomed. Mater. 2017, 69, 115–127. [Google Scholar] [CrossRef]
  10. Cotugno, S.; Di Maio, E.; Mensitieri, G.; Iannace, S.; Roberts, G.W.; Carbonell, R.G.; Hopfenberg, H.B. Characterization of Microcellular Biodegradable Polymeric Foams Produced from Supercritical Carbon Dioxide Solutions. Ind. Eng. Chem. Res. 2005, 44, 1795–1803. [Google Scholar] [CrossRef]
  11. Xu, Q.; Ren, X.; Chang, Y.; Wang, J.; Yu, L.; Dean, K. Generation of Microcellular Biodegradable Polycaprolactone Foams in Supercritical Carbon Dioxide. J. Appl. Polym. Sci. 2004, 94, 593–597. [Google Scholar] [CrossRef]
  12. Kiran, E. Foaming Strategies for Bioabsorbable Polymers in Supercritical Fluid Mixtures. Part II. Foaming of Poly(ɛ-caprolactone-co-lactide) in Carbon Dioxide and Carbon Dioxide + Acetone Fluid Mixtures and Formation of Tubular Foams via Solution Extrusion. J. Supercrit. Fluids 2010, 54, 308–319. [Google Scholar] [CrossRef]
  13. Diaz-Gomez, L.; Concheiro, A.; Alvarez-Lorenzo, C.; García-González, C.A. Growth Factors Delivery from Hybrid PCL-Starch Scaffolds Processed Using Supercritical Fluid Technology. Carbohydr. Polym. 2016, 142, 282–292. [Google Scholar] [CrossRef] [PubMed]
  14. de Matos, M.B.C.; Piedade, A.P.; Alvarez-Lorenzo, C.; Concheiro, A.; Braga, M.E.M.; de Sousa, H.C. Dexamethasone-loaded poly(ɛ-caprolactone)/Silica Nanoparticles Composites Prepared by Supercritical CO2 Foaming/Mixing and Deposition. Int. J. Pharm. 2013, 456, 269–281. [Google Scholar] [CrossRef] [PubMed]
  15. Goimil, L.; Santos-Rosales, V.; Delgado, A.; Évora, C.; Reyes, R.; Lozano-Pérez, A.A.; Aznar-Cervantes, S.D.; Cenis, J.L.; Gómez-Amoza, J.L.; Concheiro, A.; et al. scCO2-Foamed Silk Fibroin Aerogel/Poly(ε-caprolactone) Scaffolds Containing Dexamethasone for Bone Regeneration. J. CO2 Util. 2019, 31, 51–64. [Google Scholar] [CrossRef]
  16. Campardelli, R.; Franco, P.; Reverchon, E.; De Marco, I. Polycaprolactone/Nimesulide Patches Obtained by a One-Step Supercritical Foaming + Impregnation Process. J. Supercrit. Fluids 2019, 146, 47–54. [Google Scholar] [CrossRef]
  17. Zehbe, R.; Zehbe, K. Strontium Doped Poly-ε-Caprolactone Composite Scaffolds Made by Reactive Foaming. Mater. Sci. Eng. C 2016, 67, 259–266. [Google Scholar] [CrossRef] [PubMed]
  18. Marković, D.; Milovanović, S.; Radovanović, Ž.; Zizovic, I.; Šaponjić, Z.; Radetić, M. Floating Photocatalyst Based on Poly(ε-caprolactone) Foam and TiO2 Nanoparticles for Removal of Textile Dyes. Fibers Polym. 2018, 19, 1219–1227. [Google Scholar] [CrossRef]
  19. Tsivintzelis, I.; Pavlidou, E.; Panayiotou, C. Biodegradable Polymer Foams Prepared with Supercritical CO2-Ethanol Mixtures as Blowing Agents. J. Supercrit. Fluids 2007, 42, 265–272. [Google Scholar] [CrossRef]
  20. Formica, J.V.; Regelson, W. Review of the Biology of Quercetin and Related Bioflavonoids. Food Chem. Toxicol. 1995, 33, 1061–1080. [Google Scholar] [CrossRef]
  21. Boots, A.W.; Haenen, G.R.M.M.; Bast, A. Health Effects of Quercetin: From Antioxidant to Nutraceutical. Eur. J. Pharmacol. 2008, 585, 325–337. [Google Scholar] [CrossRef] [PubMed]
  22. Sahoo, N.G.; Kakran, M.; Shaal, L.A.; Li, L.; Müller, R.H.; Pal, M.; Tan, L.P. Preparation and Characterization of Quercetin Nanocrystals. J. Pharm. Sci. 2011, 100, 2379–2390. [Google Scholar] [CrossRef] [PubMed]
  23. Santos, D.T.; Meireles, M.A.A. Micronization and Encapsulation of Functional Pigments Using Supercritical Carbon Dioxide. J. Food Process Eng. 2013, 36, 36–49. [Google Scholar] [CrossRef]
  24. García-Casas, I.; Montes, A.; Pereyra, C.; Martínez, D.L.O.E.J. Generation of Quercetin/Cellulose Acetate Phthalate Systems for Delivery by Supercritical Antisolvent Process. Eur. J. Pharm. Sci. 2017, 100, 79–86. [Google Scholar] [CrossRef] [PubMed]
  25. Dias, A.M.A.; Braga, M.E.M.; Seabra, I.J.; Ferreira, P.; Gil, M.H.; De Sousa, H.C. Development of Natural-Based Wound Dressings Impregnated with Bioactive Compounds and Using Supercritical Carbon Dioxide. Int. J. Pharm. 2011, 408, 9–19. [Google Scholar] [CrossRef] [PubMed]
  26. García-Casas, I.; Crampon, C.; Montes, A.; Pereyra, C.; Martínez, D.L.O.E.J.; Badens, E. Supercritical CO2 Impregnation of Silica Microparticles with Quercetin. J. Supercrit. Fluids 2019, 143, 157–161. [Google Scholar] [CrossRef]
  27. Zhu, Y.F.; Shi, J.L.; Li, Y.S.; Chen, H.R.; Shen, W.H.; Dong, X.P. Storage and Release of Ibuprofen Drug Molecules in Hollow Mesoporous Silica Spheres with Modified Pore Surface. Microporous Mesoporous Mater. 2005, 85, 75–81. [Google Scholar] [CrossRef]
  28. Dahmoune, F.; Spigno, G.; Moussi, K.; Remini, H.; Cherbal, A.; Madani, K. Pistacia lentiscus Leaves as a Source of Phenolic Compounds: Microwave-Assisted Extraction Optimized and Compared with Ultrasound-Assisted and Conventional Solvent Extraction. Ind. Crops Prod. 2014, 61, 31–40. [Google Scholar] [CrossRef]
  29. Chafer, A.; Fornari, T.; Berna, A.; Stateva, R.P. Solubility of Quercetin in Supercritical CO2 + Ethanol as a Modifier: Measurements and Thermodynamic Modelling. J. Supercrit. Fluids 2004, 32, 89–96. [Google Scholar] [CrossRef]
  30. Baldwin, D.F.; Park, C.B.; Suh, N.P. A microcellular Processing Study of Poly(ethylene terephthalate) in the Amorphous and Semicrystalline States. Part II: Cell Growth and Process Design. Polym. Eng. Sci. 1996, 36, 1446–1453. [Google Scholar] [CrossRef]
  31. Reverchon, E.; Cardea, S. Production of Controlled Polymeric Foams by Supercritical CO2. J. Supercrit. Fluids 2007, 40, 144–152. [Google Scholar] [CrossRef]
  32. Messersmith, P.B.; Giannelis, E.P. Synthesis and Barrier Properties of Poly(ε-caprolactone)-Layered Silicate Nanocomposites. J. Polym. Sci. Part A Polym. Chem. 1995, 33, 1047–1057. [Google Scholar] [CrossRef]
  33. Fraile, M.; Buratto, R.; Gómez, B.; Martín, Á.; Cocero, M.J. Enhanced Delivery of Quercetin by Encapsulation in Poloxamers by Supercritical Antisolvent Process. Ind. Eng. Chem. Res. 2014, 53, 4318–4327. [Google Scholar] [CrossRef]
  34. White, L.J.; Hutter, V.; Tai, H.; Howdle, S.M.; Shakesheff, K.M. The Effect of Processing Variables on Morphological and Mechanical Properties of Supercritical CO2 Foamed Scaffolds for Tissue Engineering. Acta Biomater. 2012, 8, 61–71. [Google Scholar] [CrossRef]
  35. Tsivintzelis, I.; Angelopoulou, A.G.; Panayiotou, C. Foaming of Polymers with Supercritical CO2: An Experimental and Theoretical Study. Polymer 2007, 48, 5928–5939. [Google Scholar] [CrossRef]
Figure 1. Schematic foaming/impregnation plant.
Polymers 11 01390 g001
Figure 2. Photos of experiments 1, 3, 4, 7, and 9 and raw PCL.
Polymers 11 01390 g002
Figure 3. SEM images of composites and raw PCL.
Polymers 11 01390 g003
Figure 4. XRD diffraction pattern of composites, raw Q and PCL.
Polymers 11 01390 g004
Figure 5. DSC diagrams of composite PCL–quercetin.
Polymers 11 01390 g005
Figure 6. Main effects on Tm of composite PCL–quercetin.
Polymers 11 01390 g006
Figure 7. Variable interaction plots on Tm of composite PCL–quercetin.
Polymers 11 01390 g007
Figure 8. Response surface plots of Tm of composites.
Polymers 11 01390 g008
Figure 9. Release tests. (a) Release test of Q with polymer in experiments 1–11; (b) comparison release test raw Q and average experiments 1, 2, and 8.
Polymers 11 01390 g009aPolymers 11 01390 g009b
Figure 10. Main effects on released quercetin of the composites.
Polymers 11 01390 g010
Figure 11. Variable interactions plots on released quercetin of the composites.
Polymers 11 01390 g011
Figure 12. Response surface plots of released quercetin of the composites.
Polymers 11 01390 g012
Table 1. Two-level assessment for each factor and the calculated effects on responses.
FactorsLow LevelHigh LevelTm
Effects
Released Q
Effects
Hm
Effects
P (MPa)1530−0.440.59−0.61
T (K)308333−2.020.90−1.90
Dr (MPa min−1)0.10201.31−0.751.42
Table 2. Analysis of variance for the design model of process variables.
Variables DFSSMSR2AdjR2Q2Significance
F
Lack of Fit
p
TmModel916.861.870.950.840.538.720.048
Residual30.910.30
Error20.850.42
Released QModel94.170.460.950.840.579.080.049
Residual30.220.07
Error20.120.06
HmModel9379.1742.130.49−0.520.040.480.79
Residual3191.6863.90
Error288.7844.40
Table 3. Experimental design and observed responses.
ExperimentsP
(MPa)
T
(K)
Dr
(MPa min−1)
Tm (K)mg Released Q/g PCLHm (J/g)
122.5320.52.5334.704.6385.07
222.5320.52.5333.634.3373.50
33030820336.703.3587.39
41530820337.103.2283.69
5303330.1333.485.3690.58
61533320333.913.5887.77
7153080.1338.323.3584.57
822.5320.52.5334.814.1485.01
93033320333.234.9196.52
10153330.1333.614.4080.10
11303080.1333.744.1092.69
Table 4. Coefficients list of the linear model for Tm and released quercetin and their significance.
Coefficient (Tm)p (Tm)Coefficient (Released Q)p (Released Q)
Constant61.406.26 × 10−84.252.18 × 10−5
P−0.190.430.260.08
T−0.880.020.390.03
Dr0.570.04−0.330.04
P·T−5.71 × 10−30.980.230.09
P Dr−0.040.860.060.55
T·Dr−0.570.060.050.62

