The Impact of Cross-Linking Effect on the Space Charge Characteristics of Cross-Linked Polyethylene with Different Degrees of Cross-Linking under Strong Direct Current Electric Field

Abstract
1. Introduction
2. Materials and Methods
2.1. Samples Preparation
2.1.1. The Preparation Principle of XLPE
2.1.2. The Preparation of Samples Used in This Experiment
Raw Materials
Samples Preparation Process
- Weighing a certain amount of pure LDPE and the corresponding mass of DCP, and grinding the DCP into powders with the ball mill.
- Mixing DCP and LDPE on an auto-measured twin-screw extruder at 116 °C to produce particles. Ultimately, the particle materials with DCP mass fractions of 0%, 1%, 2.1%, 3%, and 5% are prepared, respectively.
- Preheating the particle materials for 10 min on the flat vulcanizing machine at 120 °C; during this time, the vulcanizing press is not pressurized. Then, the temperature is raised to 180 °C, and, at this time, the pressure is maintained at 15 MPa for 20 min to fully cross-link the samples.
- Removing the samples from the flat vulcanizing machine and allowing samples to cool to achieve the room temperature, thereby obtaining XLPE samples with different cross-linking degrees. The sample sizes are 4 cm × 4 cm × 0.16 mm and 4 cm × 4 cm × 0.1mm.
Samples Pretreatment
2.2. The Space Charge Testing System
2.3. The Experimental Method
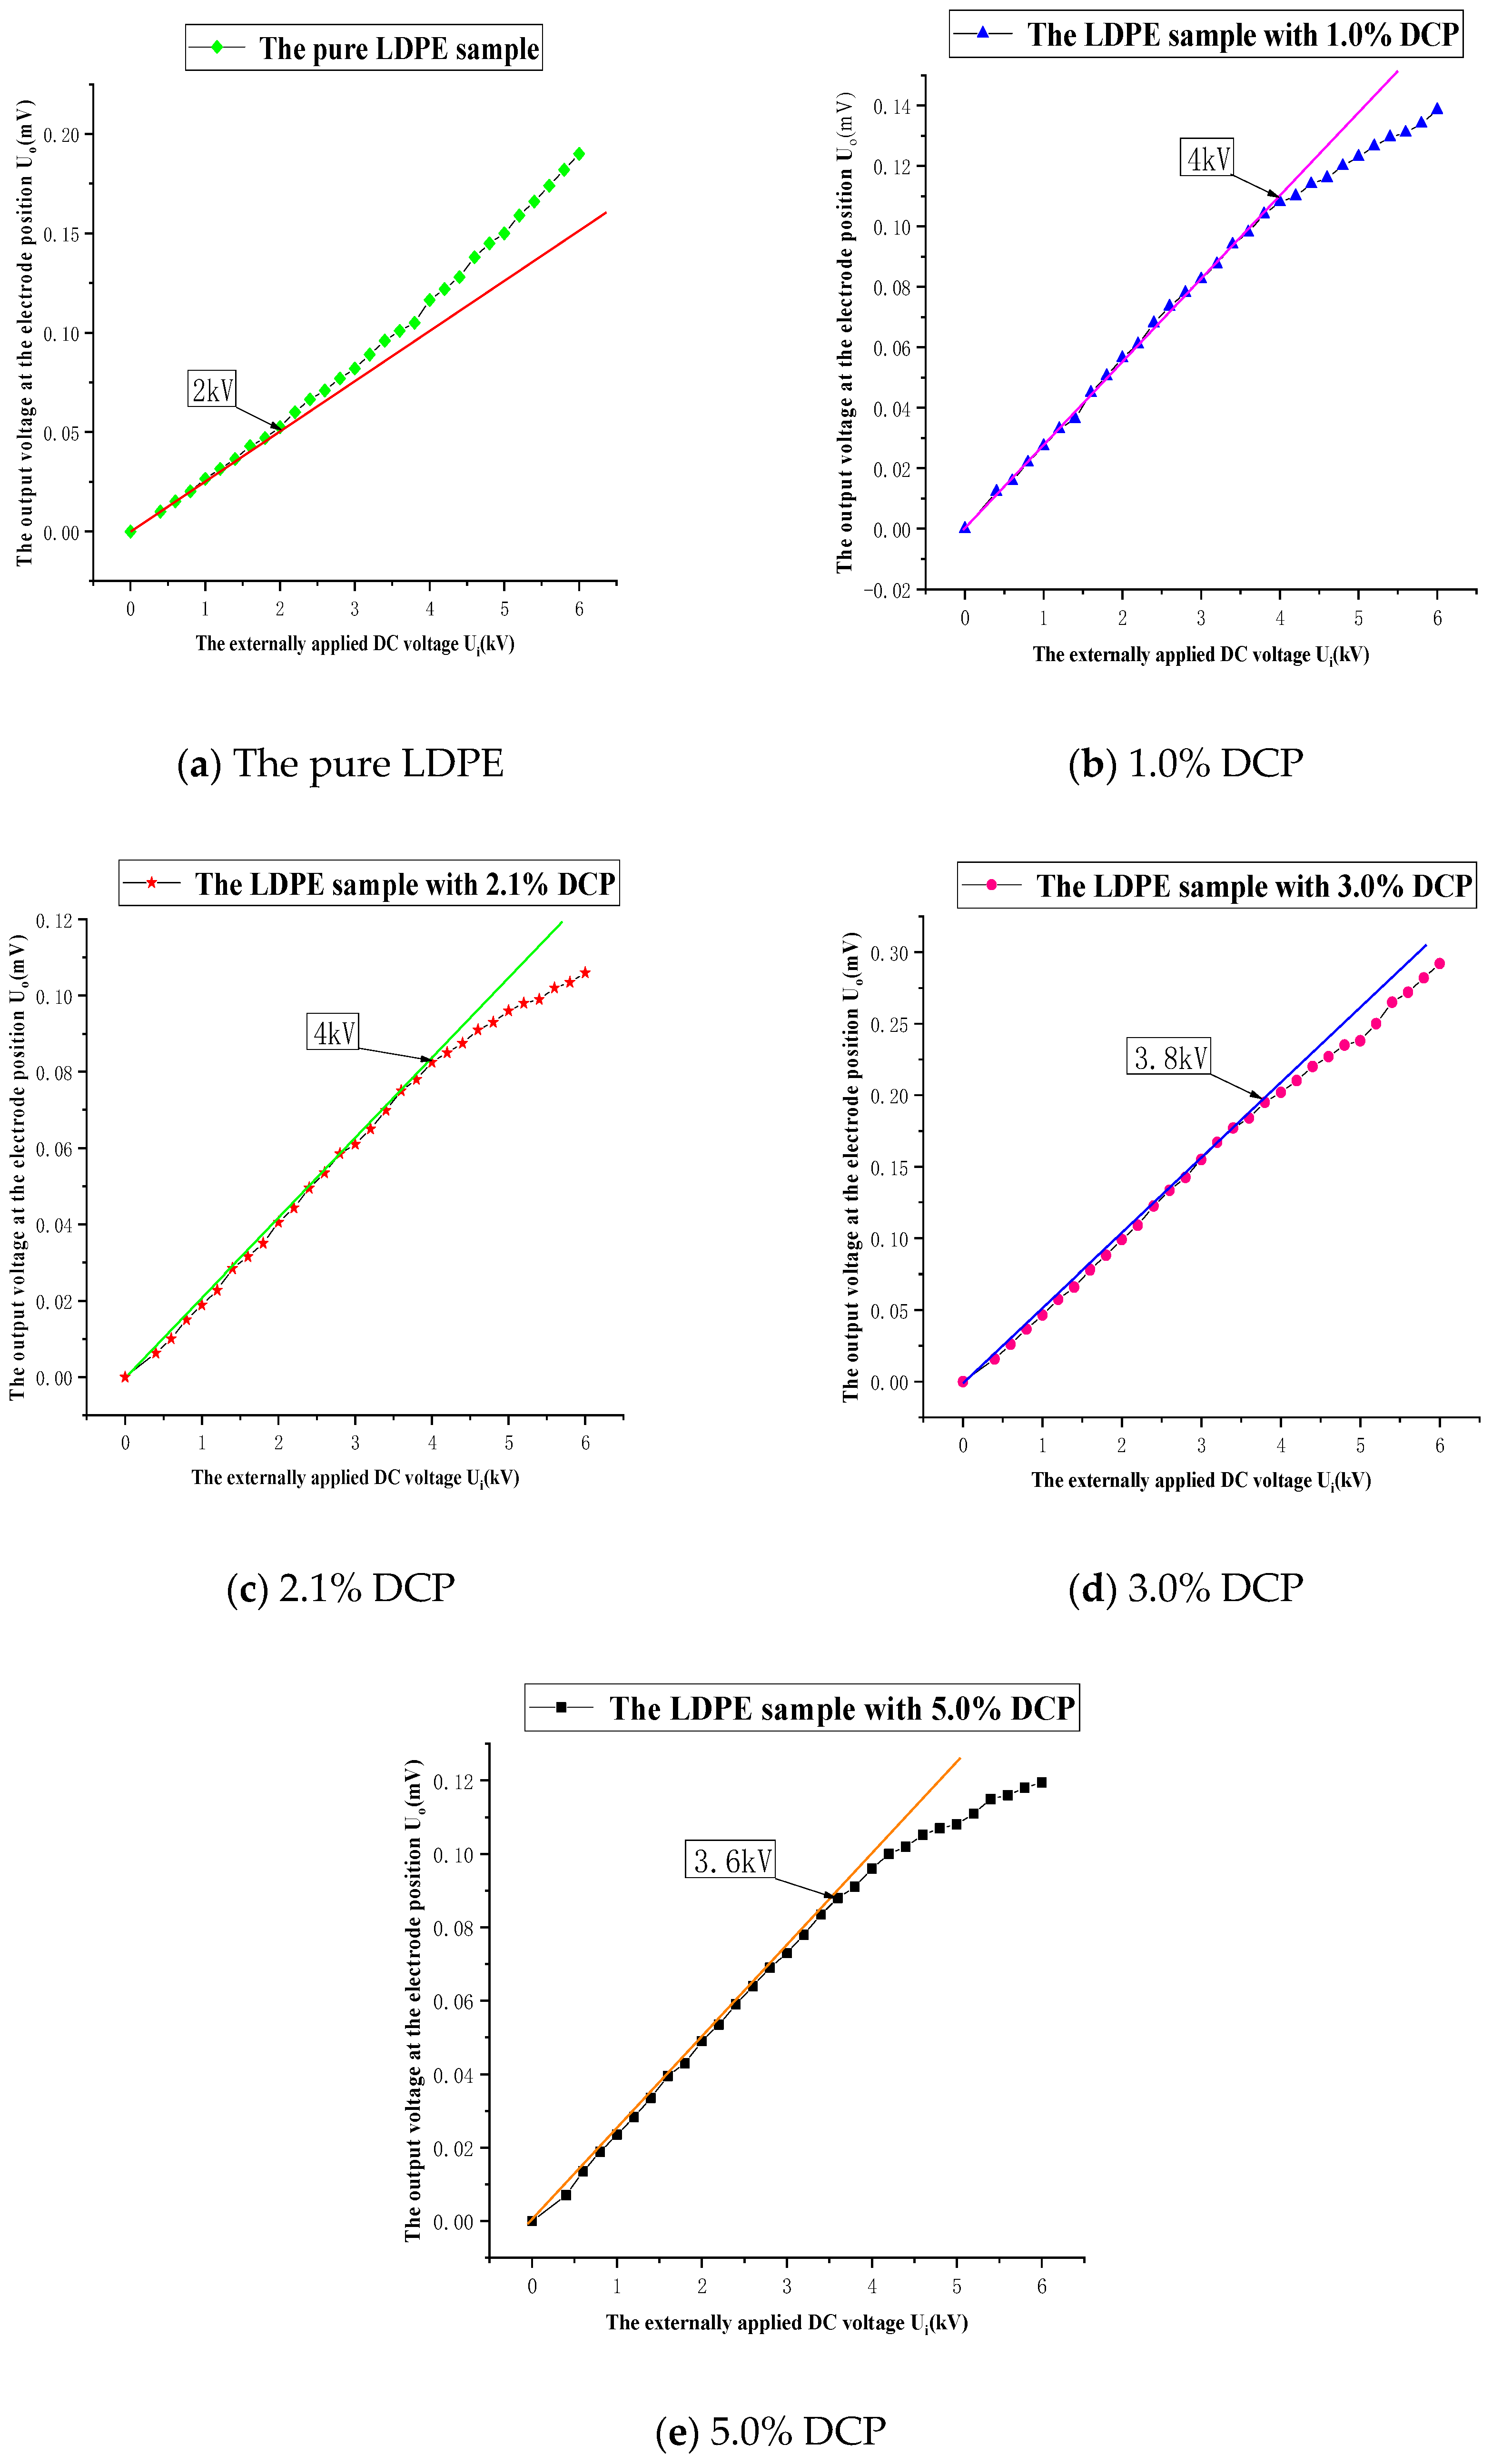
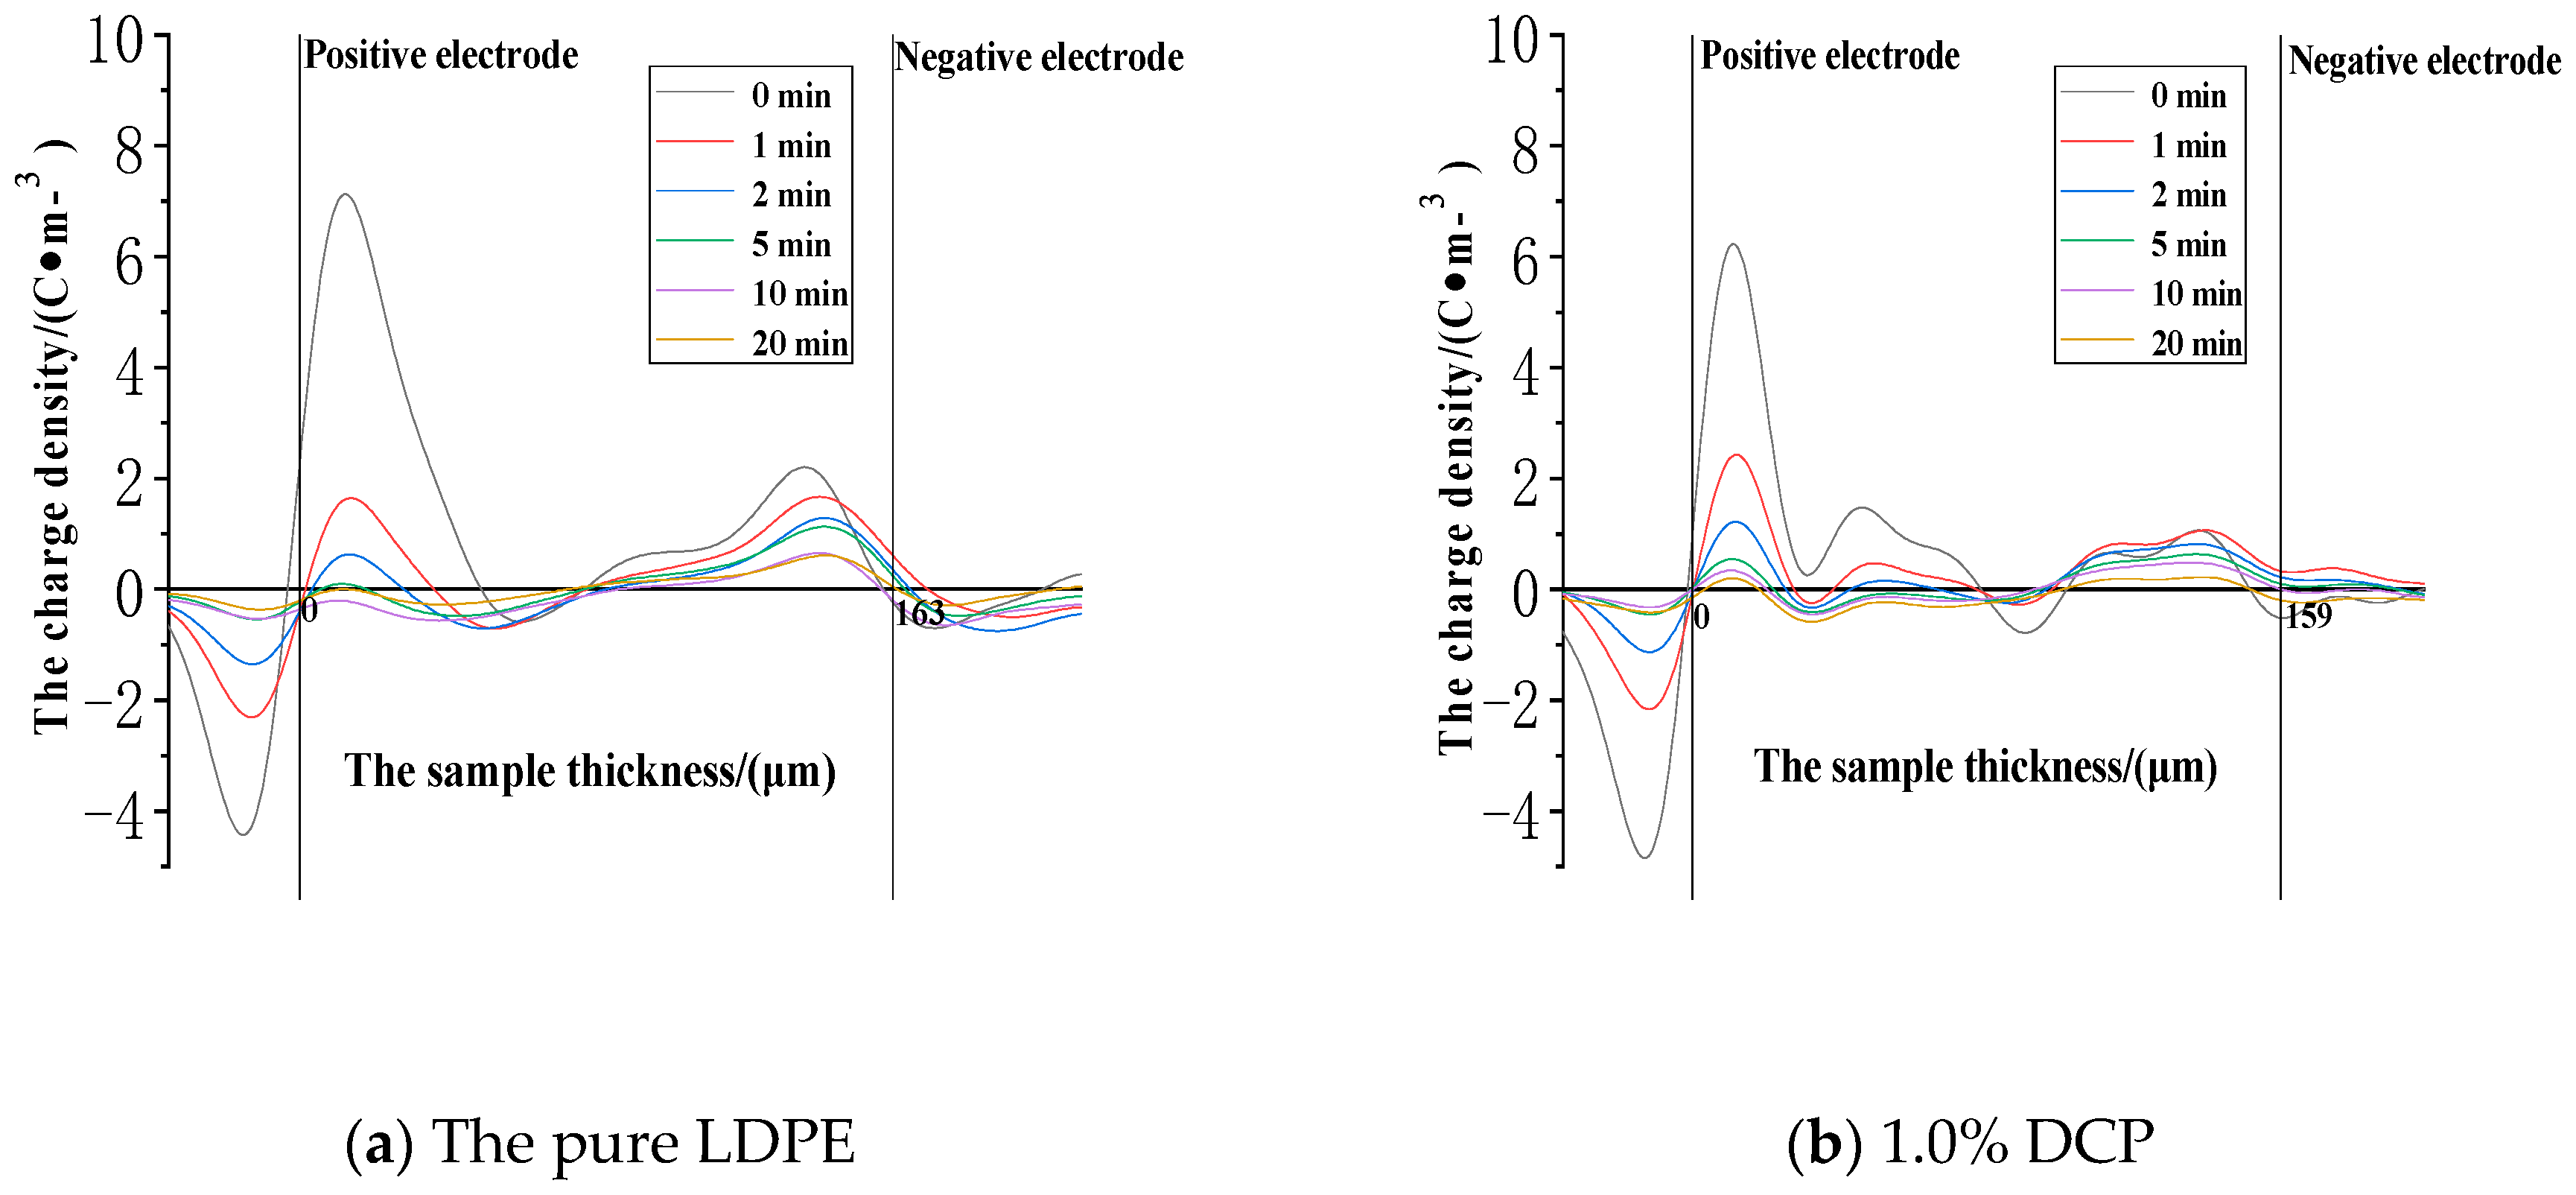
2.3.1. The Threshold Field Strength of the Charge Injection
2.3.2. The Impact of Cross-Linking Effect on Charge Injection and Accumulation Characteristics of XLPE
2.3.3. The Impact of Cross-Linking Effect on the Charge Dissipation Characteristics of XLPE
2.3.4. The Impact of Cross-Linking Effect on the Average Charge Density of XLPE
3. Results and Discussion
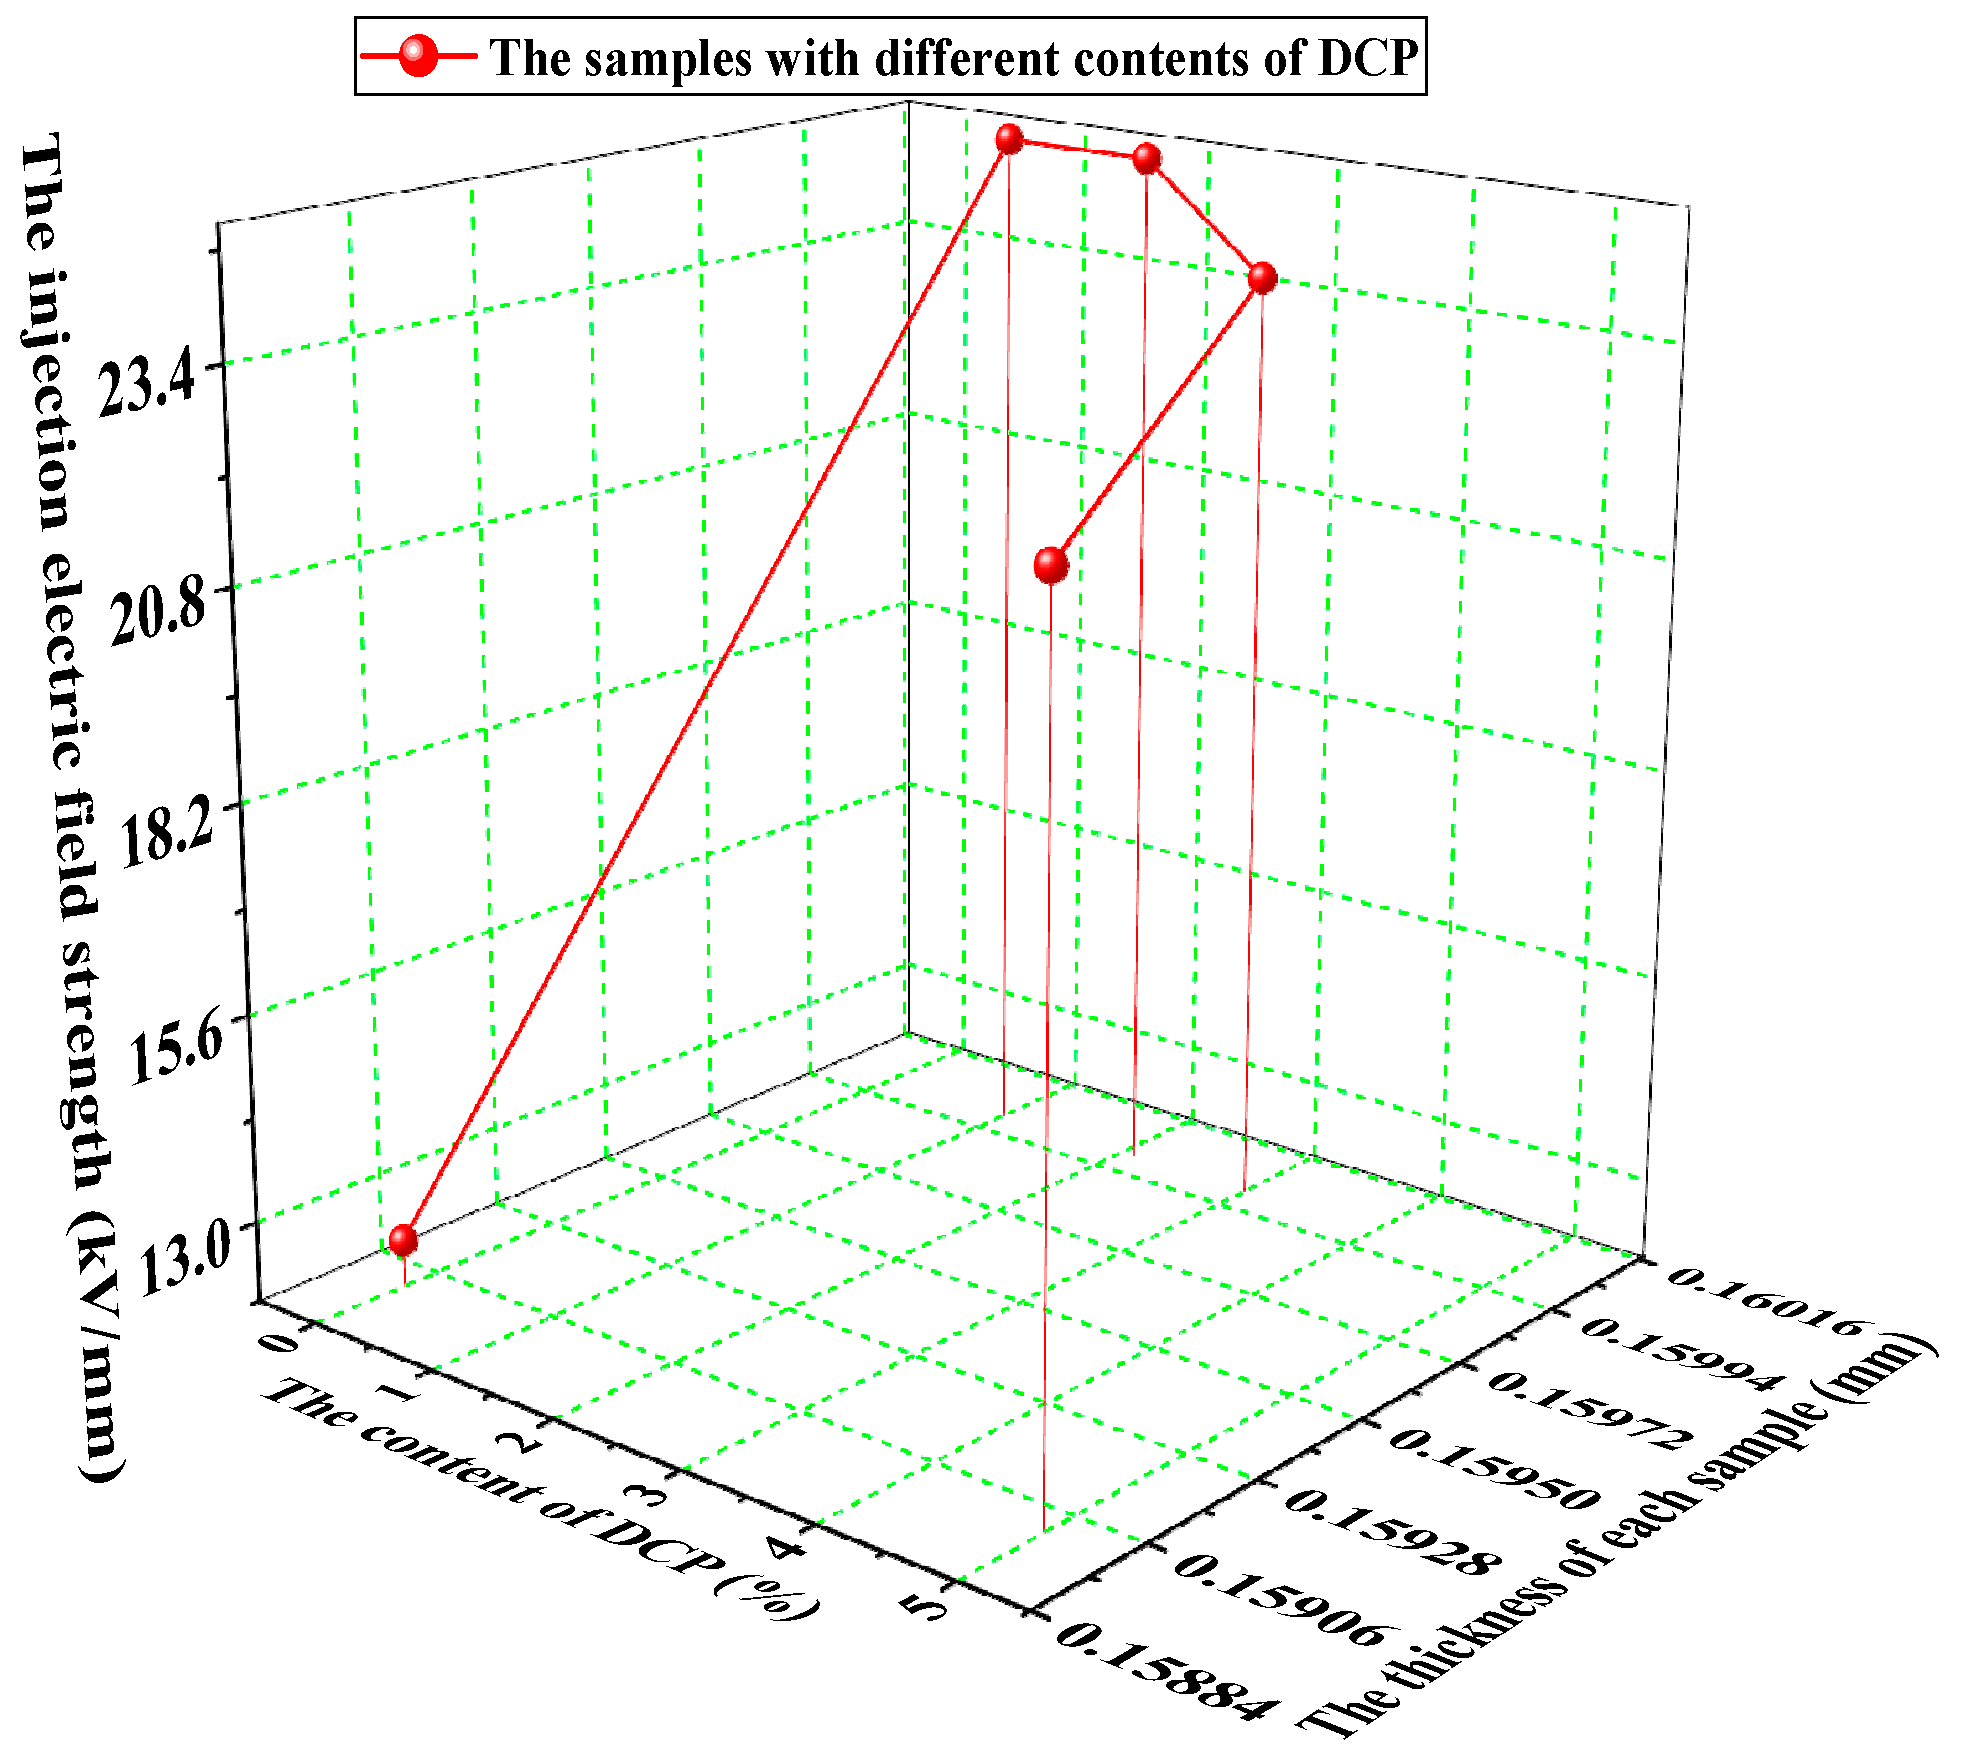
3.1. The Threshold Field Strength of the Charge Injection
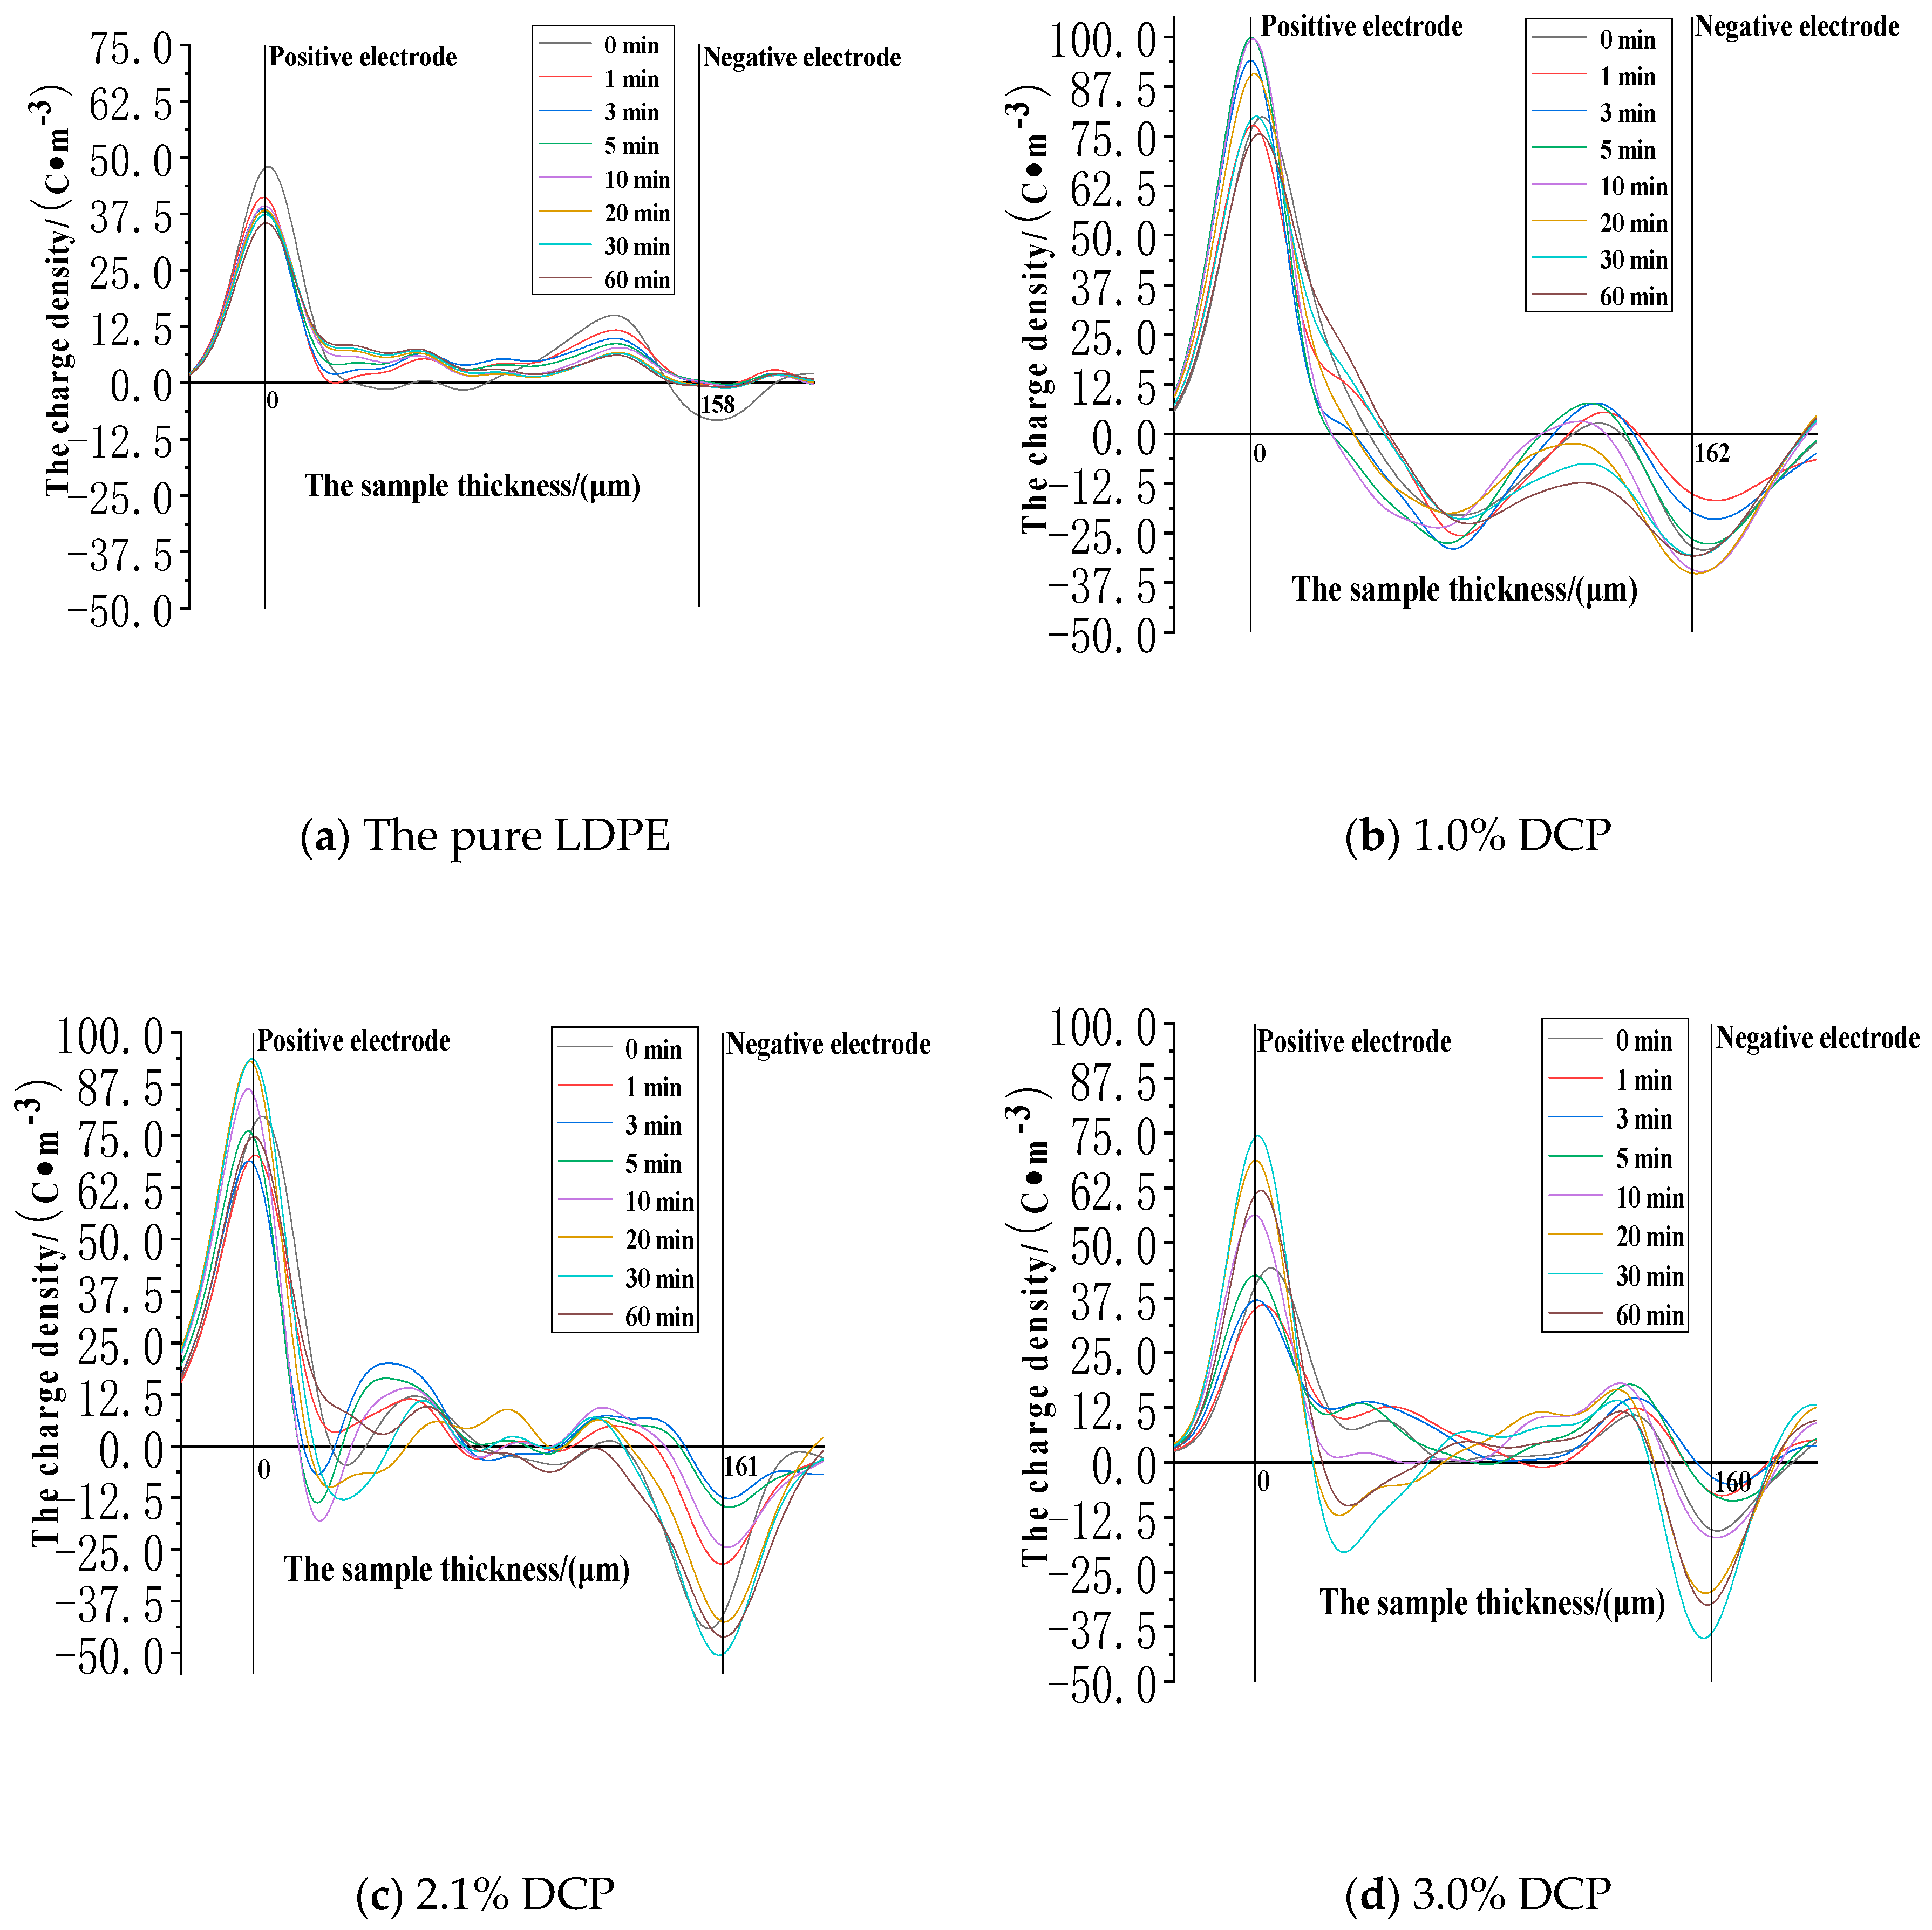
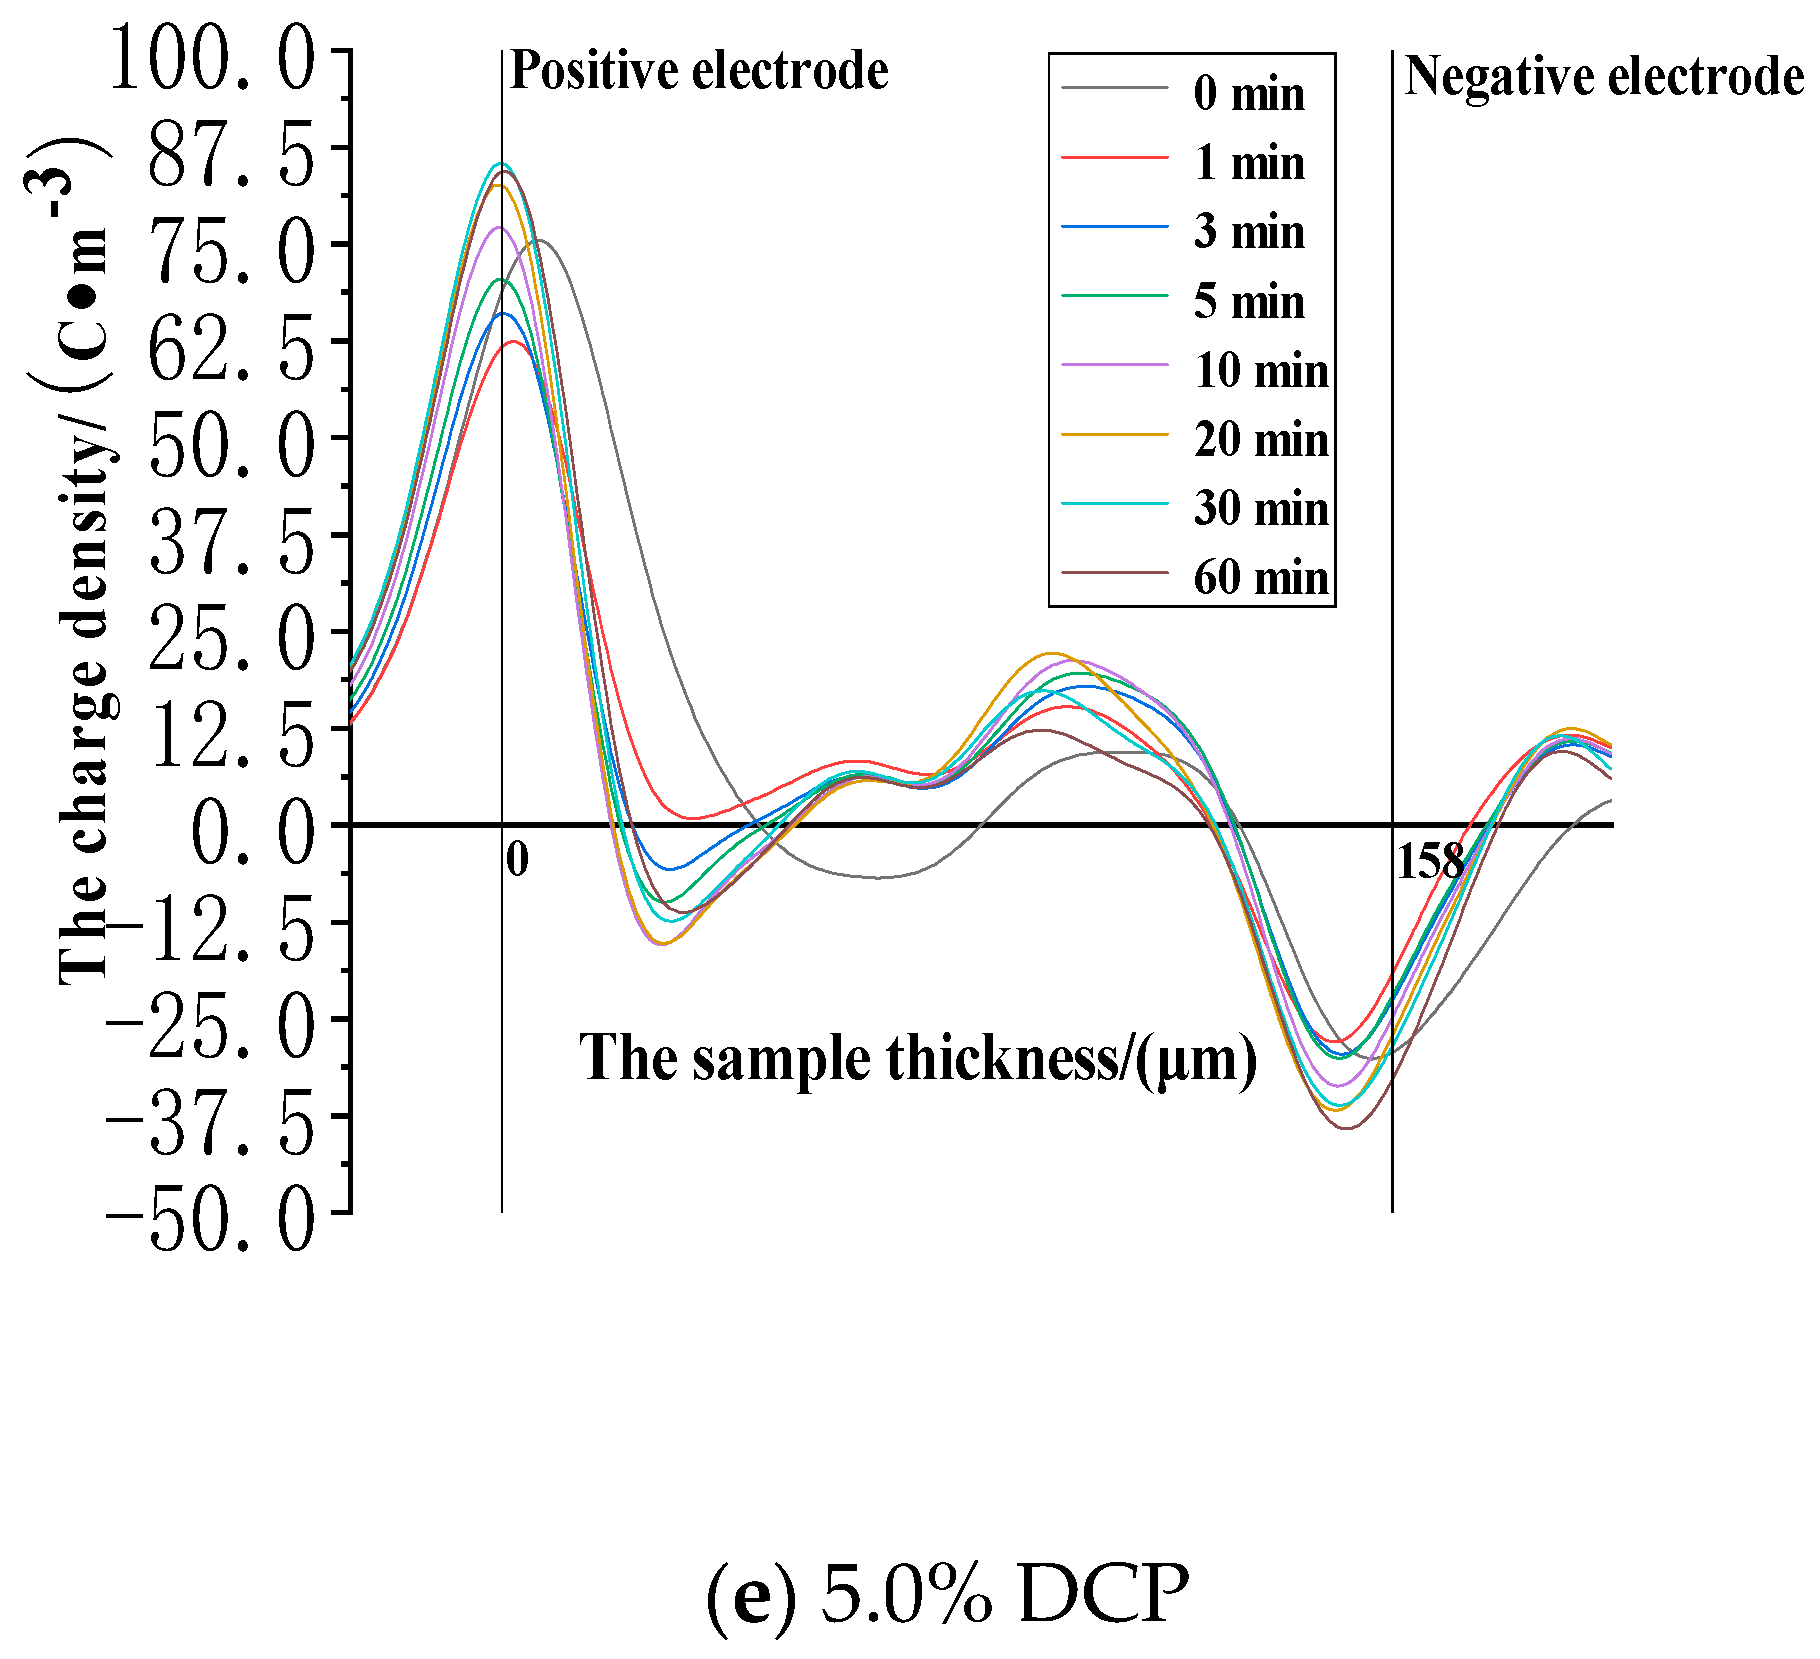
3.2. The Impact of the Cross-Linking Effect on the Charge Injection and Accumulation Characteristics of XLPE
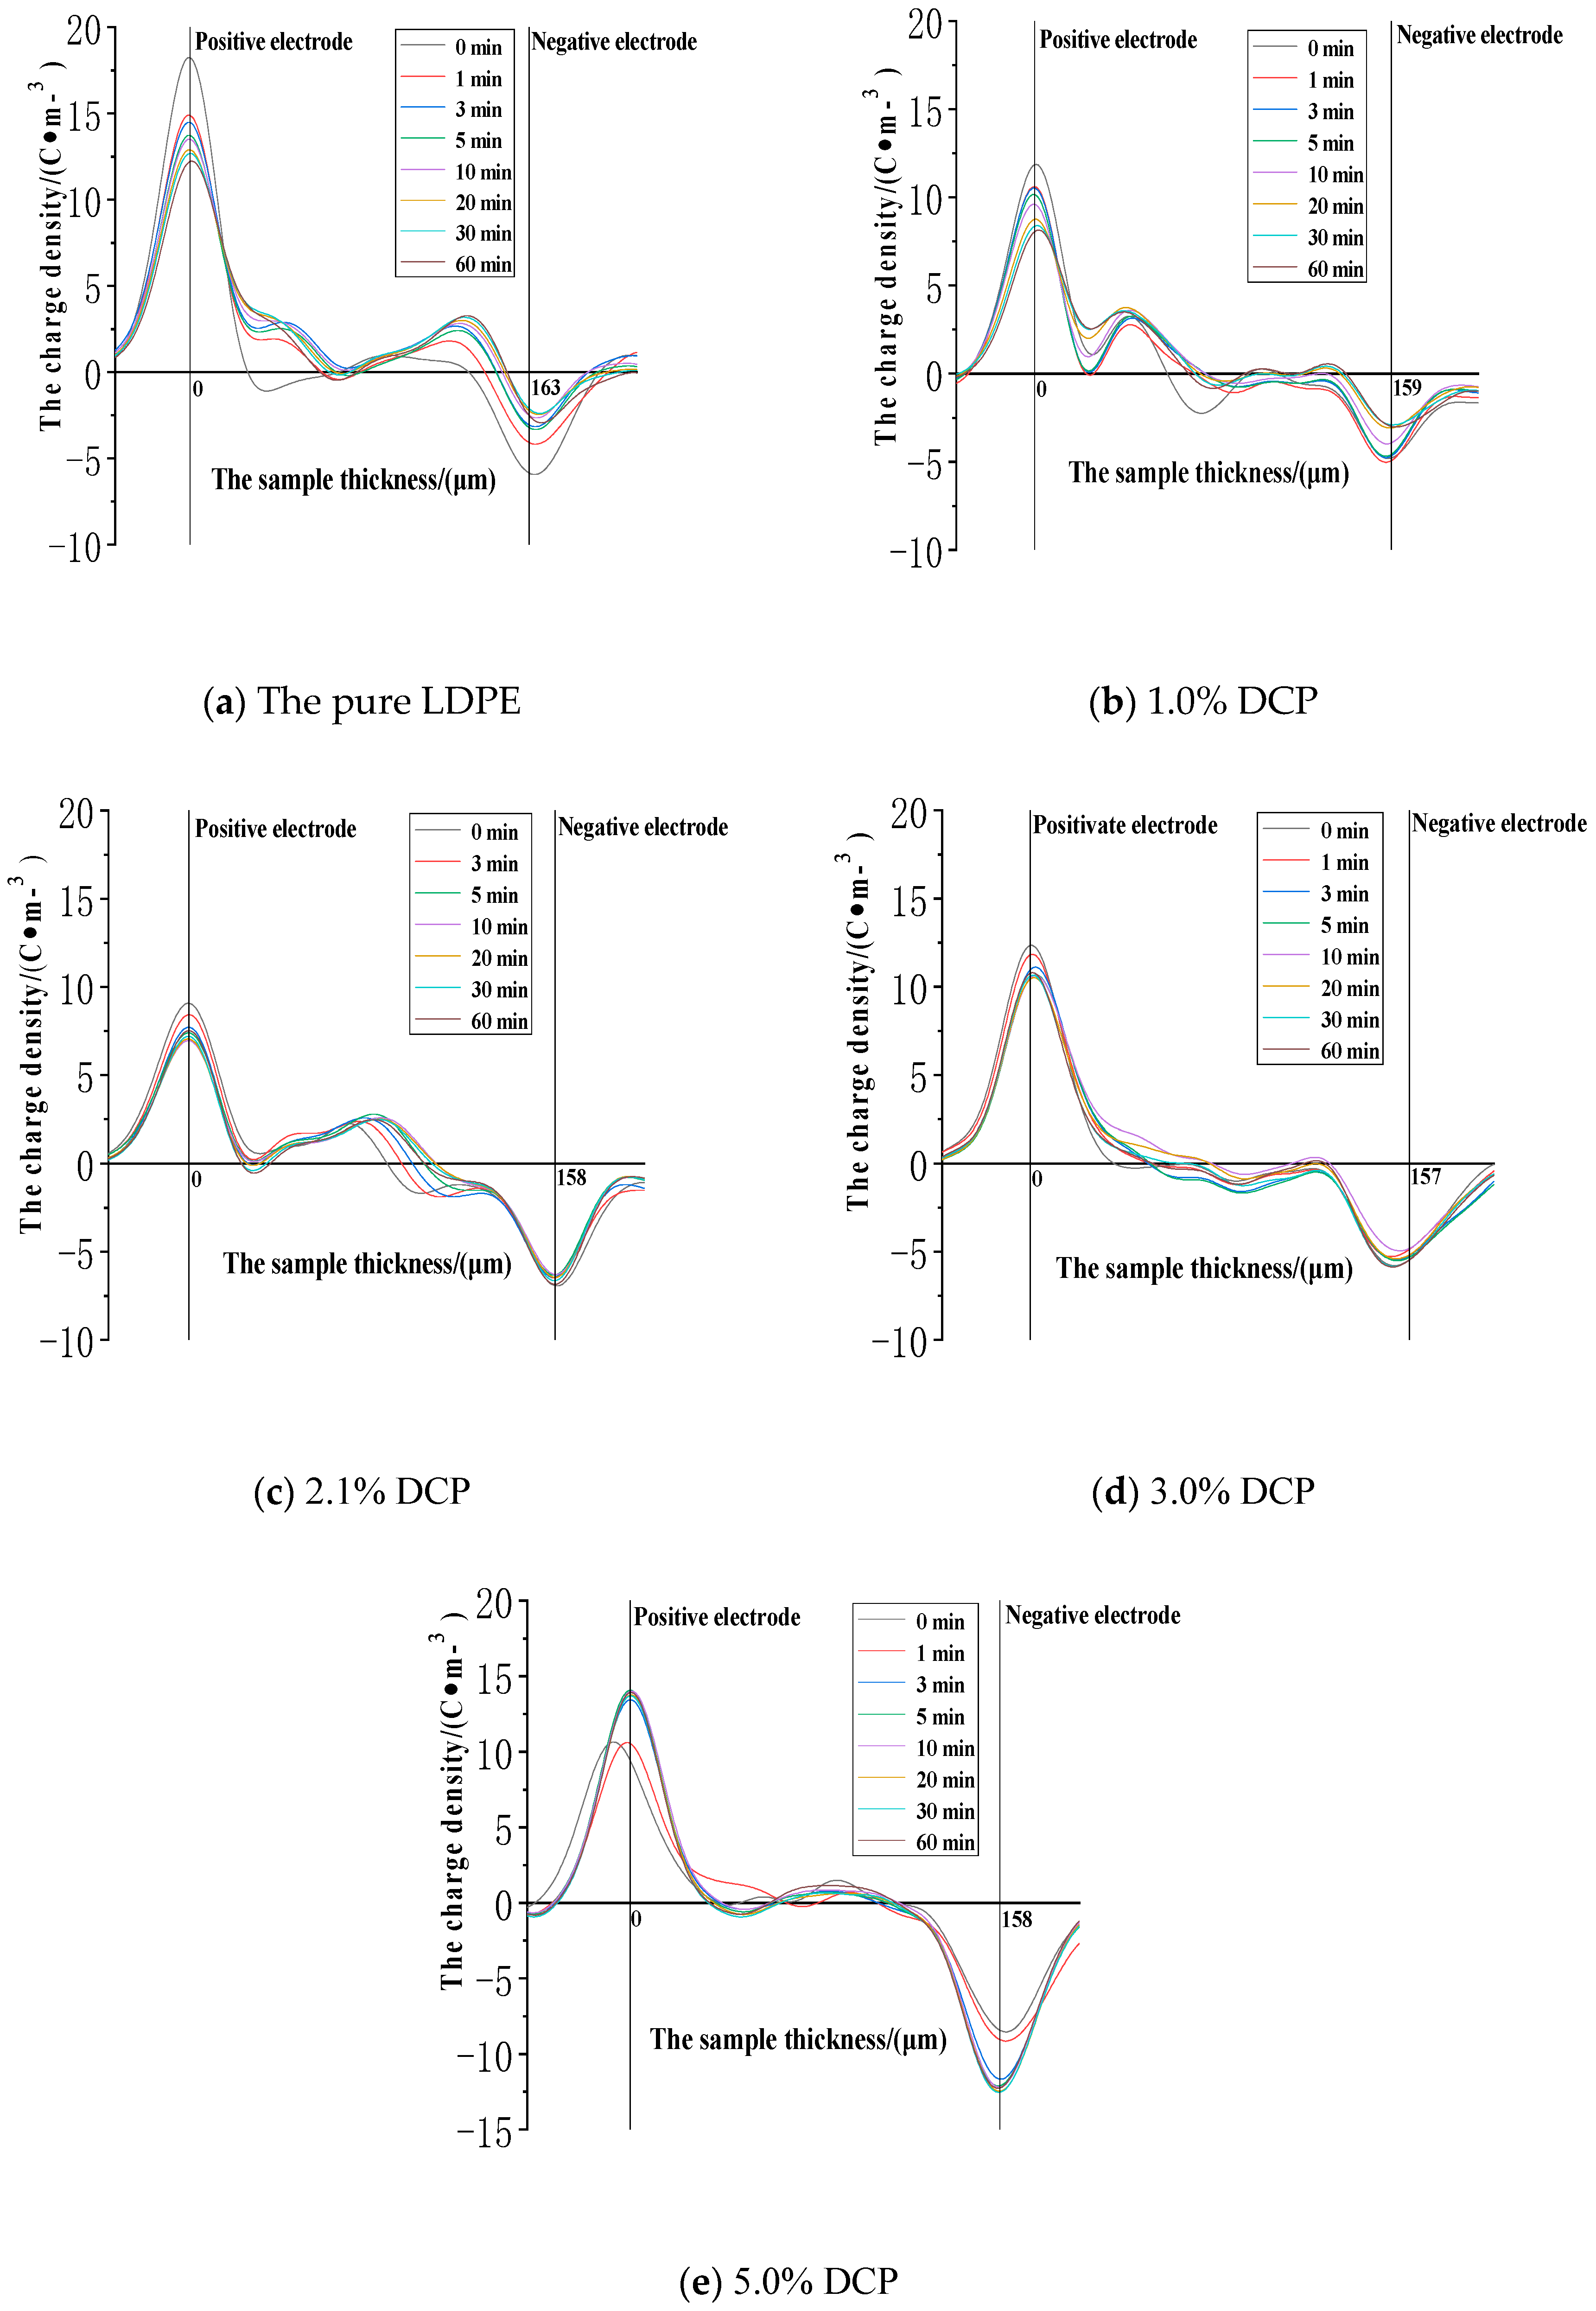
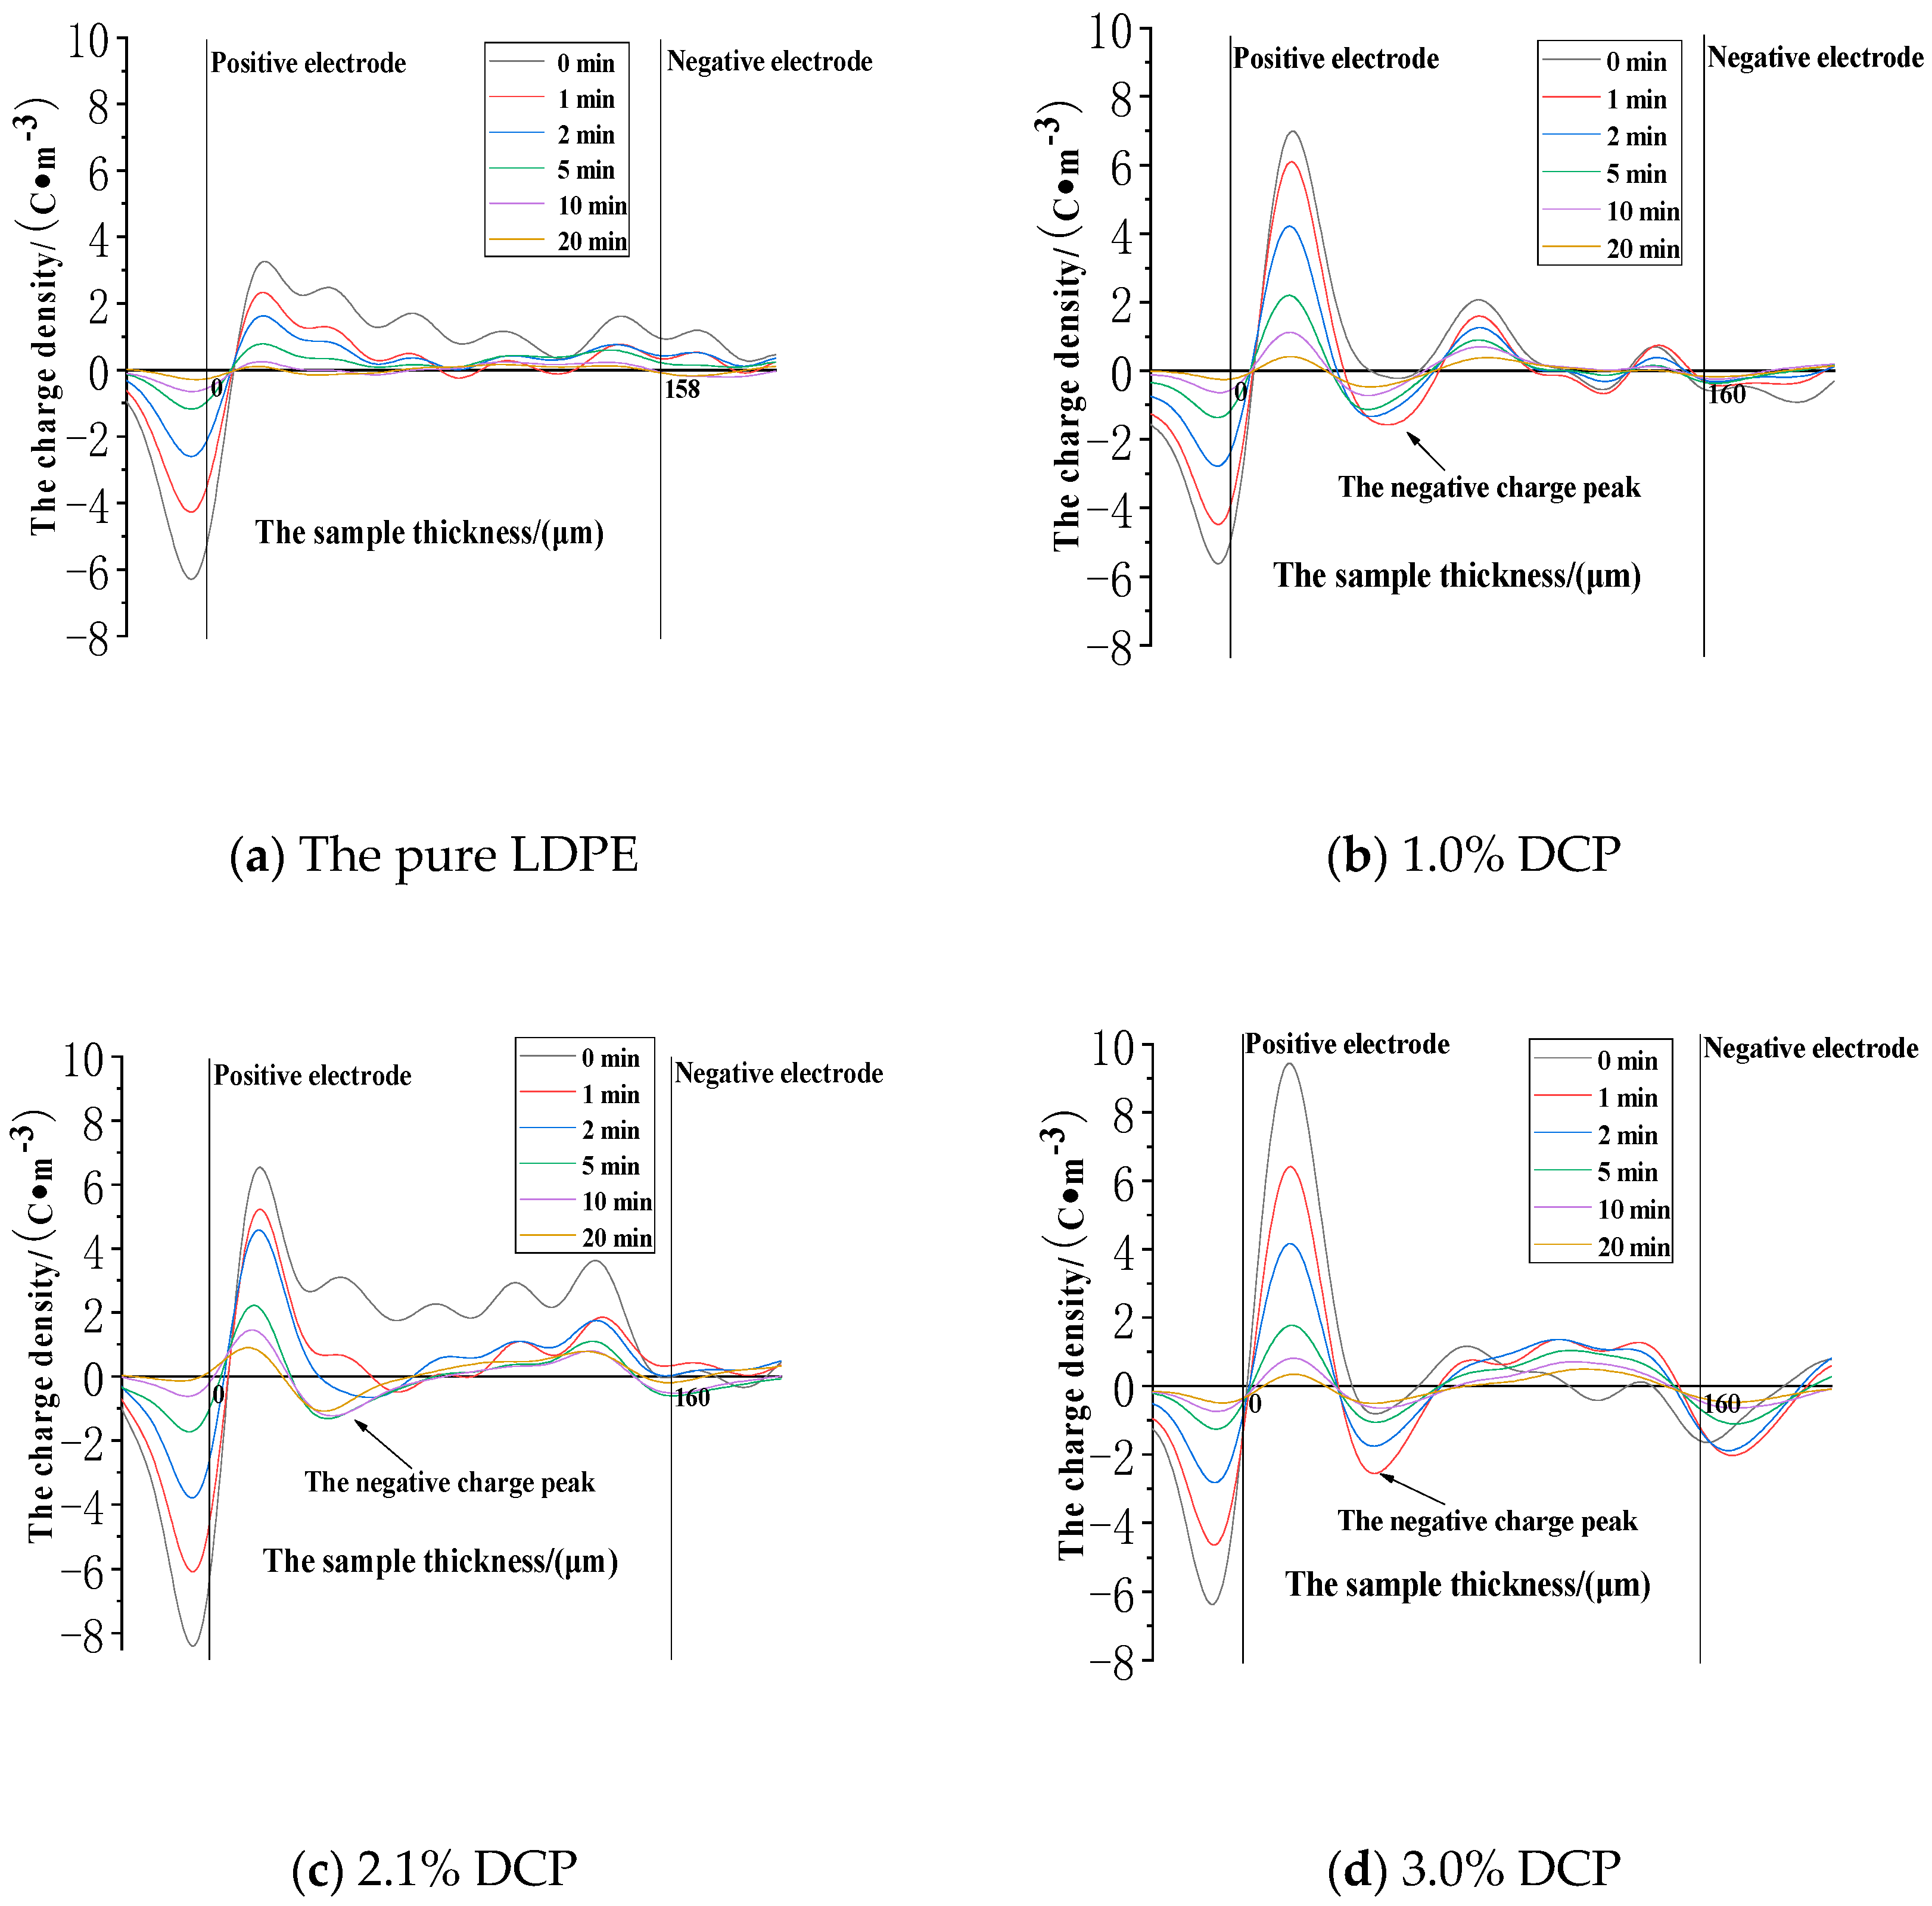
3.2.1. The Space Charge Injection and Accumulation Characteristics at the Electric Field Strength of 30kV/mm
3.2.2. The Space Charge Injection and Accumulation Characteristics at the Electric Field Strength of 50 kV/mm
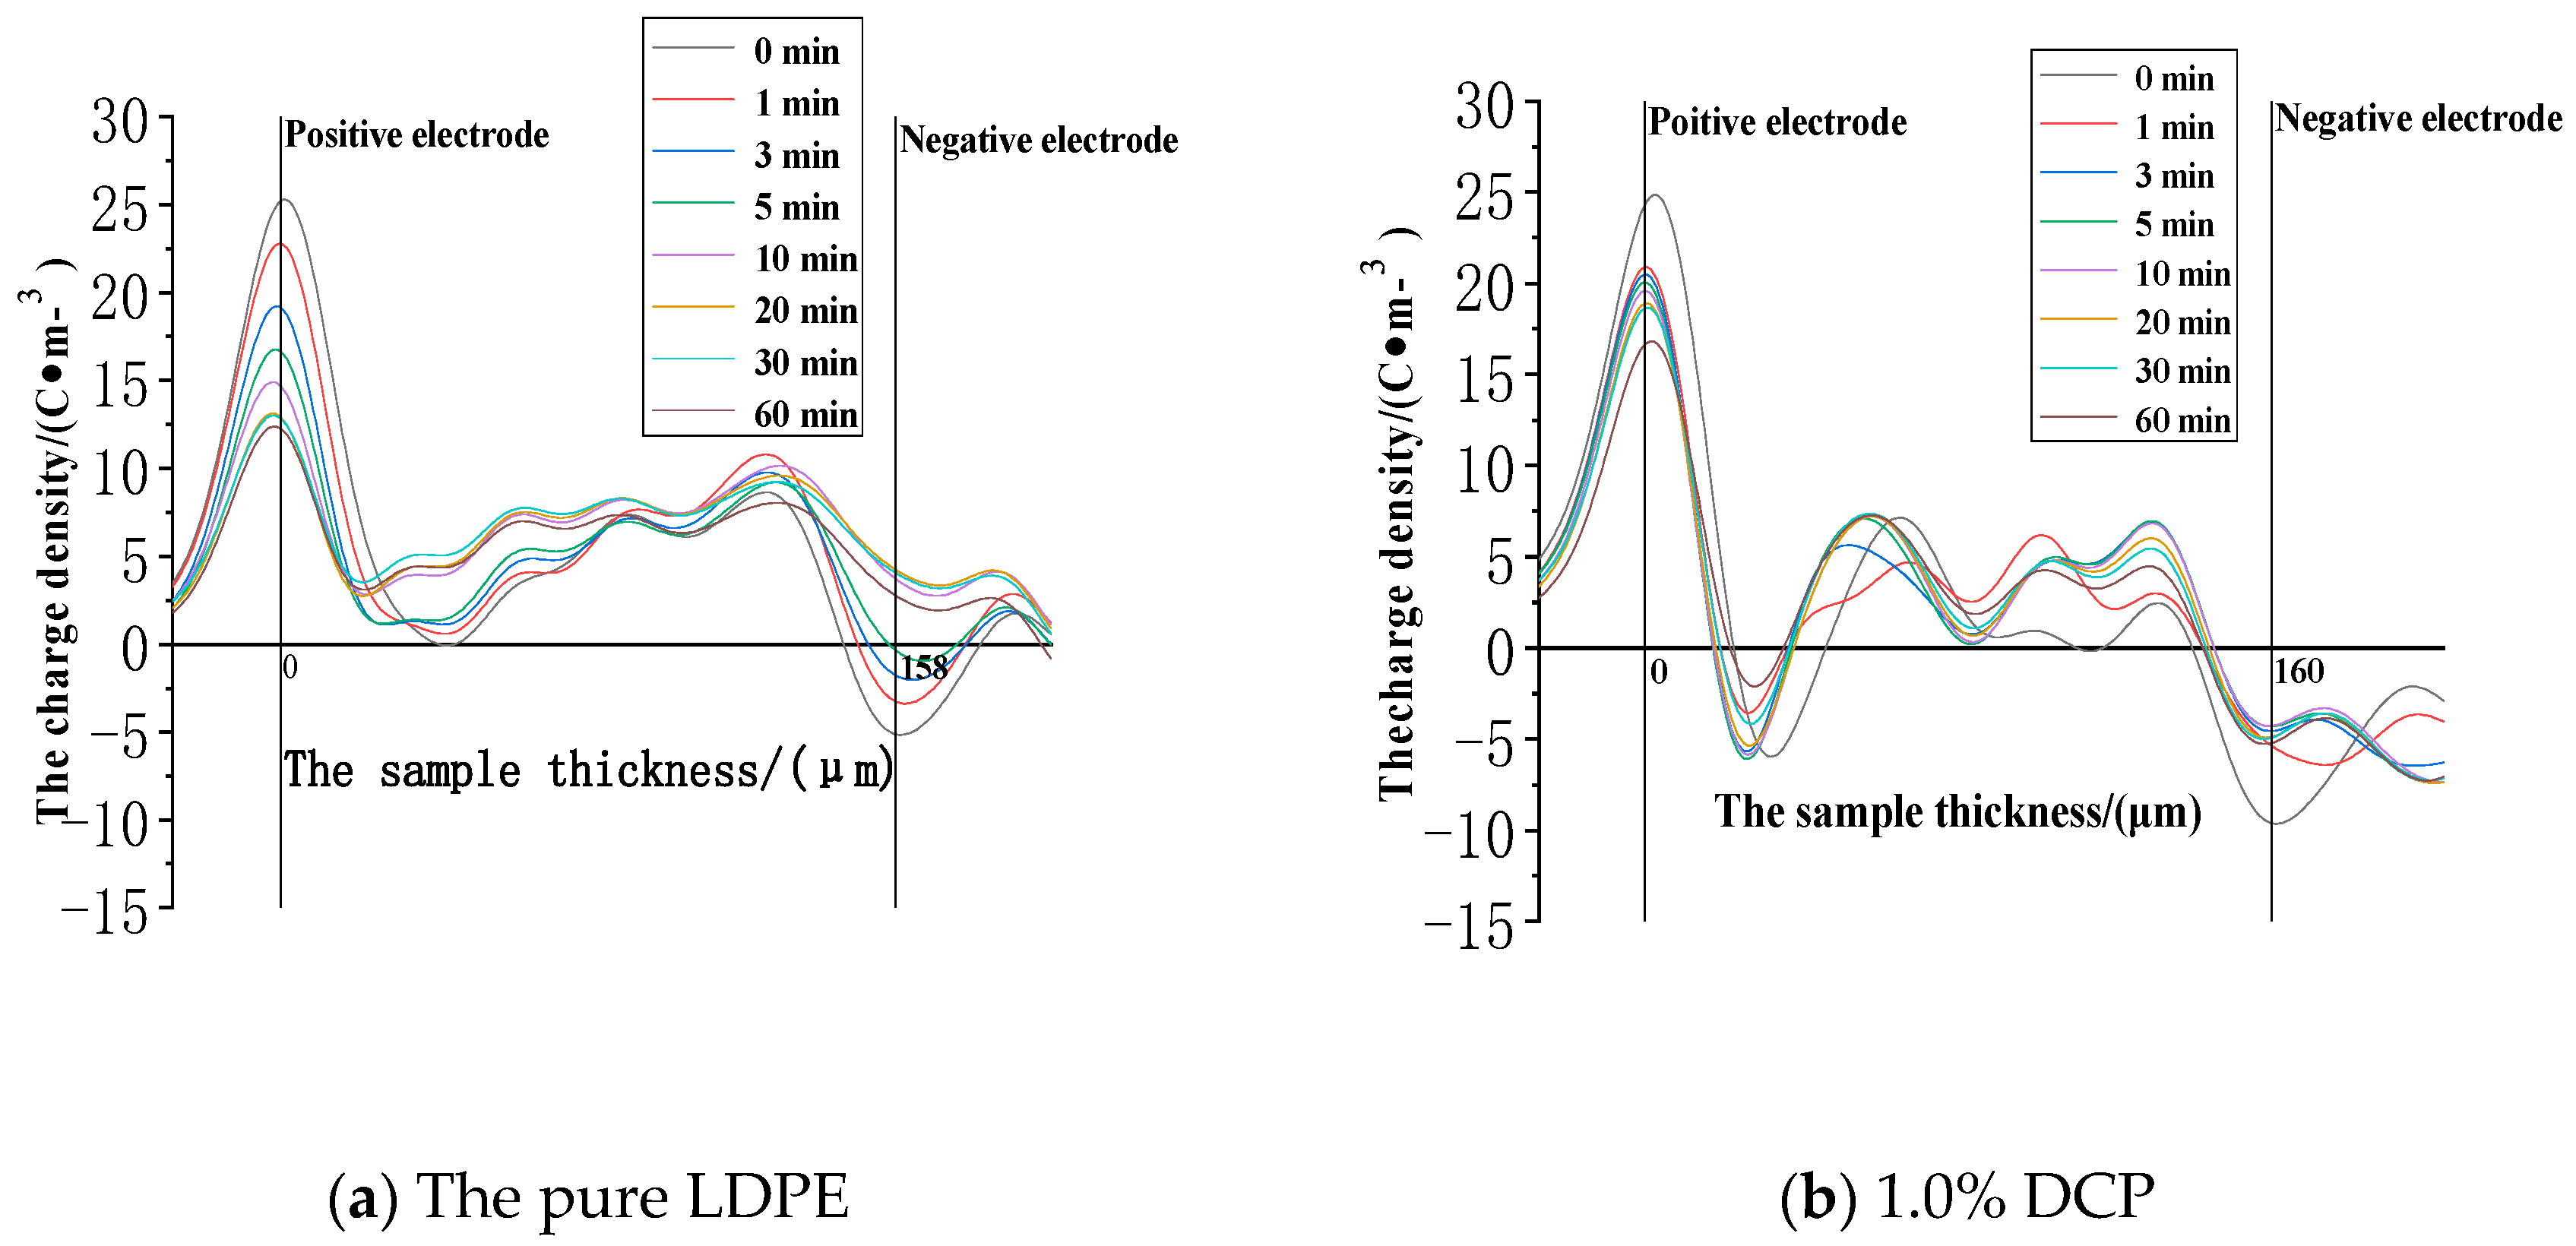
3.2.3. The Space Charge Injection and Accumulation Characteristics at the Electric Field Strength of 80 kV/mm
- (1)
- The cross-linking effect introduces the negative charge traps into LDPE.
- (2)
- When the electric field strength is low, it is easier for the charges to inject and accumulate in the pure LDPE; this process is difficult at first, and then becomes easy with the increasing content of the cross-linking agent.
- (3)
- When the electric field strength is high, the charges make it easier for XLPE to be injected and accumulated; this process is easy at first and then becomes difficult with the increasing content of the cross-linking agent.
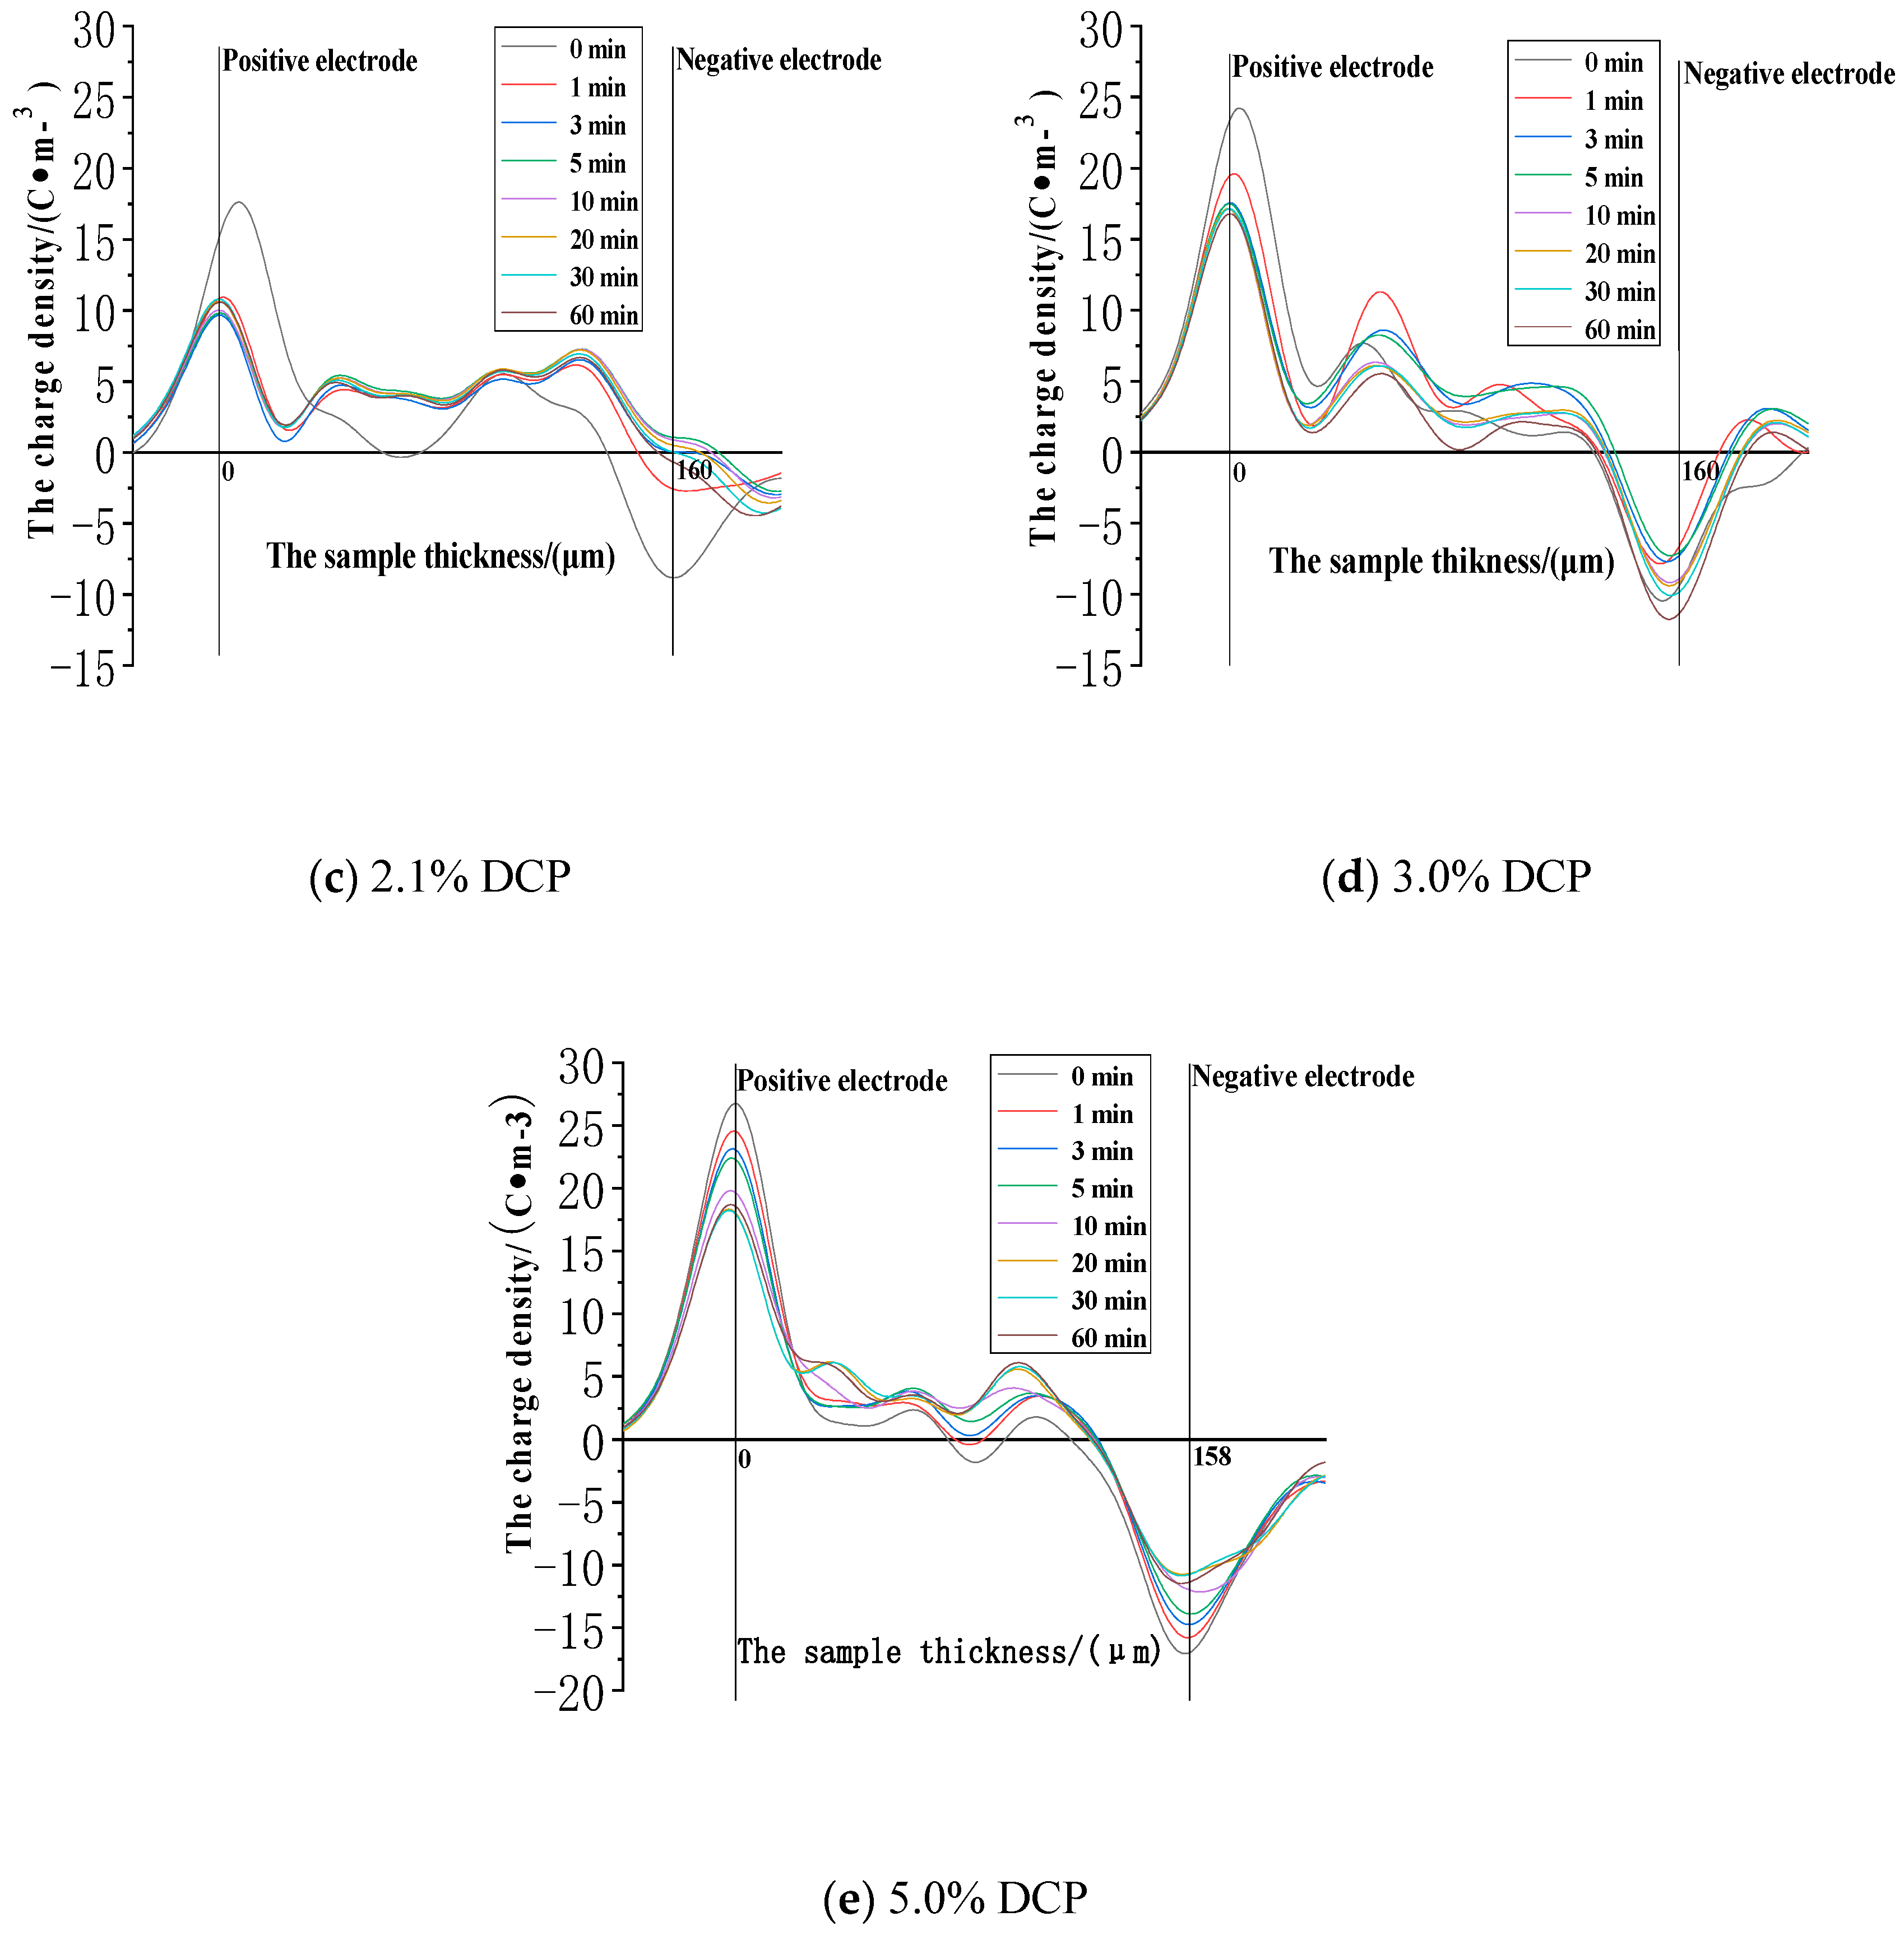
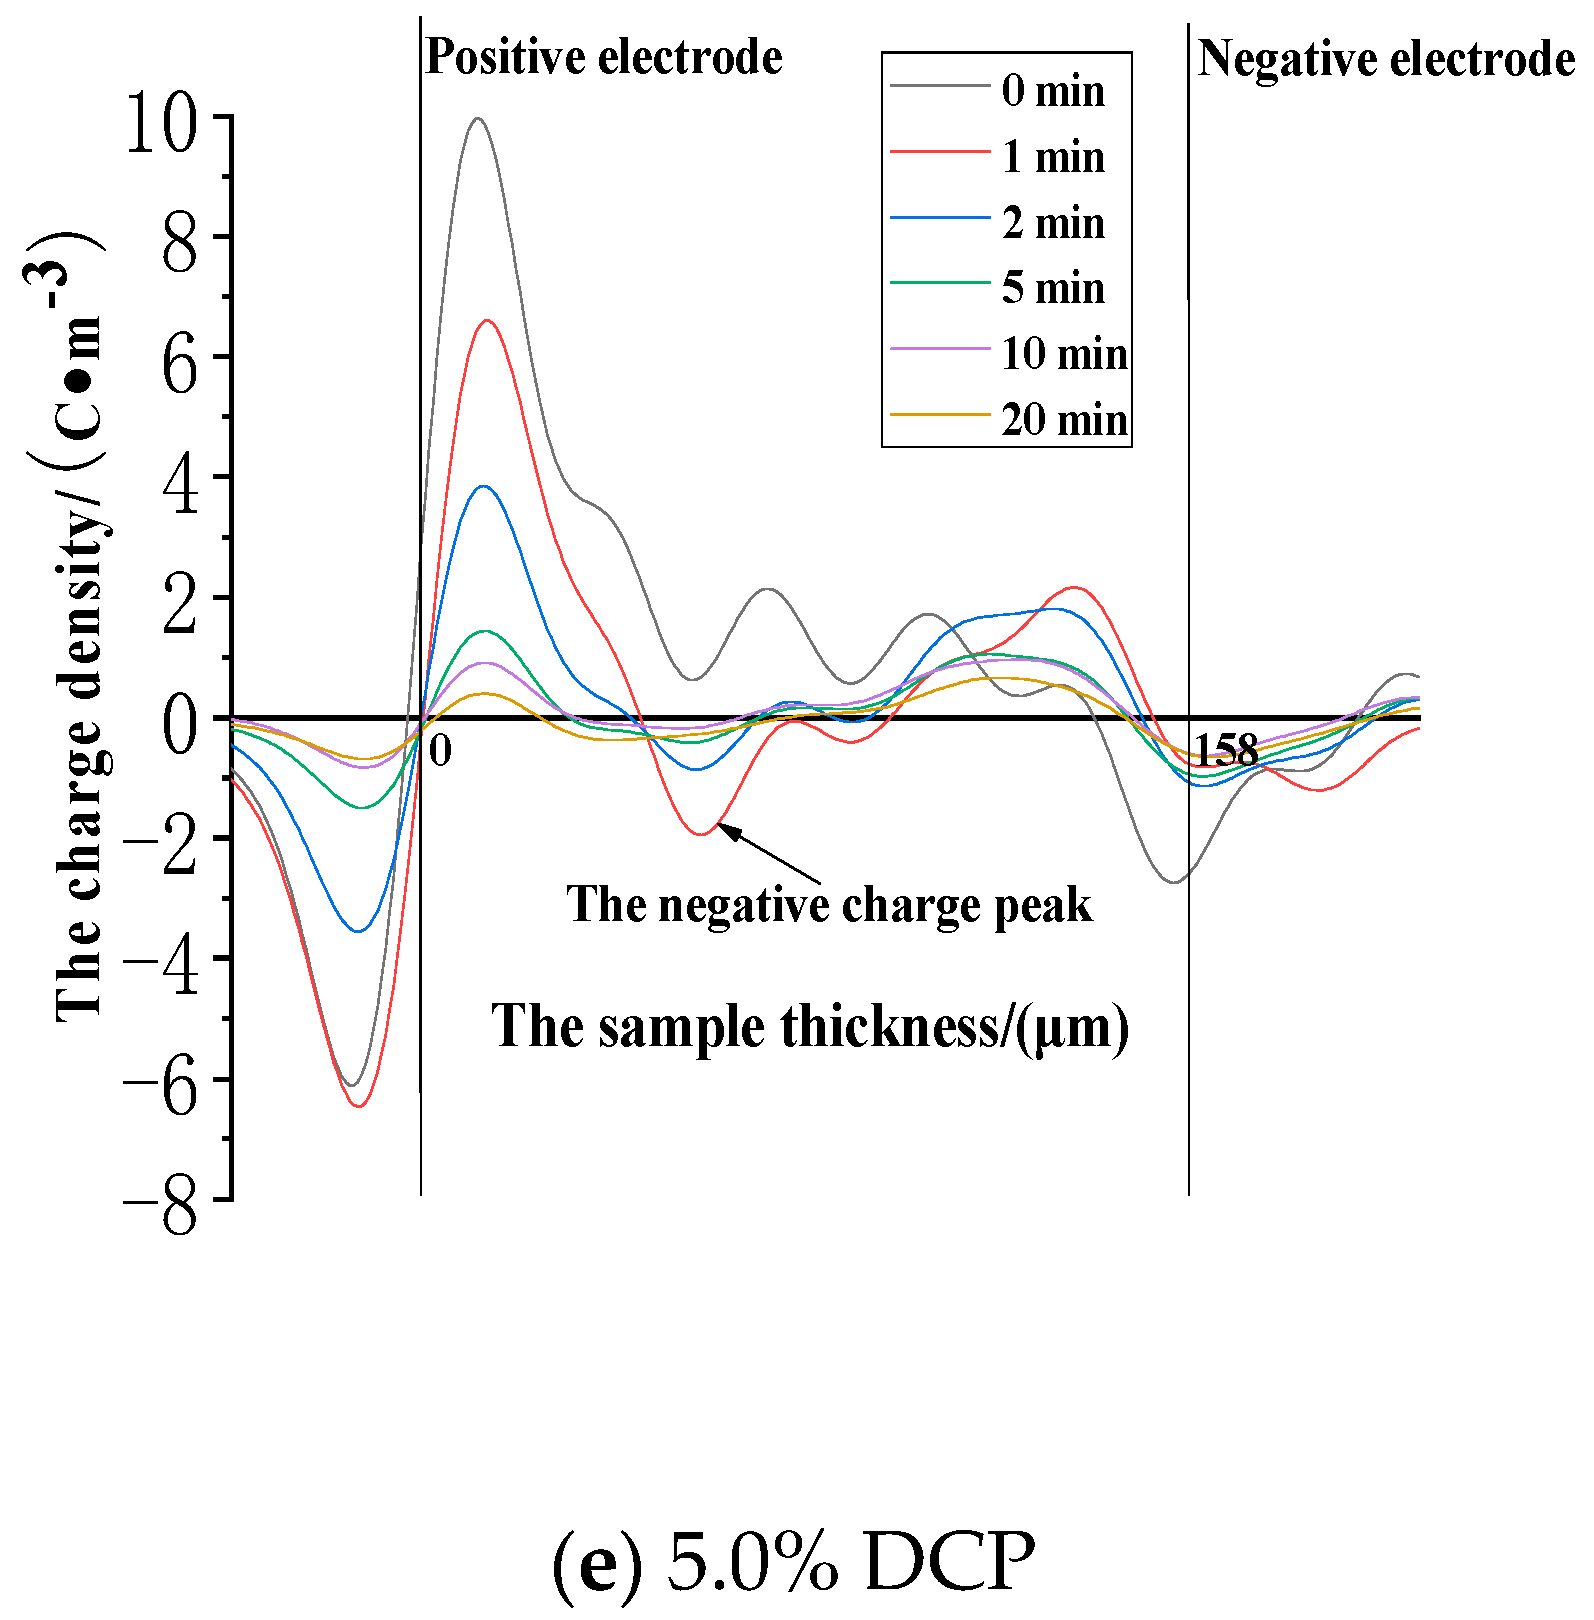
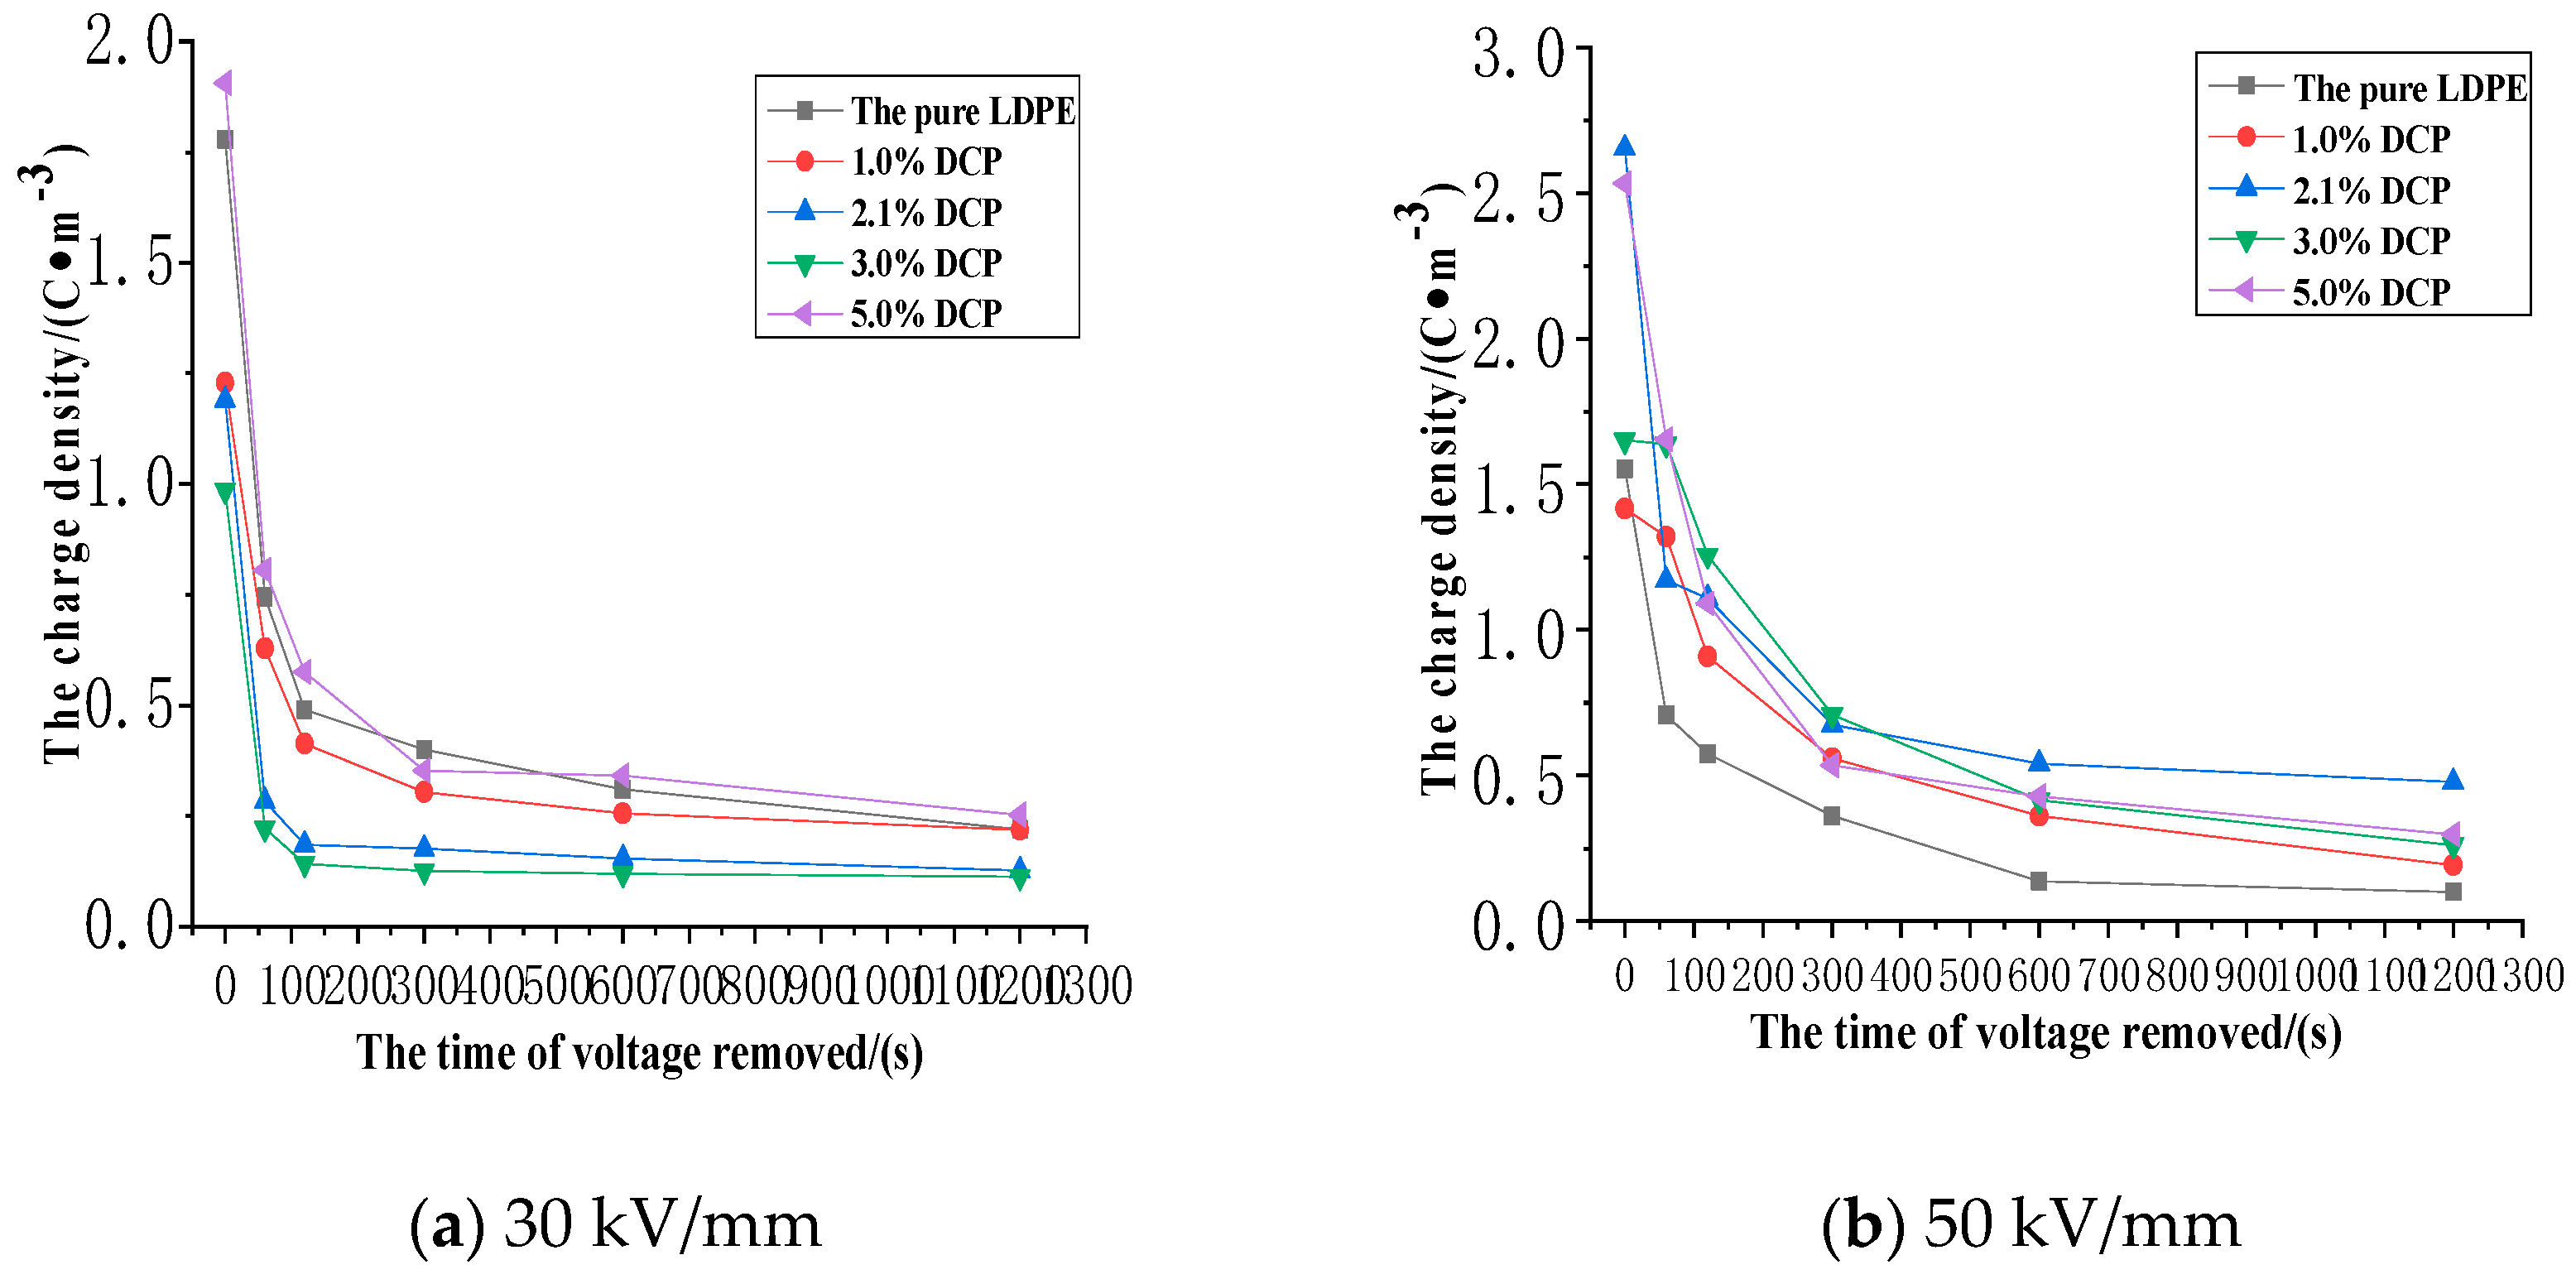
3.3. The Impact of the Cross-Linking Effect on the Charge Dissipation Characteristics of XLPE
3.3.1. The Dissipation Characteristics of Space Charge after the Action of 30 kV/mm
3.3.2. The Dissipation Characteristics of Space Charge after the Electric Field Strength of 50 kV/mm
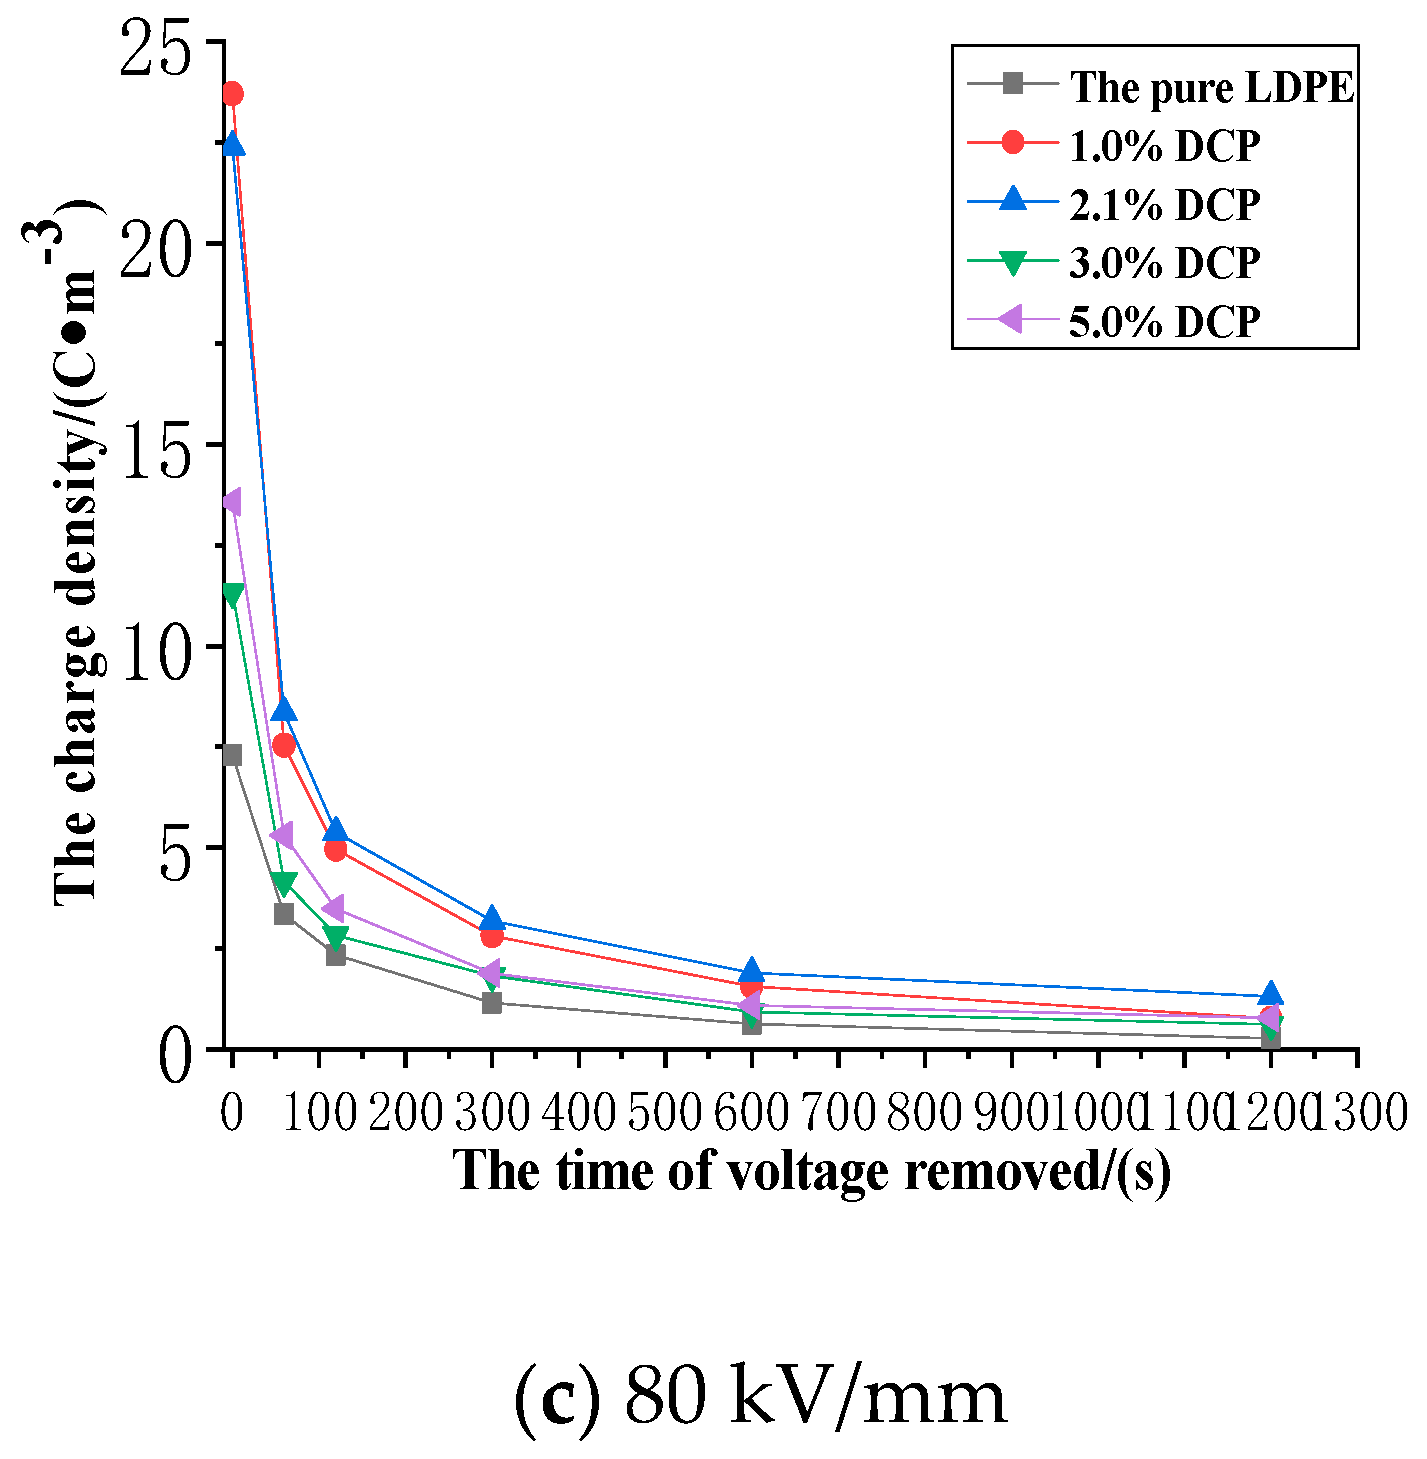
3.3.3. The Dissipation Characteristics of Space Charge after the Action of 80 kV/mm
- (1)
- The cross-linking effect increases the density of the deeper charge traps in LDPE.
- (2)
- When the electric field strength of the applied voltage is low, more space charges can remain in the pure LDPE after the voltage is removed. And a number of residual charges decrease at first and then increase with the increase of the content of the cross-linking agent. At the same time, more space charges can remain in XLPE after the voltage is removed. A number of residual charges increase at first and then decrease with the increase of the content of the cross-linking agent when the electric field strength of the applied voltage is high.
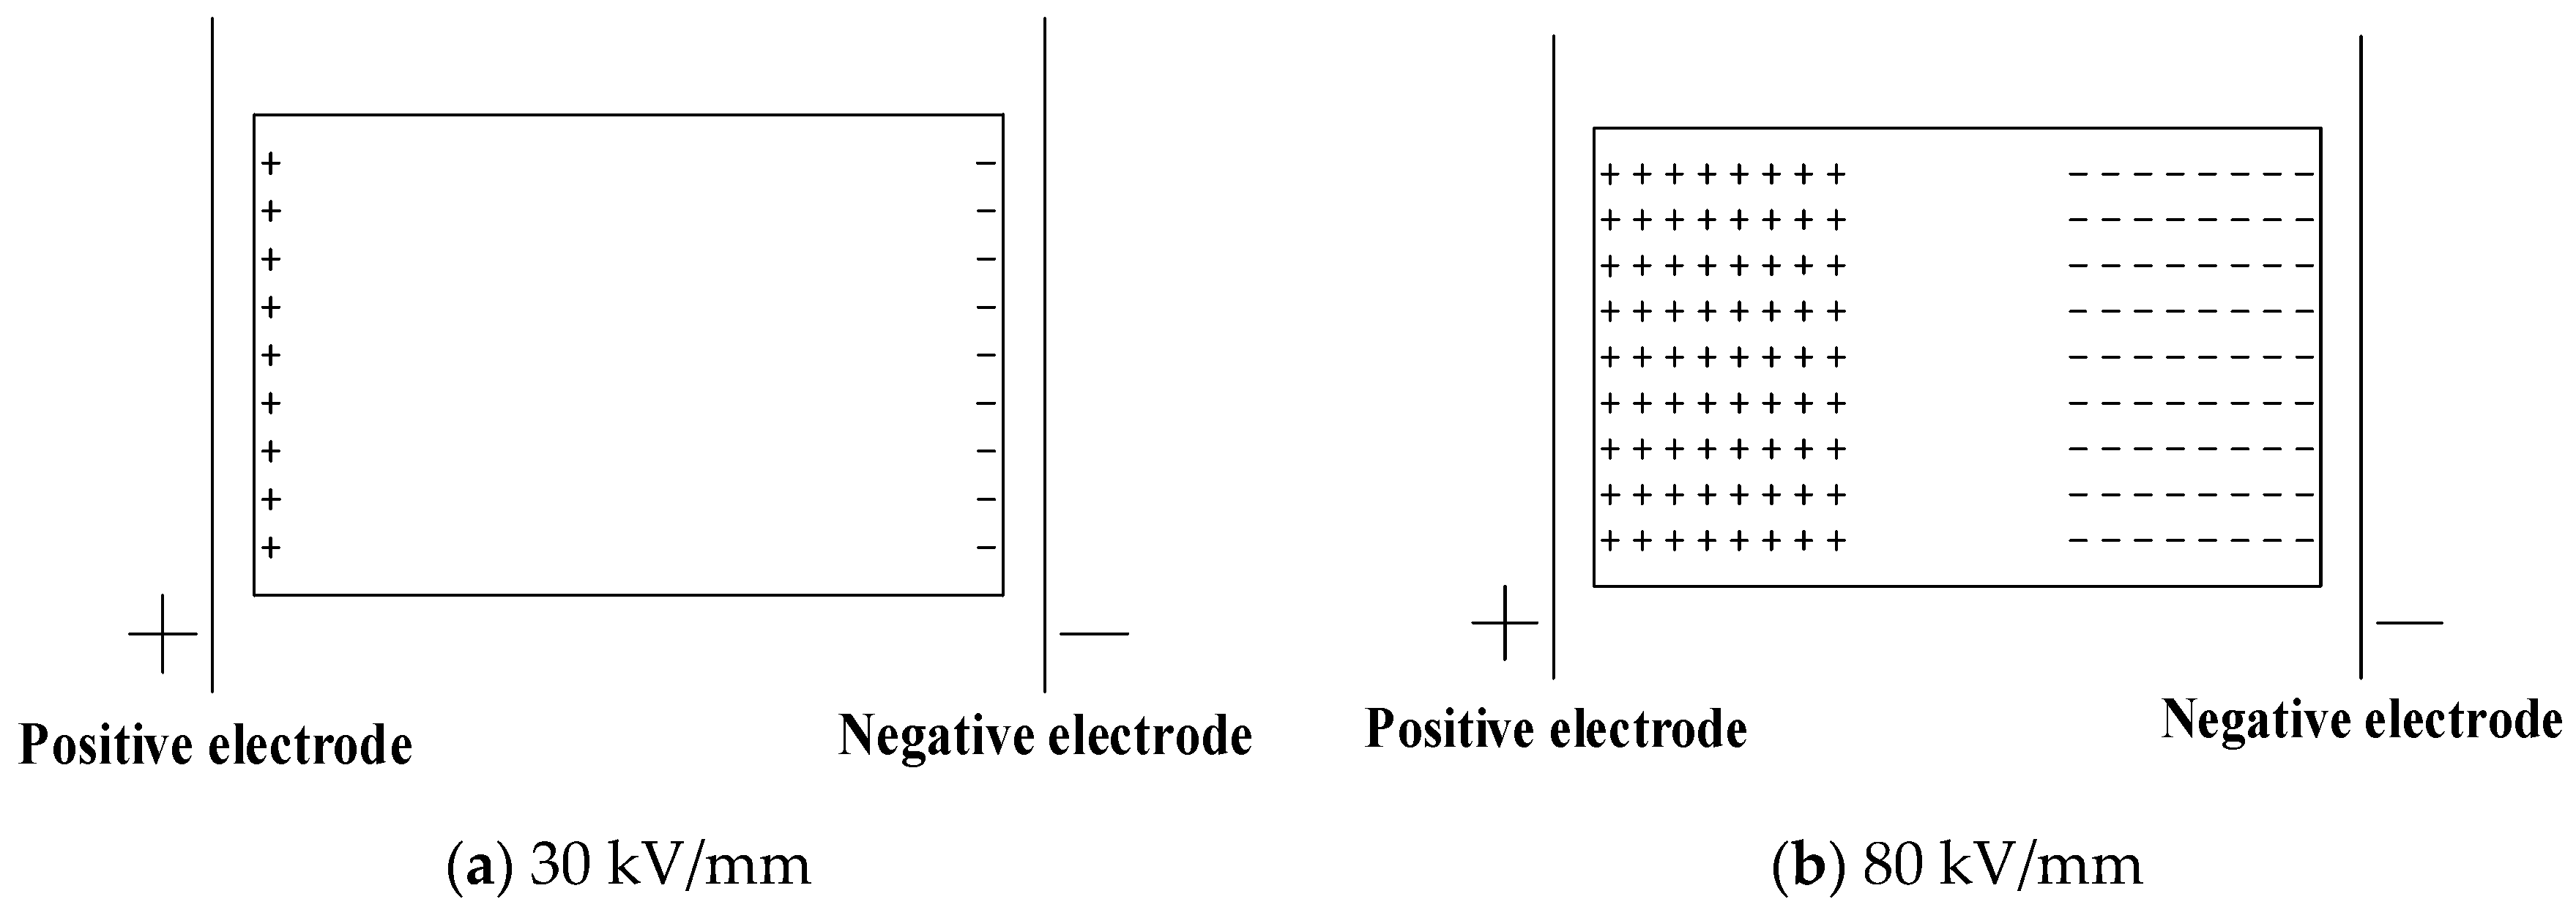
- (3)
- The cross-linking effect makes the residual charges more uneven after the voltage is removed, and these charges are mainly distributed in the shallower surface of the medium near the electrode positions.
3.4. The Impact of Cross-Linking Effect on Average Charge Density of XLPE
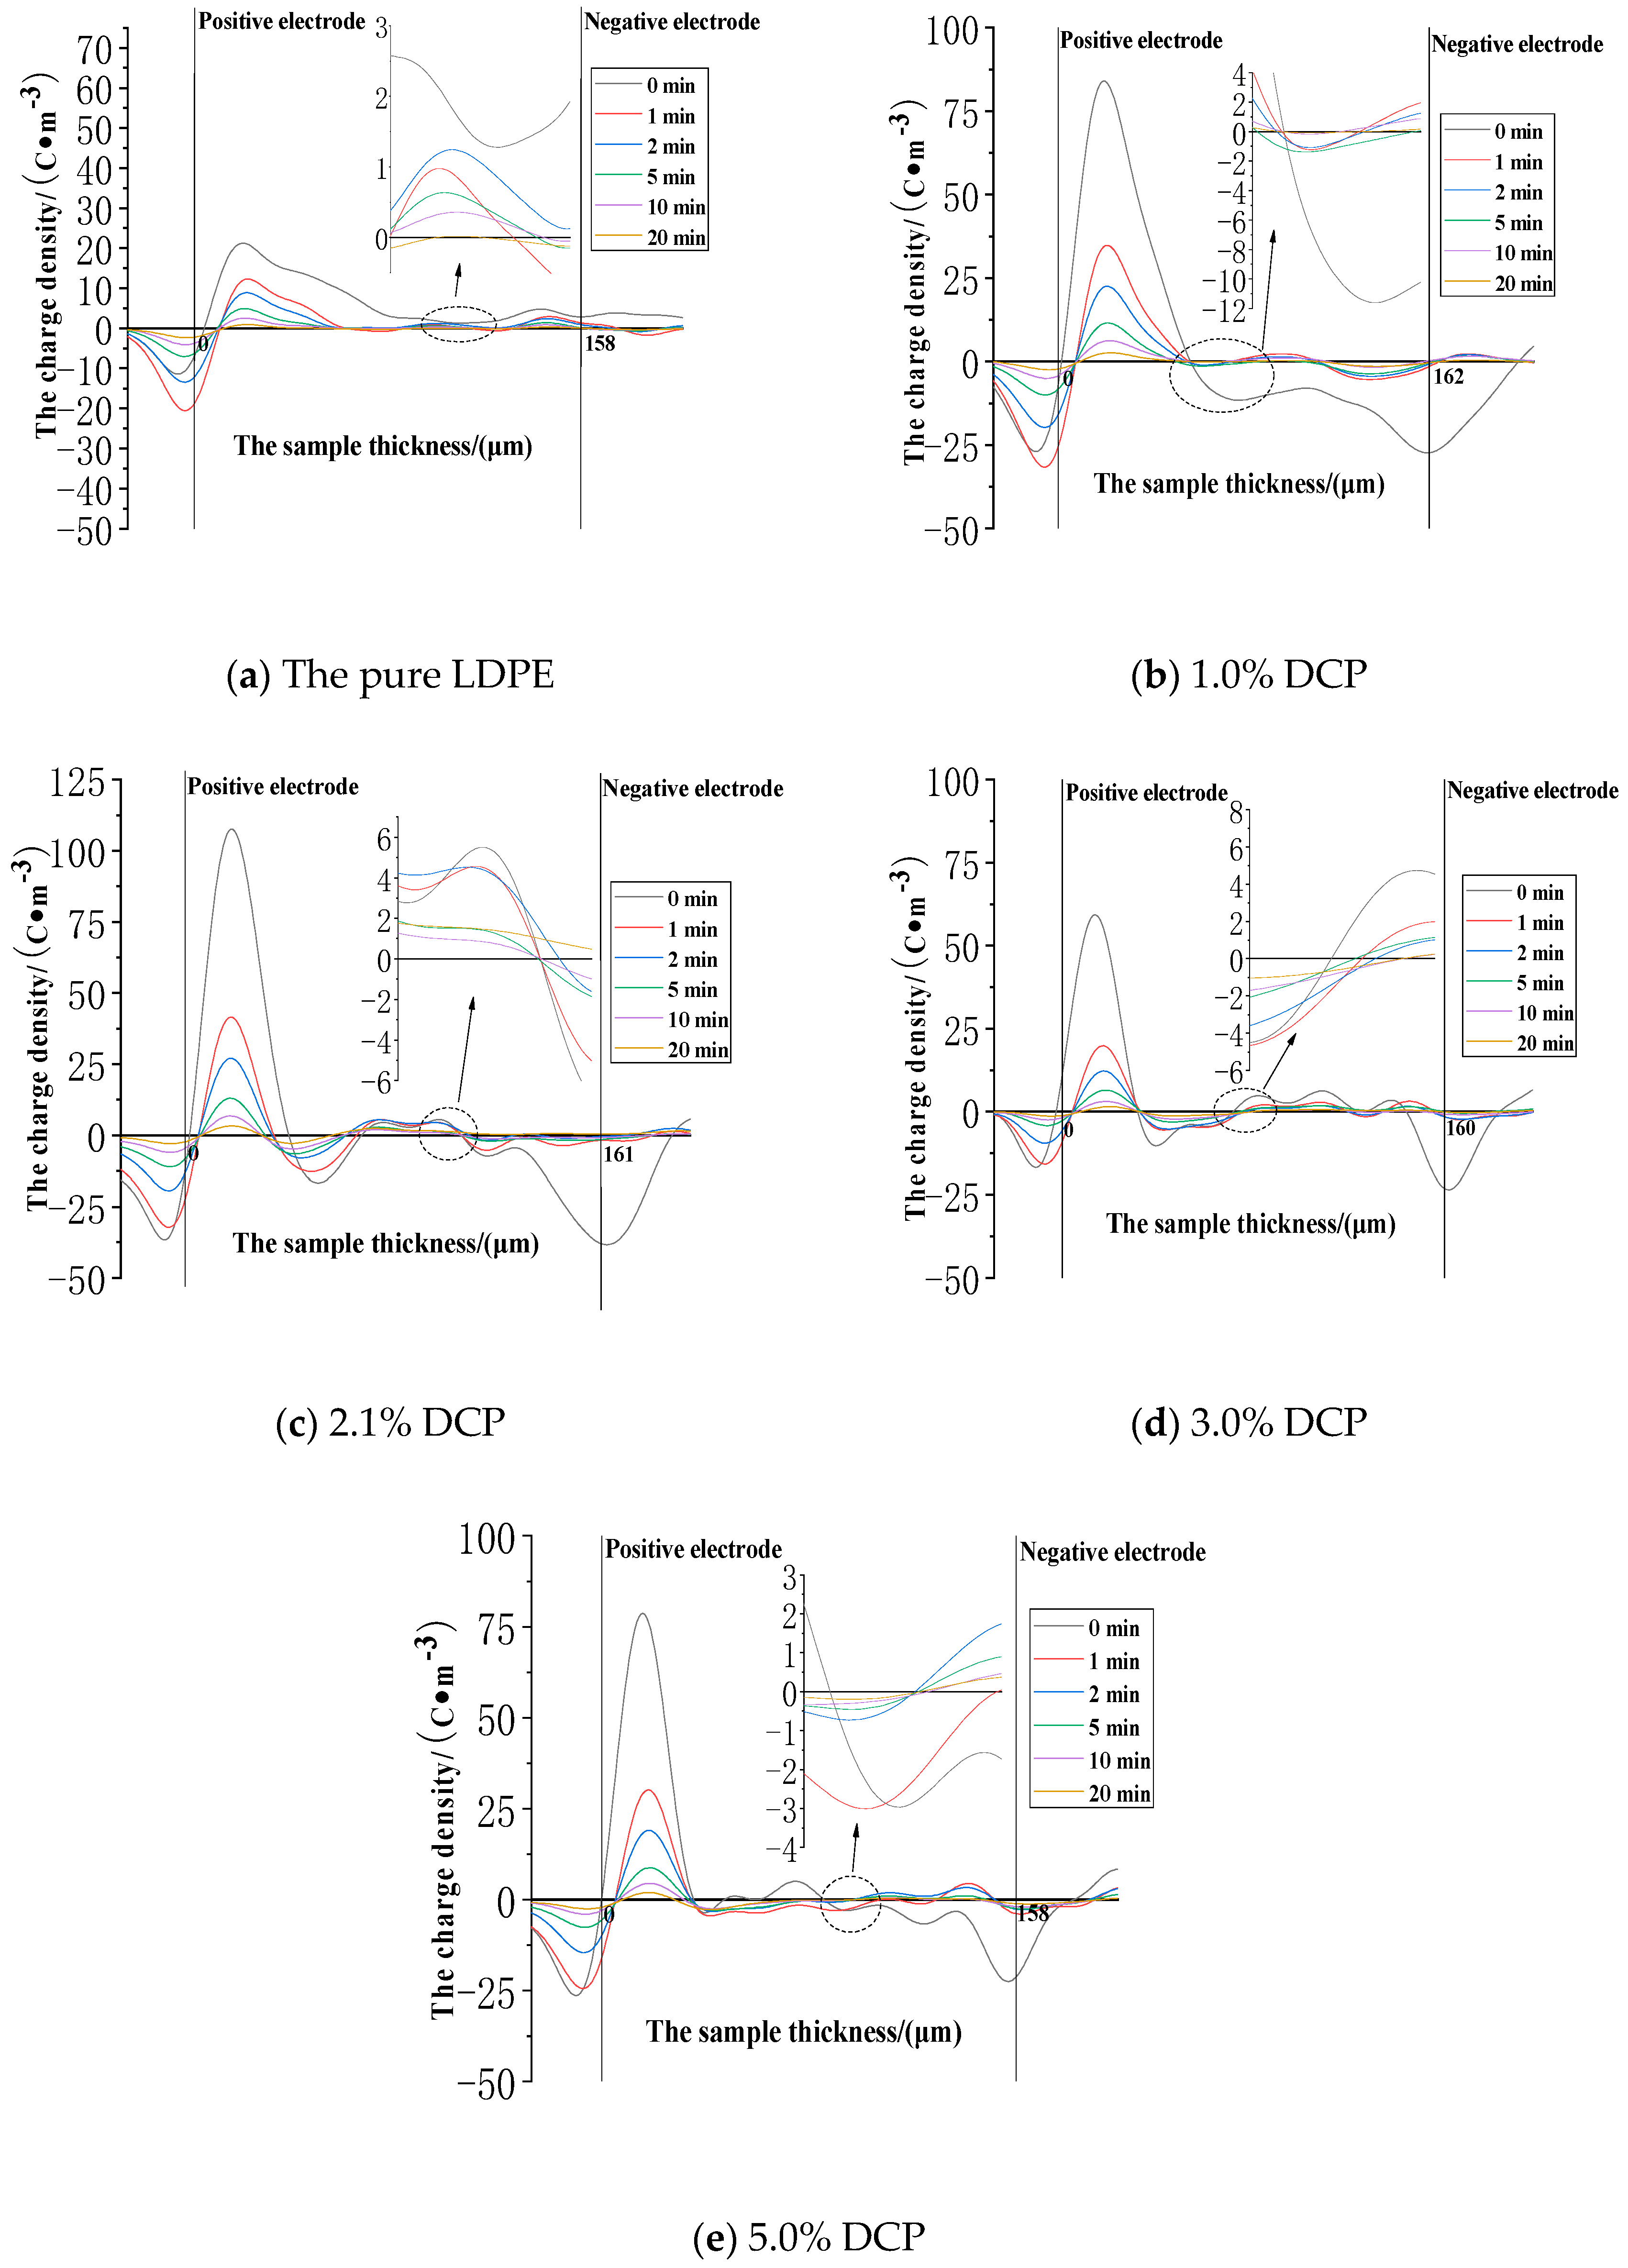
3.4.1. The Charge Injection and Accumulation Characteristics in the Applied Voltage Experiment
3.4.2. The Charge Dissipation Characteristics in the Removed Voltage Experiment
3.4.3. The Decay Model of the Average Charges
3.5. The Microscopic Interpretation of the Cross-Linking Effect on Space Charge Characteristics
- (1)
- In the applied voltage experiment, the average charge densities of the samples decrease at first and then increase with the increase of the content of the cross-linking agent at the electric field strengths of 30 kV/mm and 50 kV/mm, while the average charge density increases at first and then decreases at the electric field strength of 80 kV/mm.
- (2)
- In the removed voltage experiment, the average charge density in each sample decreases at first and then increases with the increase of the content of the cross-linking agent at the electric field strength of 30 kV/mm, and the average charge densities increase at first and then decrease at the electric field strengths of 50 kV/mm and 80 kV/mm.
- (3)
- Compared to the lower electric field strength, the average charge density in each sample increases significantly at the electric field strength of 80 kV/mm.
- (4)
- The threshold field strength of each unaged sample is less than 30 kV/mm, and this shows the trend of increasing at first and then decreasing as the content of the cross-linking agent increases.
4. Conclusions
Author Contributions
Funding
Acknowledgments
Conflicts of Interest
References
- Li, G.; Wang, J.; Han, W.; Wei, Y.; Li, S. Influence of Temperature on Charge Accumulation in Low-Density Polyethylene Based on Depolarization Current and Space Charge Decay. Polymers 2019, 11, 587. [Google Scholar] [CrossRef] [PubMed]
- Li, Z.; Chen, G. Space charge in thermally aged polyethylene and its electrical performance. Mater. Res. Express 2019, 6, 035308. [Google Scholar] [CrossRef]
- Manas, D.; Manas, M.; Mizera, A.; Stoklasek, P.; Navratil, J.; Sehnalek, S.; Drabek, P. The High Density Polyethylene Composite with Recycled Radiation Cross-Linked Filler of rHDPEx. Polymers 2018, 10, 1361. [Google Scholar] [CrossRef] [PubMed]
- Plesa, I.; Notingher, P.V.; Schlogl, S.; Sumereder, C.; Muhr, M. Properties of Polymer Composites Used in High-Voltage Applications. Polymers 2016, 8, 173. [Google Scholar] [CrossRef] [PubMed]
- Min, D.M.; Wang, W.W.; Li, S.T. Numerical Analysis of Space Charge Accumulation and Conduction Properties in LDPE Nanodielectrics. IEEE Trns. Dielectr. Electr. Insul. 2015, 22, 1483–1491. [Google Scholar] [CrossRef]
- Choo, W.; Chen, G.; Swingler, S.G. Electric Field in Polymeric Cable due to Space Charge Accumulation under DC and Temperature Gradient. IEEE Trns. Dielectr. Electr. Insul. 2011, 18, 596–606. [Google Scholar] [CrossRef]
- Fu, M.; Dissado, L.A.; Chen, G.; Fothergill, J.C. Space charge formation and its modified electric field under applied voltage reversal and temperature gradient in XLPE cable. IEEE Trns. Dielectr. Electr. Insul. 2008, 15, 851–860. [Google Scholar] [CrossRef]
- Vissouvanadin, B.; Le Roy, S.; Teyssedre, G.; Laurent, C.; Denizet, I.; Mammeri, M.; Poisson, B. Impact of Concentration Gradient of Polarizable Species on the Electric Field Distribution in Polymeric Insulating Material for HVDC Cable. IEEE Trns. Dielectr. Electr. Insul. 2011, 18, 833–839. [Google Scholar] [CrossRef]
- Teyssedre, G.; Laurent, C. Charge transport modeling in insulating polymers: From molecular to macroscopic scale. IEEE Trns. Dielectr. Electr. Insul. 2005, 12, 857–875. [Google Scholar] [CrossRef]
- Sekii, Y.; Maeno, T. Generation and Dissipation of Negative Heterocharges in XLPE and EPR. IEEE Trns. Dielectr. Electr. Insul. 2009, 16, 668–675. [Google Scholar] [CrossRef]
- Tanaka, T.; Bulinski, A.; Castellon, J.; Frechette, M.; Gubanski, S.; Kindersberger, J.; Montanari, G.C.; Nagao, M.; Morshuis, P.; Tanaka, Y.; et al. Dielectric Properties of XLPE/SiO2 Nanocomposites Based on CIGRE WG D1.24 Cooperative Test Results. IEEE Trns. Dielectr. Electr. Insul. 2011, 18, 1484–1517. [Google Scholar] [CrossRef]
- Fabiani, D.; Montanari, G.C.; Dissado, L.A.; Laurent, C.; Teyssedre, G. Fast and Slow Charge Packets in Polymeric Materials under DC Stress. IEEE Trns. Dielectr. Electr. Insul. 2009, 16, 241–250. [Google Scholar] [CrossRef]
- Mazzanti, G.; Montanari, G.C.; Alison, J.M. A space-charge based method for the estimation of apparent mobility and trap depth as markers for insulation degradation-theoretical basis and experimental validation. IEEE Trns. Dielectr. Electr. Insul. 2003, 10, 187–197. [Google Scholar] [CrossRef]
- Rogti, F. Space Charge Dynamic at the Physical Interface in Cross-linked Polyethylene under DC Field and Different Temperatures. IEEE Trns. Dielectr. Electr. Insul. 2011, 18, 888–899. [Google Scholar] [CrossRef]
- Rogti, F.; Mekhaldi, A.; Laurent, C. Space Charge Behavior at Physical Interfaces in Cross-linked Polyethylene under DC Field. IEEE Trns. Dielectr. Electr. Insul. 2008, 15, 1478–1485. [Google Scholar] [CrossRef]
- Stancu, C.; Notingher, P.V.; Notingher, P. Influence of space charge related to water trees on the breakdown voltage of power cable insulation. J. Electrost. 2013, 71, 145–154. [Google Scholar] [CrossRef]
- Chen, G.; Chong, Y.L.; Fu, M. Calibration of the pulsed electroacoustic technique in the presence of trapped charge. Meas. Sci. Technol. 2006, 17, 1974–1980. [Google Scholar] [CrossRef]
- Hozumi, N.; Suzuki, H.; Okamoto, T.; Watanabe, K.; Watanabe, A. Direct observation of time-dependent space charge profiles in XLPE cable under high electric fields. IEEE Transactions on Dielectrics and Electrical Insulation. IEEE Trns. Dielectr. Electr. Insul. 1994, 1, 1068–1076. [Google Scholar] [CrossRef]
- Chen, G.; Tanaka, Y.; Takada, T.; Zhong, L. Effect of polyethylene interface on space charge formation. IEEE Trns. Dielectr. Electr. Insul. 2004, 11, 113–121. [Google Scholar] [CrossRef]
- Meunier, M.; Quirke, N.; Binesti, D.; Martic, G.; Fourmigue, J.M. Identification of Space Charge in Cable Insulation: A New Approach Using Molecular Simulation; IEEE: Minneapolis, MN, USA, 1997; pp. 68–71. [Google Scholar]
- Wang, Q. Preparation and Study of Dicumyl Peroxide Cross-Linked Polyethylene. Master’s Thesis, Donghua University, Shanghai, China, 2009. [Google Scholar]


© 2019 by the authors. Licensee MDPI, Basel, Switzerland. This article is an open access article distributed under the terms and conditions of the Creative Commons Attribution (CC BY) license (http://creativecommons.org/licenses/by/4.0/).
Share and Cite
Wang, S.; Zhou, Q.; Liao, R.; Xing, L.; Wu, N.; Jiang, Q. The Impact of Cross-Linking Effect on the Space Charge Characteristics of Cross-Linked Polyethylene with Different Degrees of Cross-Linking under Strong Direct Current Electric Field. Polymers 2019, 11, 1149. https://doi.org/10.3390/polym11071149
Wang S, Zhou Q, Liao R, Xing L, Wu N, Jiang Q. The Impact of Cross-Linking Effect on the Space Charge Characteristics of Cross-Linked Polyethylene with Different Degrees of Cross-Linking under Strong Direct Current Electric Field. Polymers. 2019; 11(7):1149. https://doi.org/10.3390/polym11071149
Chicago/Turabian StyleWang, Shuchao, Quan Zhou, Ruijin Liao, Lai Xing, Nengcheng Wu, and Qian Jiang. 2019. "The Impact of Cross-Linking Effect on the Space Charge Characteristics of Cross-Linked Polyethylene with Different Degrees of Cross-Linking under Strong Direct Current Electric Field" Polymers 11, no. 7: 1149. https://doi.org/10.3390/polym11071149
APA StyleWang, S., Zhou, Q., Liao, R., Xing, L., Wu, N., & Jiang, Q. (2019). The Impact of Cross-Linking Effect on the Space Charge Characteristics of Cross-Linked Polyethylene with Different Degrees of Cross-Linking under Strong Direct Current Electric Field. Polymers, 11(7), 1149. https://doi.org/10.3390/polym11071149