Structure and Rheology of Polyelectrolyte Complexes in the Presence of a Hydrogen-Bonded Co-Solvent


Abstract
1. Introduction
2. Materials and Methods
3. Results and Discussion
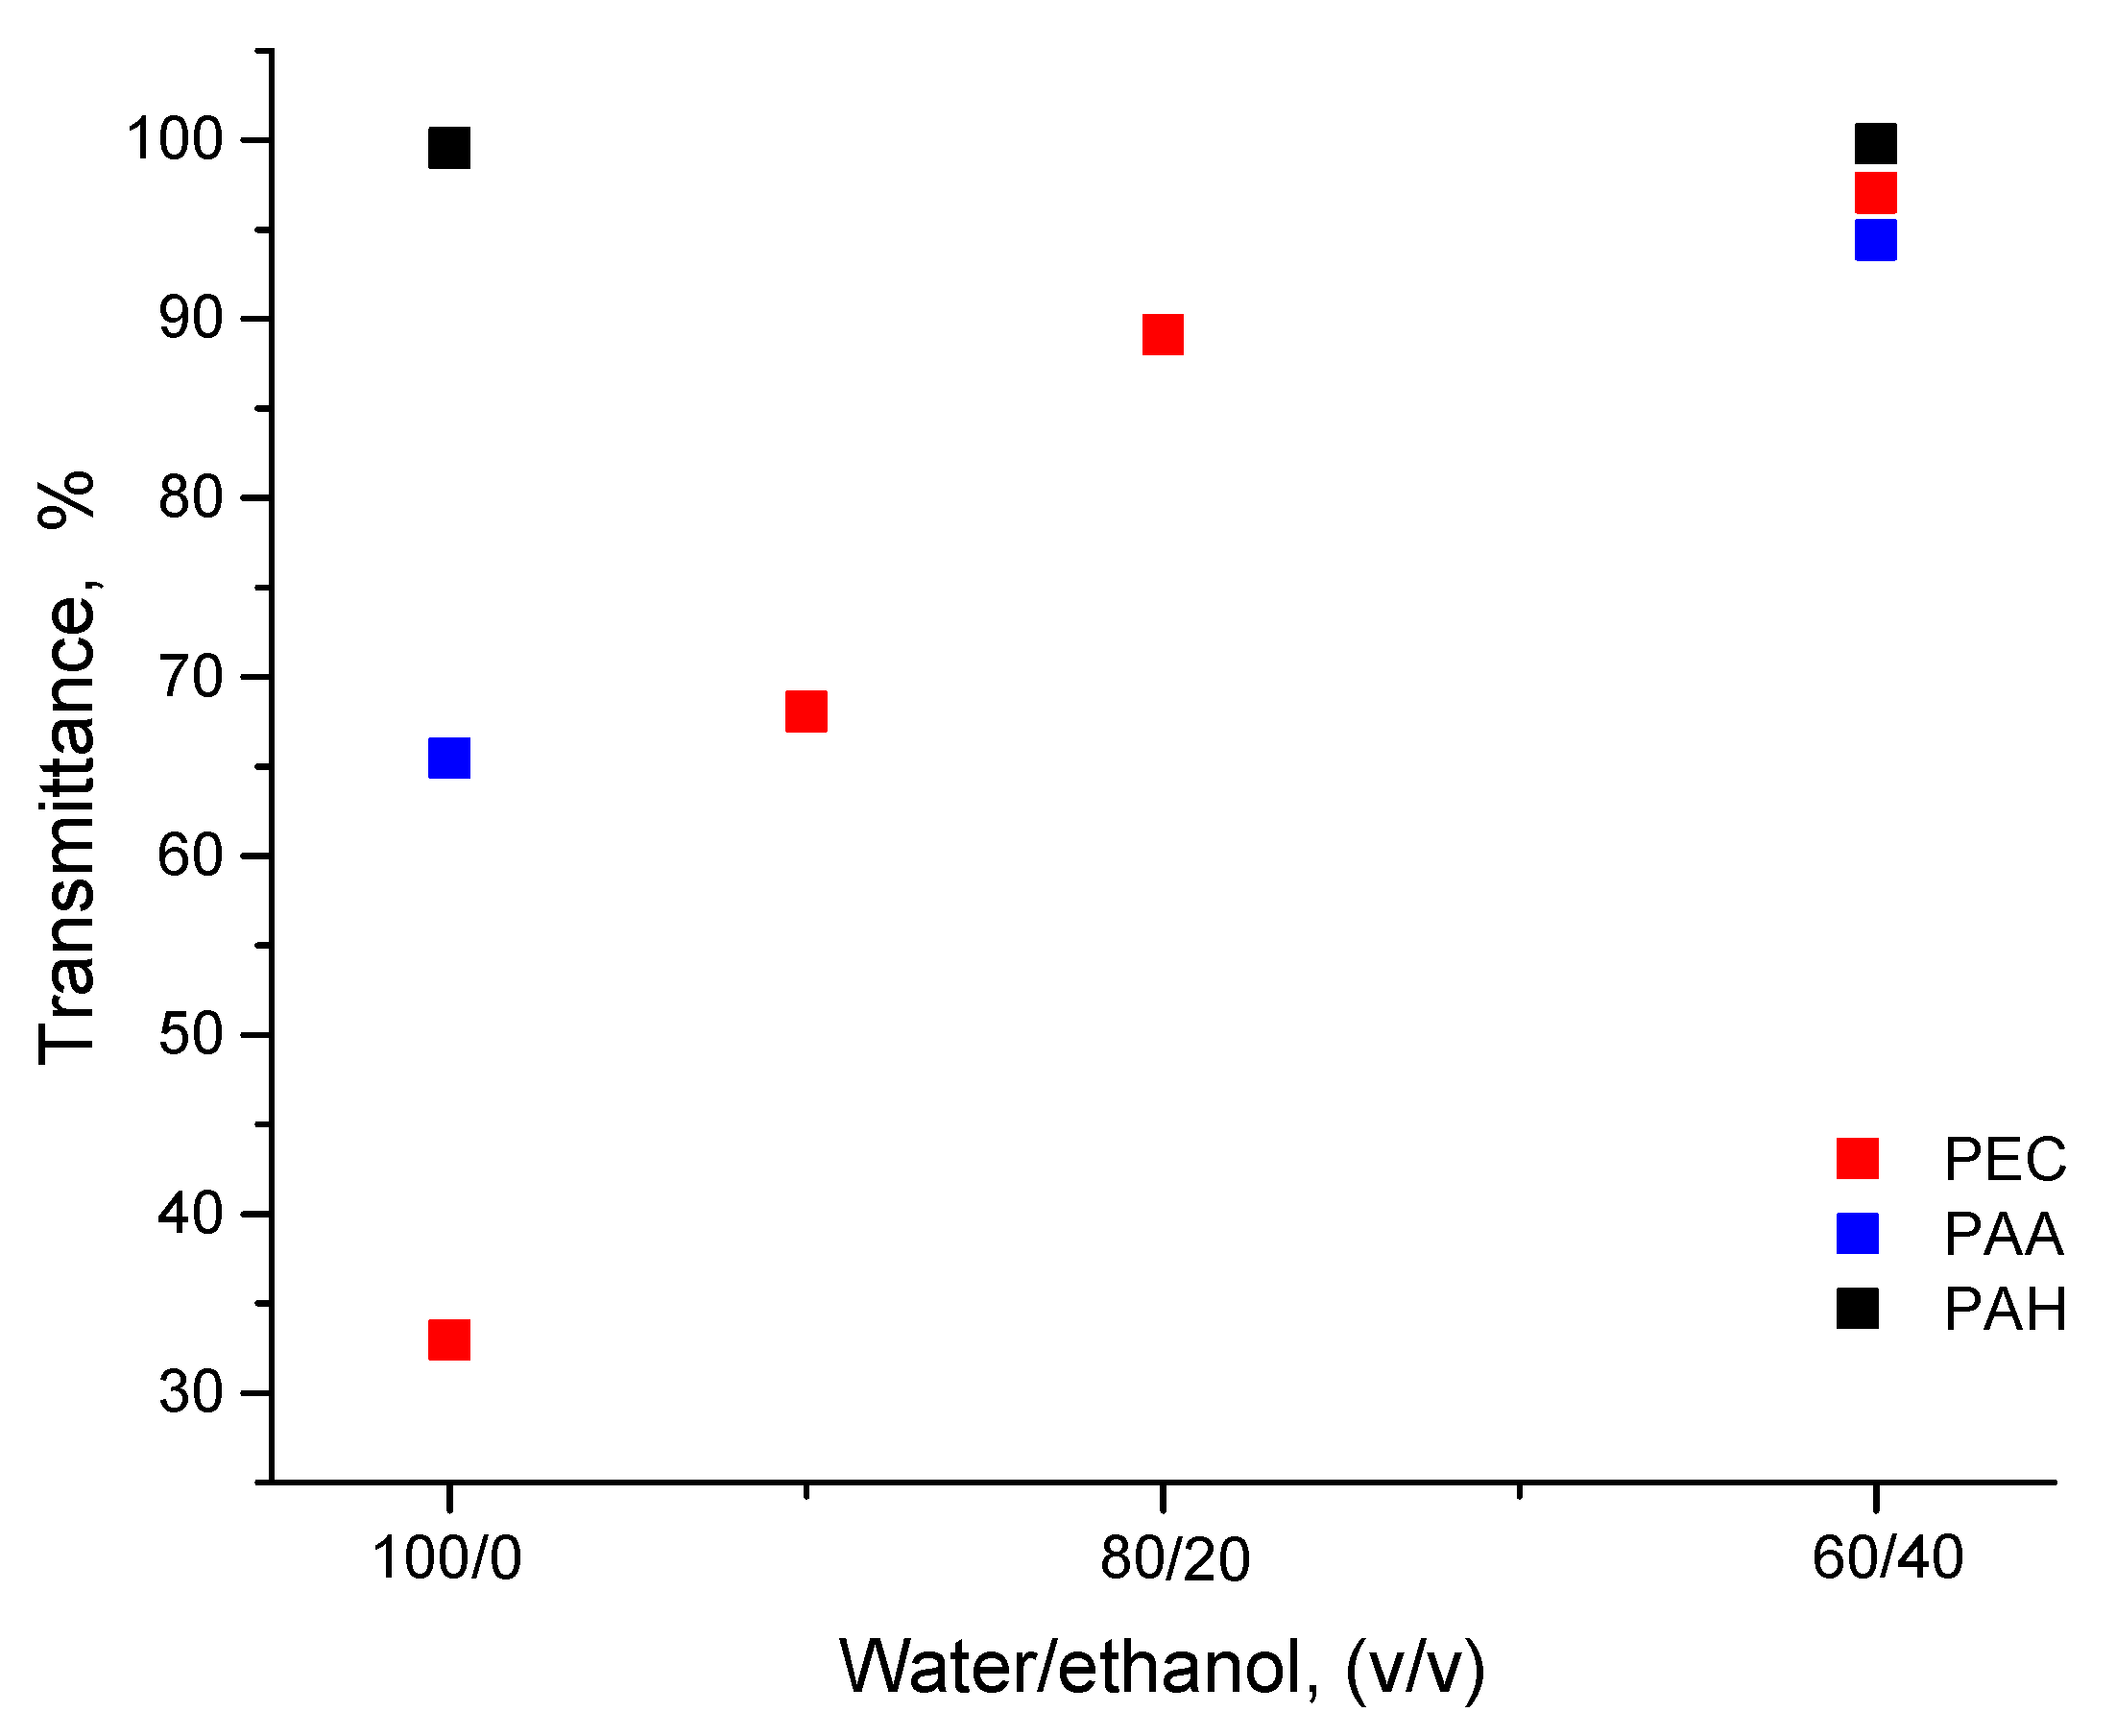
3.1. Transmittance
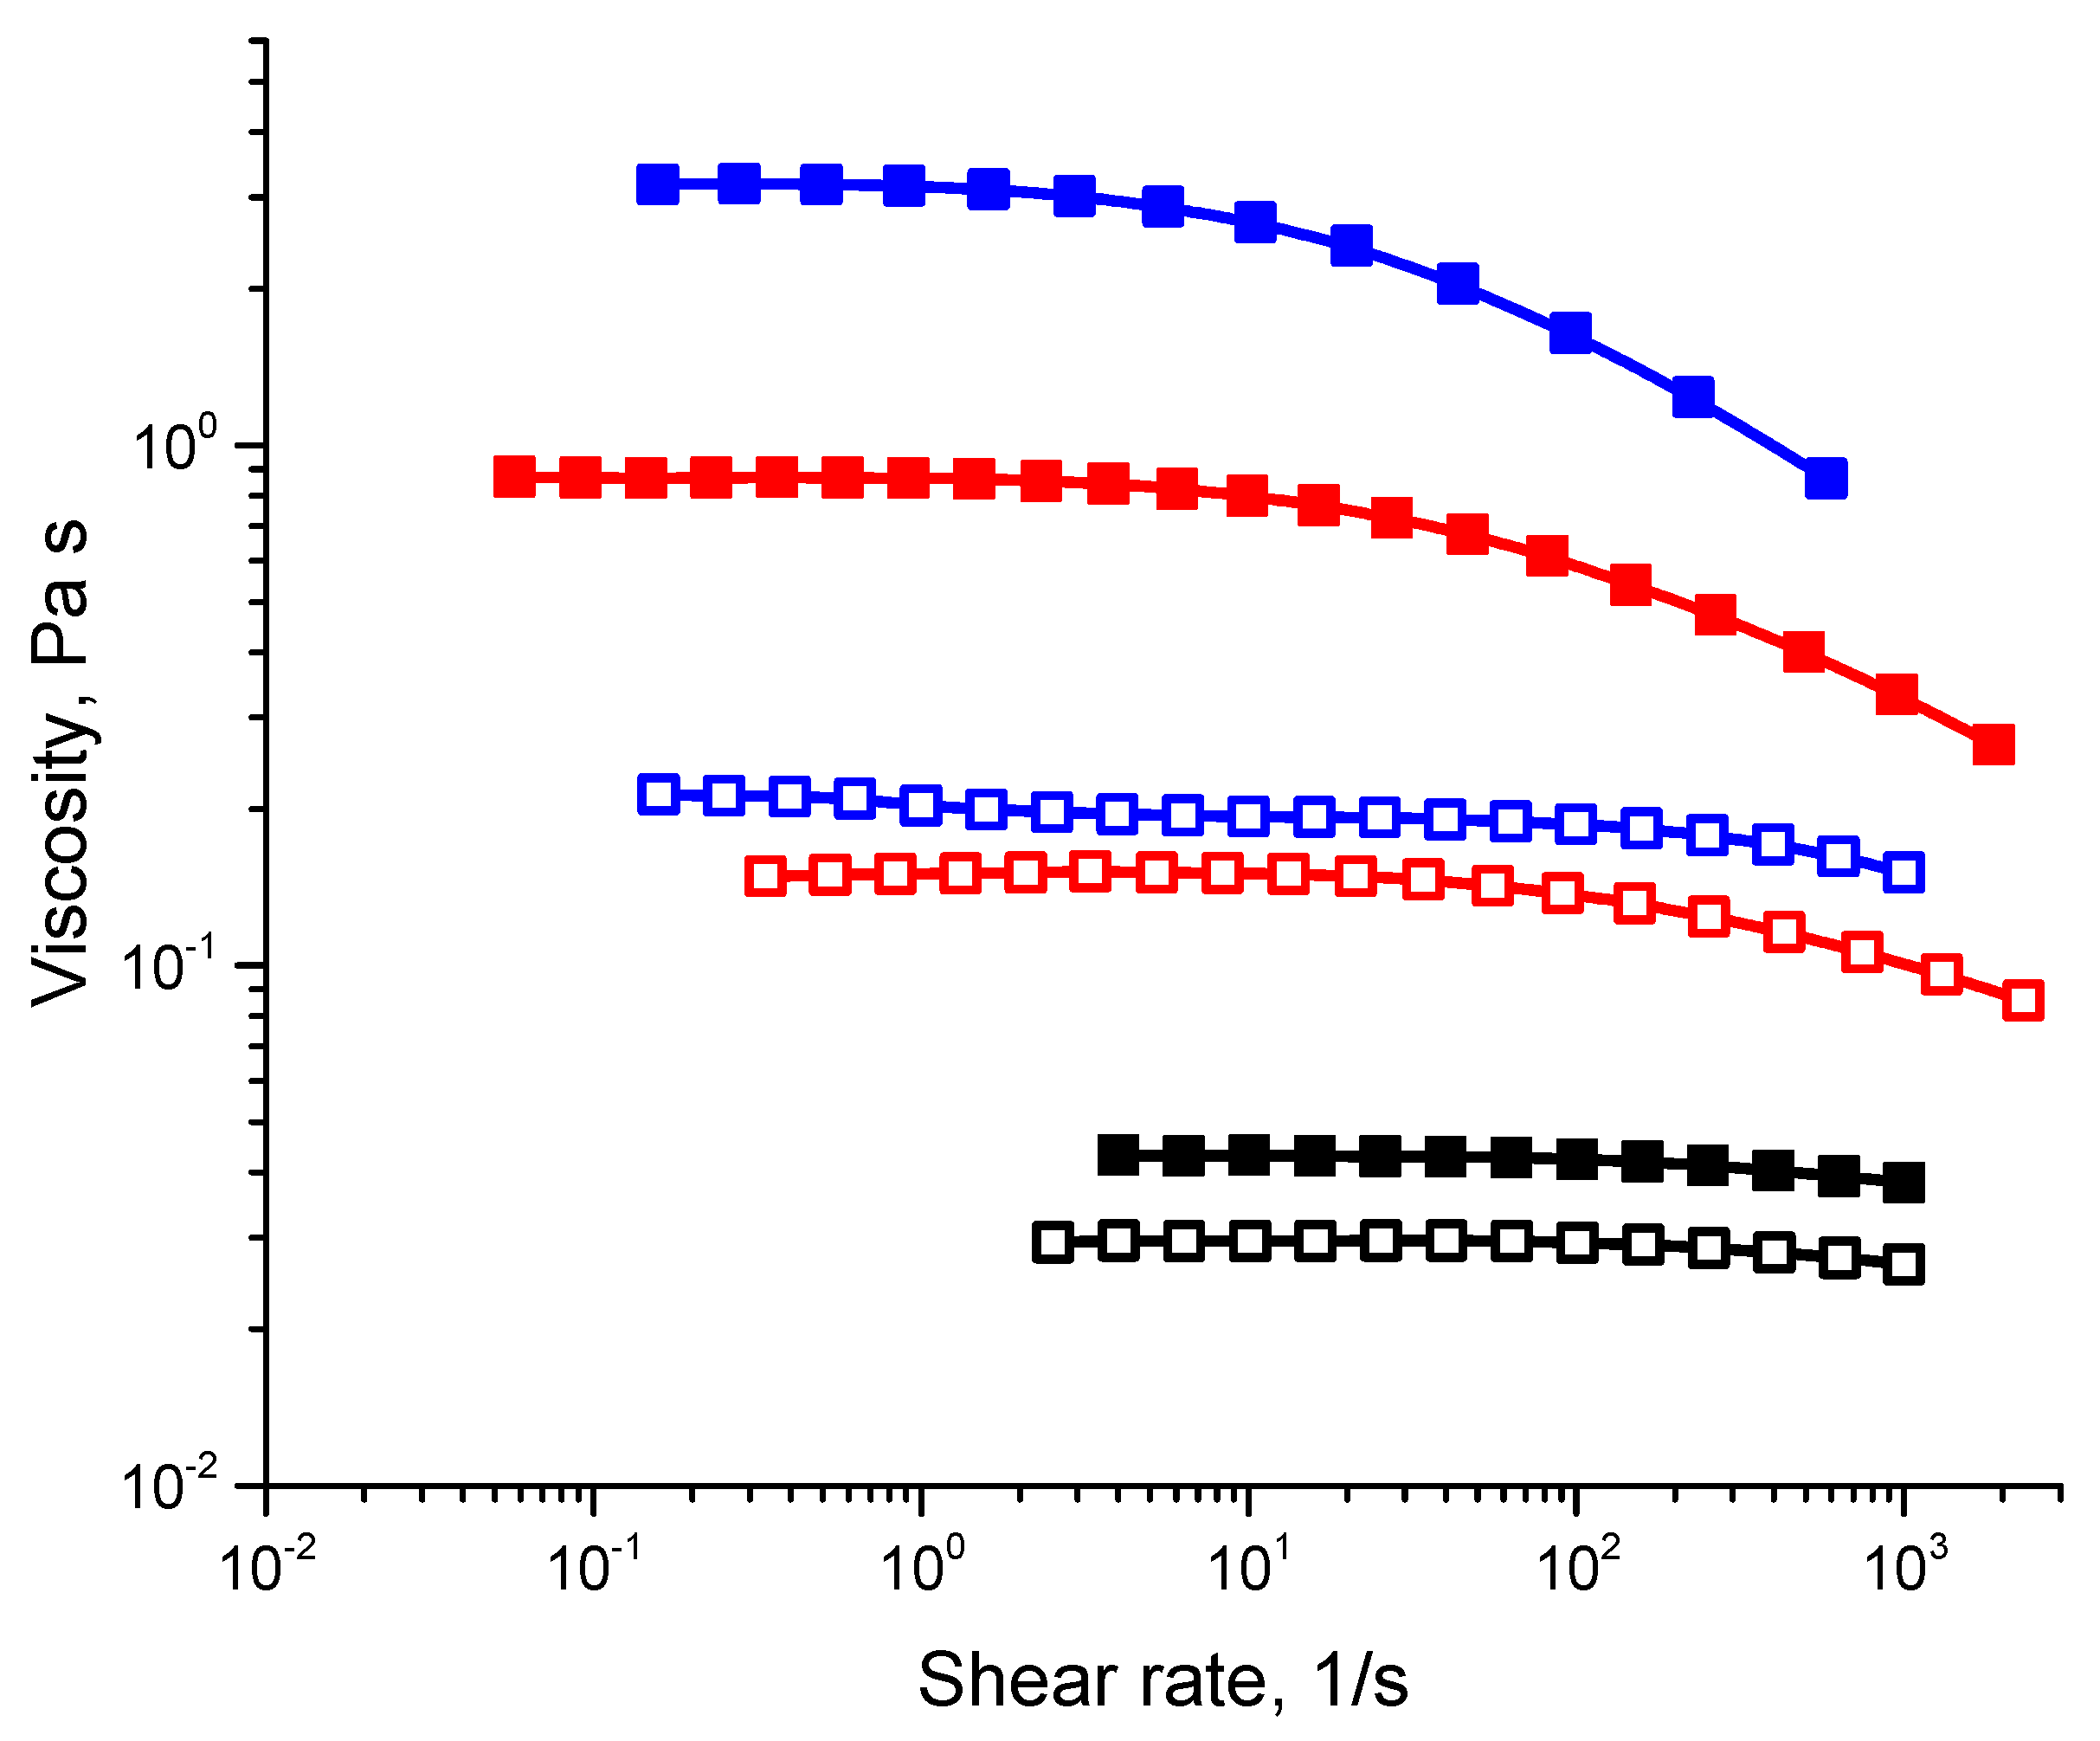
3.2. Rheology
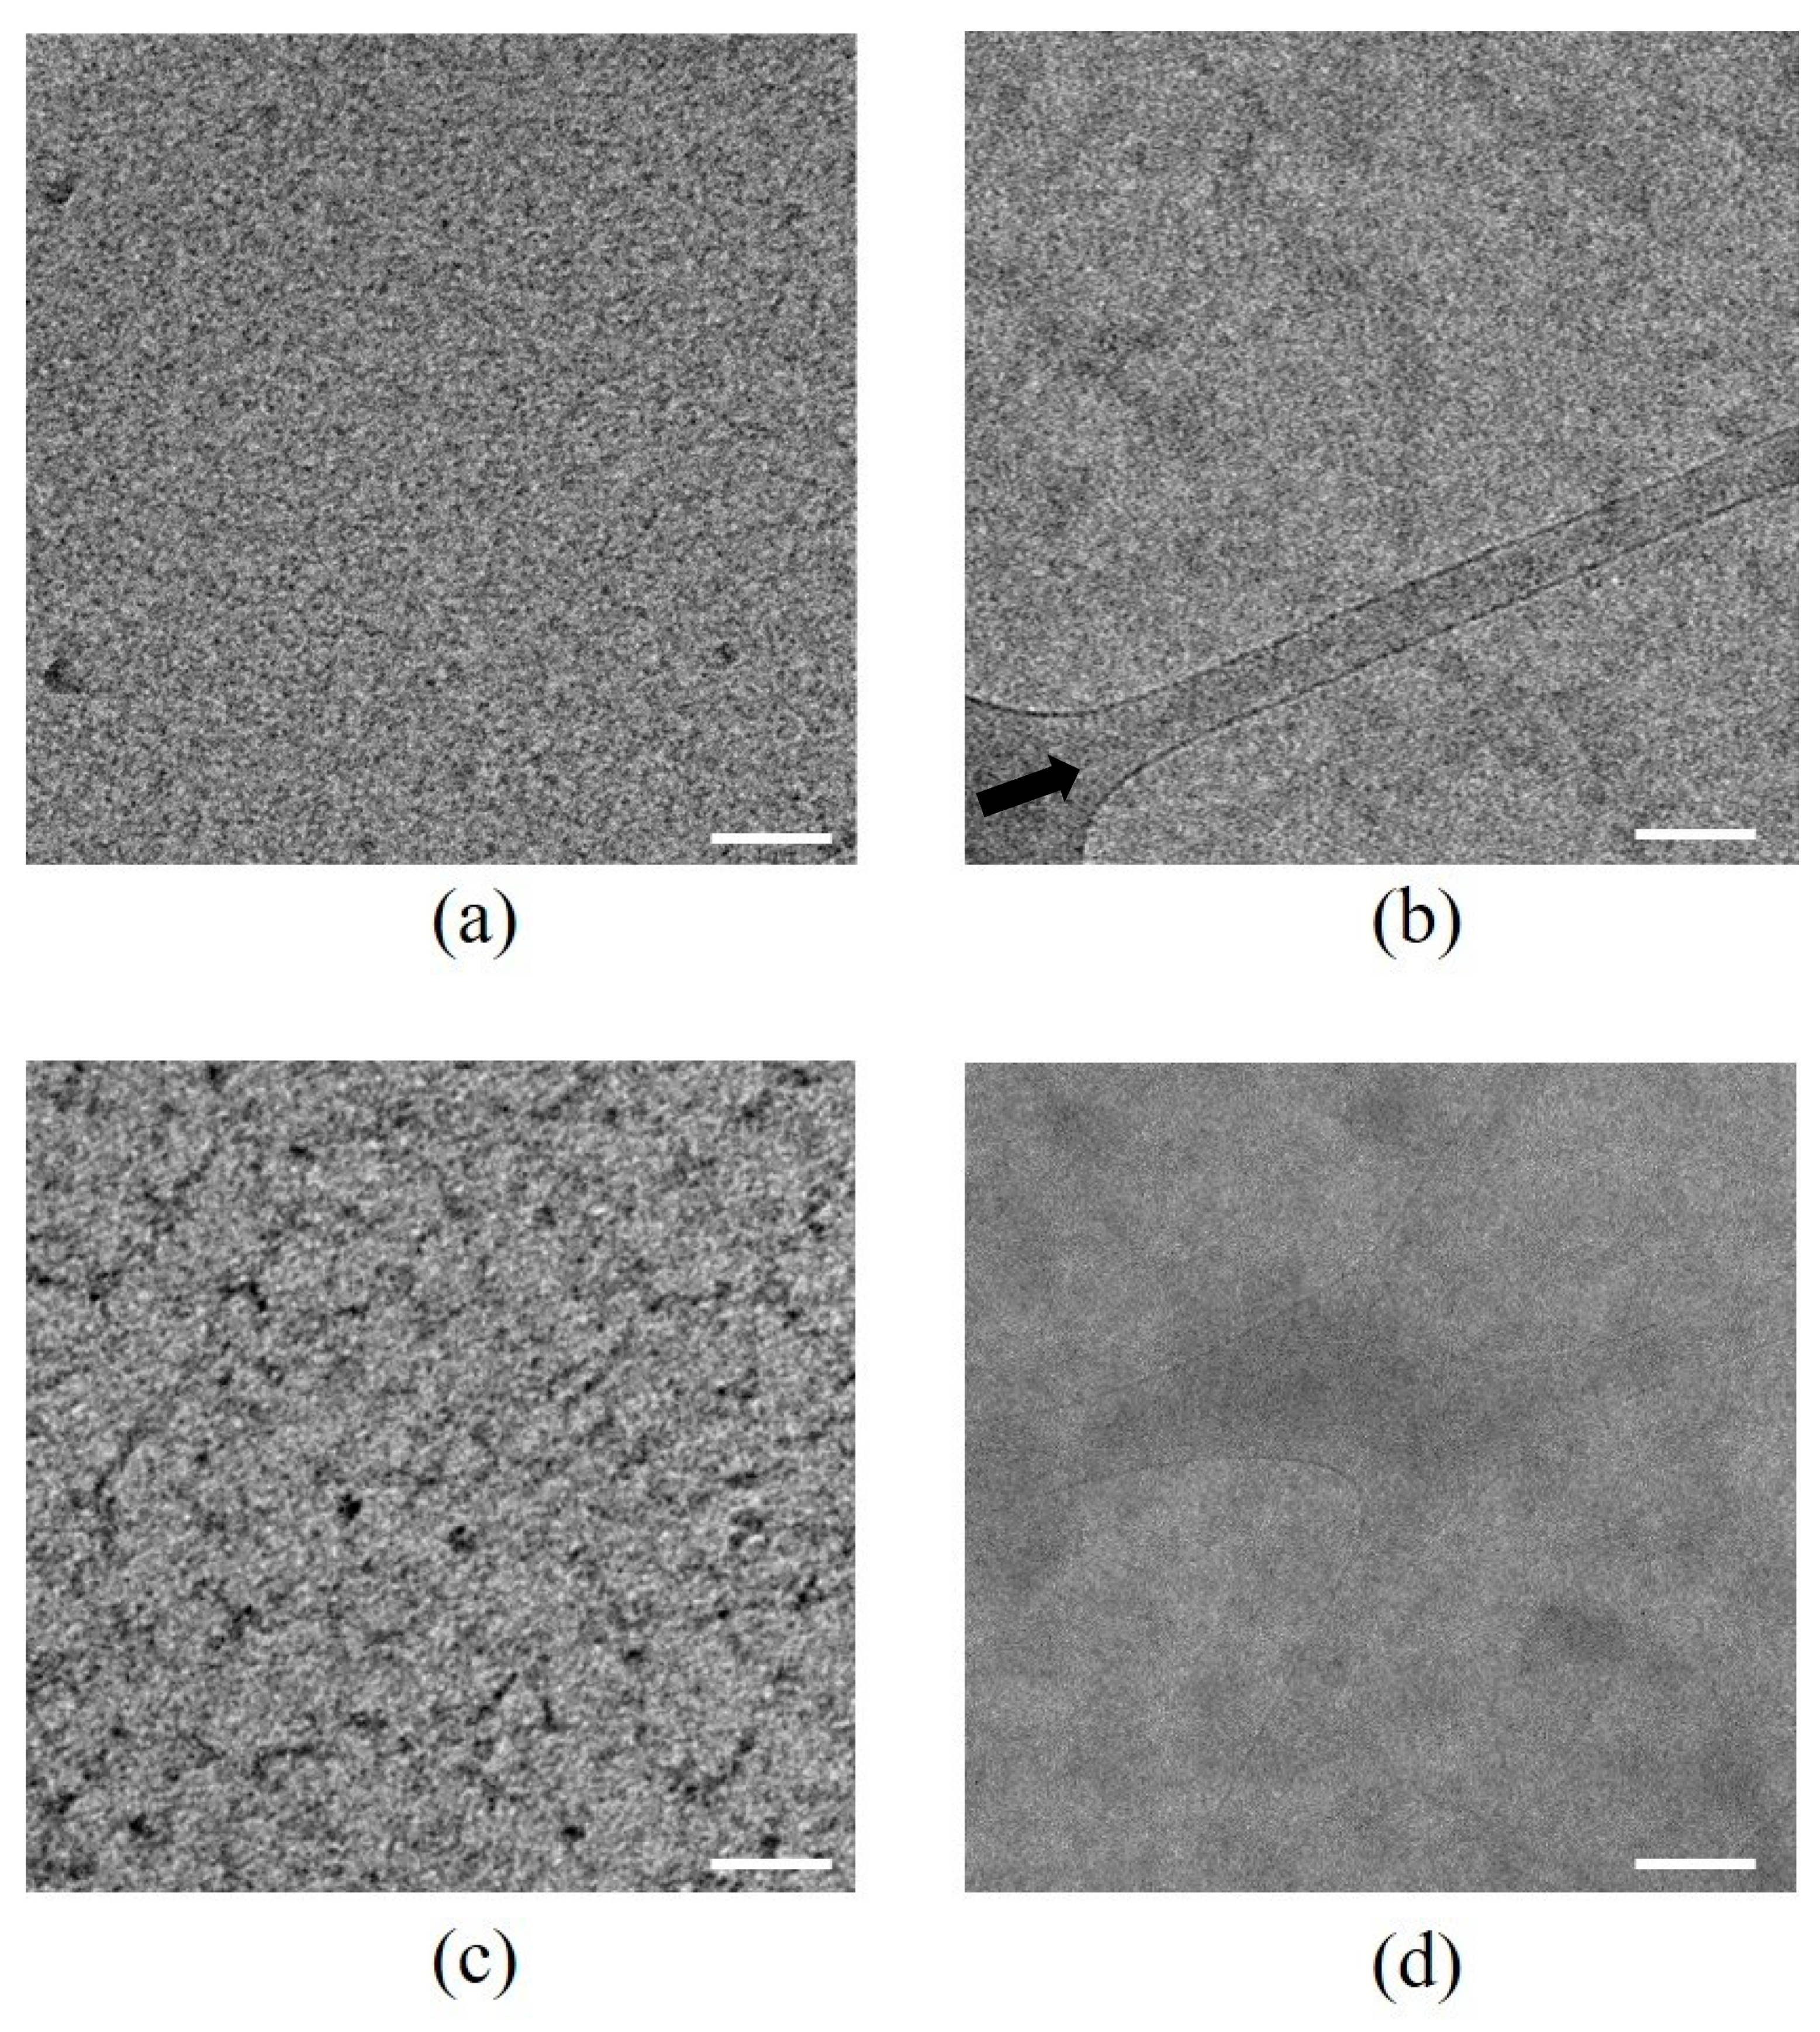
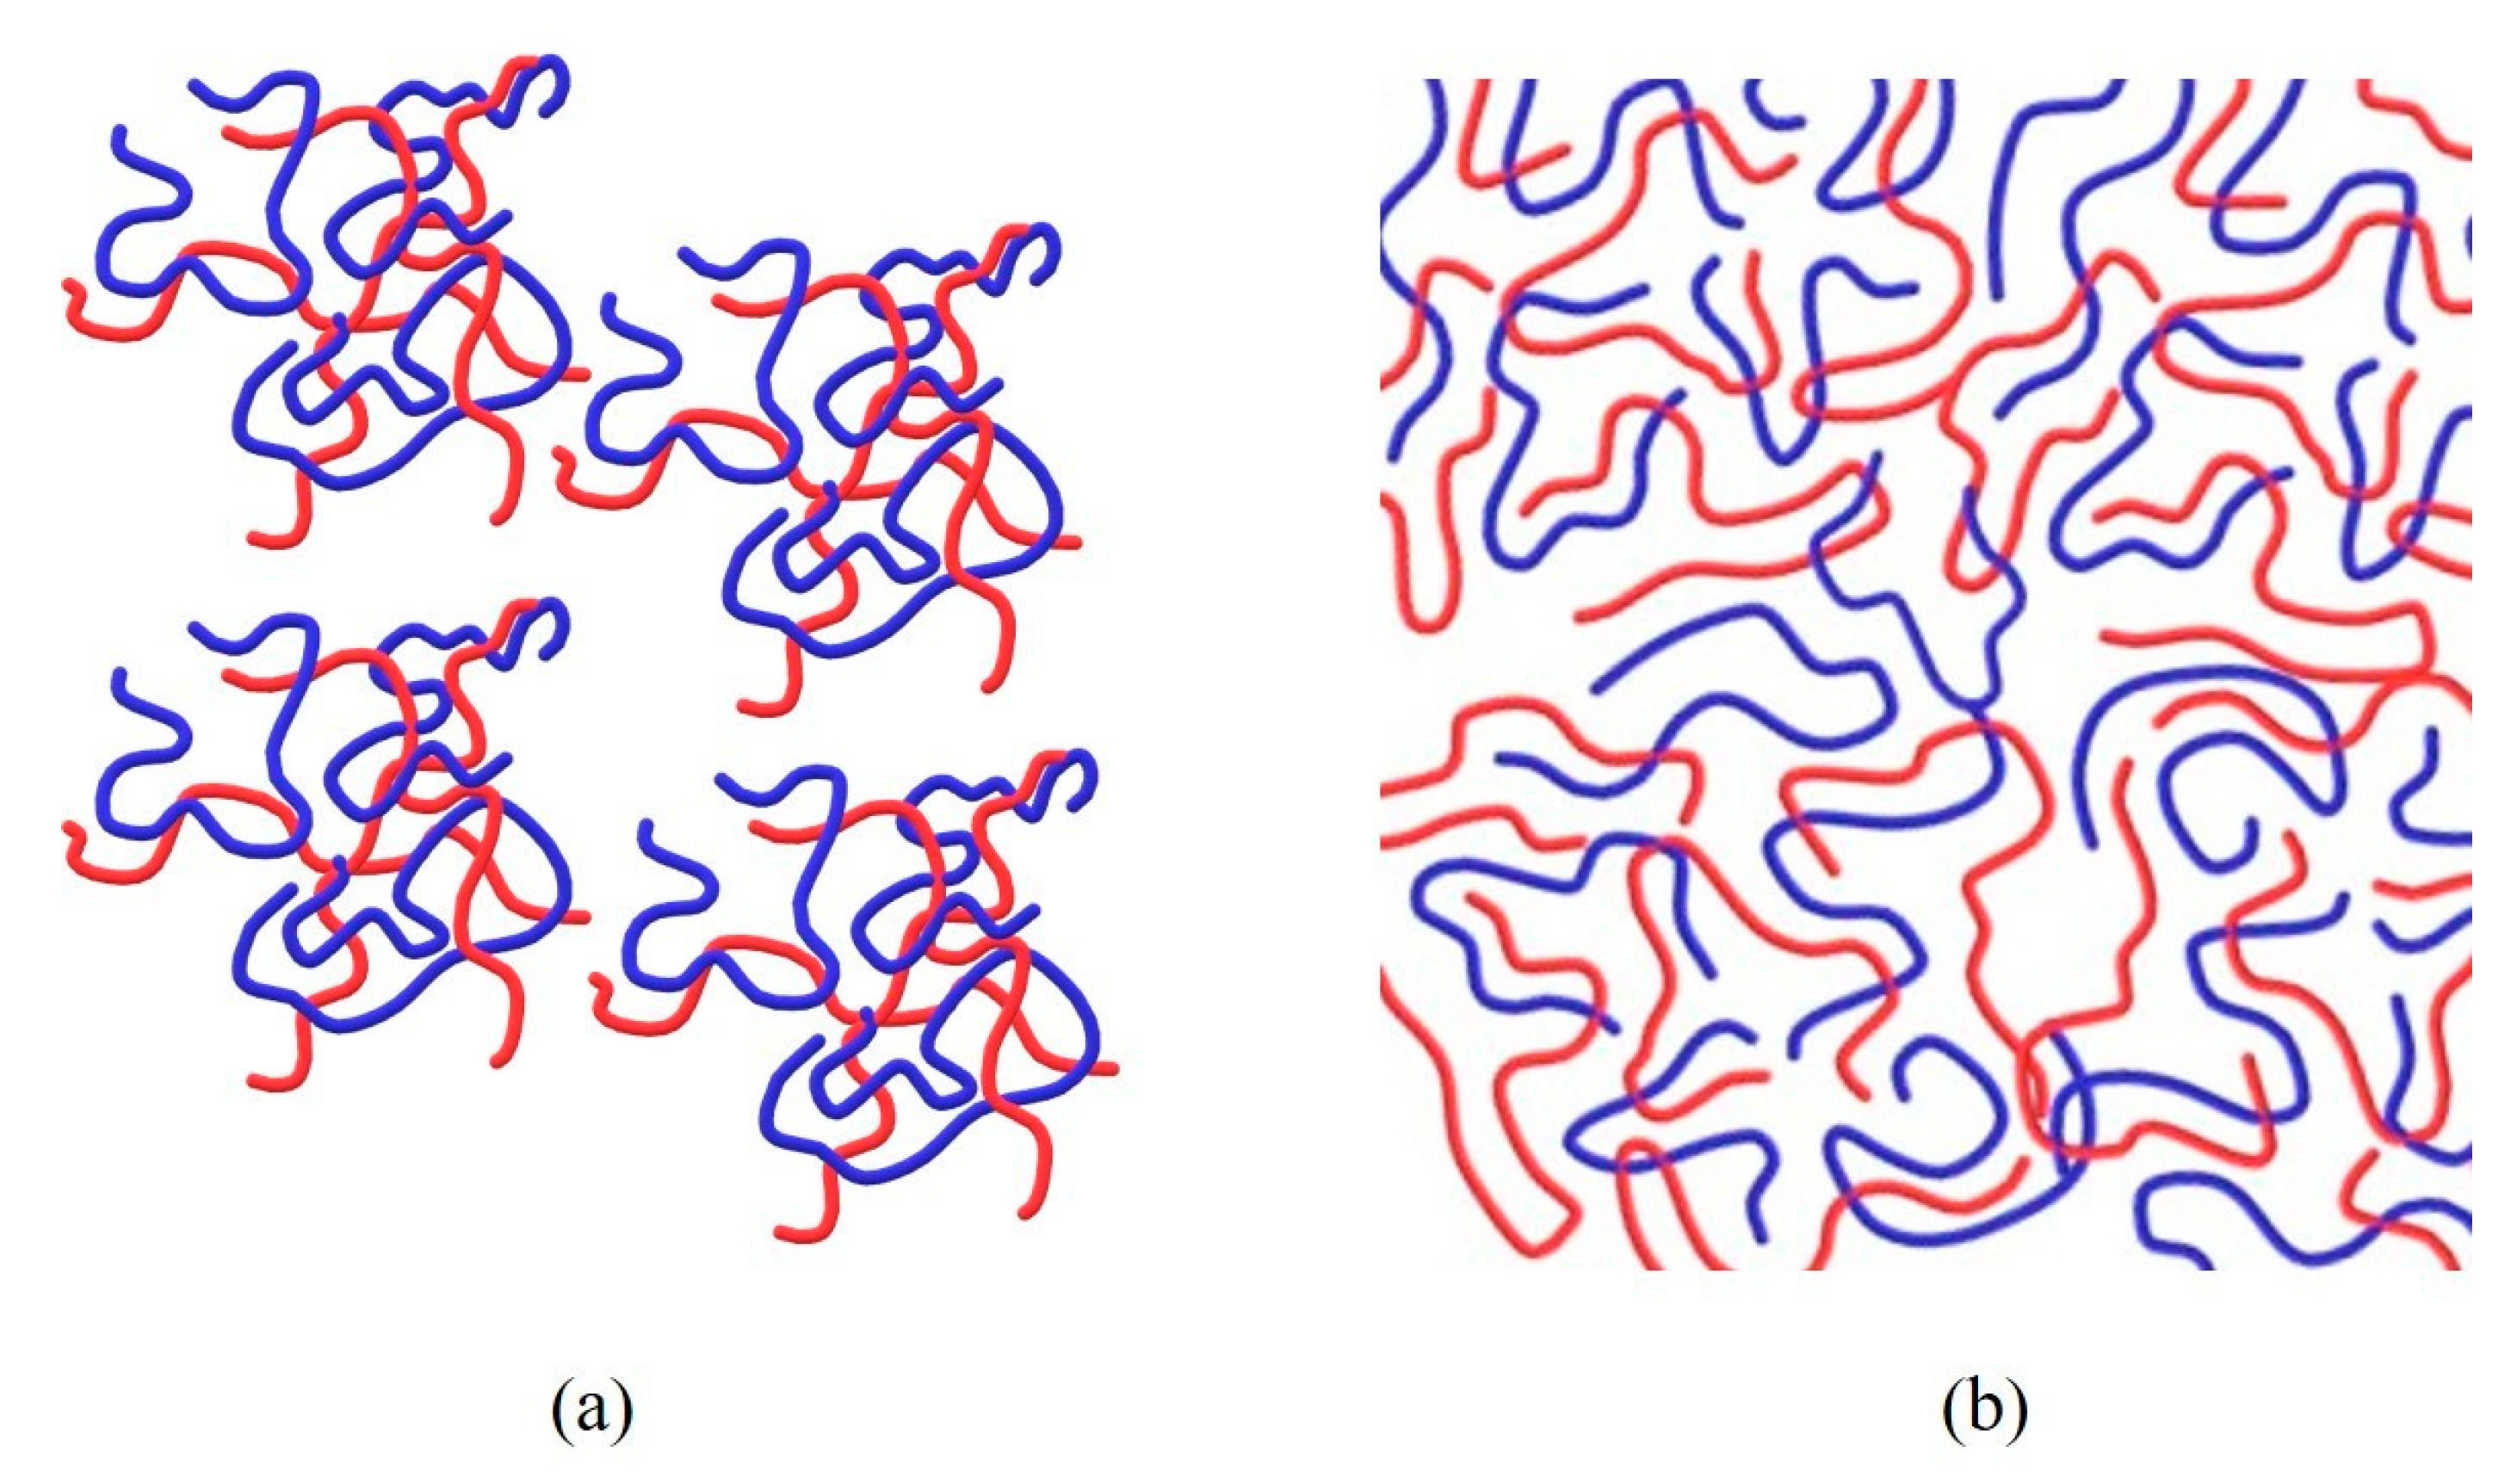
3.3. TEM
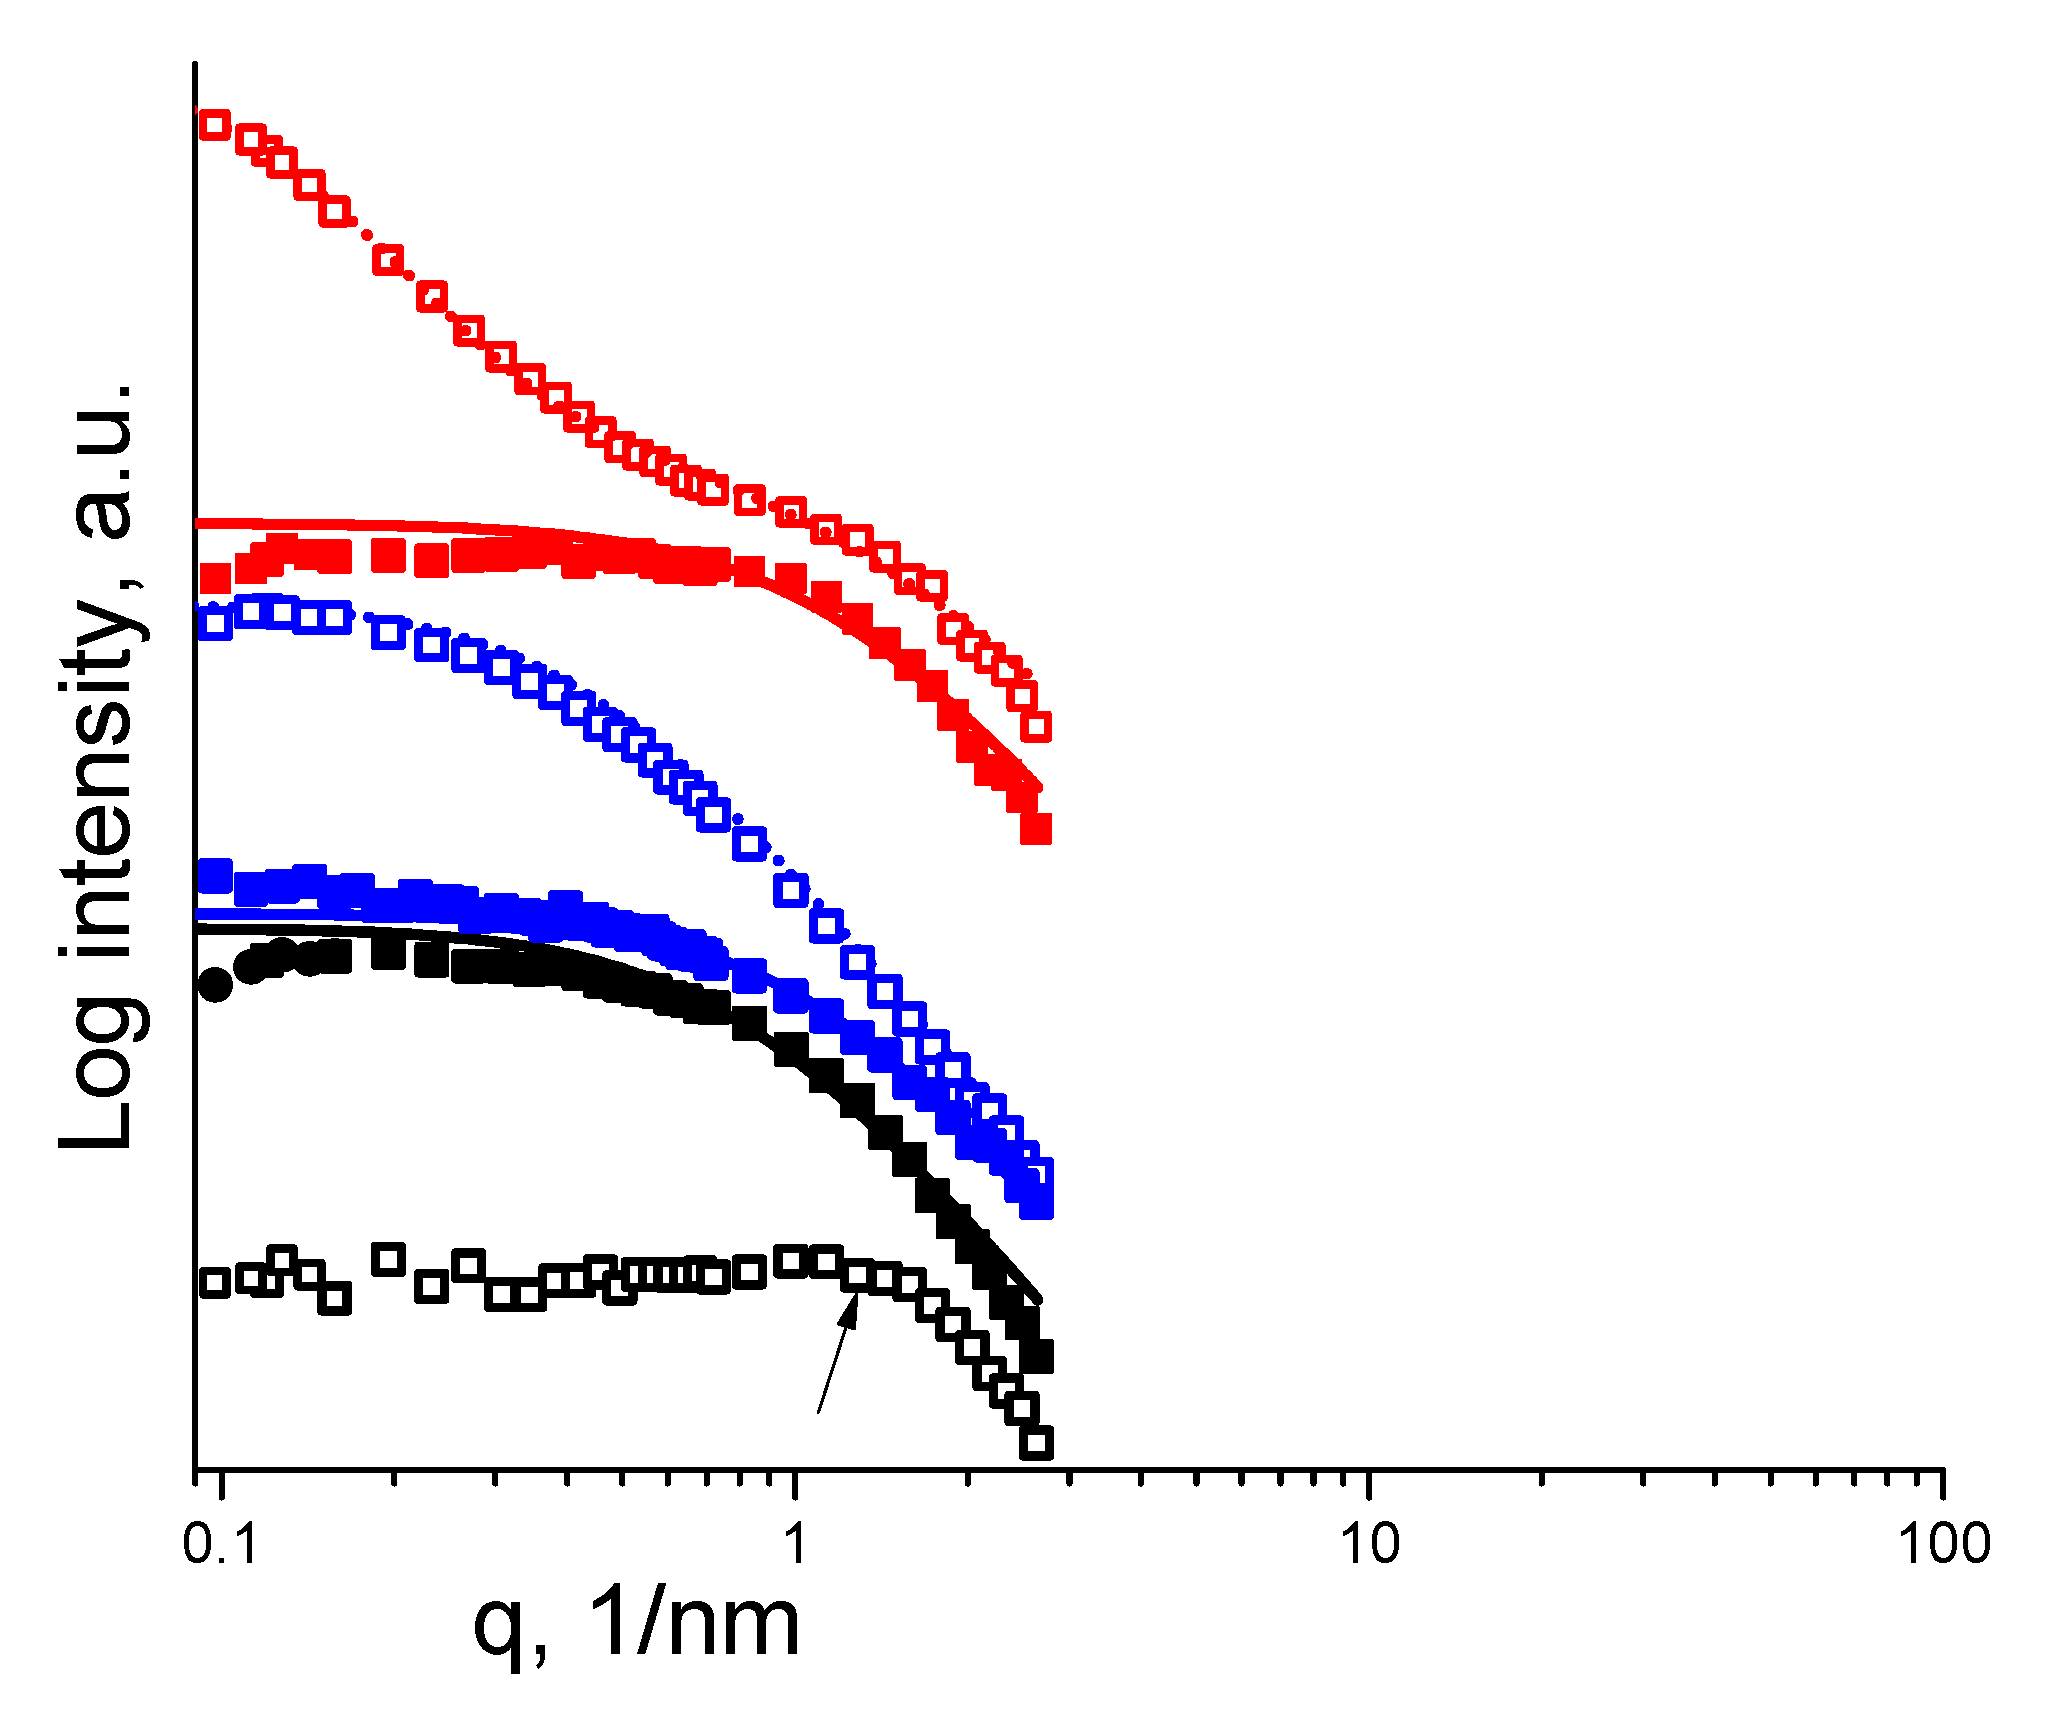
3.4. SAXS
4. Discussion and Conclusions
Author Contributions
Funding
Conflicts of Interest
References
- Zhang, Y.; Batys, P.; O’Neal, J.T.; Li, F.; Sammalkorpi, M.; Lutkenhaus, J.L. Molecular Origin of the Glass Transition in Polyelectrolyte Assemblies. ACS Cent. Sci. 2018, 4, 638–644. [Google Scholar] [CrossRef] [PubMed]
- Zhang, Y.; Li, F.; Valenzuela, L.D.; Sammalkorpi, M.; Lutkenhaus, J.L. Effect of Water on the Thermal Transition Observed in Poly(allylamine hydrochloride)—Poly(acrylic acid) Complexes. Macromolecules 2016, 49, 7563–7570. [Google Scholar] [CrossRef]
- Sappidi, P.; Natarajan, U. Polyelectrolyte conformational transition in aqueous solvent mixture influenced by hydrophobic interactions and hydrogen bonding effects: PAA–water–ethanol. J. Mol. Graph. Model. 2016, 64, 60–74. [Google Scholar] [CrossRef] [PubMed]
- Nová, L.; Uhlík, F.; Košovan, P. Local pH and effective pKA of weak polyelectrolytes—Insights from computer simulations. Phys. Chem. Chem. Phys. 2017, 19, 14376–14387. [Google Scholar] [CrossRef] [PubMed]
- Cohen, Y.; Prevysh, V. The structure of the interpolymer complex of poly(ethylene oxide) and poly(acrylic acid) in water—Dioxane mixtures. Acta Polym. 1998, 49, 539–543. [Google Scholar] [CrossRef]
- Hammouda, B.; Horkay, F.; Becker, M.L. Clustering and Solvation in Poly(acrylic acid) Polyelectrolyte Solutions. Macromolecules 2005, 38, 2019–2021. [Google Scholar] [CrossRef]
- Dobrynin, A.V.; Colby, R.H.; Rubinstein, M. Scaling Theory of Polyelectrolyte Solutions. Macromolecules 1995, 28, 1859–1871. [Google Scholar] [CrossRef]
- Marciel, A.B.; Srivastava, S.; Tirrell, M.V. Structure and rheology of polyelectrolyte complex coacervates. Soft Matter 2018, 14, 2454–2464. [Google Scholar] [CrossRef]
- Wang, Q.; Schlenoff, J.B. The Polyelectrolyte Complex/Coacervate Continuum. Macromolecules 2014, 47, 3108–3116. [Google Scholar] [CrossRef]
- Bellare, J.R.; Davis, H.T.; Scriven, L.E.; Talmon, Y. Controlled environment vitrification system: An improved sample preparation technique. J. Electron Microsc. Tech. 1988, 10, 87–111. [Google Scholar] [CrossRef]
- Daoud, M.; Cotton, J.P.; Farnoux, B.; Jannink, G.; Sarma, G.; Benoit, H.; Duplessix, R.; Picot, C.; Gennes, P.G.D. Solutions of Flexible Polymers—Neutron Experiments and Interpertation. Macromolecules 1975, 8, 804–818. [Google Scholar] [CrossRef]
- Hecht, A.-M.; Horkay, F.; Schleger, P.; Geissler, E. Thermal Fluctuations in Polymer Gels Investigated by Neutron Spin Echo and Dynamic Light Scattering. Macromolecules 2002, 35, 8552–8555. [Google Scholar] [CrossRef]
- Wroth, B.B.; Reid, E.E. The Solubility of Liquids in Liquids. The Partition of the Lower Alcohol Between Water and Cottonseed Oil. J. Am. Chem. Soc. 1916, 38, 2316–2325. [Google Scholar] [CrossRef]
- Weast, R.C. (Ed.) Handbook of Chemistry and Physics, 53rd ed.; Chemical Rubber Corporation: Cleveland, OH, USA, 1972. [Google Scholar]
- Muralidharan, S.S.; Natarajan, U. Behaviour of hydrogen bonding and structure of poly(acrylic acid) in water–ethanol solution investigated by explicit ion molecular dynamics simulations AU—Srikant, Sriram. Mol. Simul. 2013, 39, 145–153. [Google Scholar]
- Grunlan, J.C.; Liu, L.; Regev, O. Weak polyelectrolyte control of carbon nanotube dispersion in water. J. Colloid Interface Sci. 2008, 317, 346–349. [Google Scholar] [CrossRef]
- Gärdlund, L.; Wågberg, L.; Norgren, M. New insights into the structure of polyelectrolyte complexes. J. Colloid Interface Sci. 2007, 312, 237–246. [Google Scholar] [CrossRef] [PubMed]
- Colby, R.H. Structure and linear viscoelasticity of flexible polymer solutions: comparison of polyelectrolyte and neutral polymer solutions. Rheol. Acta 2010, 49, 425–442. [Google Scholar] [CrossRef]
- Essafi, W.; Lafuma, F.; Williams, C. Effect of Solvent Quality on the Behaviour of Highly Charged Polyelectrolytes. J. De Phys. II 1995, 5, 1269–1275. [Google Scholar] [CrossRef]
- Spruijt, E.; Leermakers, F.A.M.; Fokkink, R.; Schweins, R.; van Well, A.A.; Stuart, M.A.C.; van der Gucht, J. Structure and Dynamics of Polyelectrolyte Complex Coacervates Studied by Scattering of Neutrons, X-rays, and Light. Macromolecules 2013, 46, 4596–4605. [Google Scholar] [CrossRef]
- Fares, H.M.; Ghoussoub, Y.E.; Delgado, J.D.; Fu, J.; Urban, V.S.; Schlenoff, J.B. Scattering Neutrons along the Polyelectrolyte Complex/Coacervate Continuum. Macromolecules 2018, 51, 4945–4955. [Google Scholar] [CrossRef]
- Boas, M.; Zussman, E. PH Responsive Polyelectrolyte-Complex Fibers. In Proceedings of the 12th International Symposium on Polyelectrolytes, Wageningen, The Netherlands, 27–31 August 2018. [Google Scholar]
- Chremos, A.; Douglas, J.F. Polyelectrolyte association and solvation. J. Chem. Phys. 2018, 149, 163305. [Google Scholar] [CrossRef] [PubMed]
- Zhang, Y.; Douglas, J.F.; Ermi, B.D.; Amis, E.J. Influence of counterion valency on the scattering properties of highly charged polyelectrolyte solutions. J. Chem. Phys. 2001, 114, 3299–3313. [Google Scholar] [CrossRef]
- Boas, M.; Gradys, A.; Vasilyev, G.; Burman, M.; Zussman, E. Electrospinning polyelectrolyte complexes: pH-responsive fibers. Soft Matter 2015, 11, 1739–1747. [Google Scholar] [CrossRef] [PubMed]


 , PAA—
 .
, PAA—.
.
, PAA—.

| Water/Ethanol | 100/0 | 80/20 | 60/40 | 40/60 |
|---|---|---|---|---|
| Relative viscosity | 158 | 169 | 329 | 275 |
| Sample Solvent | PAH Water | PAH Water/Ethanol | PAA Water | PAA Water/Ethanol | PECs Water | PECs Water/Ethanol |
|---|---|---|---|---|---|---|
| ξ(nm), ξi(nm) | 0.46 * | 1.24 | 2.37 | 0.73 | 0.9, 7.8 | 0.72 |
© 2019 by the authors. Licensee MDPI, Basel, Switzerland. This article is an open access article distributed under the terms and conditions of the Creative Commons Attribution (CC BY) license (http://creativecommons.org/licenses/by/4.0/).
Share and Cite
Boas, M.; Vasilyev, G.; Vilensky, R.; Cohen, Y.; Zussman, E. Structure and Rheology of Polyelectrolyte Complexes in the Presence of a Hydrogen-Bonded Co-Solvent. Polymers 2019, 11, 1053. https://doi.org/10.3390/polym11061053
Boas M, Vasilyev G, Vilensky R, Cohen Y, Zussman E. Structure and Rheology of Polyelectrolyte Complexes in the Presence of a Hydrogen-Bonded Co-Solvent. Polymers. 2019; 11(6):1053. https://doi.org/10.3390/polym11061053
Chicago/Turabian StyleBoas, Mor, Gleb Vasilyev, Rita Vilensky, Yachin Cohen, and Eyal Zussman. 2019. "Structure and Rheology of Polyelectrolyte Complexes in the Presence of a Hydrogen-Bonded Co-Solvent" Polymers 11, no. 6: 1053. https://doi.org/10.3390/polym11061053
APA StyleBoas, M., Vasilyev, G., Vilensky, R., Cohen, Y., & Zussman, E. (2019). Structure and Rheology of Polyelectrolyte Complexes in the Presence of a Hydrogen-Bonded Co-Solvent. Polymers, 11(6), 1053. https://doi.org/10.3390/polym11061053