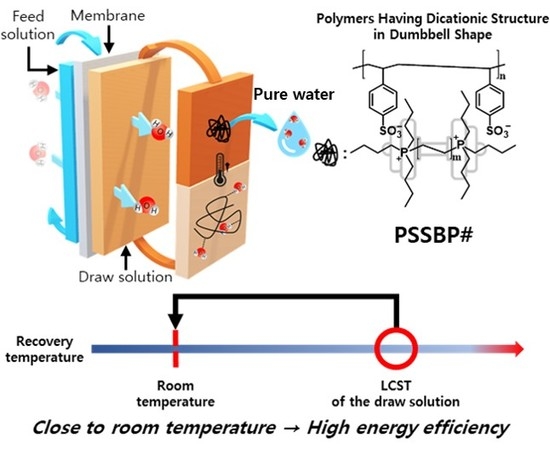
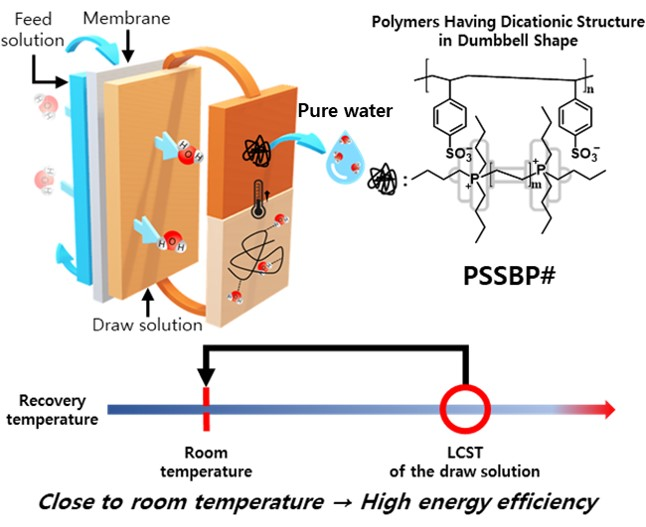
Polymer Having Dicationic Structure in Dumbbell Shape for Forward Osmosis Process

Abstract
:
1. Introduction
2. Materials and Methods
2.1. Materials and Instrumentation
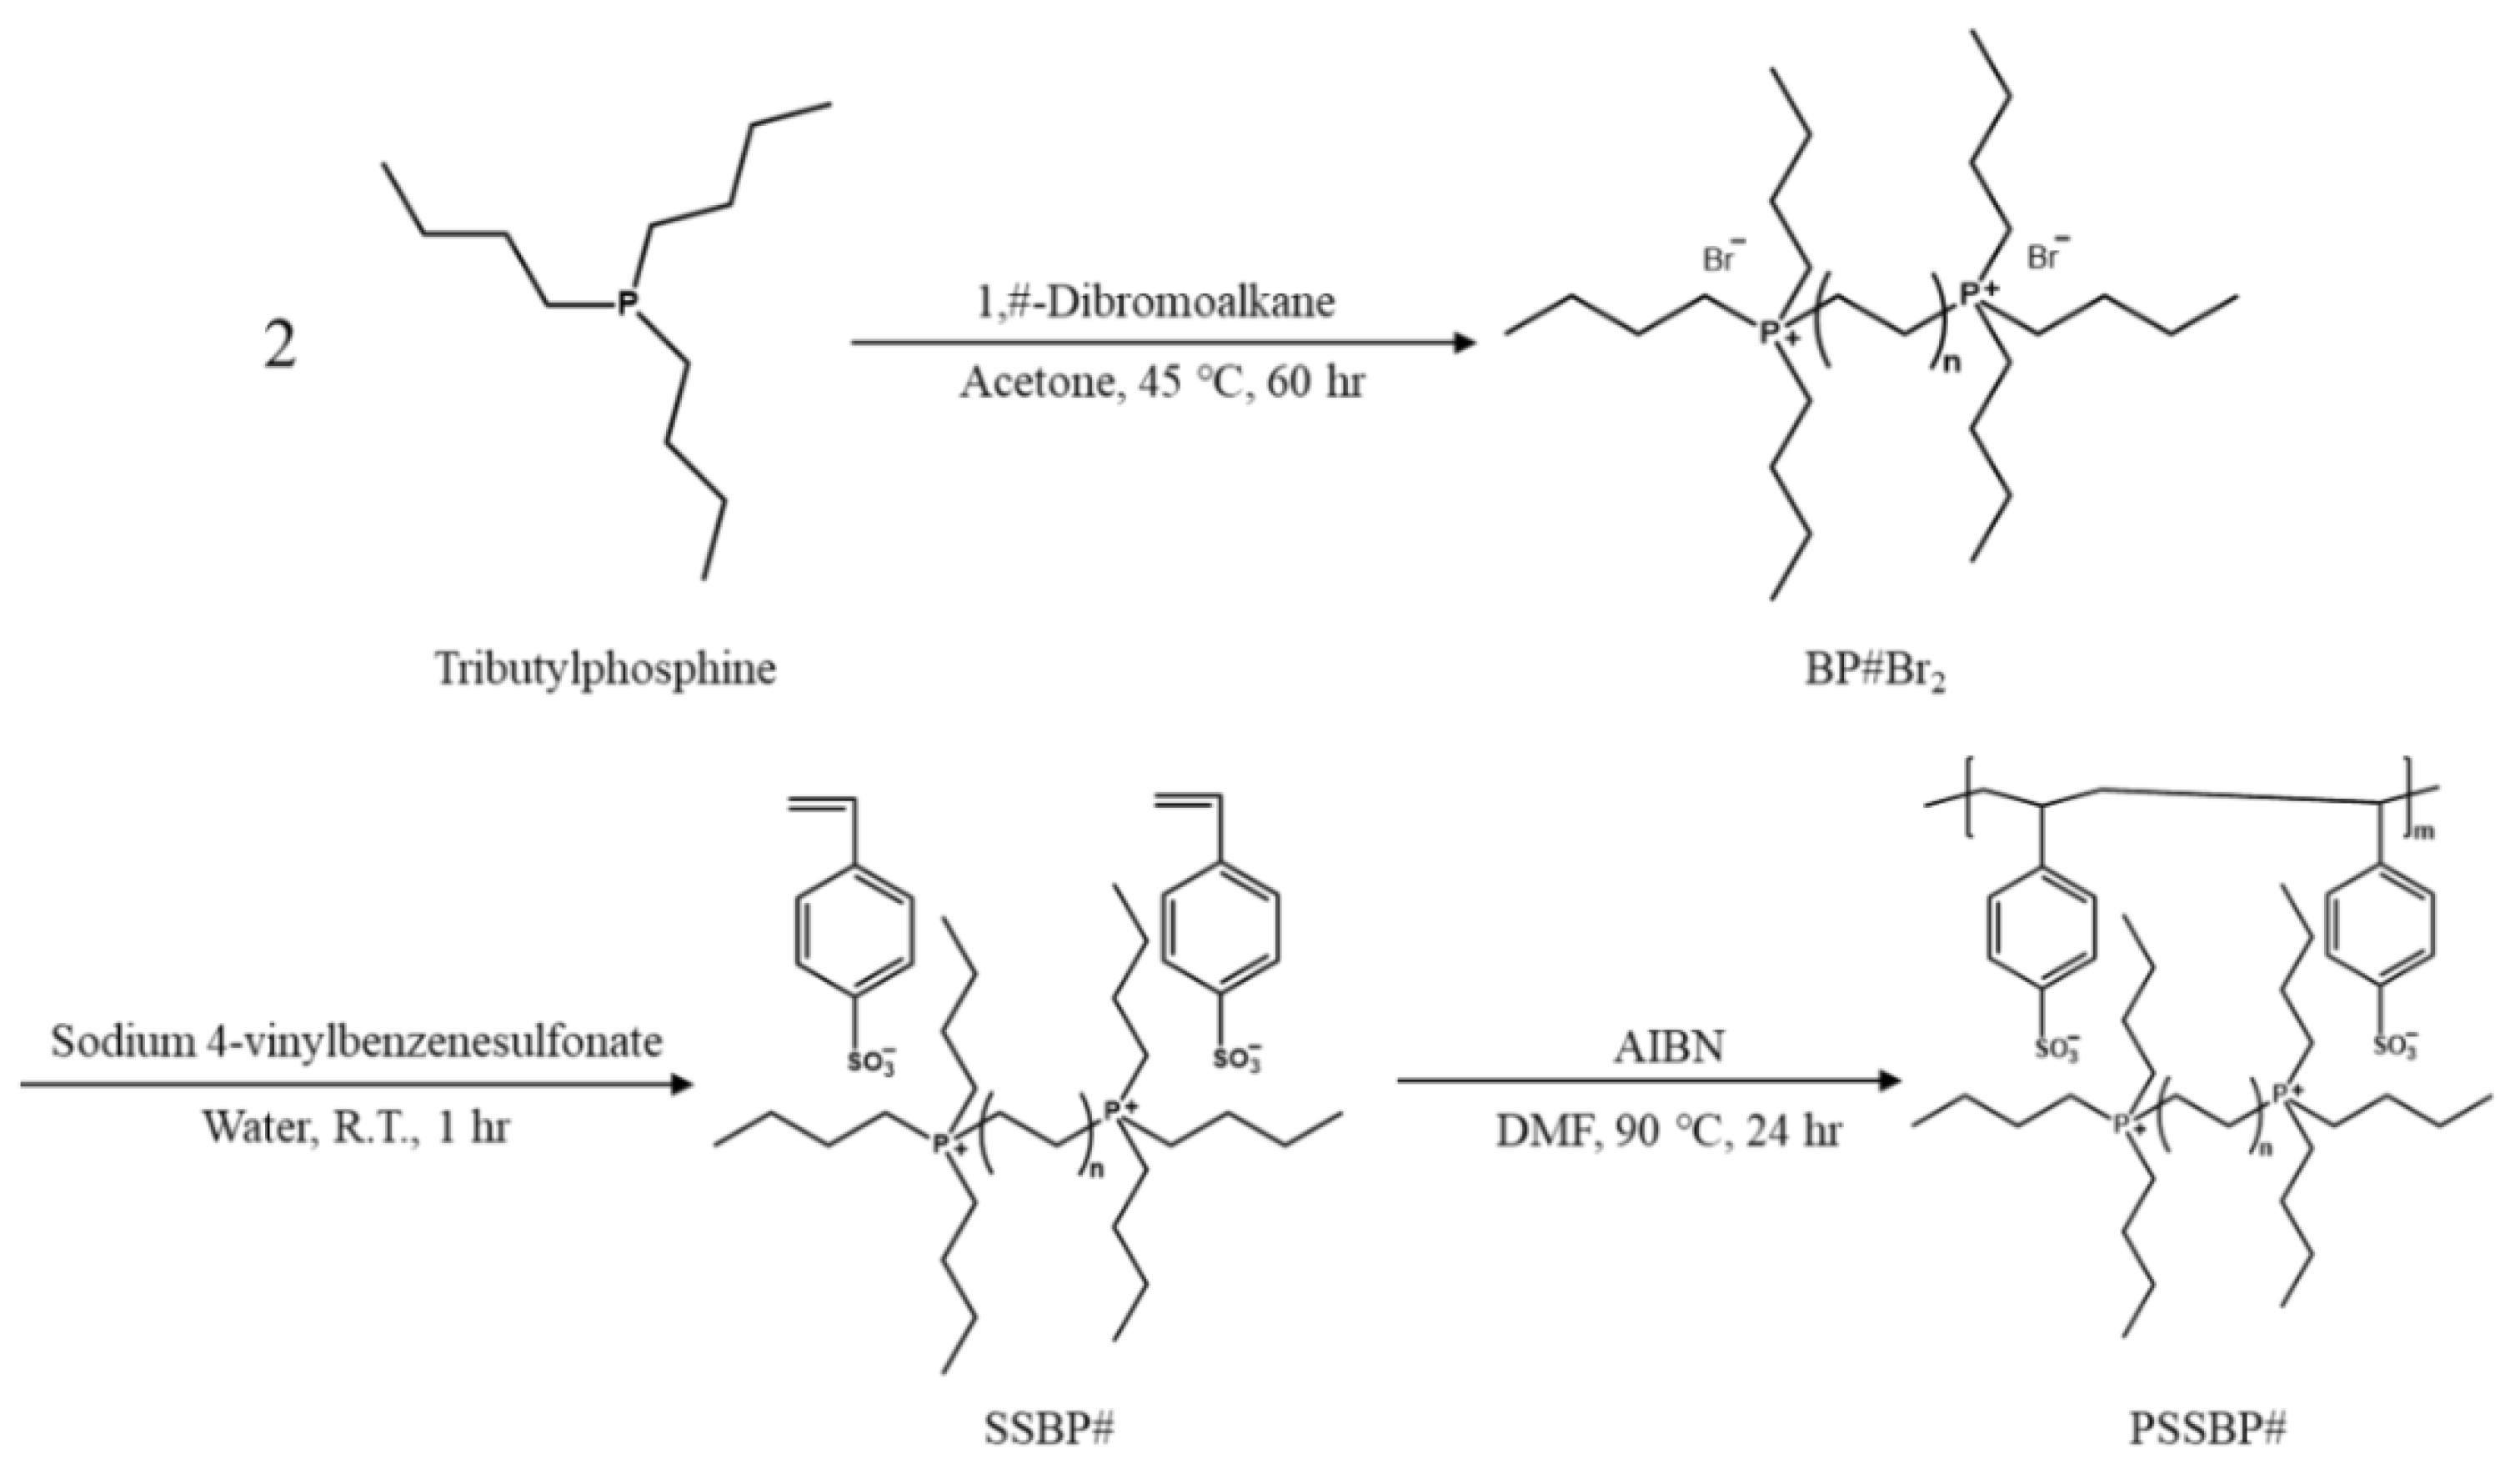
2.2. Preparation of Alkane-1,#-diylbis(tri-n-butylphosphonium) Bromide (BP#Br2)
2.3. Preparation of Alkane-1,#-diylbis(tri-n-butylphosphonium) 4-vinylbenzenesulfonate (SSBP#) and Tetrabutylphosphonium 4-vinylbenzenesulfonate (SSMP)
2.4. Synthesis of Poly(alkane-1,#-diylbis(tri-n-butylphosphonium) 4-vinylbenzenesulfonate) (PSSBP#) and Poly(tetrabutylphosphonium 4-vinylbenzenesulfonate) (PSSMP)
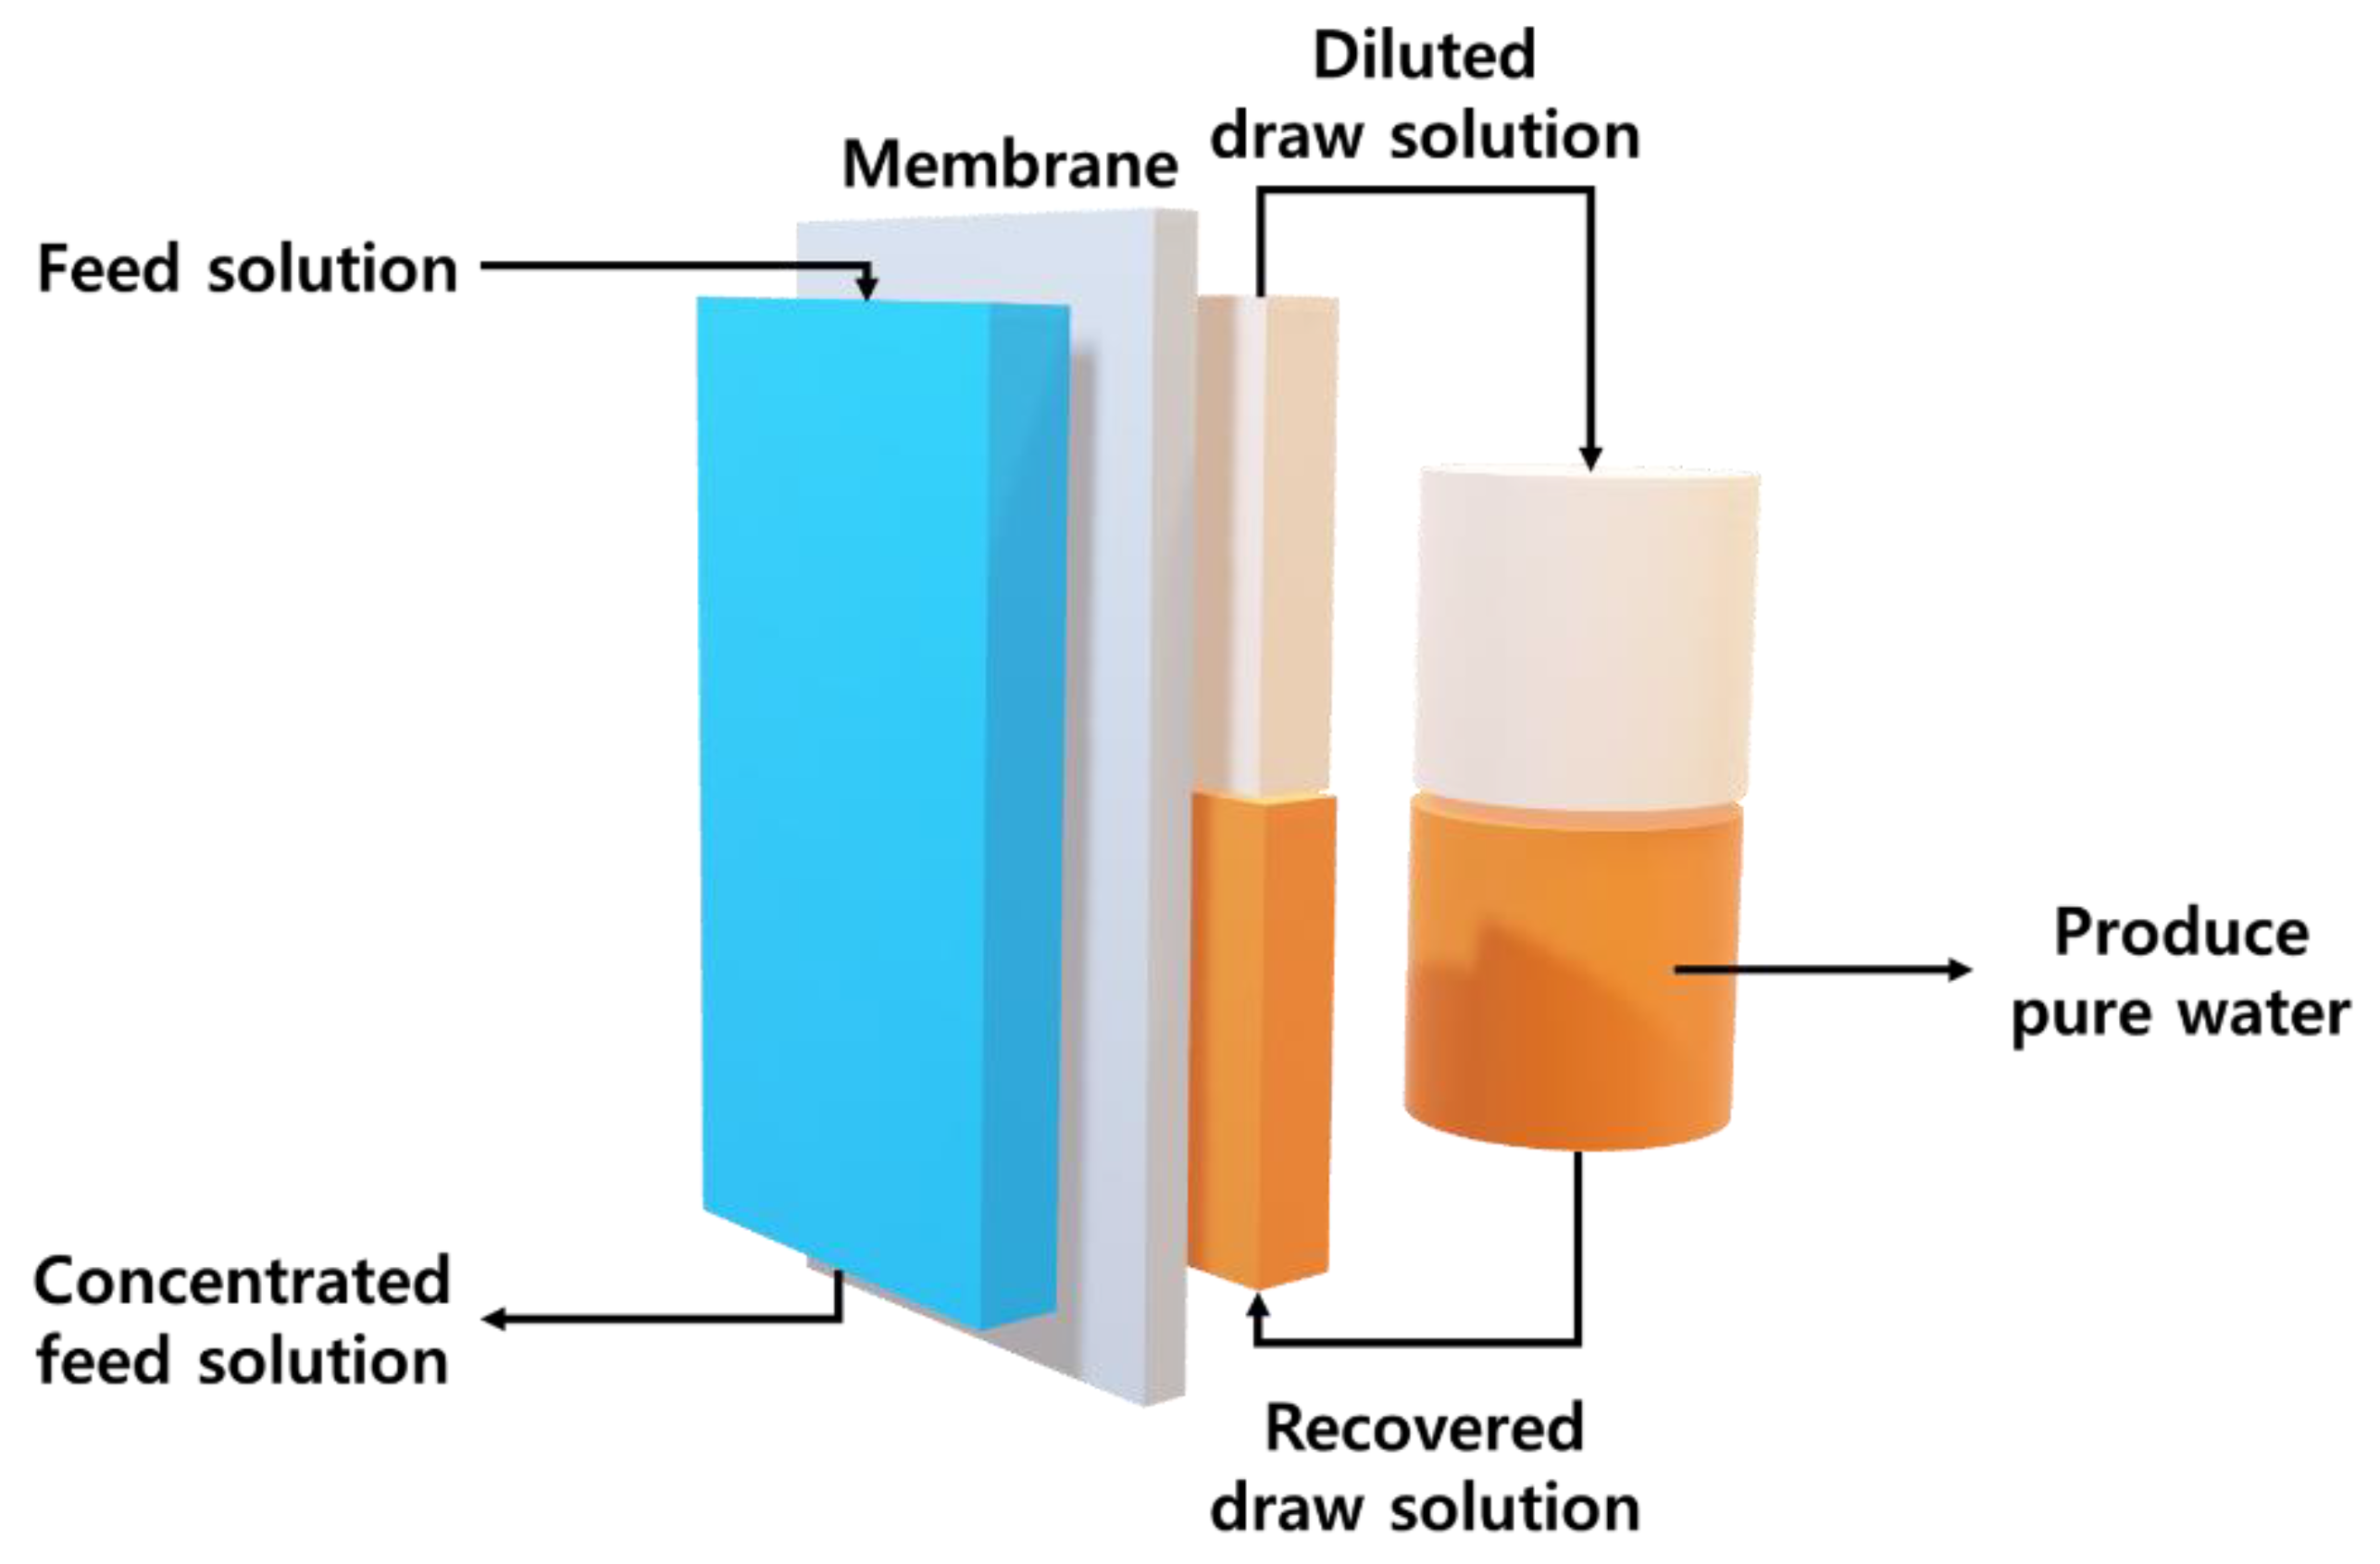
2.5. FO Performance
3. Results and Discussion
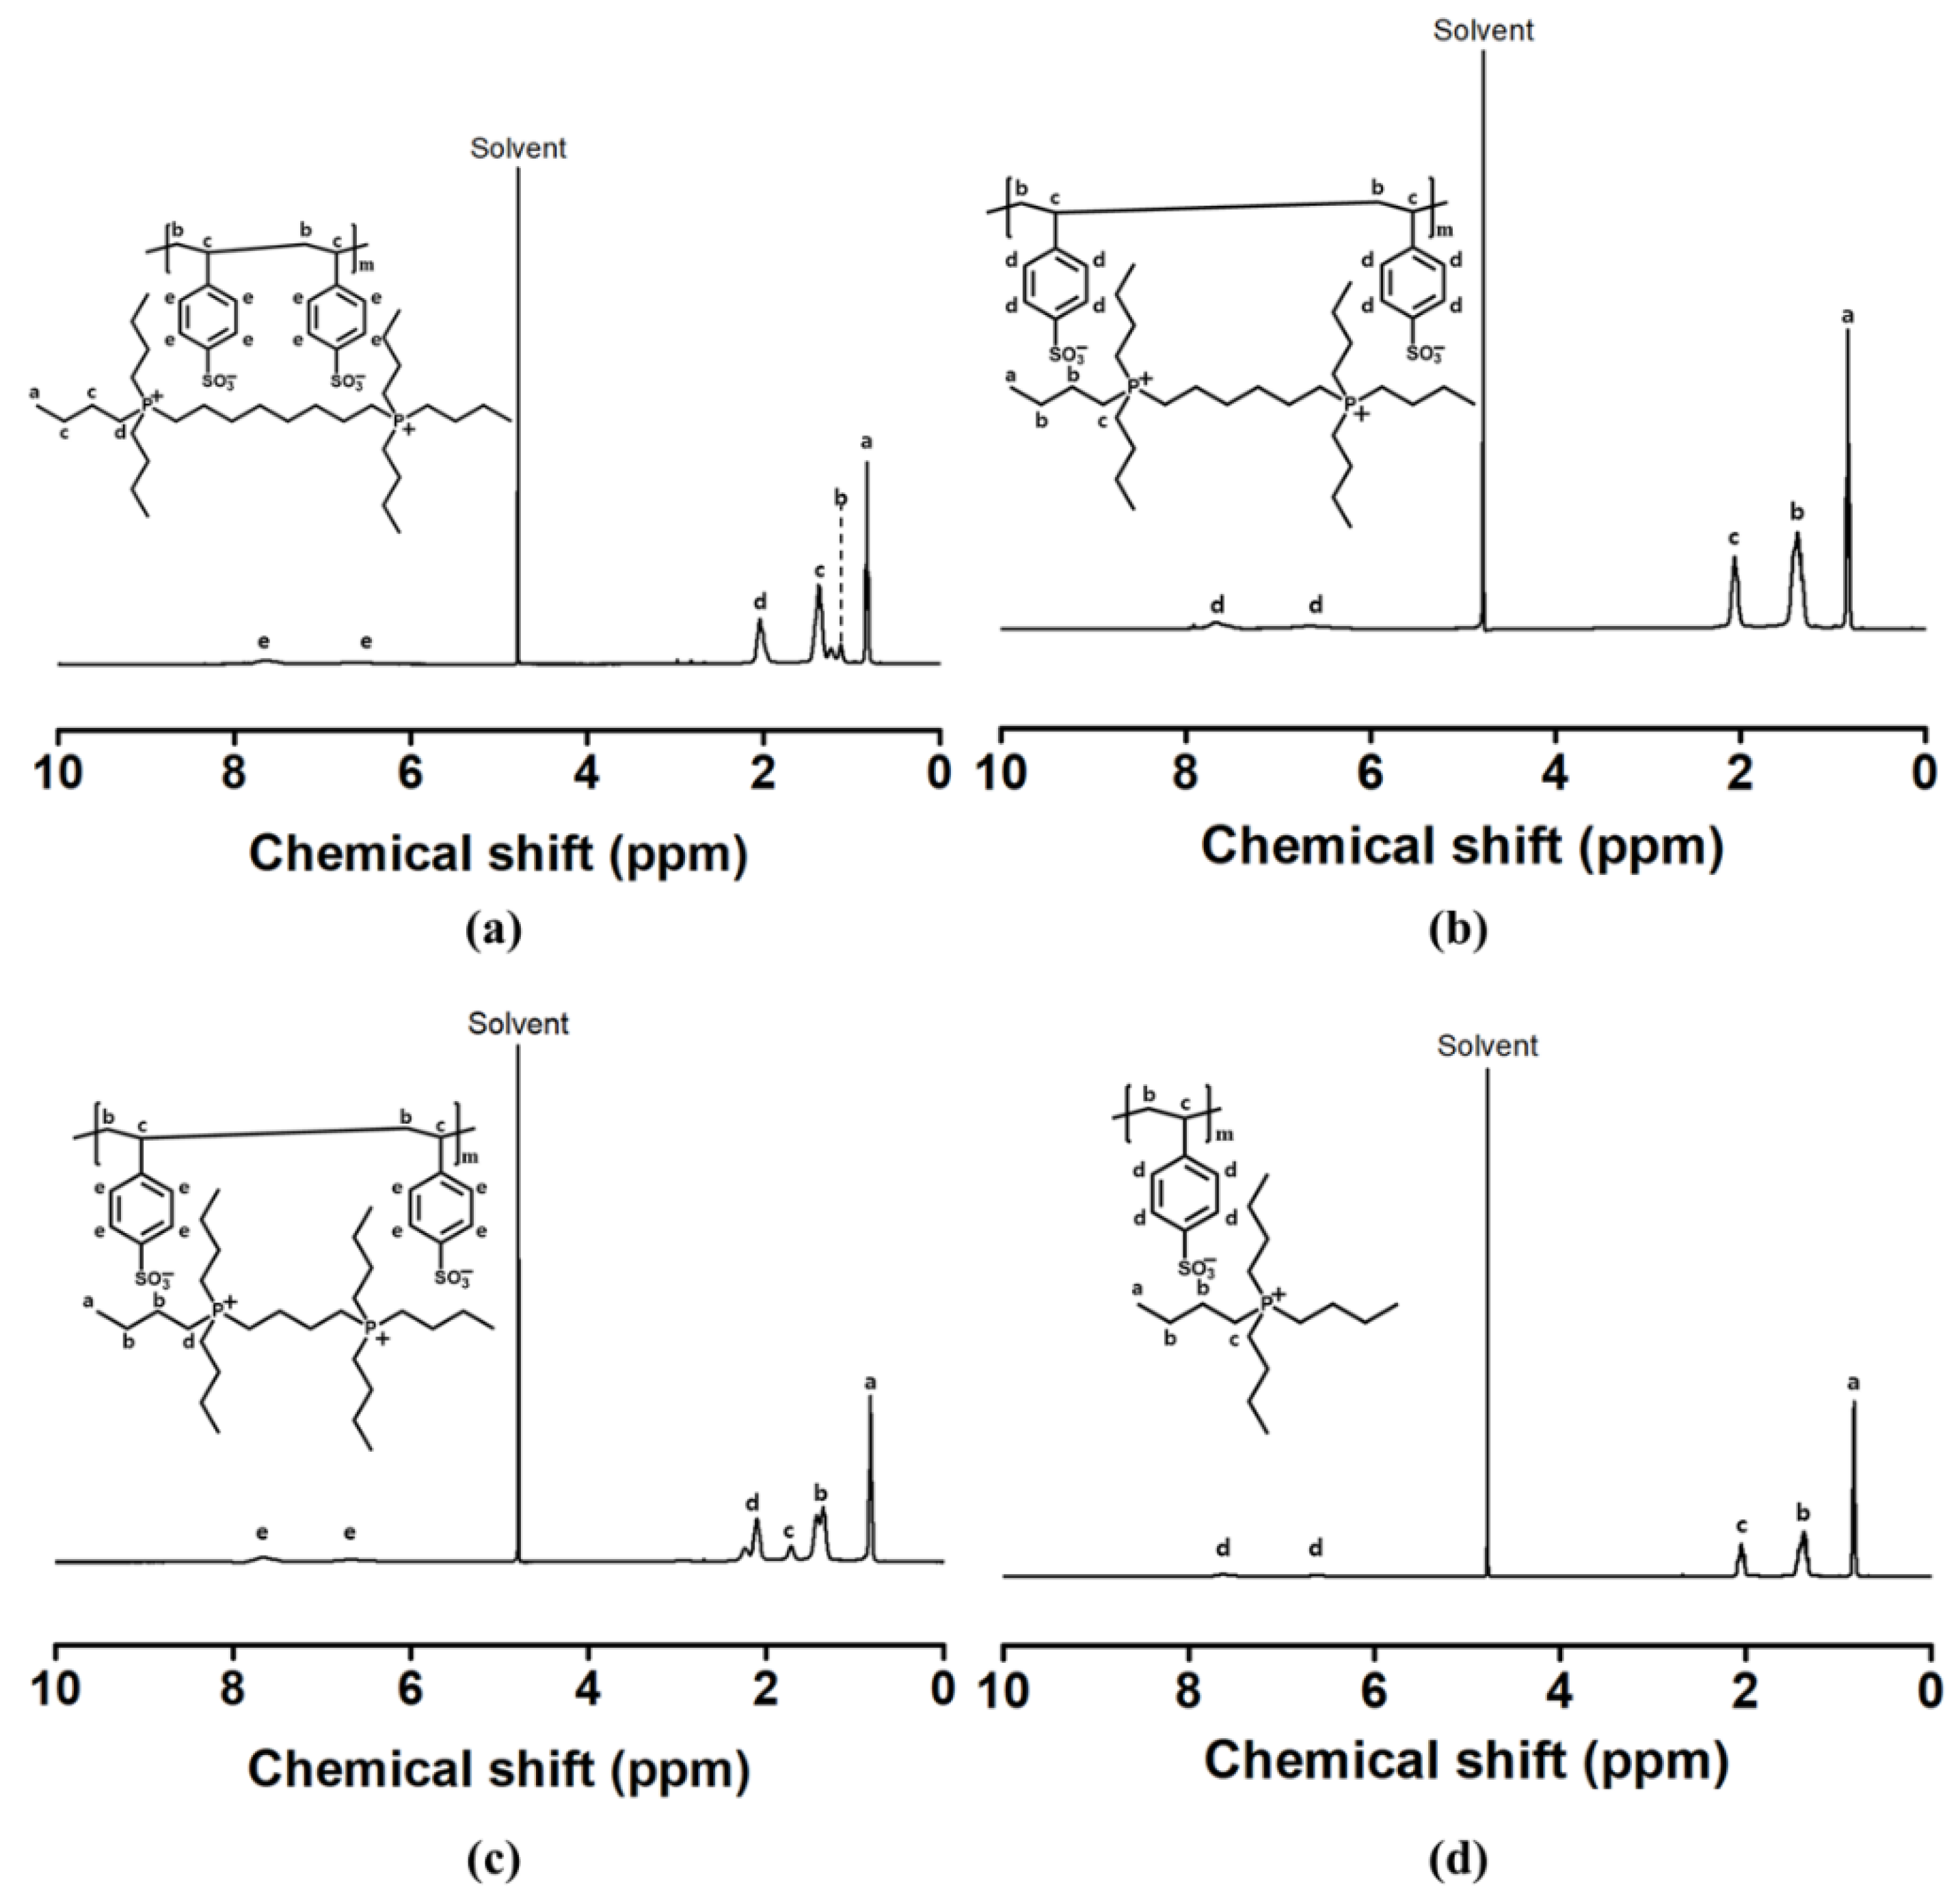
3.1. Synthesis and Characterization of Poly(alkane-1,#-diylbis(tri-n-butylphosphonium) 4-vinylbenzene-sulfonate) (PSSBP#)
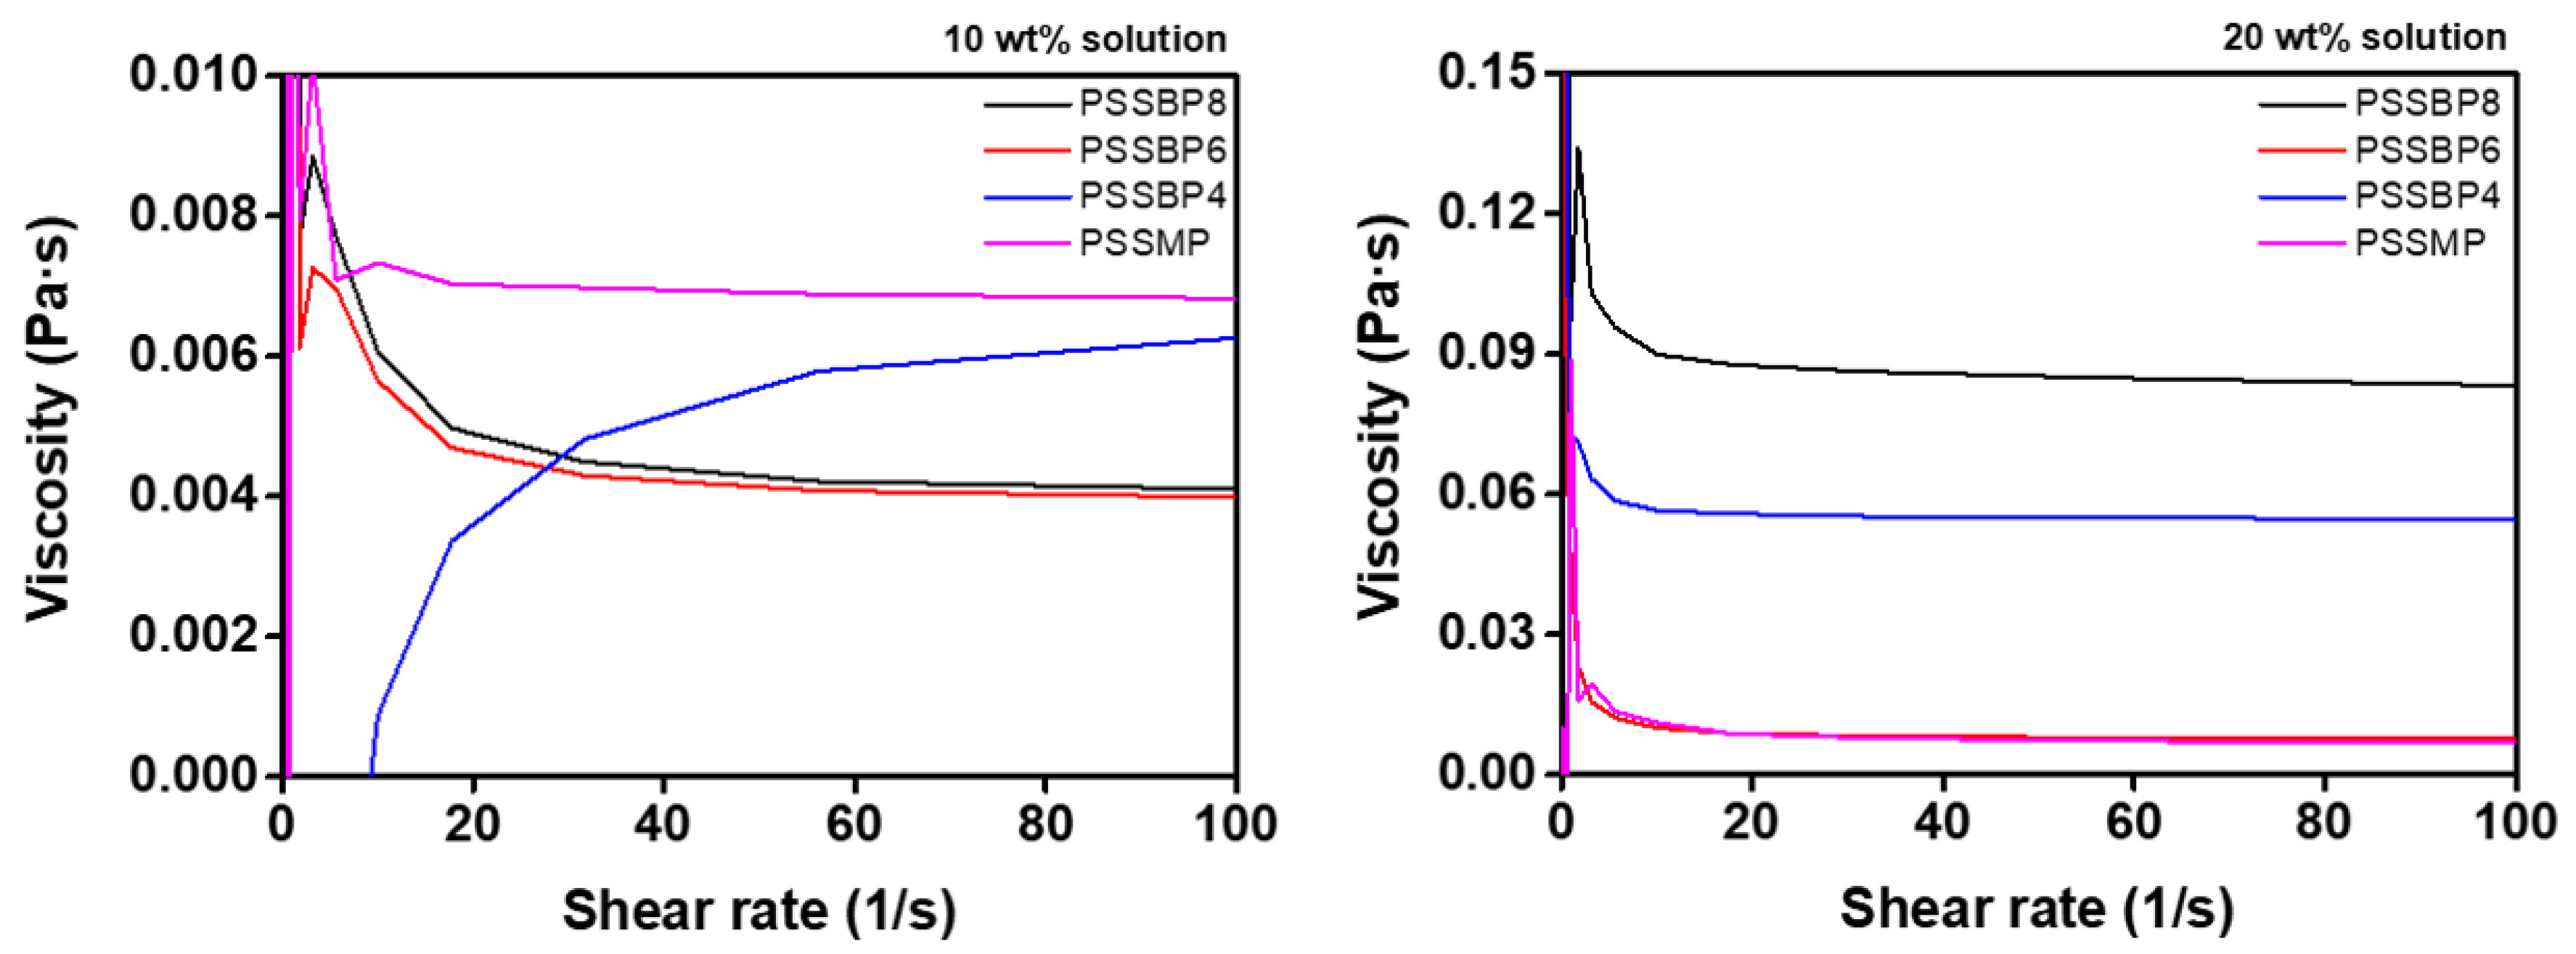
3.2. Viscosity
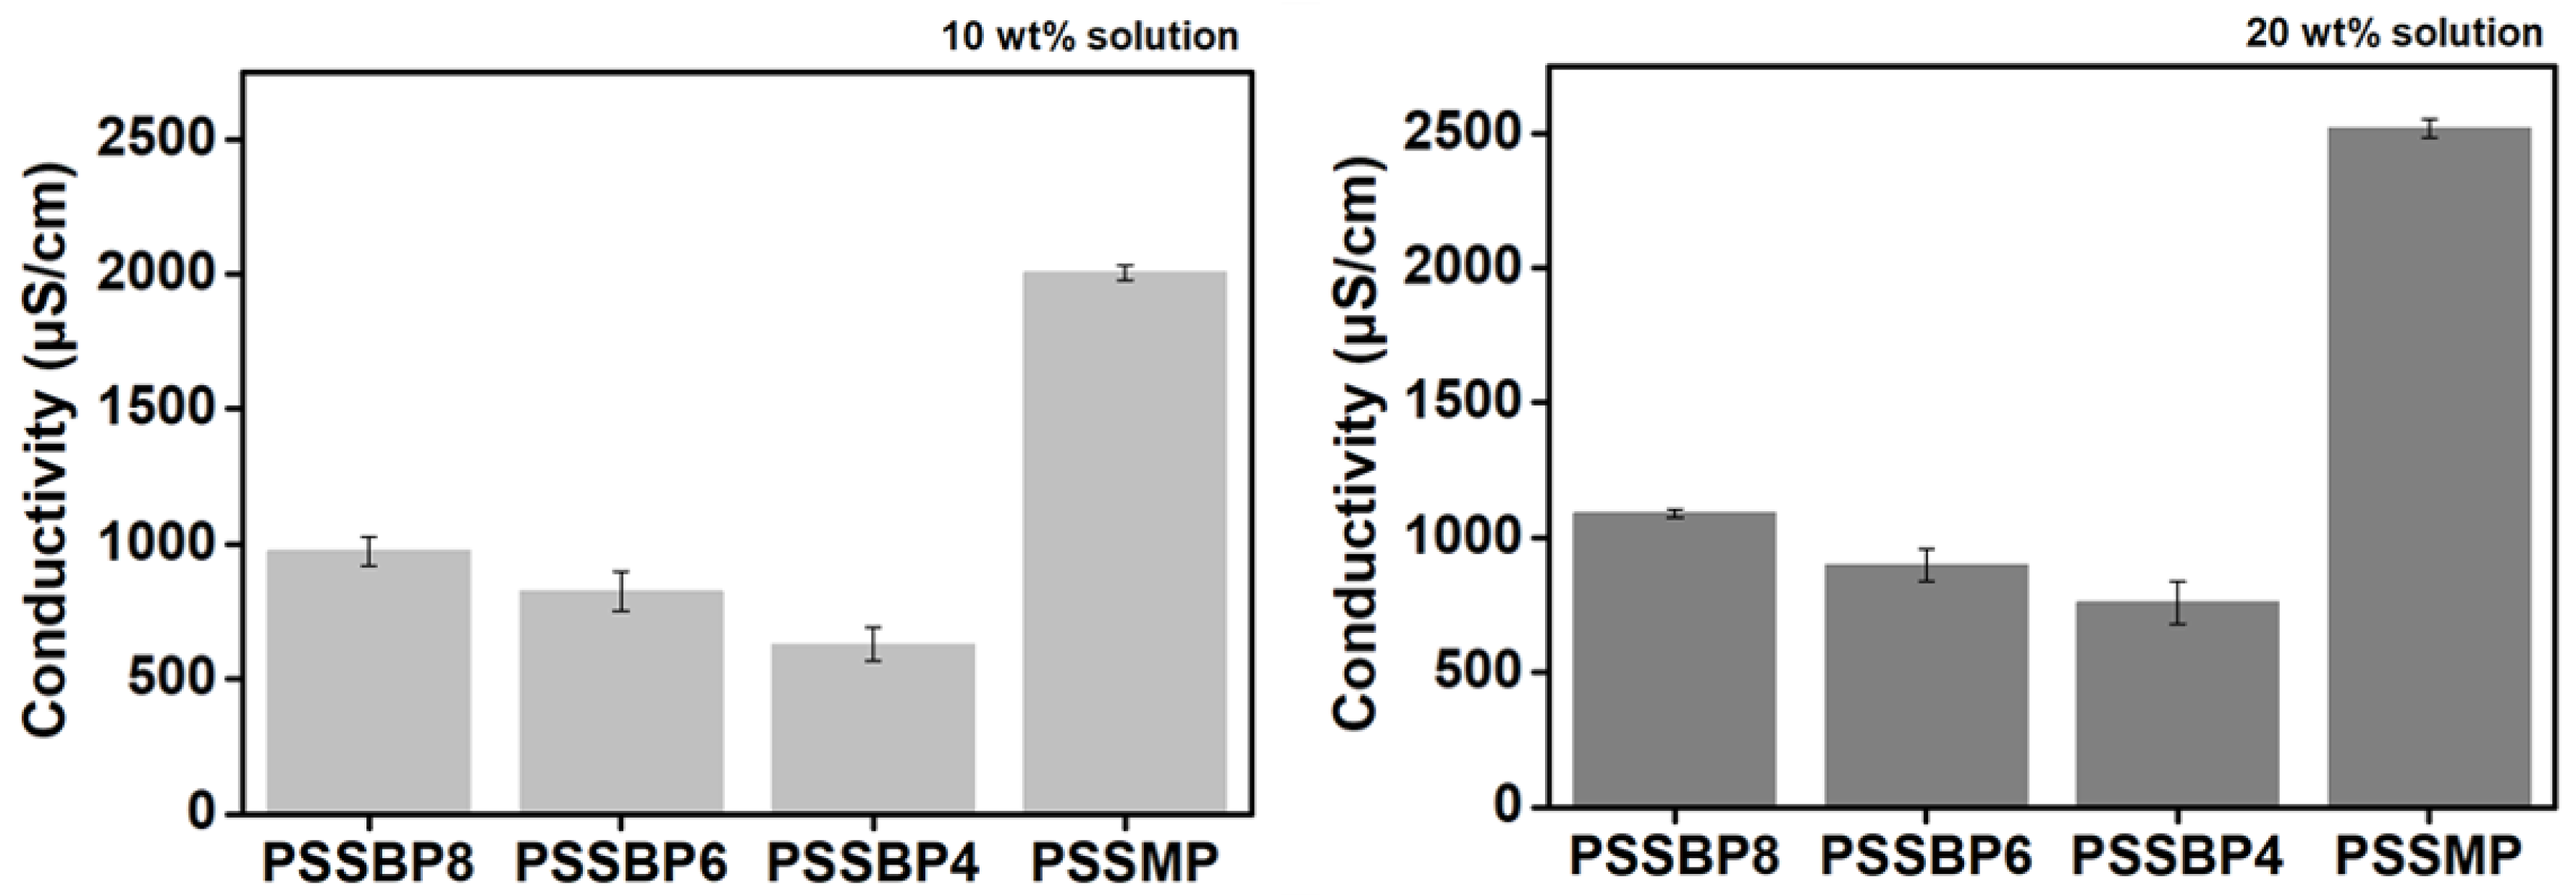
3.3. Conductivity
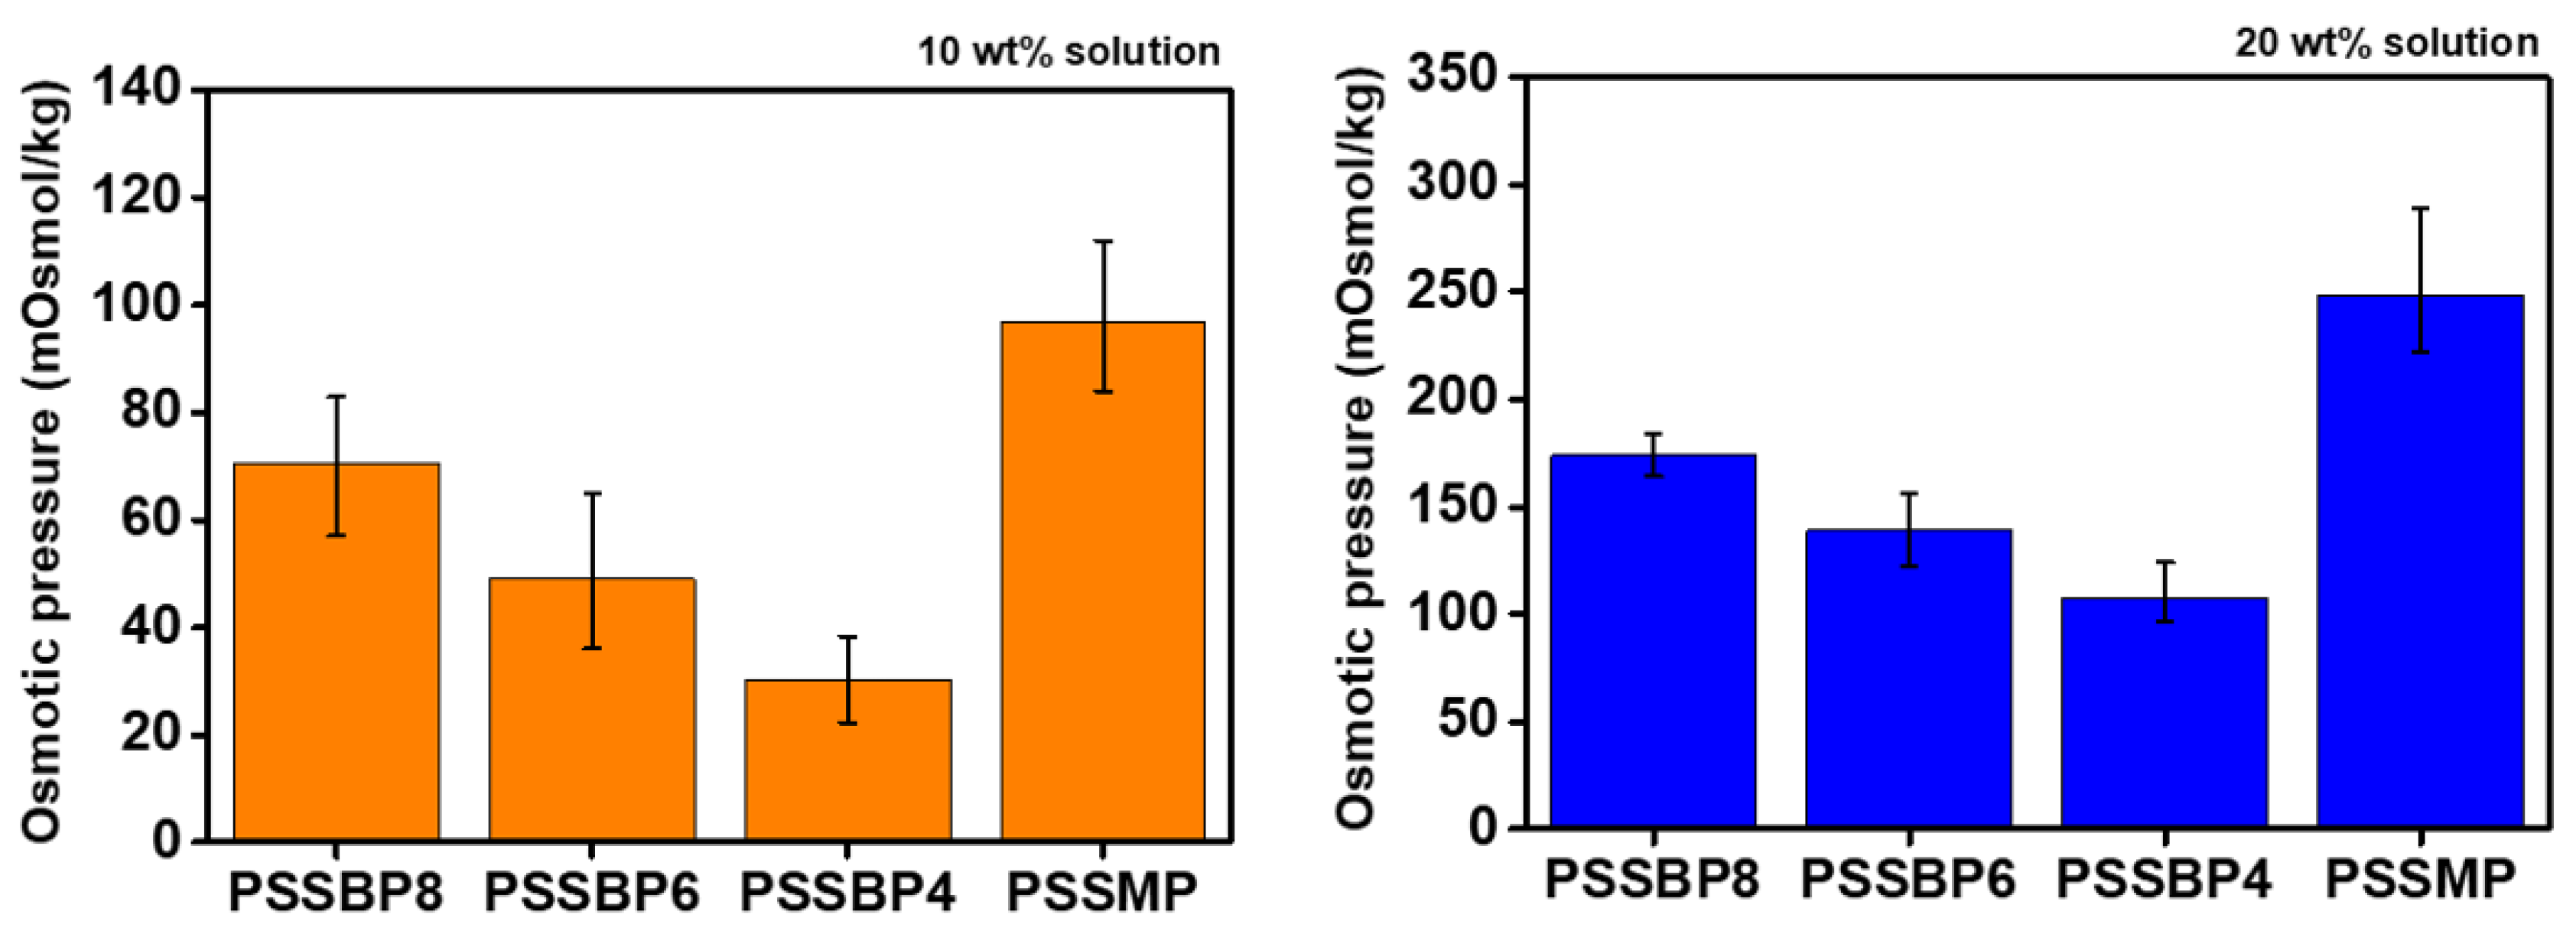
3.4. Osmotic Pressure
3.5. Recovery Properties
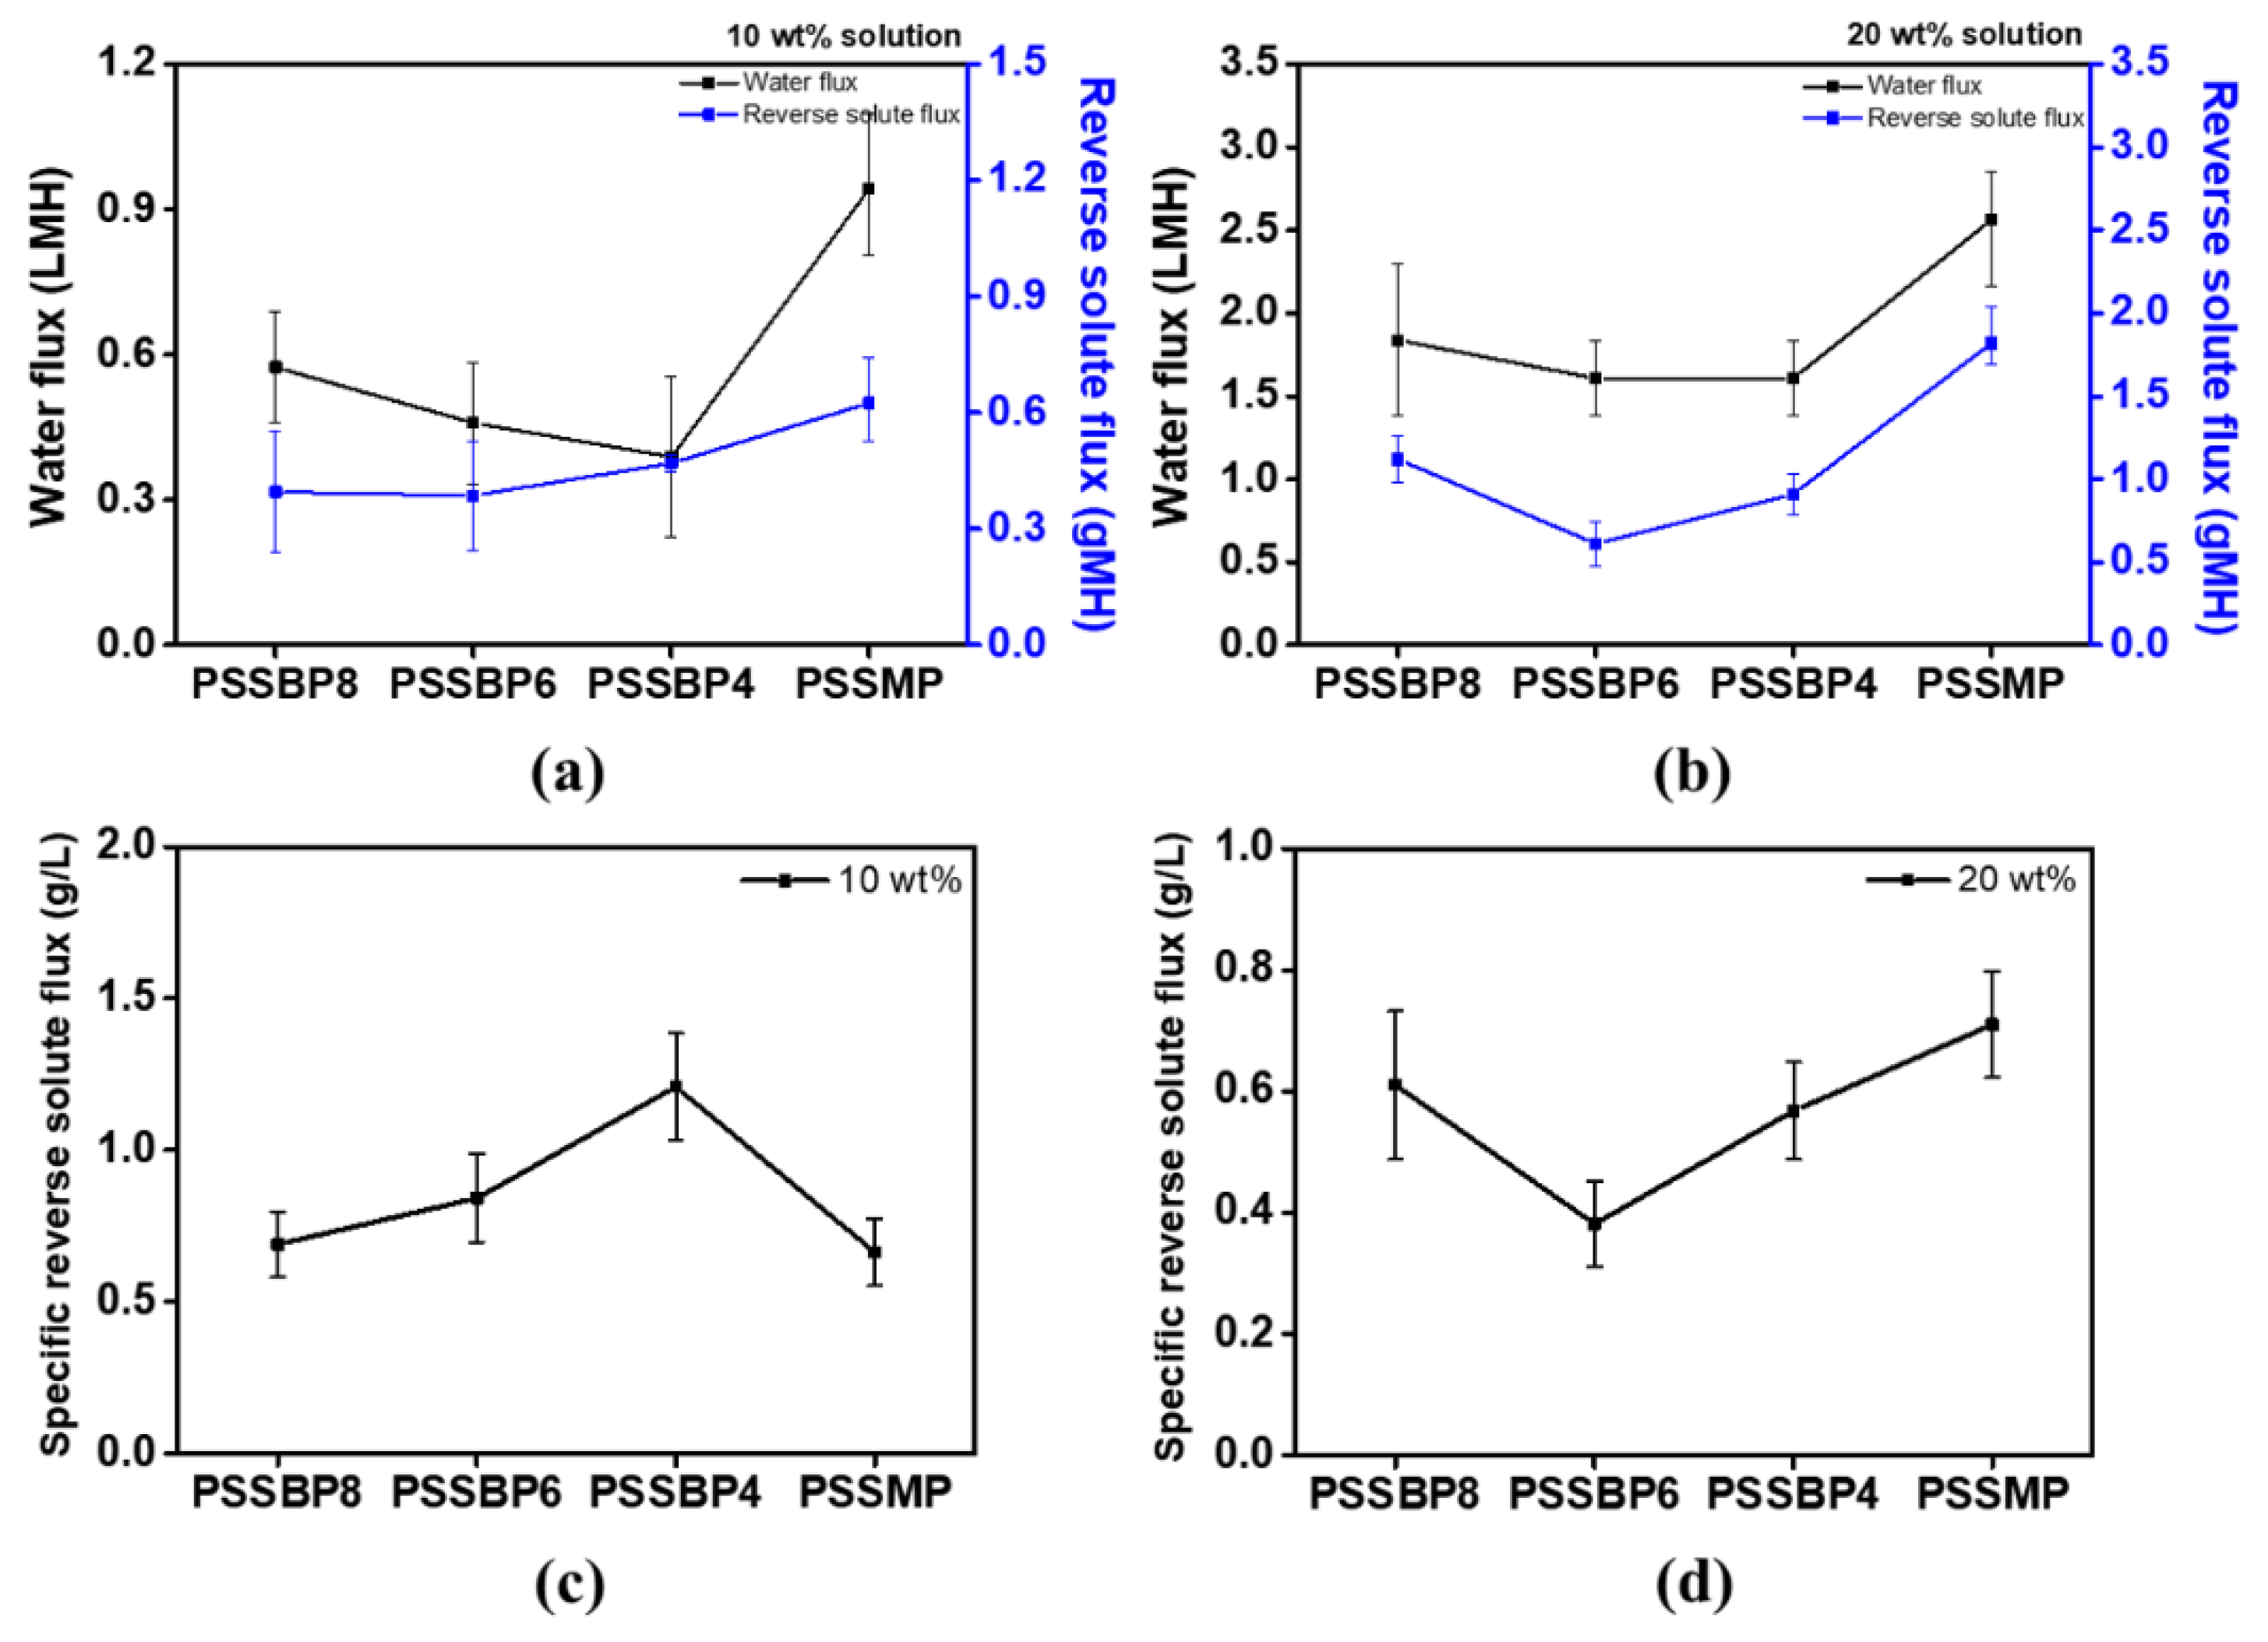
3.6. Water and Reverse Solute Fluxes
4. Conclusions
Supplementary Materials
Author Contributions
Funding
Conflicts of Interest
References
- Rahman, M.S.; Ahmed, M.; Chen, X.D. Freezing-melting process and desalination: Review of present status and future prospects. Int. J. Nucl. Desalin. 2007, 2, 253–264. [Google Scholar] [CrossRef]
- Dodge, B.F. Review of distillation processes for the recovery of fresh water from saline waters. Adv. Chem. Ser. 1963, 38, 1–26. [Google Scholar]
- Saadat, A.H.M.; Islam, M.S.; Islam, M.S.; Parvin, F.; Sultana, A. Desalination technologies for developing countries: A review. J. Sci. Res. 2018, 10, 77–97. [Google Scholar]
- Baker, R.W. Ultrafilteration. In Membrane Technology and Applications, 3rd ed.; John Wiley & Sons: Hoboken, NJ, USA, 2012. [Google Scholar]
- Shaffer, D.L.; Werber, J.R.; Jaramillo, H.; Lin, S.; Elimelech, M. Forward osmosis: Where are we now? Desalination 2015, 356, 271–284. [Google Scholar] [CrossRef]
- Cath, T.Y.; Gormly, S.; Beaudry, E.G.; Flynn, M.T.; Adams, V.D.; Childress, A.E. Membrane contactor processes for wastewater reclamation in space: Part I. Direct osmotic concentration as pretreatment for reverse osmosis. J. Membr. Sci. 2005, 257, 85–98. [Google Scholar] [CrossRef]
- McCutcheon, J.R.; McGinnis, R.L.; Elimelech, M. Desalination by ammonia–carbon dioxide forward osmosis: Influence of draw and feed solution concentrations on process performance. J. Membr. Sci. 2006, 278, 114–123. [Google Scholar] [CrossRef]
- McCutcheon, J.R.; McGinnis, R.L.; Elimelech, M. A novel ammonia—Carbon dioxide forward (direct) osmosis desalination process. Desalination 2005, 174, 1–11. [Google Scholar] [CrossRef]
- Stone, M.L.; Rae, C.; Stewart, F.F.; Wilson, A.D. Switchable polarity solvents as draw solutes for forward osmosis. Desalination 2013, 312, 124–129. [Google Scholar] [CrossRef]
- Luo, H.; Wang, Q.; Zhang, T.C.; Tao, T.; Zhou, A.; Chen, L.; Bie, X. A review on the recovery methods of draw solutes in forward osmosis. J. Water Process Eng. 2014, 4, 212–223. [Google Scholar] [CrossRef]
- Lutchmiah, K.; Post, J.W.; Rietveld, L.C.; Cornelissen, E.R. EDTA: A synthetic draw solute for forward osmosis. Water Sci. Technol. 2014, 70, 1677–1682. [Google Scholar] [CrossRef] [PubMed]
- Frank, B.S. Desalination of sea water. U.S. Patent 3670897A, 20 June 1972. [Google Scholar]
- Kim, T.; Ju, C.; Kang, H. Phytochemical-based tannic acid derivatives as draw solutes for forward osmosis process. Membr. J. 2018, 28, 157–168. [Google Scholar] [CrossRef]
- Liu, Z.; Bai, H.; Lee, J.; Sun, D.D. A low-energy forward osmosis process to produce drinking water. Energy Environ. Sci. 2011, 4, 2582–2585. [Google Scholar] [CrossRef]
- Alnaizy, R.; Aidan, A.; Qasim, M. Draw solute recovery by metathesis precipitation in forward osmosis desalination. Desalin. Water Treat. 2013, 51, 5516–5525. [Google Scholar] [CrossRef]
- Cai, Y.; Shen, W.; Wang, R.; Krantz, W.B.; Fane, A.G.; Hu, X. CO2 switchable dual responsive polymers as draw solutes for forward osmosis desalination. Chem. Comm. 2013, 49, 8377–8379. [Google Scholar] [CrossRef]
- Ge, Q.; Su, J.; Chung, T.-S.; Amy, G. Hydrophilic superparamagnetic nanoparticles: Synthesis, characterization, and performance in forward osmosis processes. Ind. Eng. Chem. Res. 2011, 50, 382–388. [Google Scholar] [CrossRef]
- Ling, M.M.; Wang, K.Y.; Chung, T.-S. Highly water-soluble magnetic nanoparticles as novel draw solutes in forward osmosis for water reuse. Ind. Eng. Chem. Res. 2010, 49, 5869–5876. [Google Scholar] [CrossRef]
- Dey, P.; Izake, E.L. Magnetic nanoparticles boosting the osmotic efficiency of a polymeric FO draw agent: Effect of polymer conformation. Desalination 2015, 373, 79–85. [Google Scholar] [CrossRef]
- Bai, H.; Liu, Z.; Sun, D.D. Highly water soluble and recovered dextran coated Fe3O4 magnetic nanoparticles for brackish water desalination. Sep. Purif. Technol. 2011, 81, 392–399. [Google Scholar] [CrossRef]
- Shakeri, A.; Salehi, H.; Khankeshipour, N.; Nakhjiri, M.T.; Ghorbani, F. Magnetic nanoparticle-crosslinked ferrohydrogel as a novel class of forward osmosis draw agent. J. Nanopart. Res. 2018, 20, 325. [Google Scholar] [CrossRef]
- Johnson, D.J.; Suwaileh, W.A.; Mohammed, A.W.; Hilal, N. Osmotic’s potential: An overview of draw solutes for forward osmosis. Desalination 2018, 434, 100–120. [Google Scholar] [CrossRef]
- Zhang, H.; Li, J.; Cui, H.; Li, H.; Yang, F. Forward osmosis using electric-responsive polymer hydrogels as draw agents: Influence of freezing–thawing cycles, voltage, feed solutions on process performance. Chem. Eng. J. 2015, 259, 814–819. [Google Scholar] [CrossRef]
- Cui, H.; Zhang, H.; Yu, M.; Yang, F. Performance evaluation of electric-responsive hydrogel as draw agent in forward osmosis desalination. Desalination 2018, 426, 118–126. [Google Scholar] [CrossRef]
- Han, H.; Lee, J.-Y.; Lu, X. Thermoresponsive nanoparticles + plasmonic nanoparticles = photo responsive heterodimers: Facile synthesis and sunlight-induced reversible clustering. Chem. Commun. 2013, 49, 6122–6124. [Google Scholar] [CrossRef]
- Zhong, Y.; Feng, X.; Chen, W.; Wang, X.; Huang, K.-W.; Gnanou, Y.; Lai, Z. Using UCST ionic liquid as a draw solute in forward osmosis to treat high-salinity water. Environ. Sci. Technol. 2015, 50, 1039–1045. [Google Scholar] [CrossRef] [PubMed]
- Kim, J.; Kang, H.; Choi, Y.-S.; Yu, Y.A.; Lee, J.-C. Thermo-responsive oligomeric poly (tetrabutylphosphonium styrenesulfonate)s as draw solutes for forward osmosis (FO) applications. Desalination 2016, 381, 84–94. [Google Scholar] [CrossRef]
- Kim, J.; Chung, J.-S.; Kang, H.; Yu, Y.A.; Choi, W.J.; Kim, H.J.; Lee, J.-C. Thermo-responsive copolymers with ionic group as novel draw solutes for forward osmosis processes. Macromol. Res. 2014, 22, 963–970. [Google Scholar] [CrossRef]
- Zhao, D.; Chen, S.; Guo, C.X.; Zhao, Q.; Lu, X. Multi-functional forward osmosis draw solutes for seawater desalination. Chin. J. Chem. Eng. 2016, 24, 23–30. [Google Scholar] [CrossRef]
- Ou, R.; Wang, Y.; Wang, H.; Xu, T. Thermo-sensitive polyelectrolytes as draw solutions in forward osmosis process. Desalination 2013, 318, 48–55. [Google Scholar] [CrossRef]
- Ju, C.; Kang, H. Zwitterionic polymers showing upper critical solution temperature behavior as draw solutes for forward osmosis. RSC Adv. 2017, 7, 56426–56432. [Google Scholar] [CrossRef]
- Inada, A.; Yumiya, K.; Takahashi, T.; Kumagai, K.; Hashizume, Y. Development of thermoresponsive star oligomers with a glycerol backbone as the draw solute in forward osmosis process. J. Membr. Sci. 2019, 574, 147–153. [Google Scholar] [CrossRef]
- Men, Y.; Schlaad, H.; Voelkel, A.; Yuan, J. Thermoresponsive polymerized gemini dicationic ionic liquid. Polym. Chem. 2014, 5, 3719–3724. [Google Scholar] [CrossRef]
- Kohno, Y.; Ohno, H. Key factors to prepare polyelectrolytes showing temperature-sensitive lower critical solution temperature-type phase transitions in water. Aust. J. Chem. 2012, 65, 91–94. [Google Scholar] [CrossRef]
- Mi, B.; Elimelech, M. Chemical and physical aspects of organic fouling of forward osmosis membranes. J. Membr. Sci. 2008, 320, 292–302. [Google Scholar] [CrossRef]
- Ma, N.; Wei, J.; Liao, R.; Tang, C.Y. Zeolite-polyamide thin film nanocomposite membranes: Towards enhanced performance for forward osmosis. J. Membr. Sci. 2012, 405–406, 149–157. [Google Scholar] [CrossRef]
- Tang, C.Y.; She, Q.; Lay, W.C.L.; Wang, R.; Fane, A.G. Coupled effects of internal concentration polarization and fouling on flux behavior of forward osmosis membrane during humic acid filtration. J. Membr. Sci. 2010, 354, 123–133. [Google Scholar] [CrossRef]
- Amini, M.; Jahanshani, M.; Rahimpour, A. Synthesis of novel thin film nanocomposite (TFN) forward osmosis membranes using functionalized multi-walled carbon nanotubes. J. Membr. Sci. 2013, 435, 233–241. [Google Scholar] [CrossRef]
- Linares, R.V.; Li, Z.; Abu-Ghdaib, M.; Wei, C.-H.; Amy, G.; Vrouwenvelder, J.S. Water harvesting from municipal wastewater via osmotic gradient: An evaluation of process performance. J. Membr. Sci. 2013, 447, 50–56. [Google Scholar] [CrossRef]
- Wei, J.; Liu, X.; Qiu, C.; Wang, R.; Tang, C.Y. Influence of monomer concentration on the performance of polyamide-based thin film composite forward osmosis membranes. J. Membr. Sci. 2011, 381, 110–117. [Google Scholar] [CrossRef]
- Niksefat, N.; Jahanshahi, M.; Rahimpour, A. The effect of SiO2 nanoparticles on morphology and performance of thin film composite membranes for forward osmosis application. Desalination 2014, 343, 140–146. [Google Scholar] [CrossRef]
- Saren, Q.; Qiu, C.Q.; Tang, C.Y. Synthesis and characterization of novel forward osmosis membranes based on layer-by-layer assembly. Environ. Sci. Technol. 2011, 34, 5201–5208. [Google Scholar] [CrossRef]
- Brookes, R.; Davies, A.; Ketwaroo, G.; Madden, P.A. Diffusion coefficients in ionic liquids: Relationship to the viscosity. J. Phys. Chem. B 2005, 109, 6485–6490. [Google Scholar] [CrossRef]
- Duong, P.H.H.; Chisca, S.; Hong, P.-Y.; Cheng, H.; Nunes, S.P.; Chung, T.-S. Hydroxyl functionalized polytriazole-co-polyoxadiazole as substrates for forward osmosis membranes. ACS Appl. Mater. Interfaces 2015, 7, 3960–3973. [Google Scholar] [CrossRef]
- Ge, Q.; Wang, P.; Wan, C.; Chung, T.-S. Polyelectrolyte-promoted forward osmosis–membrane distillation (FO–MD) hybrid process for dye wastewater treatment. Environ. Sci. Technol. 2012, 46, 6236–6243. [Google Scholar] [CrossRef]
- Mehta, G.D.; Loeb, S. Performance of permasep B-9 and B-10 membranes in various osmotic regions and at high osmotic pressures. J. Membr. Sci. 1979, 4, 335–349. [Google Scholar] [CrossRef]
- Cohen, J.; Priel, Z.; Rabin, Y. Viscosity of dilute polyelectrolyte solutions. J. Chem. Phys. 1988, 88, 7111–7116. [Google Scholar] [CrossRef]
- Campbell, R.B.; Bower, C.A.; Richards, L.A. Change of electrical conductivity with temperature and the relation of osmotic pressure to electrical conductivity and ion concentration for soil extracts. Soil Sci. Soc. Am. J. 1949, 13, 66–69. [Google Scholar] [CrossRef]
- Pitawala, J.; Matic, A.; Martinelli, A.; Jacobsson, P.; Koch, V.; Croce, F. Thermal properties and ionic conductivity of imidazolium bis(trifluoromethanesulfonyl) imide dicationic ionic liquids. J. Phys. Chem. B 2009, 113, 10607–10610. [Google Scholar] [CrossRef] [PubMed]
- Manning, G.S. Limlting laws and counterion condensation in polyelectrolyte solutions. 7. Electrophoretic Mobility and Conductance. J. Phys. Chem. 1981, 85, 1506–1515. [Google Scholar] [CrossRef]
- Manning, G.S. Limiting laws and counterion condensation polyelectrolyte solutions. 1. Colligative properties. J. Chem. Phys. 1969, 51, 924–933. [Google Scholar] [CrossRef]
- Hancock, N.T.; Cath, T.Y. Solute coupled diffusion in osmotically driven membrane processes. Environ. Sci. Technol. 2009, 43, 6769–6775. [Google Scholar] [CrossRef]
- Wang, L.; Bloomfield, V.A. Osmotic pressure of polyelectrolytes without added salt. Macromolecules 1990, 23, 804–809. [Google Scholar] [CrossRef]
- Van’t Hoff, J. The function of osmotic pressure in the analogy between solutions and gases. Proc. Phys. Soc. Lond. 1887, 9, 307–334. [Google Scholar] [CrossRef] [PubMed]
- Ge, Q.; Su, J.; Amy, G.L.; Chung, T.-S. Exploration of polyelectrolytes as draw solutes in forward osmosis processes. Water Res. 2012, 46, 1318–1326. [Google Scholar] [CrossRef] [PubMed]
- Edward, J.T. Molecular volumes and the Stokes-Einstein equation. J. Chem. Educ. 1970, 47, 261–270. [Google Scholar] [CrossRef]
- Lloret, J.; Bolanos, L.; Lucas, M.M.; Peart, J.M.; Brewin, N.J.; Bonilla, I.; Rivilla, R. Ionic stress and osmotic pressure induce different alterations in the lipopolysaccharide of a Rhizobium meliloti strain. Appl. Environ. Microbiol. 1995, 61, 3701–3704. [Google Scholar]
- Donnan, F.G.; Harris, A.B. FG & Harris, AB. J. Chem. Soc. 1911, 1911, 1554. [Google Scholar]
- Wu, C.; Wang, X. Globule-to-coil transition of a single homopolymer chain in solution. Phys. Rev. Lett. 1998, 80, 4092–4094. [Google Scholar] [CrossRef]


| Category | Stimulation Factor | Draw Solute | Osmotic Pressure/Concentration | Feed Solution | Water Flux | Ref. |
|---|---|---|---|---|---|---|
| Chemical stimulus responsiveness | Gas | NH4HCO3 | 4.80 MPa/1.1 M | 0.5 M NaCl | 3.4 LMH | [7] |
| Salt | Potassium tannate | 1135 mOsmol kg−1/100 mM | Deionized (DI) water | 6 LMH | [13] | |
| Al2(SO4)3 | – a) | – a) | – a) | [14] | ||
| MgSO4 | – a)/240,000 ppm | 5,050 ppm NaCl | 4.1 LMH | [15] | ||
| pH | PDMAEMA | 1208 mOsmol kg−1/0.3 g g−1 | DI water | 6.3 LMH | [16] | |
| Physical stimulus responsiveness | Magnetic field | PAA-MNP | 1500 mOsmol kg−1/0.05 M | DI water | 7.4 LMH | [18] |
| MNP-FHg | – a) | 2,000 ppm NaCl | 10.2 LMH | [21] | ||
| Electric field | HA-PVA | – a)/– a) | DI water | 1.5 LMH | [23] | |
| AMPS-DMEAMA | – a)/– a) | 2000 ppm NaCl | 2.09 LMH | [24] | ||
| Light | PNIPAM/Ag-Fe3O4 | – a)/– a) | – a) | – a) | [25] | |
| Temperature | PSSS-PNIPAM | 2.87 MPa/33 wt% | 0.6 M NaCl | 3.5 LMH | [29] | |
| PNIPAM-PSA | 3.5 atm/14.28 wt% | DI water | 0.35 LMH | [30] | ||
| PBET | – a)/20 wt% | DI water | 3.22 LMH | [31] | ||
| GEmBn | – a)/56 wt% | 0.6 M NaCl | 4.81 LMH | [32] | ||
| PSSP5 | 20.85 atm/20 wt% | DI water | 14.5 LMH | [27] | ||
| PSSBP8 | 174.0 mOsmol kg−1/20 wt% | DI water | 1.84 LMH | This Study |
© 2019 by the authors. Licensee MDPI, Basel, Switzerland. This article is an open access article distributed under the terms and conditions of the Creative Commons Attribution (CC BY) license (http://creativecommons.org/licenses/by/4.0/).
Share and Cite
Kim, T.; Ju, C.; Park, C.; Kang, H. Polymer Having Dicationic Structure in Dumbbell Shape for Forward Osmosis Process. Polymers 2019, 11, 571. https://doi.org/10.3390/polym11030571
Kim T, Ju C, Park C, Kang H. Polymer Having Dicationic Structure in Dumbbell Shape for Forward Osmosis Process. Polymers. 2019; 11(3):571. https://doi.org/10.3390/polym11030571
Chicago/Turabian StyleKim, Taehyung, Changha Ju, Chanhyuk Park, and Hyo Kang. 2019. "Polymer Having Dicationic Structure in Dumbbell Shape for Forward Osmosis Process" Polymers 11, no. 3: 571. https://doi.org/10.3390/polym11030571
APA StyleKim, T., Ju, C., Park, C., & Kang, H. (2019). Polymer Having Dicationic Structure in Dumbbell Shape for Forward Osmosis Process. Polymers, 11(3), 571. https://doi.org/10.3390/polym11030571