Enhanced Formaldehyde Removal from Air Using Fully Biodegradable Chitosan Grafted β-Cyclodextrin Adsorbent with Weak Chemical Interaction


Abstract
1. Introduction
2. Materials and Methods
2.1. Preparation of CGC
2.2. Characterization of CGC
2.3. Adsorption Performance Test
3. Results and Discussion
3.1. Characterization of CGC
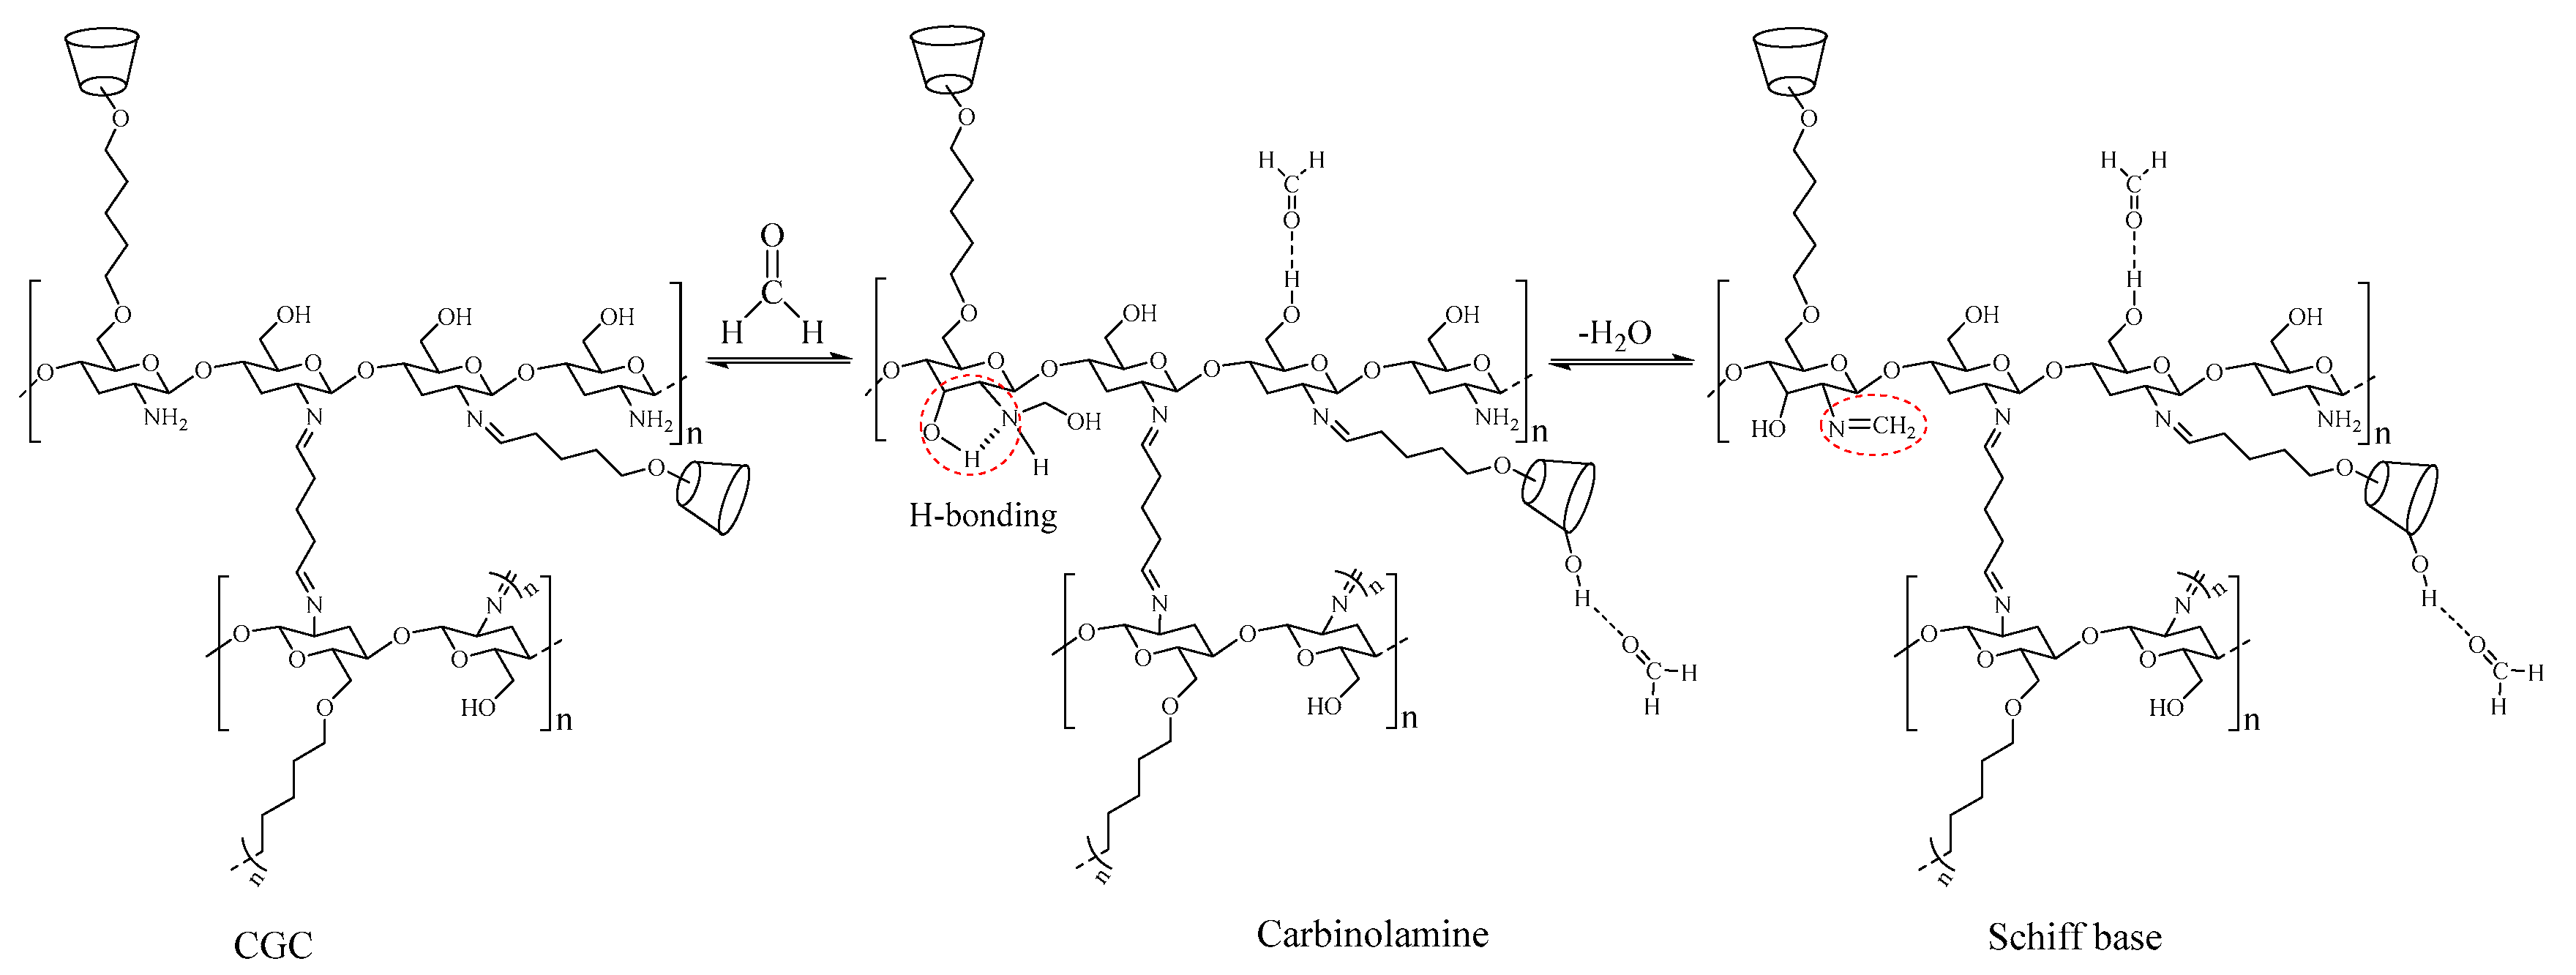
3.1.1. FTIR Spectral Analysis
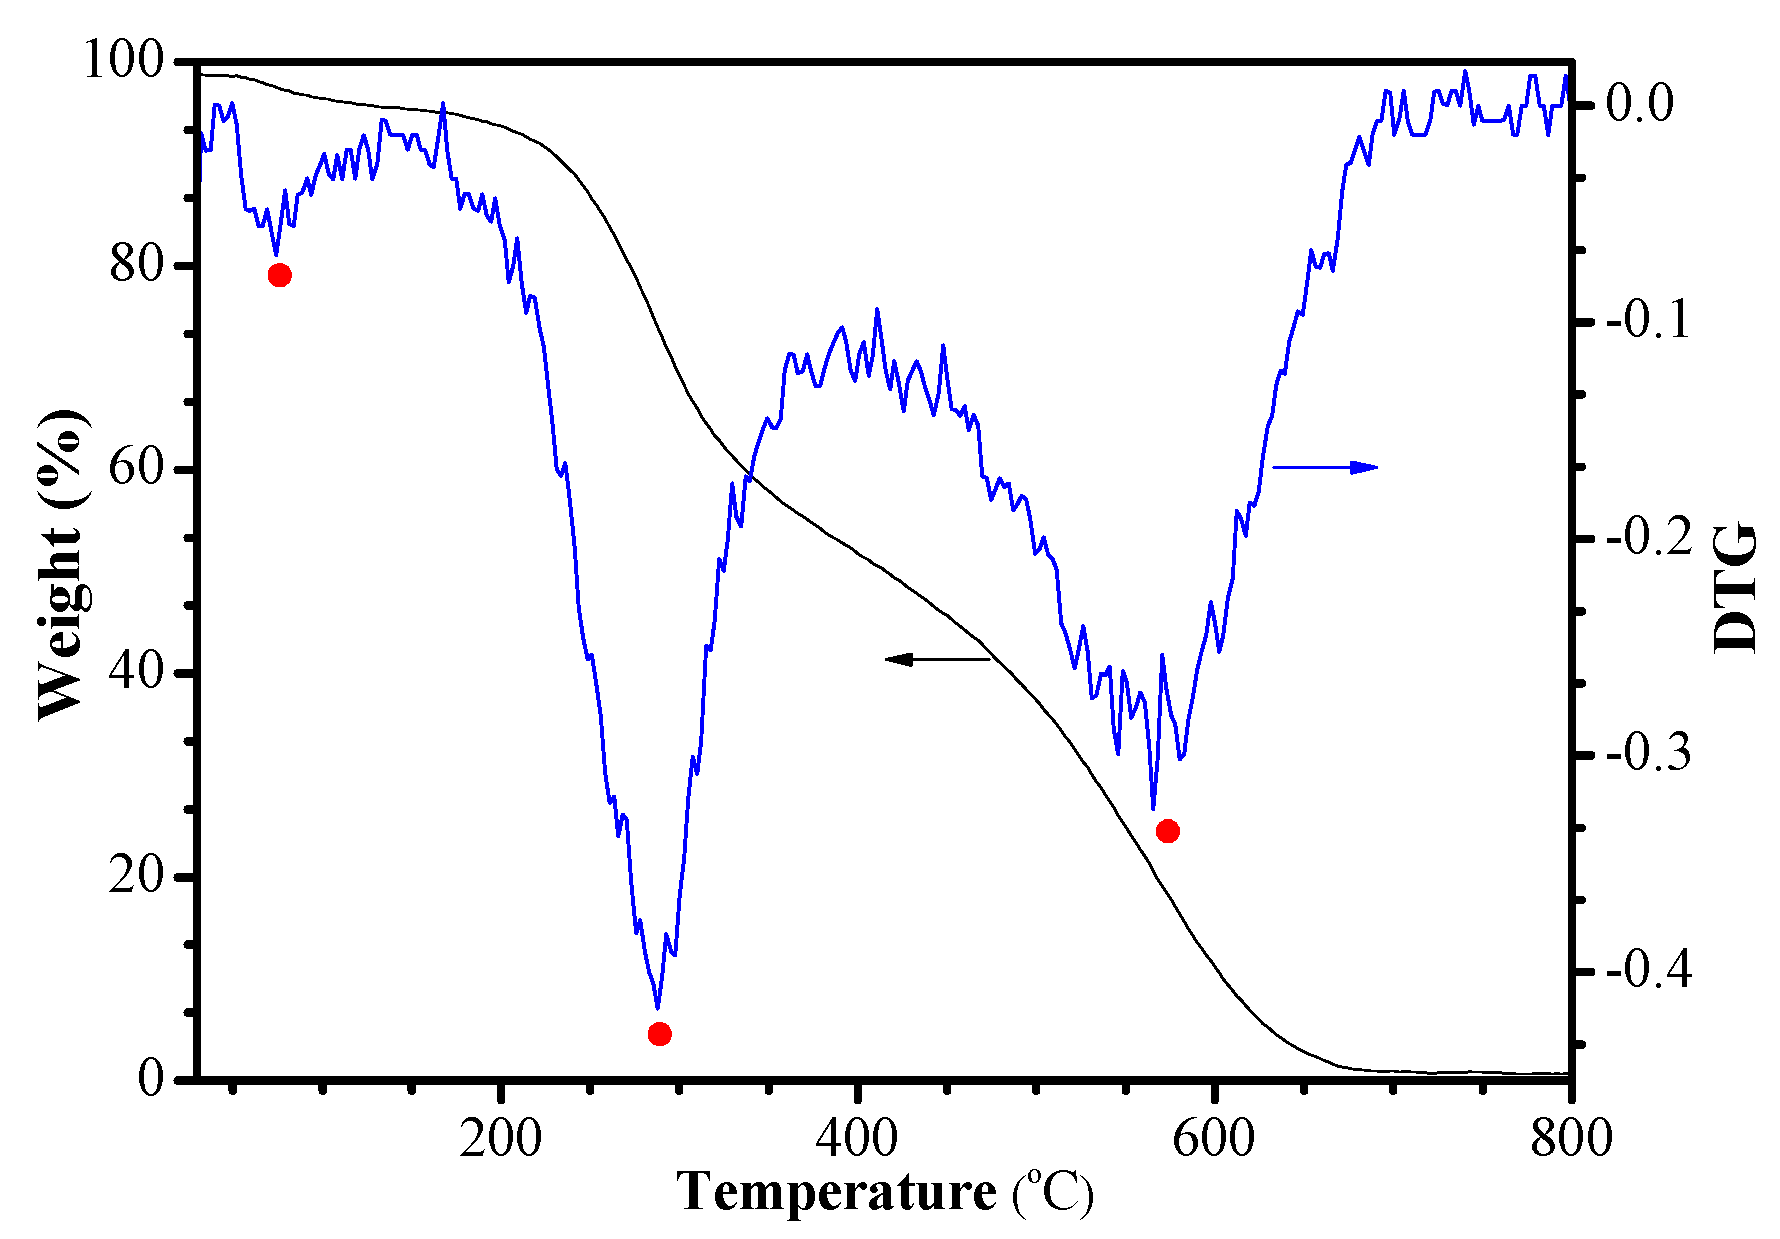
3.1.2. TG/DTA
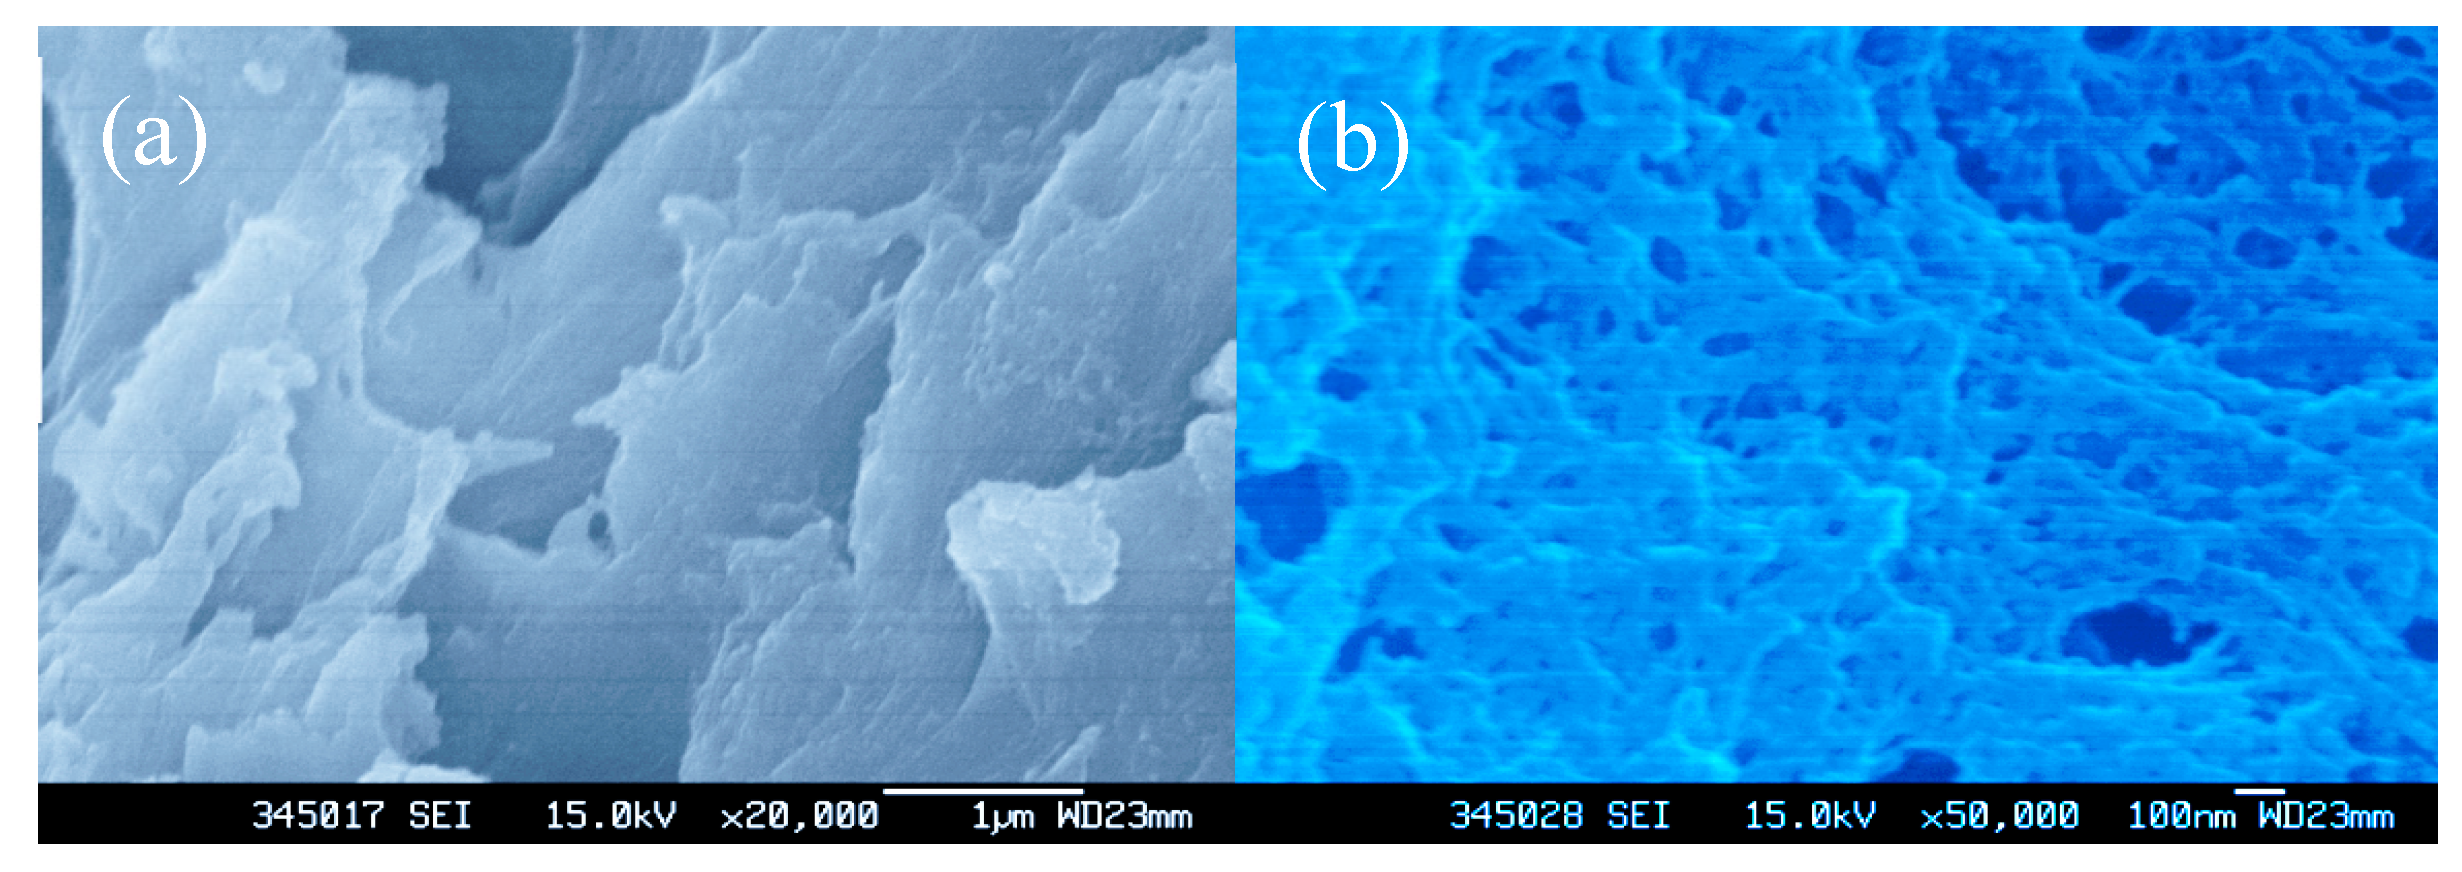
3.1.3. SEM
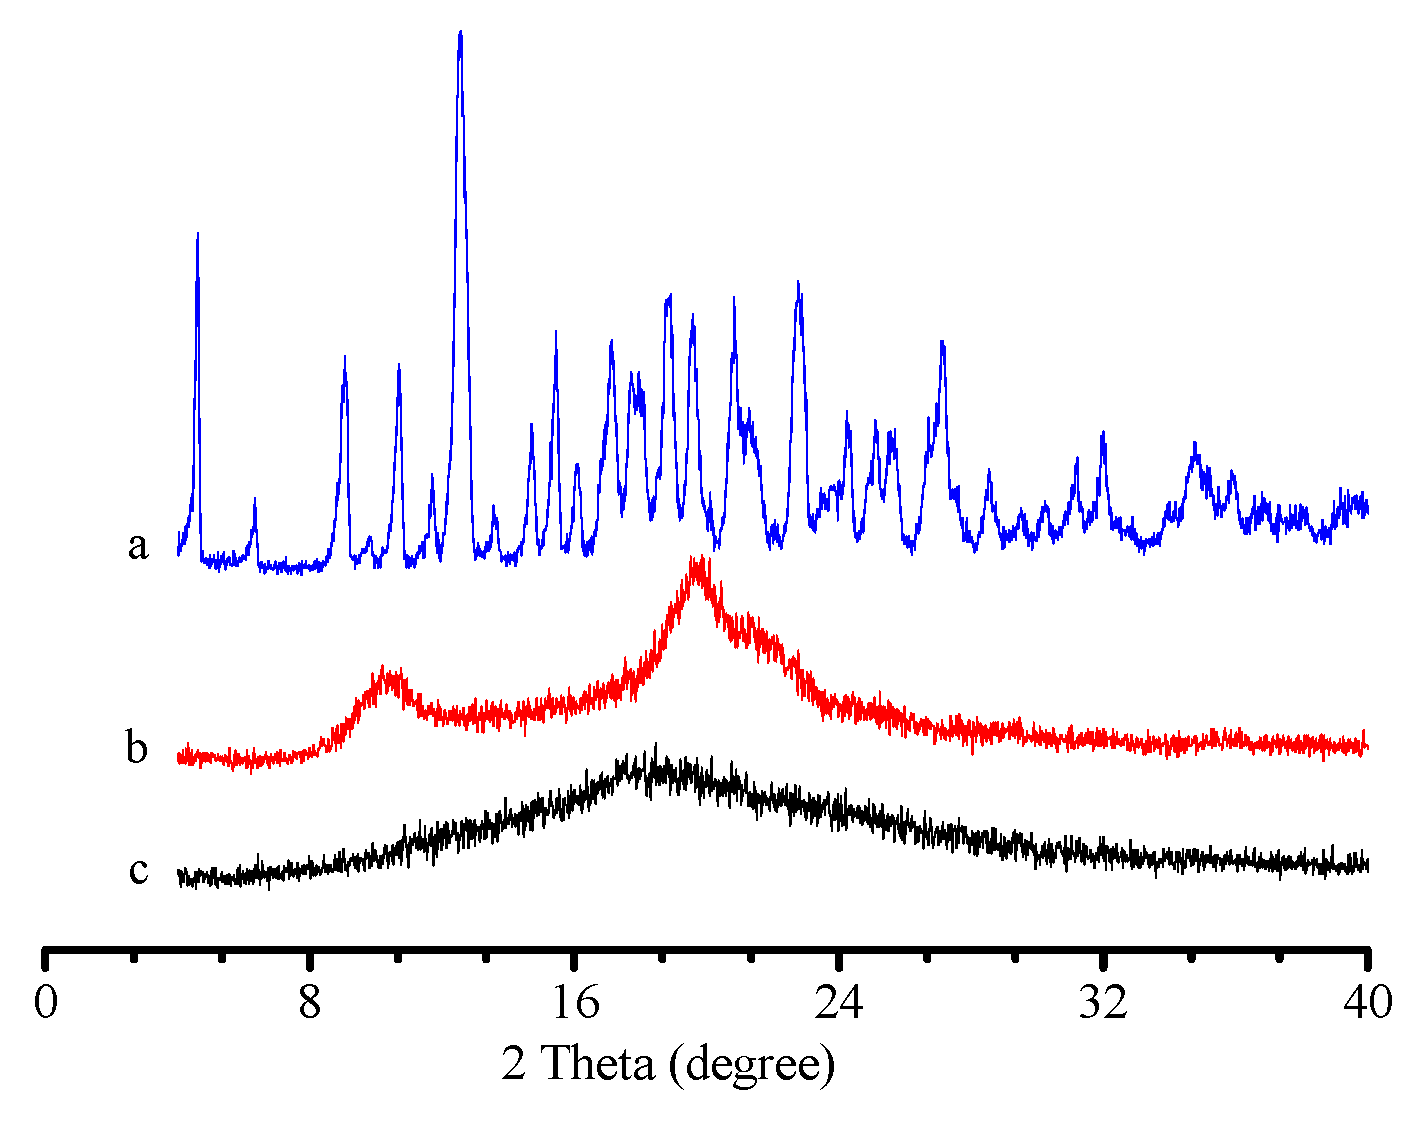
3.1.4. Powder XRD Pattern
3.2. Equilibrium Adsorption Studies of HCHO
3.2.1. Adsorption Isotherms
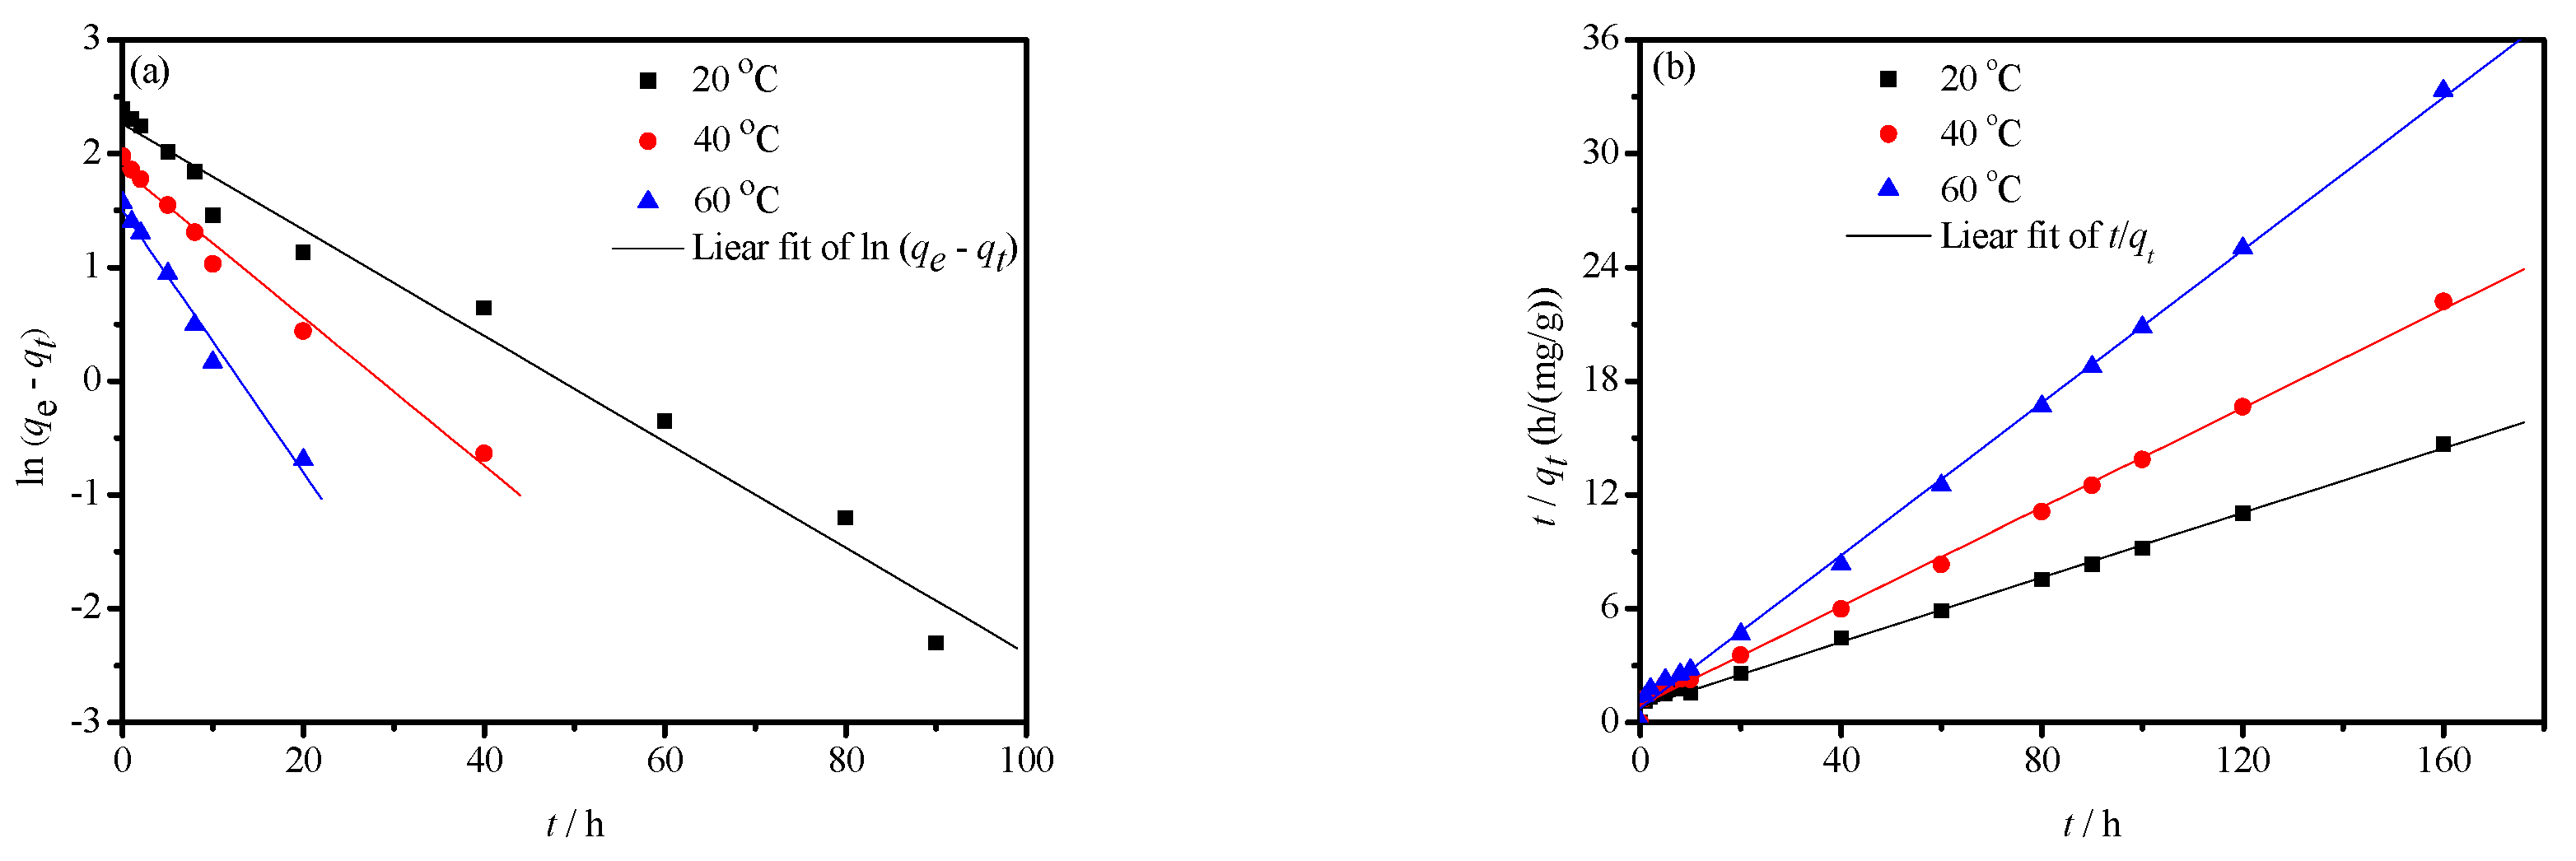
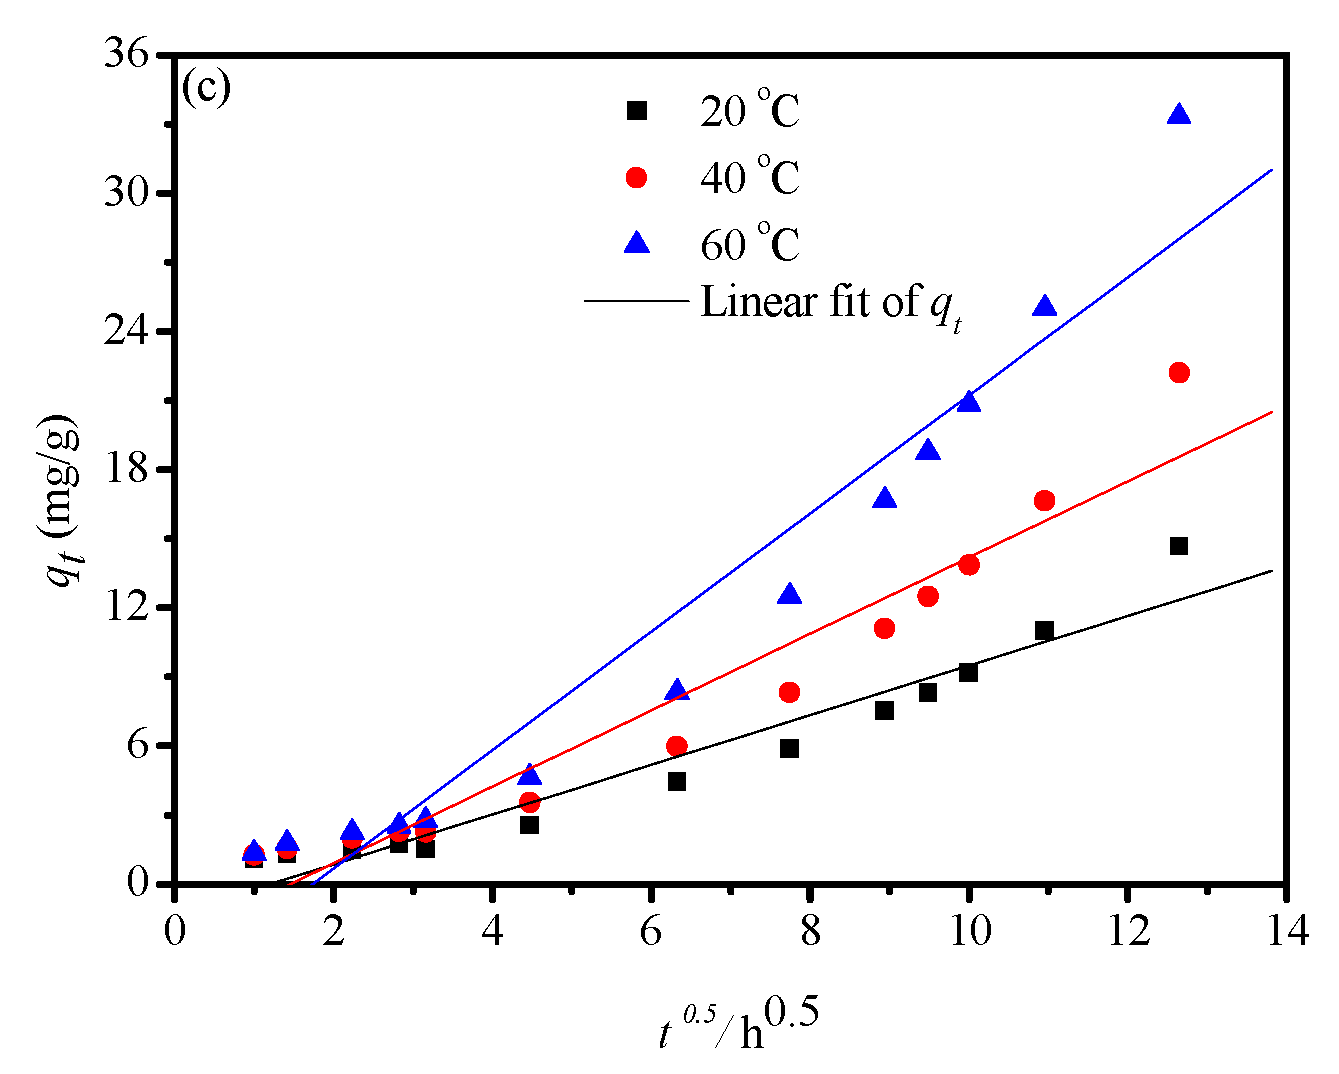
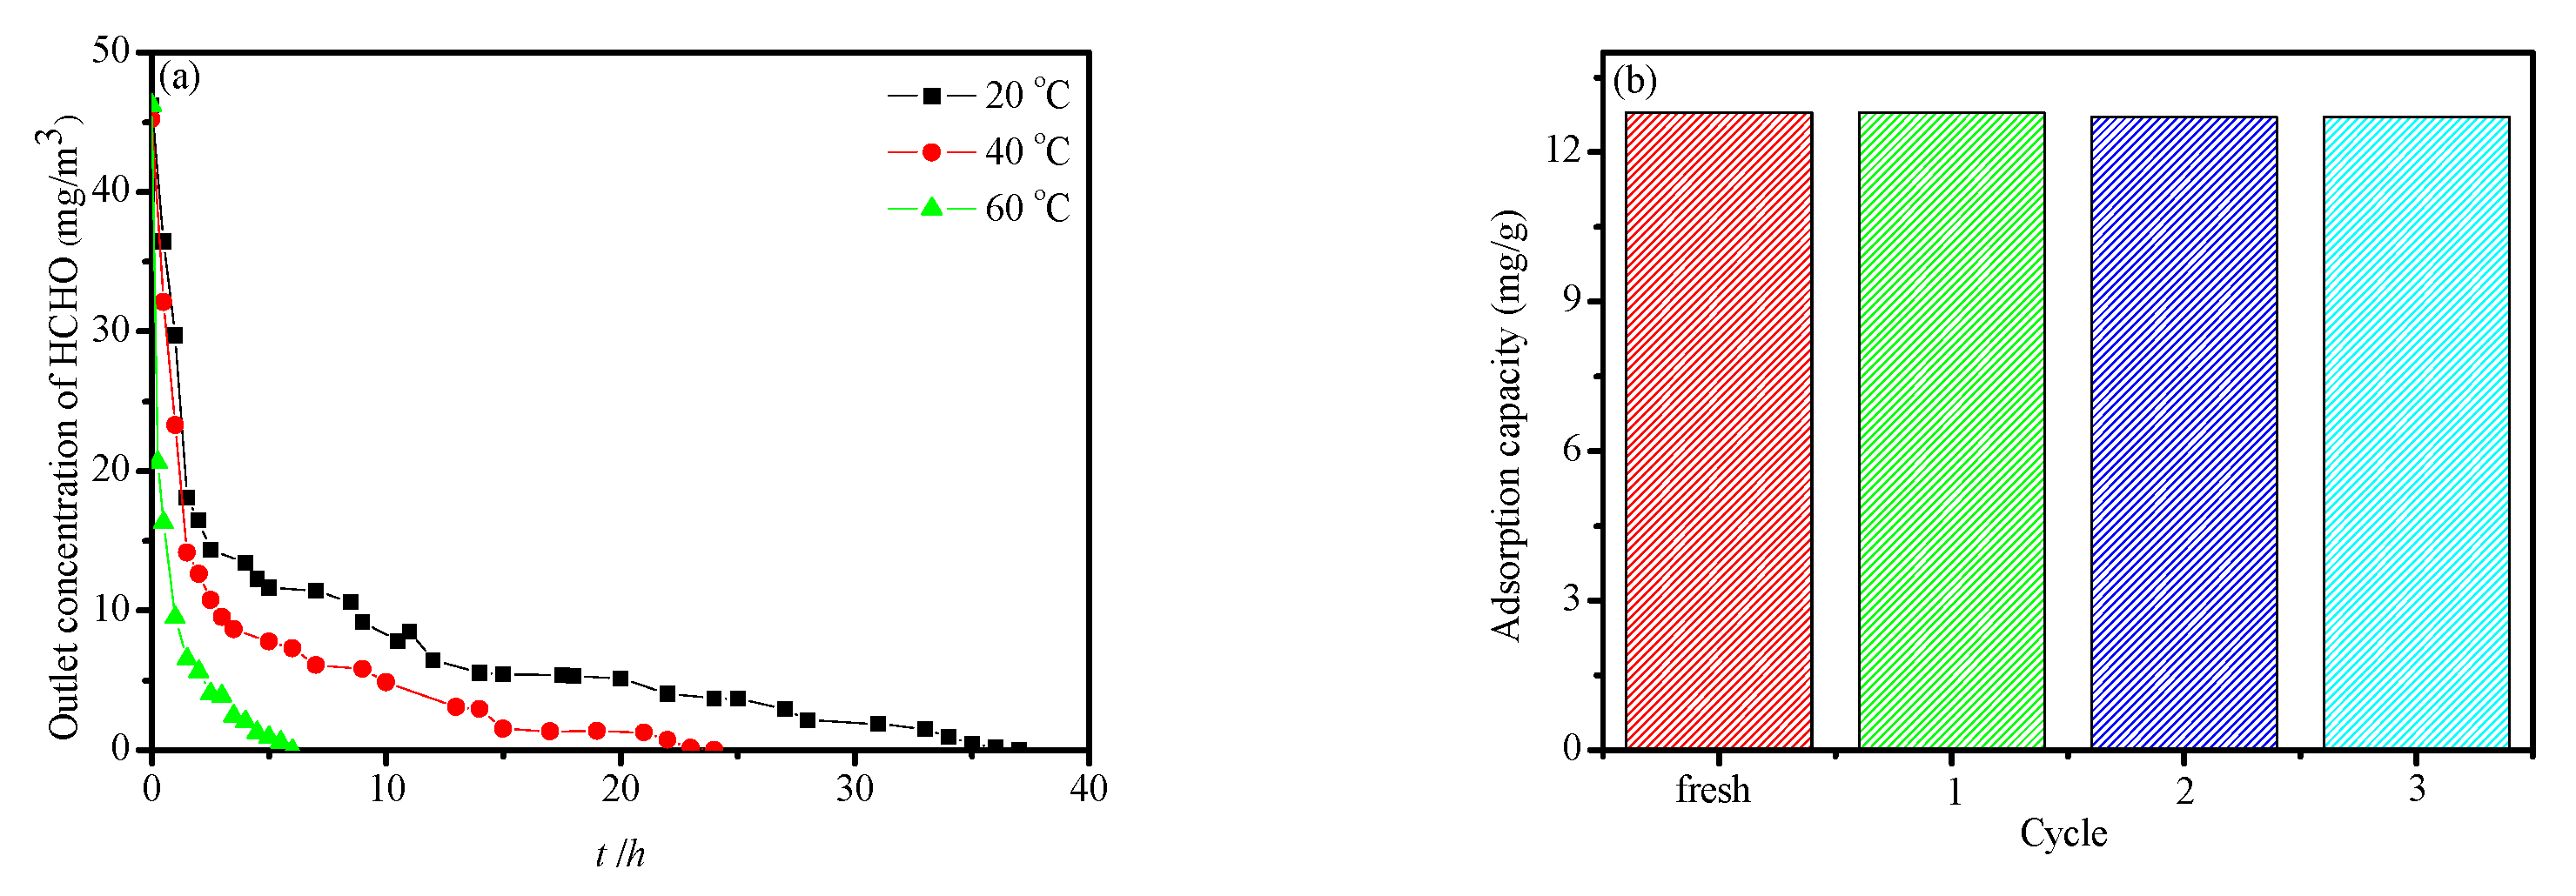
3.2.2. Adsorption Kinetics for HCHO
3.2.3. Desorption and Reusability Study
4. Conclusions
Author Contributions
Funding
Conflicts of Interest
References
- Yu, J.; Li, X.; Xu, Z.; Xiao, W. NaOH-modified ceramic honeycomb with enhanced formaldehyde adsorption and removal performance. Environ. Sci. Technol. 2013, 47, 9928–9933. [Google Scholar] [CrossRef] [PubMed]
- Nie, L.; Zhou, P.; Yu, J.; Jaroniec, M. Deactivation and regeneration of Pt/TiO2 nanosheet-type catalysts with exposed (001) facets for room temperature oxidation of formaldehyde. J. Mol. Catal. A Chem. 2014, 390, 7–13. [Google Scholar] [CrossRef]
- Salthammer, T.; Mentese, S.; Marutzky, R. Formaldehyde in the indoor environment. Chem. Rev. 2010, 110, 2536–2572. [Google Scholar] [CrossRef] [PubMed]
- Liang, W.; Yang, S.; Yang, X. Long-term formaldehyde emissions from medium-density fiberboard in a full-scale experimental room: emission characteristics and the effects of temperature and humidity. Environ. Sci. Technol. 2015, 49, 10349–10356. [Google Scholar] [CrossRef]
- World Health Organization. UNAIDS, Air Quality Guidelines: Global Update 2005; World Health Organization: Geneva, Switzerland, 2006. [Google Scholar]
- Liao, Y.; Xie, C.; Liu, Y.; Huang, Q. Enhancement of photocatalytic property of ZnO for gaseous formaldehyde degradation by modifying morphology and crystal defect. J. Alloys Compd 2013, 550, 190–197. [Google Scholar] [CrossRef]
- Yang, T.; Huo, Y.; Liu, Y.; Rui, Z.; Ji, H. Efficient formaldehyde oxidation over nickel hydroxide promoted Pt/γ-Al2O3 with a low Pt content. Appl. Catal. B Environ. 2017, 200, 543–551. [Google Scholar] [CrossRef]
- Chen, H.; Tang, M.; Rui, Z.; Ji, H. MnO2 Promoted TiO2 Nanotube Array Supported Pt Catalyst for Formaldehyde Oxidation with Enhanced Efficiency. Ind. Eng. Chem. Res. 2015, 54, 8900–8907. [Google Scholar] [CrossRef]
- Huang, Y.; Long, B.; Tang, M.; Rui, Z.; Balogun, M.-S.; Tong, Y.; Ji, H. Bifunctional catalytic material: An ultrastable and high-performance surface defect CeO2 nanosheets for formaldehyde thermal oxidation and photocatalytic oxidation. Appl. Catal. B Environ. 2016, 181, 779–787. [Google Scholar] [CrossRef]
- Yang, X.; Yu, X.; Lin, M.; Ge, M.; Zhao, Y.; Wang, F. Interface effect of mixed phase Pt/ZrO2 catalysts for HCHO oxidation at ambient temperature. J. Mater. Chem. A 2017, 5, 13799–13806. [Google Scholar] [CrossRef]
- Matsuo, Y.; Nishino, Y.; Fukutsuka, T.; Sugie, Y. Removal of formaldehyde from gas phase by silylated graphite oxide containing amino groups. Carbon 2008, 46, 1162–1163. [Google Scholar] [CrossRef]
- Xu, Z.; Yu, J.; Xiao, W. Microemulsion-assisted preparation of a mesoporous ferrihydrite/SiO2 composite for the efficient removal of formaldehyde from air. Chem. Eur. J. 2013, 19, 9592–9598. [Google Scholar] [CrossRef] [PubMed]
- Ewlad-Ahmed, A.M.; Morris, M.A.; Patwardhan, S.V.; Gibson, L.T. Removal of formaldehyde from air using functionalized silica supports. Environ. Sci. Technol. 2012, 46, 13354–13360. [Google Scholar] [CrossRef] [PubMed]
- Rocha, L.S.; Almeida, Â.; Nunes, C.; Henriques, B.; Coimbra, M.A.; Lopes, C.B.; Silva, C.M.; Duarte, A.C.; Pereira, E. Simple and effective chitosan based films for the removal of Hg from waters: Equilibrium, kinetic and ionic competition. Chem. Eng. J. 2016, 300, 217–229. [Google Scholar] [CrossRef]
- Tang, R.; Zhang, Y.; Zhang, Y.; Yu, Z. Synthesis and characterization of chitosan based dye containing quaternary ammonium group. Carbohyd. Polym. 2016, 139, 191–196. [Google Scholar] [CrossRef] [PubMed]
- Nuasaen, S.; Opaprakasit, P.; Tangboriboonrat, P. Hollow latex particles functionalized with chitosan for the removal of formaldehyde from indoor air. Carbohyd. Polym. 2014, 101, 179–187. [Google Scholar] [CrossRef] [PubMed]
- Yang, K.-H.; Liu, Y.-C.; Yu, C.-C.; Chen, B.-C. Fabrication of chitosan/silver nanocomposites based on electrochemical methods for removing formaldehyde in air. Mater. Chem. Phys. 2011, 126, 993–997. [Google Scholar] [CrossRef]
- Crini, G.; Badot, P.-M. Application of chitosan, a natural aminopolysaccharide, for dye removal from aqueous solutions by adsorption processes using batch studies: A review of recent literature. Prog. Polym. Sci. 2008, 33, 399–447. [Google Scholar] [CrossRef]
- Sneddon, G.; Ganin, A.Y.; Yiu, H.H.P. Sustainable CO2 adsorbents prepared by coating chitosan onto mesoporous silicas for large-scale carbon capture technology. Energy Technol. 2015, 3, 249–258. [Google Scholar] [CrossRef]
- Connors, K.A. The stability of cyclodextrin complexes in solution. Chem. Rev. 1997, 97, 1325–1358. [Google Scholar] [CrossRef]
- Yang, Z.; Zhang, X.; Fang, Y.; Rui, Z.; Ji, H. Efficient oxidation of cinnamon oil to natural benzaldehyde over β-cyclodextrin-functionalized MWCNTs. Chin. J. Catal. 2016, 37, 2086–2097. [Google Scholar] [CrossRef]
- Chen, Q.Y.; Xiao, J.B.; Chen, X.Q.; Jiang, X.Y.; Yu, H.Z.; Xu, M. The adsorption of phenol, m-cresol and m-catechol on a β-cyclodextrin derivative-grafted chitosan and the removal of phenols from industrial wastewater. Adsorpt. Sci. Technol. 2006, 24, 547–557. [Google Scholar] [CrossRef]
- Aoki, N.; Kinoshita, K.; Mikuni, K.; Nakanishi, K.; Hattori, K. Adsorption of 4-nonylphenol ethoxylates onto insoluble chitosan beads bearing cyclodextrin moieties. J. Incl. Phenom. Macrocycl. Chem. 2007, 57, 237–241. [Google Scholar] [CrossRef]
- Chai, K.; Ji, H. Dual functional adsorption of benzoic acid from wastewater by biological-based chitosan grafted β-cyclodextrin. Chem. Eng. J. 2012, 203, 309–318. [Google Scholar] [CrossRef]
- Aoki, N.; Nishikawa, M.; Hattori, K. Synthesis of chitosan derivatives bearing cyclodextrin and adsorption of p-nonylphenol and bisphenol A. Carbohyd. Polym. 2003, 52, 219–223. [Google Scholar] [CrossRef]
- Chen, H.; Rui, Z.; Ji, H. Monolith-like TiO2 nanotube array supported Pt catalyst for HCHO removal under mild conditions. Ind. Eng. Chem. Res. 2014, 53, 7629–7636. [Google Scholar] [CrossRef]
- Chen, H.; Rui, Z.; Ji, H. Titania-supported Pt catalyst reduced with HCHO for HCHO oxidation under mild conditions. Chin. J. Catal. 2015, 36, 188–196. [Google Scholar] [CrossRef]
- Yang, Z.; Xiao, Z.; Ji, H. Solid inclusion complex of terpinen-4-ol/β-cyclodextrin: kinetic release, mechanism and its antibacterial activity. Flavour Frag. J. 2015, 30, 179–187. [Google Scholar] [CrossRef]
- Oliveira, J.M.; Rodrigues, M.T.; Silva, S.S.; Malafaya, P.B.; Gomes, M.E.; Viegas, C.A.; Dias, I.R.; Azevedo, J.T.; Mano, J.F.; Reis, R.L. Novel hydroxyapatite/chitosan bilayered scaffold for osteochondral tissue-engineering applications: Scaffold design and its performance when seeded with goat bone marrow stromal cells. Biomaterials 2006, 27, 6123–6137. [Google Scholar] [CrossRef]
- Ogawa, K.; Hirano, S.; Miyanishi, T.; Yui, T.; Watanabe, T. A new polymorph of chitosan. Macromolecules 1984, 17, 973–975. [Google Scholar] [CrossRef]
- Carter, E.M.; Katz, L.E.; Jr, S.G.; Ramirez, D. Gas-phase formaldehyde adsorption isotherm studies on activated carbon: correlations of adsorption capacity to surface functional group density. Environ. Sci. Technol. 2011, 45, 6498–6503. [Google Scholar] [CrossRef]
- Xu, Z.; Yu, J.; Liu, G.; Cheng, B.; Zhou, P.; Li, X. Microemulsion-assisted synthesis of hierarchical porous Ni(OH)2/SiO2 composites toward efficient removal of formaldehyde in air. Dalton Trans. 2013, 42, 10190–10197. [Google Scholar] [CrossRef] [PubMed]
- Yamanaka, S.; Oiso, T.; Kurahashi, Y.; Abe, H.; Hara, K.; Fujimoto, T.; Kuga, Y. Scalable and template-free production of mesoporous calcium carbonate and its potential to formaldehyde adsorbent. J. Nanopart. Res. 2014, 16, 2266. [Google Scholar] [CrossRef]
- Lee, K.J.; Miyawaki, J.; Shiratori, N.; Yoon, S.-H.; Jang, J. Toward an effective adsorbent for polar pollutants: Formaldehyde adsorption by activated carbon. J. Hazard. Mater. 2013, 260, 82–88. [Google Scholar] [CrossRef] [PubMed]
- Rezaee, A.; Rangkooy, H.; Jonidi-Jafari, A.; Khavanin, A. Surface modification of bone char for removal of formaldehyde from air. Appl. Surf. Sci. 2013, 286, 235–239. [Google Scholar] [CrossRef]
- Yan, H.; Li, H.; Yang, H.; Li, A.; Cheng, R. Removal of various cationic dyes from aqueous solutions using a kind of fully biodegradable magnetic composite microsphere. Chem. Eng. J. 2013, 223, 402–411. [Google Scholar] [CrossRef]
- Song, N.; Yan, H. Novel silicone-based polymer containing active methylene designed for the removal of indoor formaldehyde. J. Hazard. Mater. 2015, 287, 259–267. [Google Scholar]
- Heydari-Gorji, A.; Sayari, A. CO2 capture on polyethylenimine-impregnated hydrophobic mesoporous silica: Experimental and kinetic modeling. Chem. Eng. J. 2011, 173, 72–79. [Google Scholar] [CrossRef]
- Stevens, L.; Williams, K.; Han, W.Y.; Drage, T.; Snape, C.; Wood, J.; Wang, J. Preparation and CO2 adsorption of diamine modified montmorillonite via exfoliation grafting route. Chem. Eng. J. 2013, 215, 699–708. [Google Scholar] [CrossRef]
- Loganathan, S.; Tikmani, M.; Edubilli, S.; Mishra, A.; Ghoshal, A.K. CO2 adsorption kinetics on mesoporous silica under wide range of pressure and temperature. Chem. Eng. J. 2014, 256, 1–8. [Google Scholar] [CrossRef]
- Namasivayam, C.; Yamuna, R.T. Adsorption of direct red 12B by biogas residual slurry: Equilibrium and rate processes. Environ. Pollut. 1995, 89, 1–7. [Google Scholar] [CrossRef]
- Zhao, Y.; Shen, Y.; Bai, L.; Ni, S. Carbon dioxide adsorption on polyacrylamide-impregnated silica gel and breakthrough modeling. Appl. Surf. Sci. 2012, 261, 708–716. [Google Scholar] [CrossRef]
- Mao, C.F.; Vannice, M.A. Formaldehyde oxidation over Ag catalysts. J. Catal. 1995, 154, 230–244. [Google Scholar] [CrossRef]


| Fixed-Bed Parameters | Functional groups | –NH2, –OH |
| β-CD content (μmol/g) | 38.62 | |
| Packed bed length (L) (mm) | 30 | |
| Inside diameter (mm) | ||
| Particle size (mm) | 0.2~0.45 | |
| Voidage (ε) | 0.133 | |
| Average pore size (r) (nm) | 7.81 | |
| Particle surface area (SBET) | 10.8 | |
| Particle pore volume (Vp) (cm3/g) | 0.02 | |
| Bulk density (g/cm3) | 0.29 | |
| Operation Parameter | Adsorption temperature (°C) | 20, 40, 60 |
| Desorption temperature (°C) | 20, 40, 60 | |
| Gas flow rate (mL/min) | 28, 56, 84 | |
| Cinlet (mg/mL) | 41.5~5.0 |
| Temperature (°C) | Langmuir Isotherm | Freundlich Isotherm | D-R Isotherm | ||||||
|---|---|---|---|---|---|---|---|---|---|
| qm (mg/g) | KL (m3/mg) | R2 | Kf (m3/mg) | n | R2 | qm (mg/g) | E (kJ/mol) | R2 | |
| 20 | 15.48 | 14.72 | 0.7353 | 0.65 | 1.30 | 0.9868 | 12.27 | 10.70 | 0.4528 |
| 40 | 9.71 | 6.90 | 0.8503 | 0.42 | 1.26 | 0.9962 | 8.31 | 8.51 | 0.4713 |
| 60 | 6.33 | 2.17 | 0.6127 | 0.18 | 0.79 | 0.9905 | 6.53 | 1.99 | 0.4190 |
| Adsorbent | BET (m2/g) | Ce | qe | qe/SBET | Refs |
|---|---|---|---|---|---|
| bone char | 118 | 20 ppm | 164.1 | 1.39 | [31] |
| activated carbon | 404 | 20 ppm | 14.3 | 0.035 | [32] |
| calcium carbonate | 65 | 1560 mg/m3 | 6.7 | 0.103 | [33] |
| Ni–SiO2-4 | 170 | 300 ppm | 8.3 | 0.049 | [34] |
| CGC | 10.8 | 46.1 mg/m3 | 15.5 | 1.43 | This work |
| Temperature (°C) | Pseudo First Order | Pseudo Second Order | Intra-Particle Diffusion | ||||||
|---|---|---|---|---|---|---|---|---|---|
| qe (mg/g) | k1 (h−1) | R2 | qe (mg/g) | k2 (mg g−1 h−1) | R2 | Kp (mg g−1 h−1/2) | C (mg/g) | R2 | |
| 20 | 9.59 | 0.04656 | 0.9805 | 11.73 | 0.008879 | 0.9956 | 1.078 | 1.291 | 0.9411 |
| 40 | 6.44 | 20.5 | 14.9 | 7.65 | 0.01928 | 0.9971 | 1.658 | 2.404 | 0.9370 |
| 60 | 4.47 | 46.0 | 21.1 | 4.97 | 0.05340 | 0.9987 | 2.567 | 4.447 | 0.9395 |
| Temperature (°C) | ln K | ΔG (kJ/mol) | ΔH (kJ/mol) | ΔS (J/mol K) |
|---|---|---|---|---|
| 20 | 2.70 | −6.58 | −38.91 | −109.71 |
| 40 | 1.93 | −4.91 | ||
| 60 | 0.77 | −2.13 |
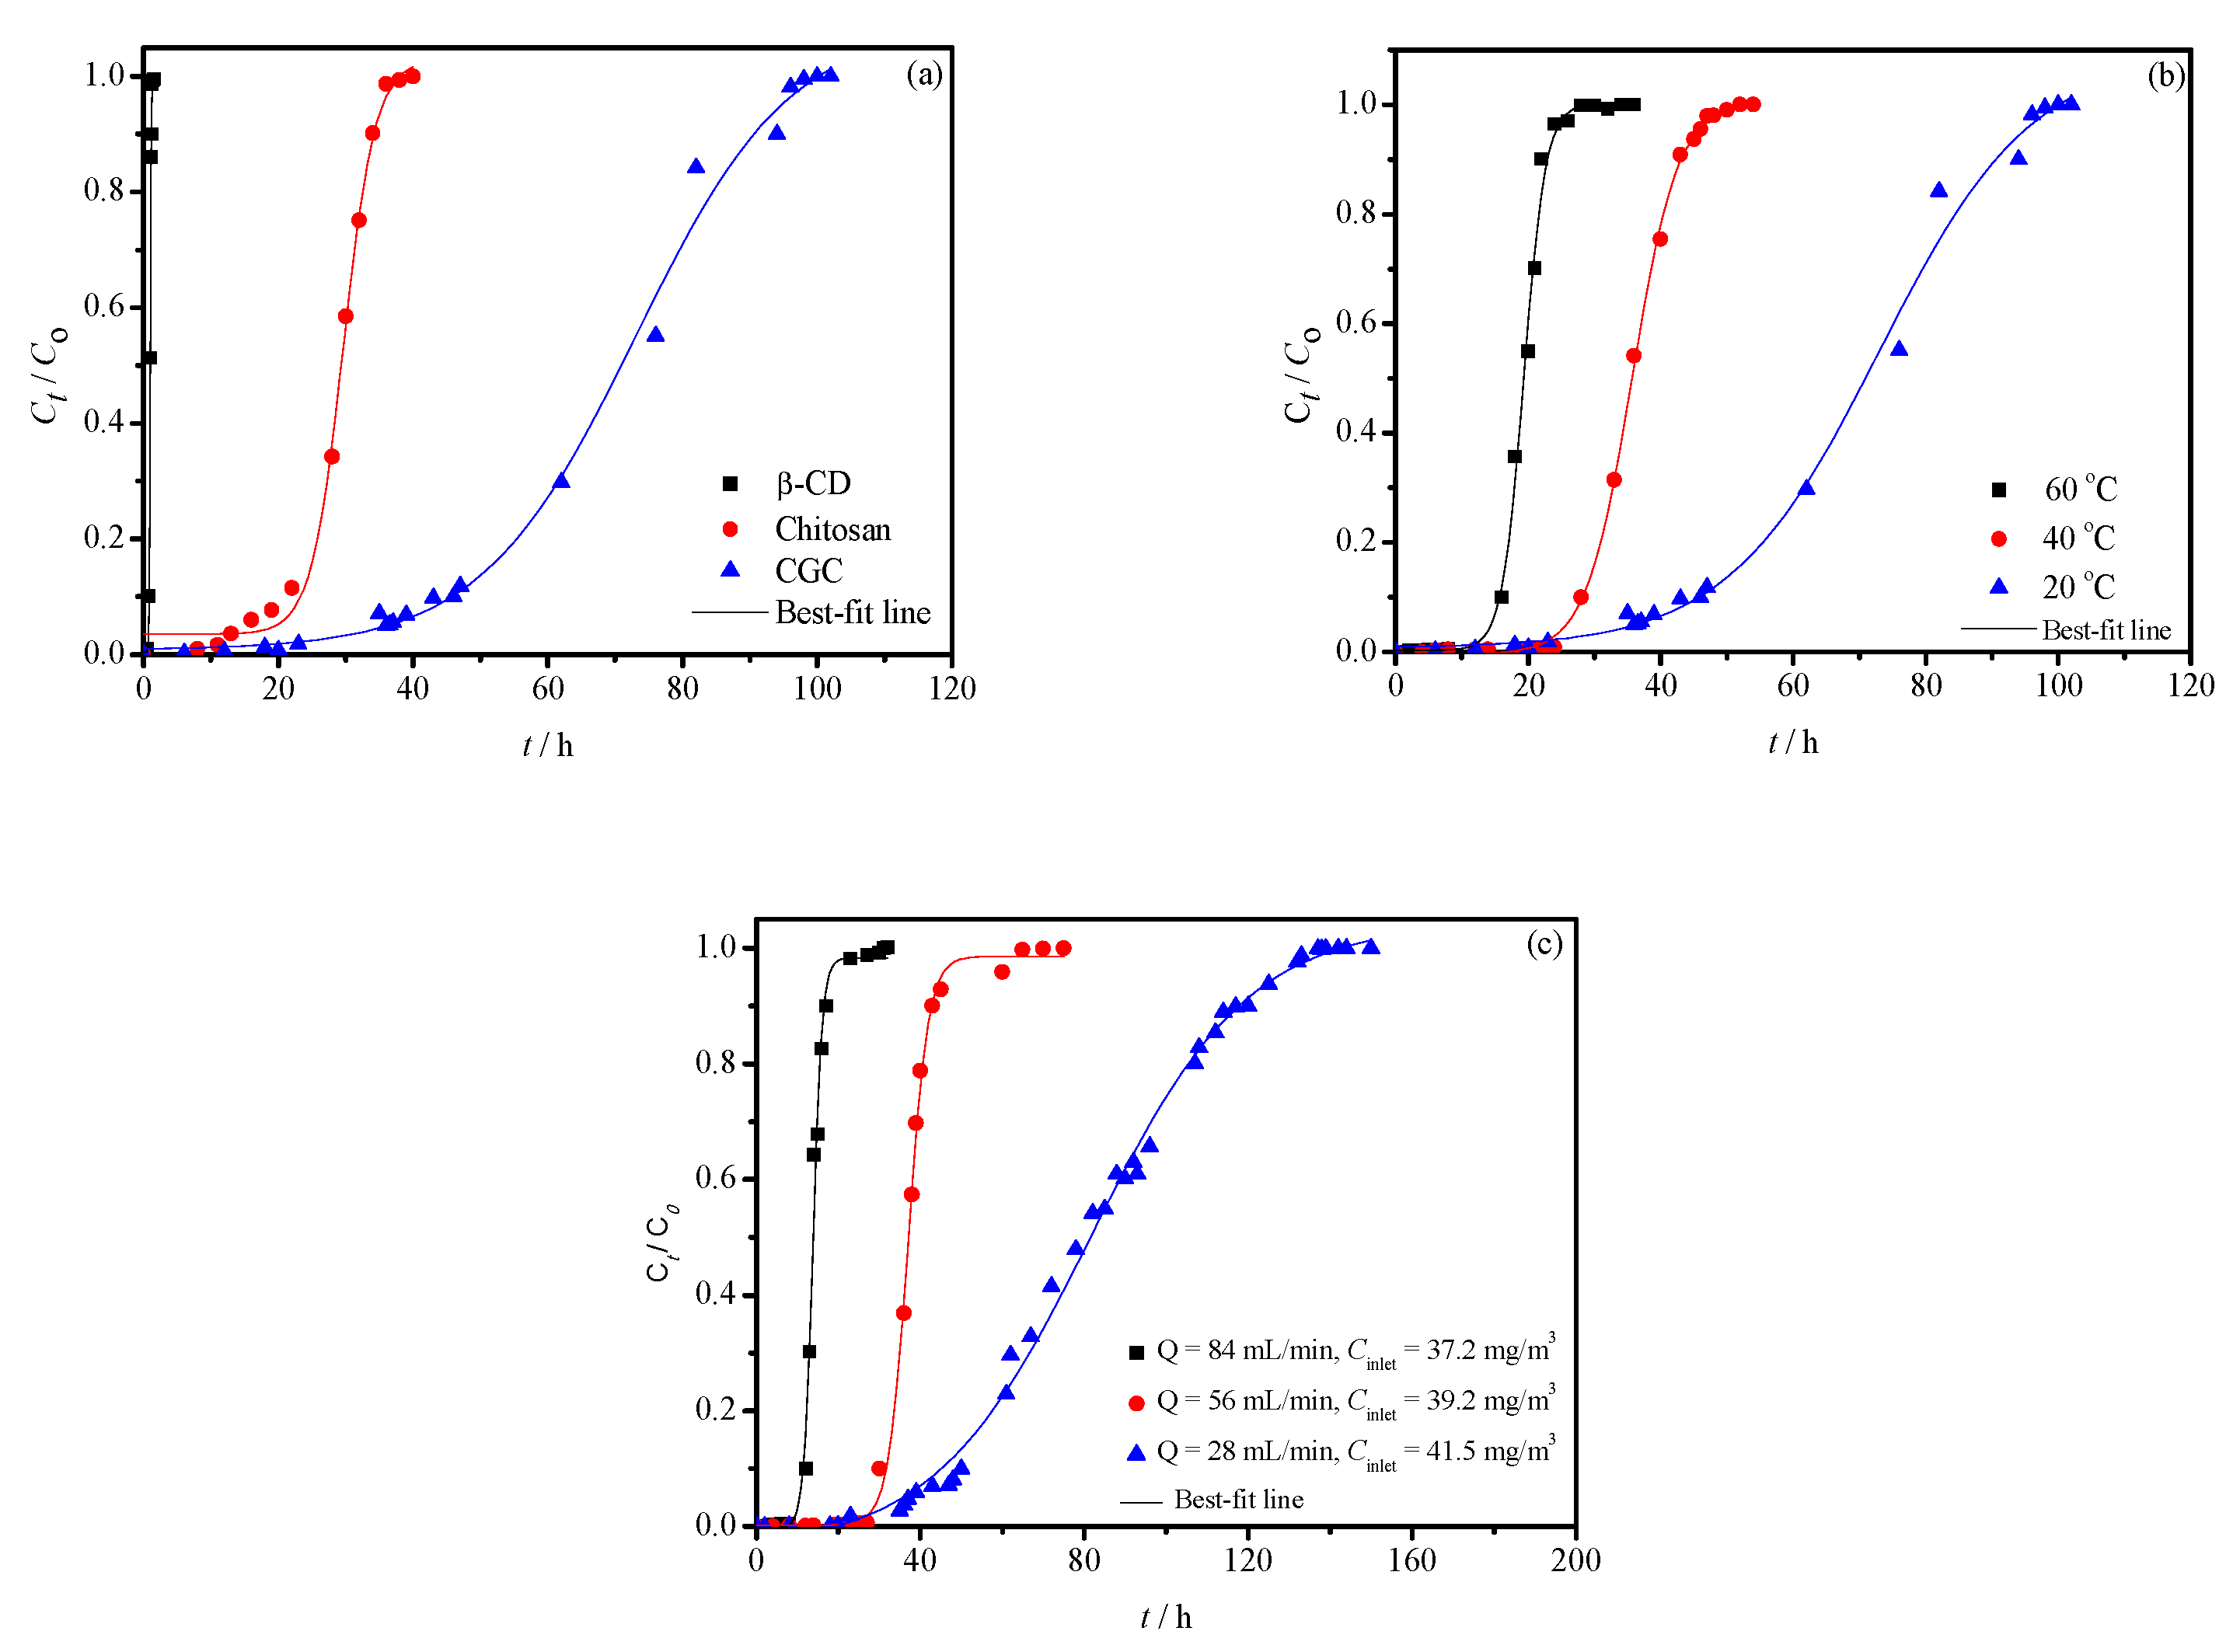
| Adsorbent | Temperature (°C) | GHSV (mL/min) | Cinlet (mg/m3) | Experimental | ||
|---|---|---|---|---|---|---|
| q (mg/g) | tb (h) | LMTZ (mm) | ||||
| β-CD | 20 | 28 | 37.2 | 0.2 | 0.8 | 12.5 |
| chitosan | 20 | 28 | 37.2 | 6.0 | 20.5 | 14.9 |
| CGC | 20 | 28 | 37.2 | 10.9 | 46.0 | 21.1 |
| CGC | 40 | 28 | 37.2 | 7.2 | 28.0 | 12.5 |
| CGC | 60 | 28 | 37.2 | 4.8 | 16.0 | 9.5 |
| CGC | 20 | 28 | 41.5 | 12.4 | 58.0 | 24.3 |
| CGC | 20 | 56 | 39.2 | 6.8 | 30.0 | 15.0 |
| CGC | 20 | 84 | 37.2 | 5.4 | 12.0 | 10.3 |
© 2019 by the authors. Licensee MDPI, Basel, Switzerland. This article is an open access article distributed under the terms and conditions of the Creative Commons Attribution (CC BY) license (http://creativecommons.org/licenses/by/4.0/).
Share and Cite
Yang, Z.; Miao, H.; Rui, Z.; Ji, H. Enhanced Formaldehyde Removal from Air Using Fully Biodegradable Chitosan Grafted β-Cyclodextrin Adsorbent with Weak Chemical Interaction. Polymers 2019, 11, 276. https://doi.org/10.3390/polym11020276
Yang Z, Miao H, Rui Z, Ji H. Enhanced Formaldehyde Removal from Air Using Fully Biodegradable Chitosan Grafted β-Cyclodextrin Adsorbent with Weak Chemical Interaction. Polymers. 2019; 11(2):276. https://doi.org/10.3390/polym11020276
Chicago/Turabian StyleYang, Zujin, Hongchen Miao, Zebao Rui, and Hongbing Ji. 2019. "Enhanced Formaldehyde Removal from Air Using Fully Biodegradable Chitosan Grafted β-Cyclodextrin Adsorbent with Weak Chemical Interaction" Polymers 11, no. 2: 276. https://doi.org/10.3390/polym11020276
APA StyleYang, Z., Miao, H., Rui, Z., & Ji, H. (2019). Enhanced Formaldehyde Removal from Air Using Fully Biodegradable Chitosan Grafted β-Cyclodextrin Adsorbent with Weak Chemical Interaction. Polymers, 11(2), 276. https://doi.org/10.3390/polym11020276