Influence of the Design Solutions of Extruder Screw Mixing Tip on Selected Properties of Wheat Bran-Polyethylene Biocomposite


Abstract
:1. Introduction
2. Experimental
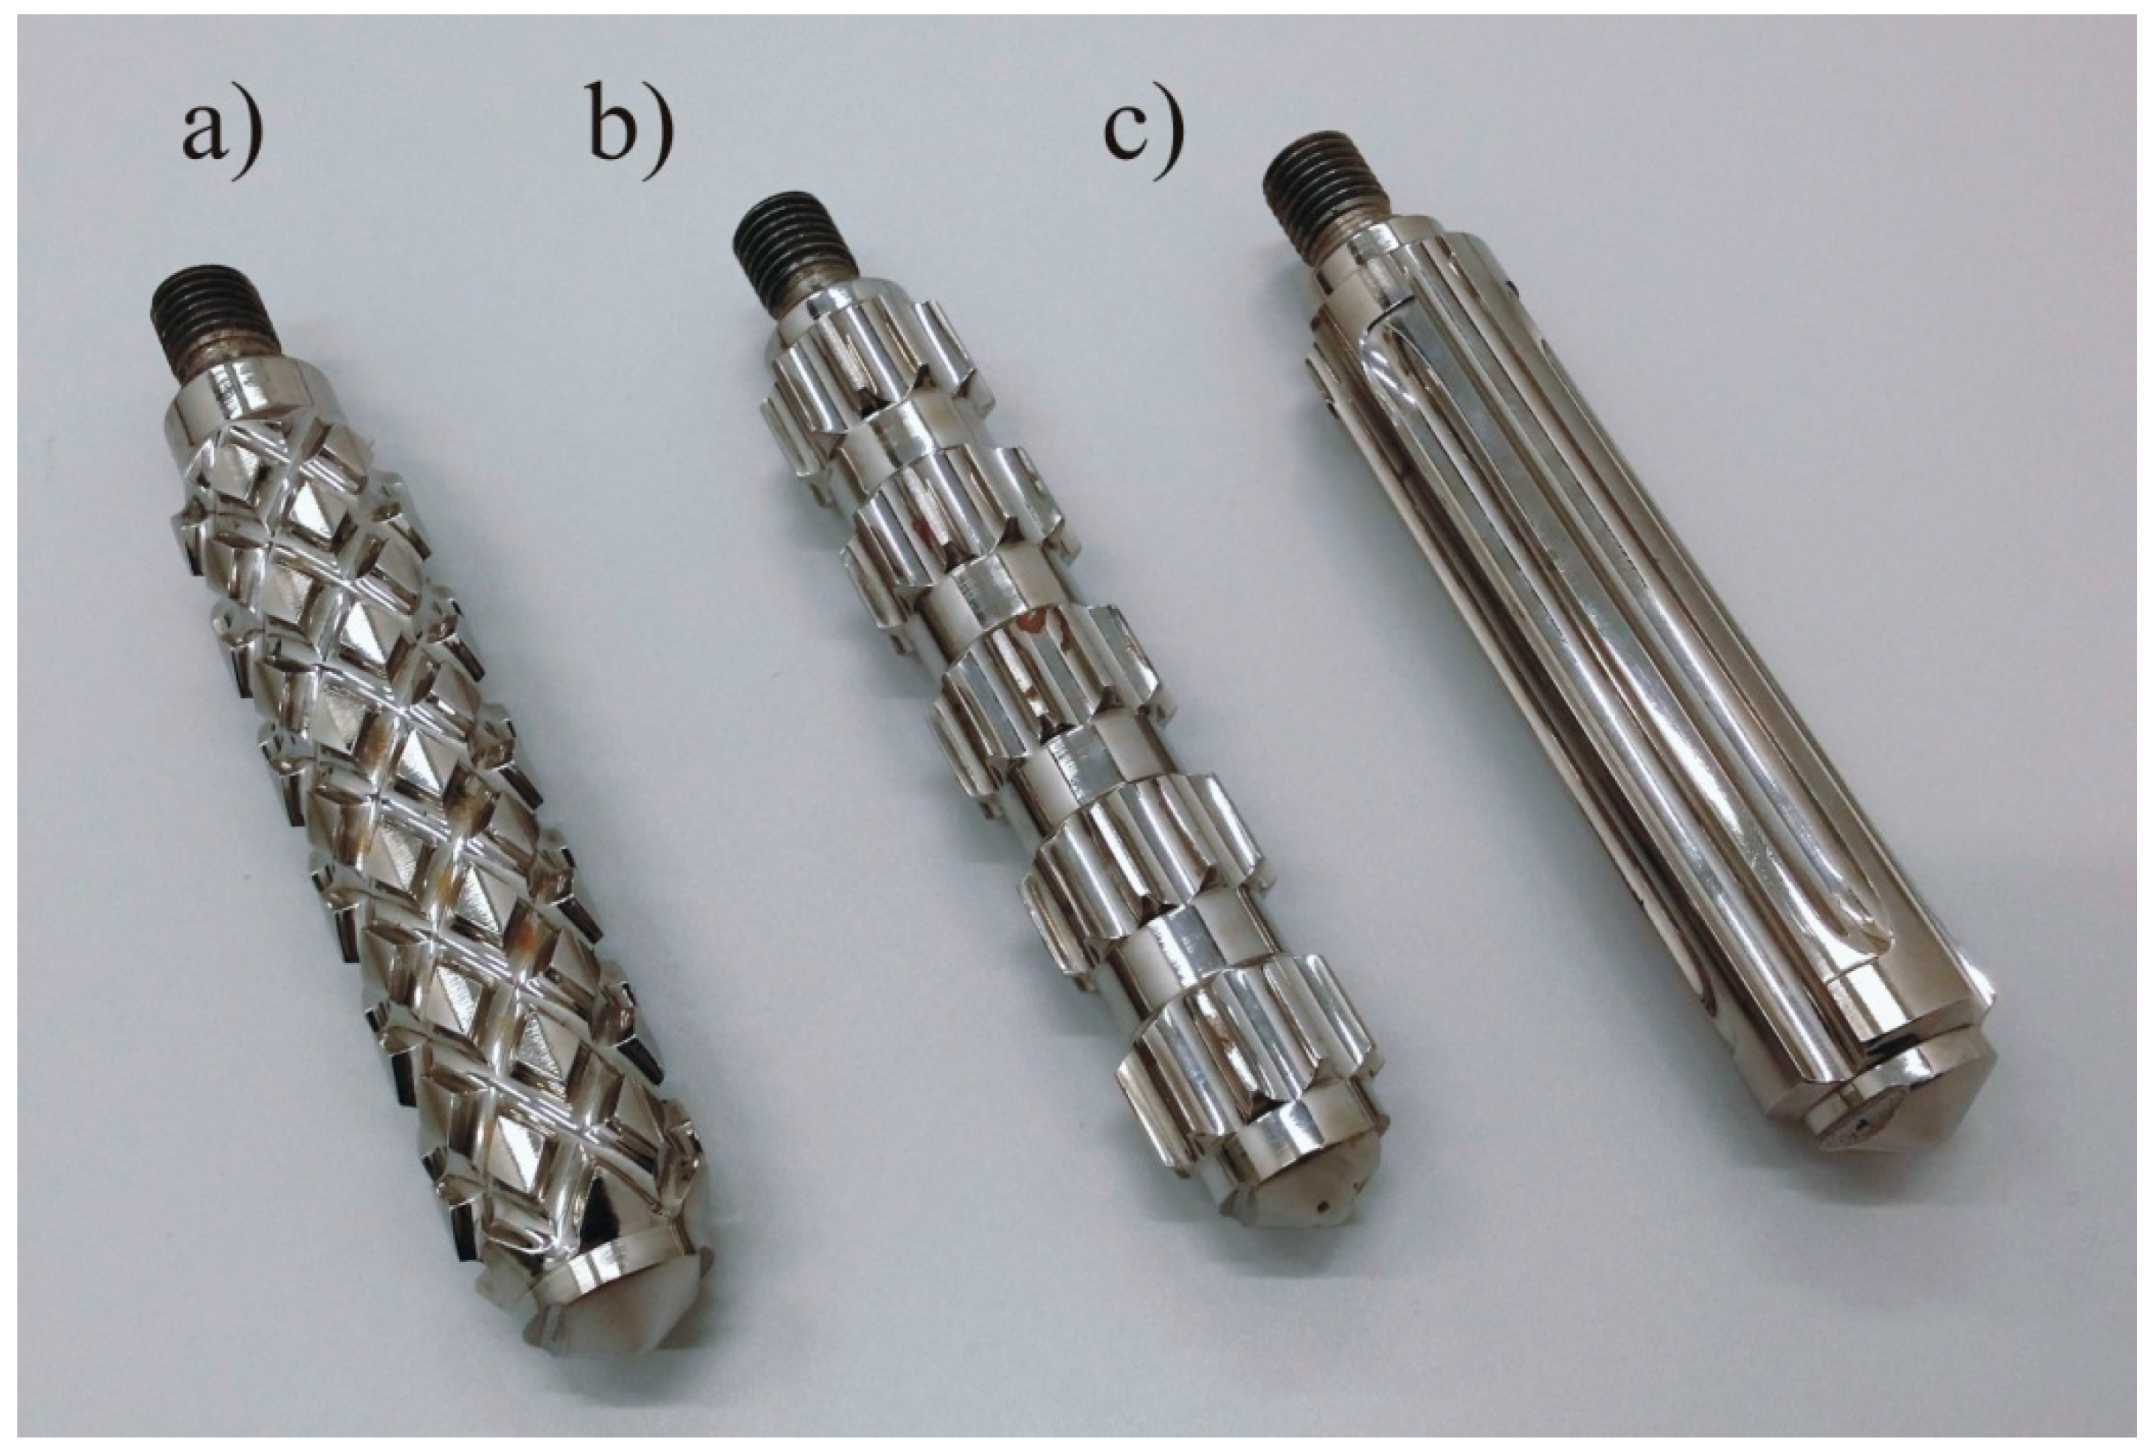
2.1. Test Stand
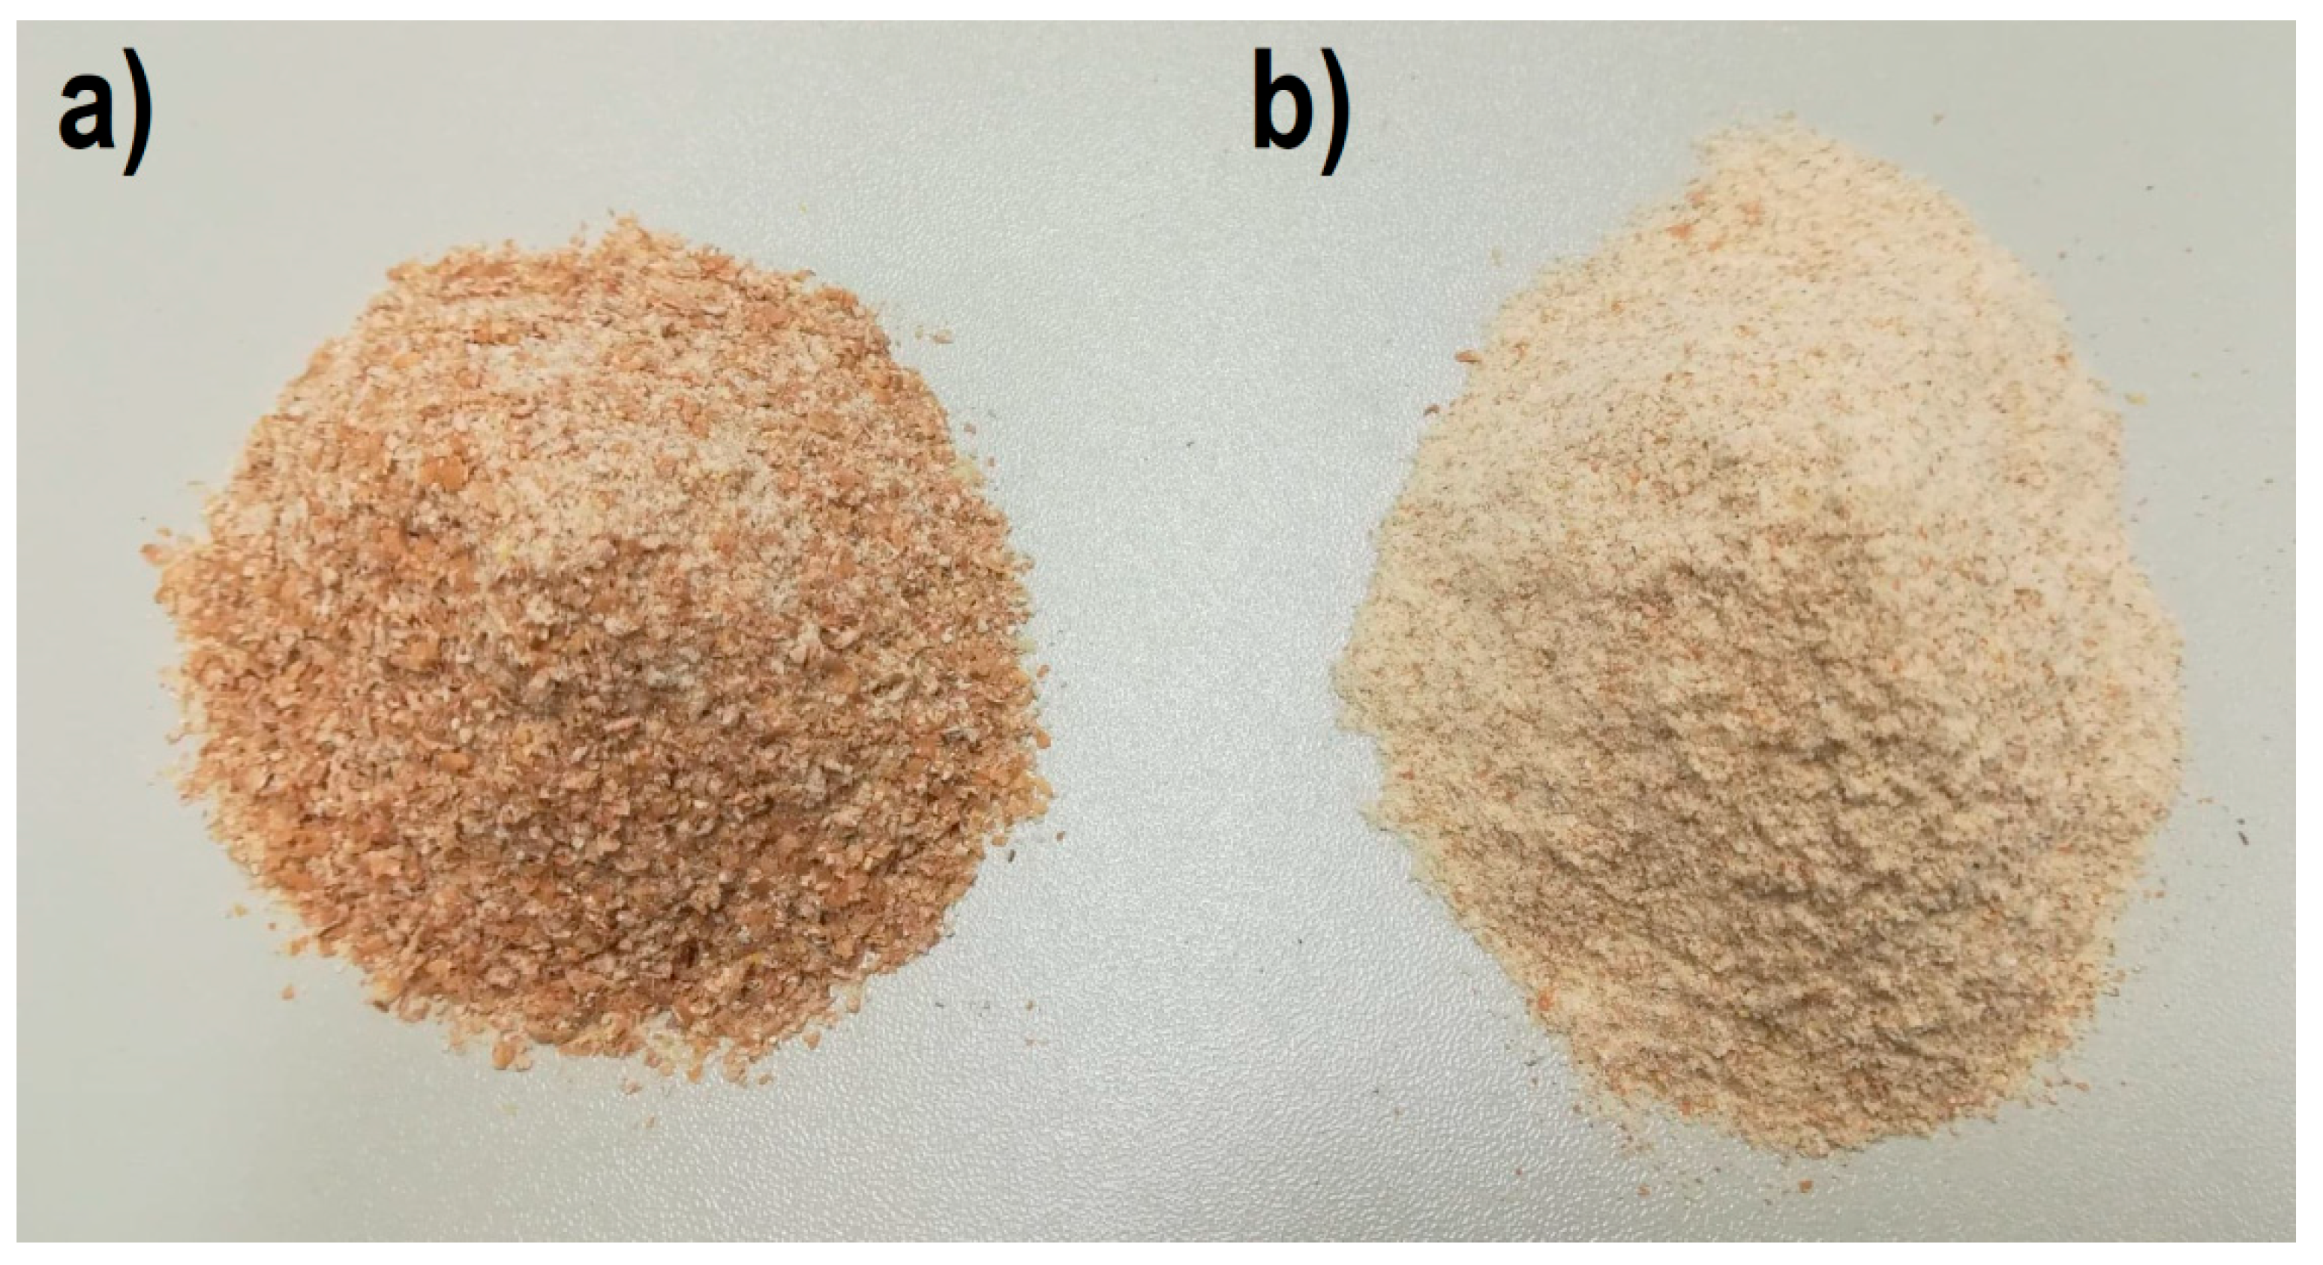
2.2. Research Program and Methodology
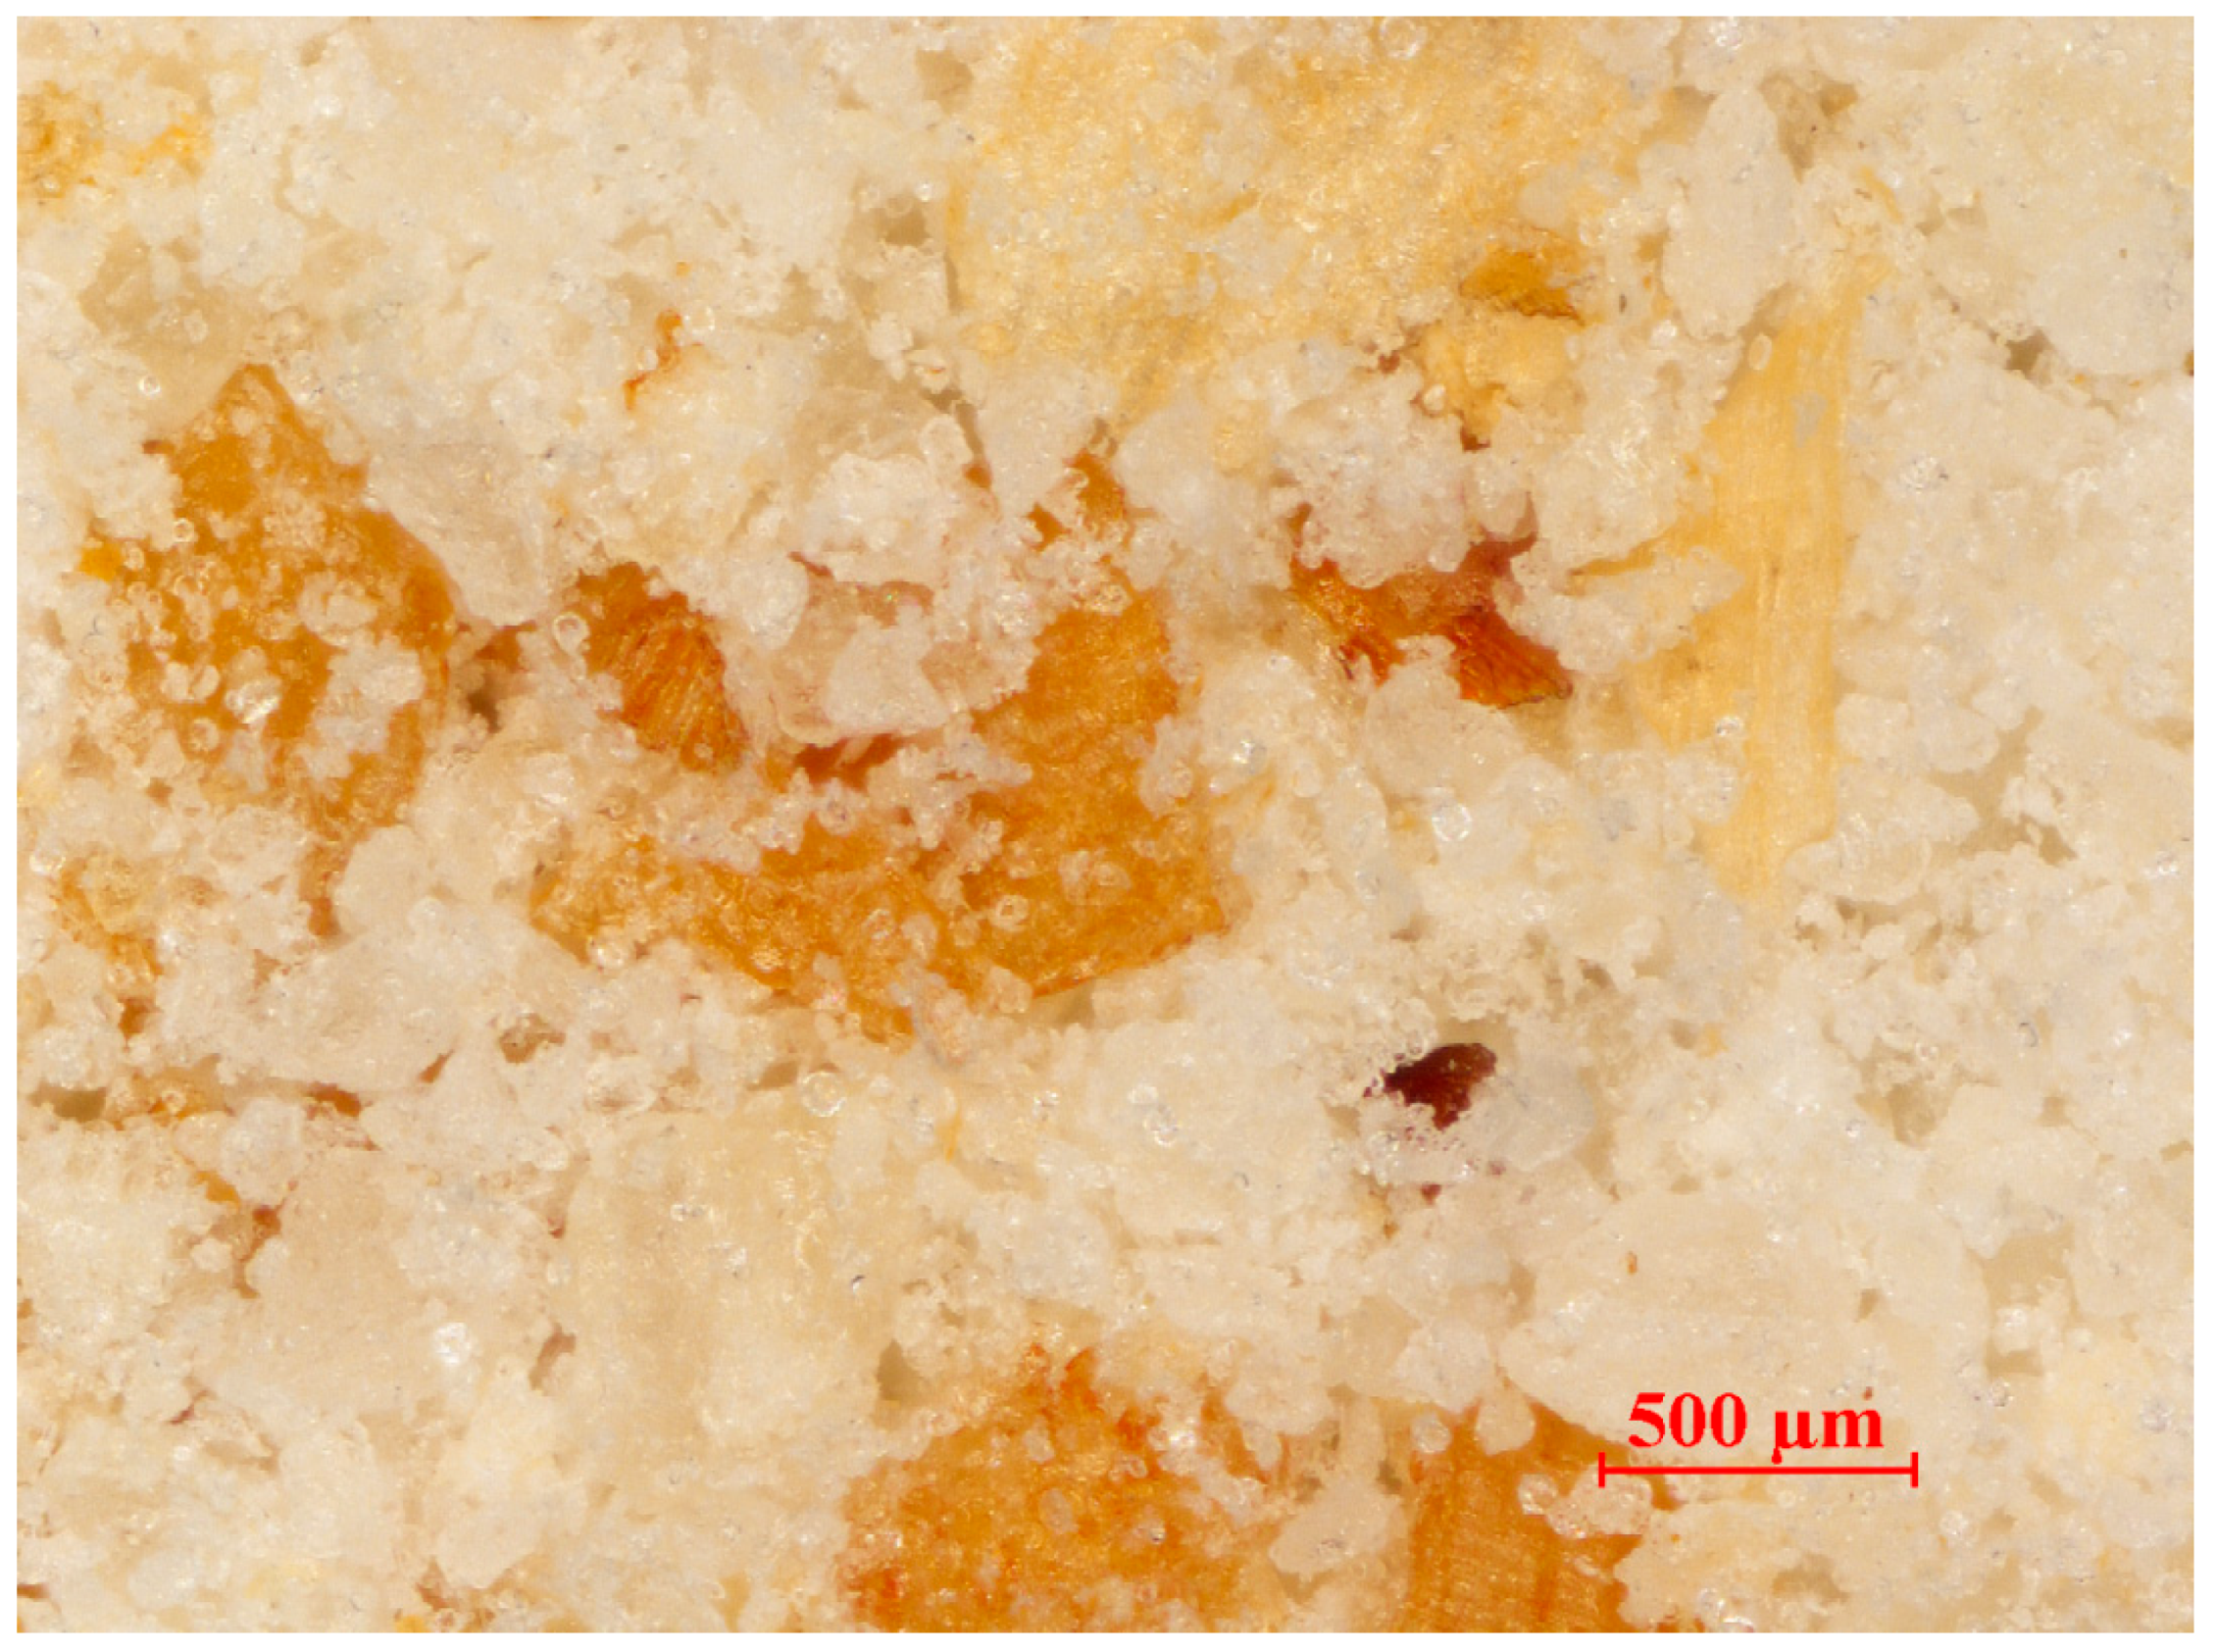
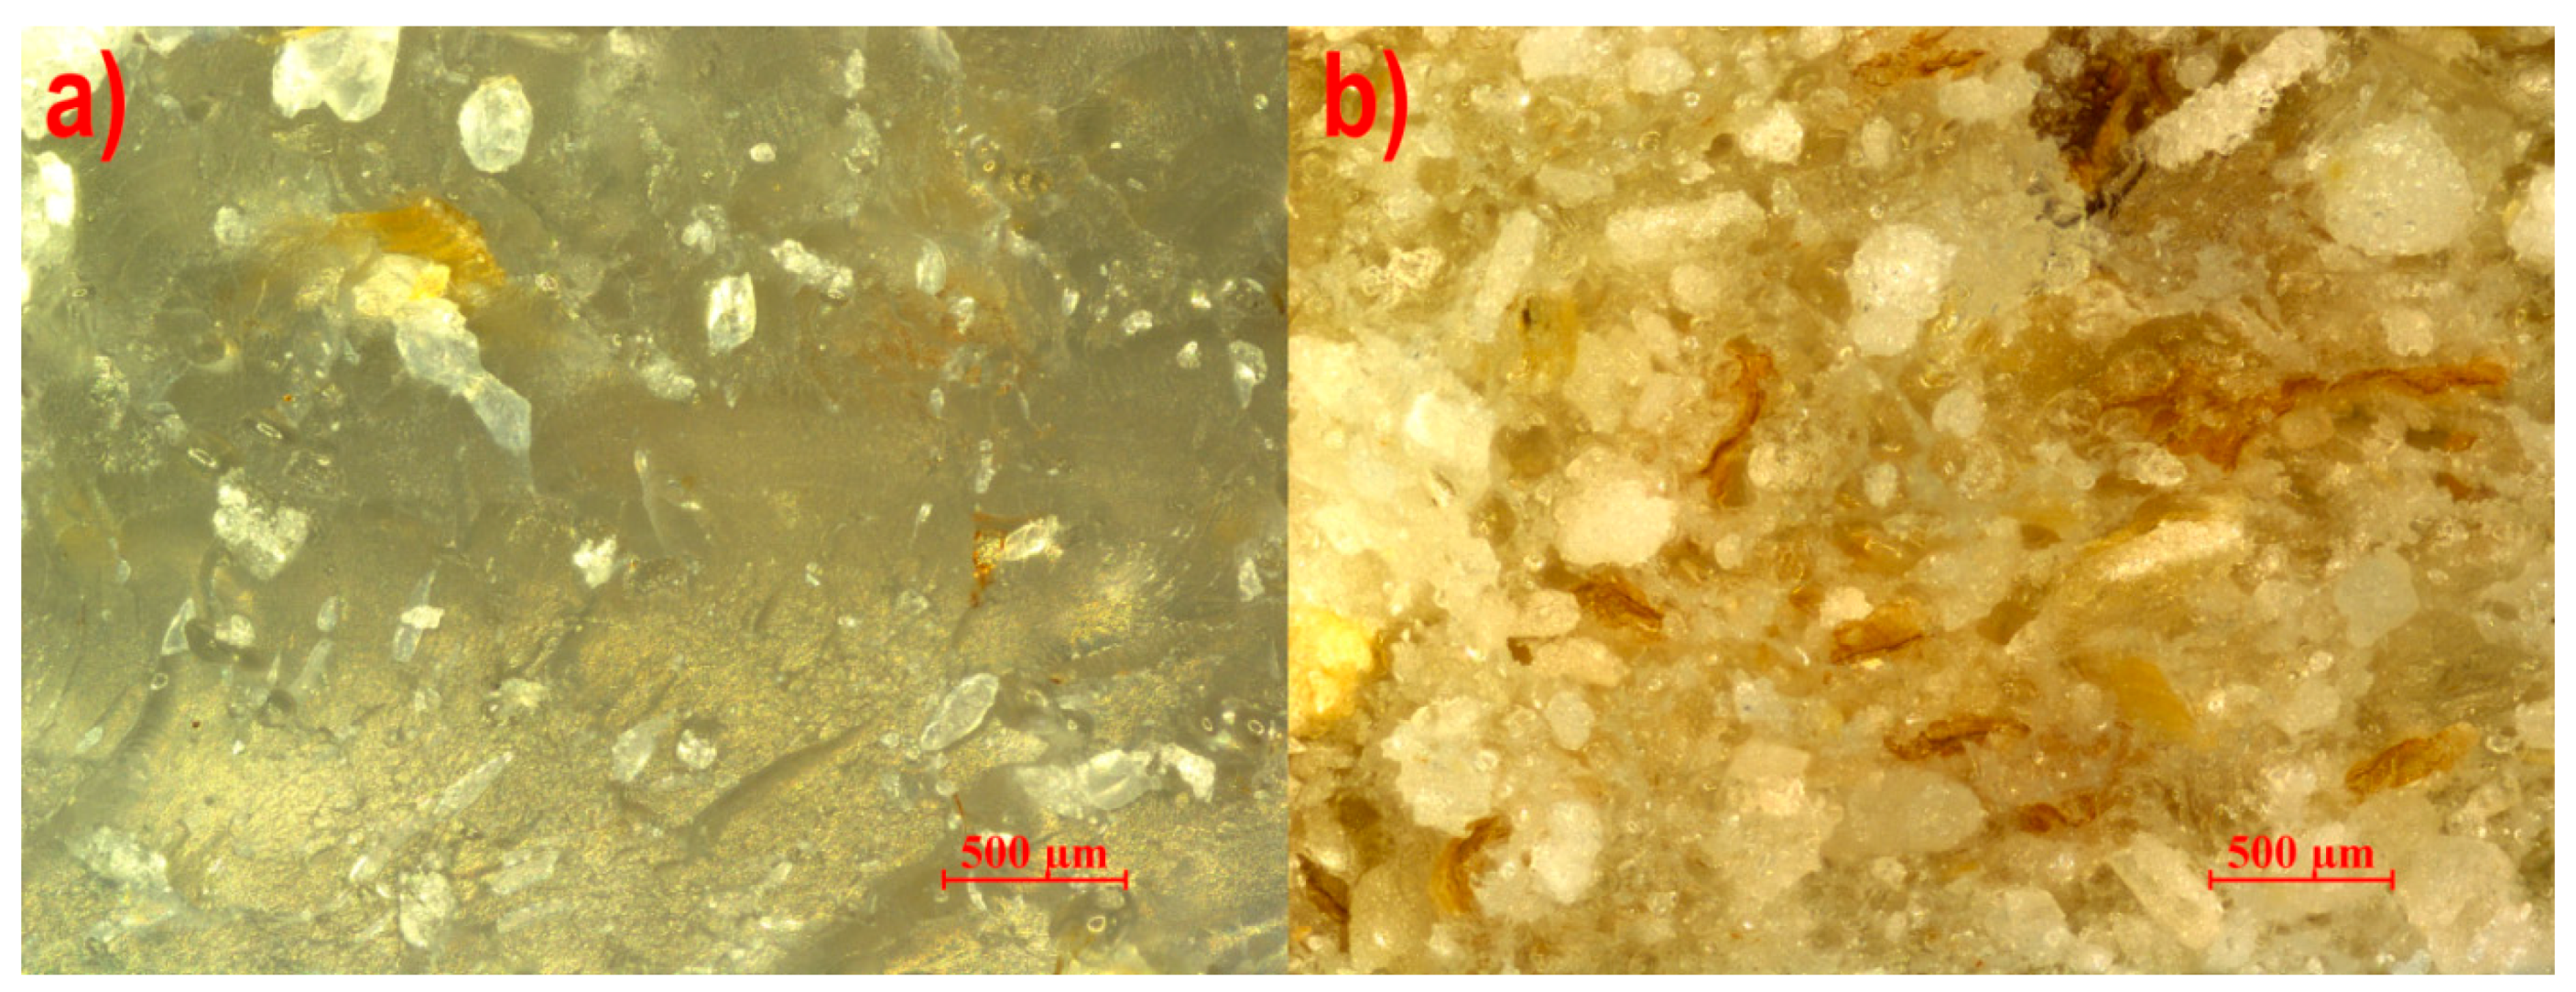
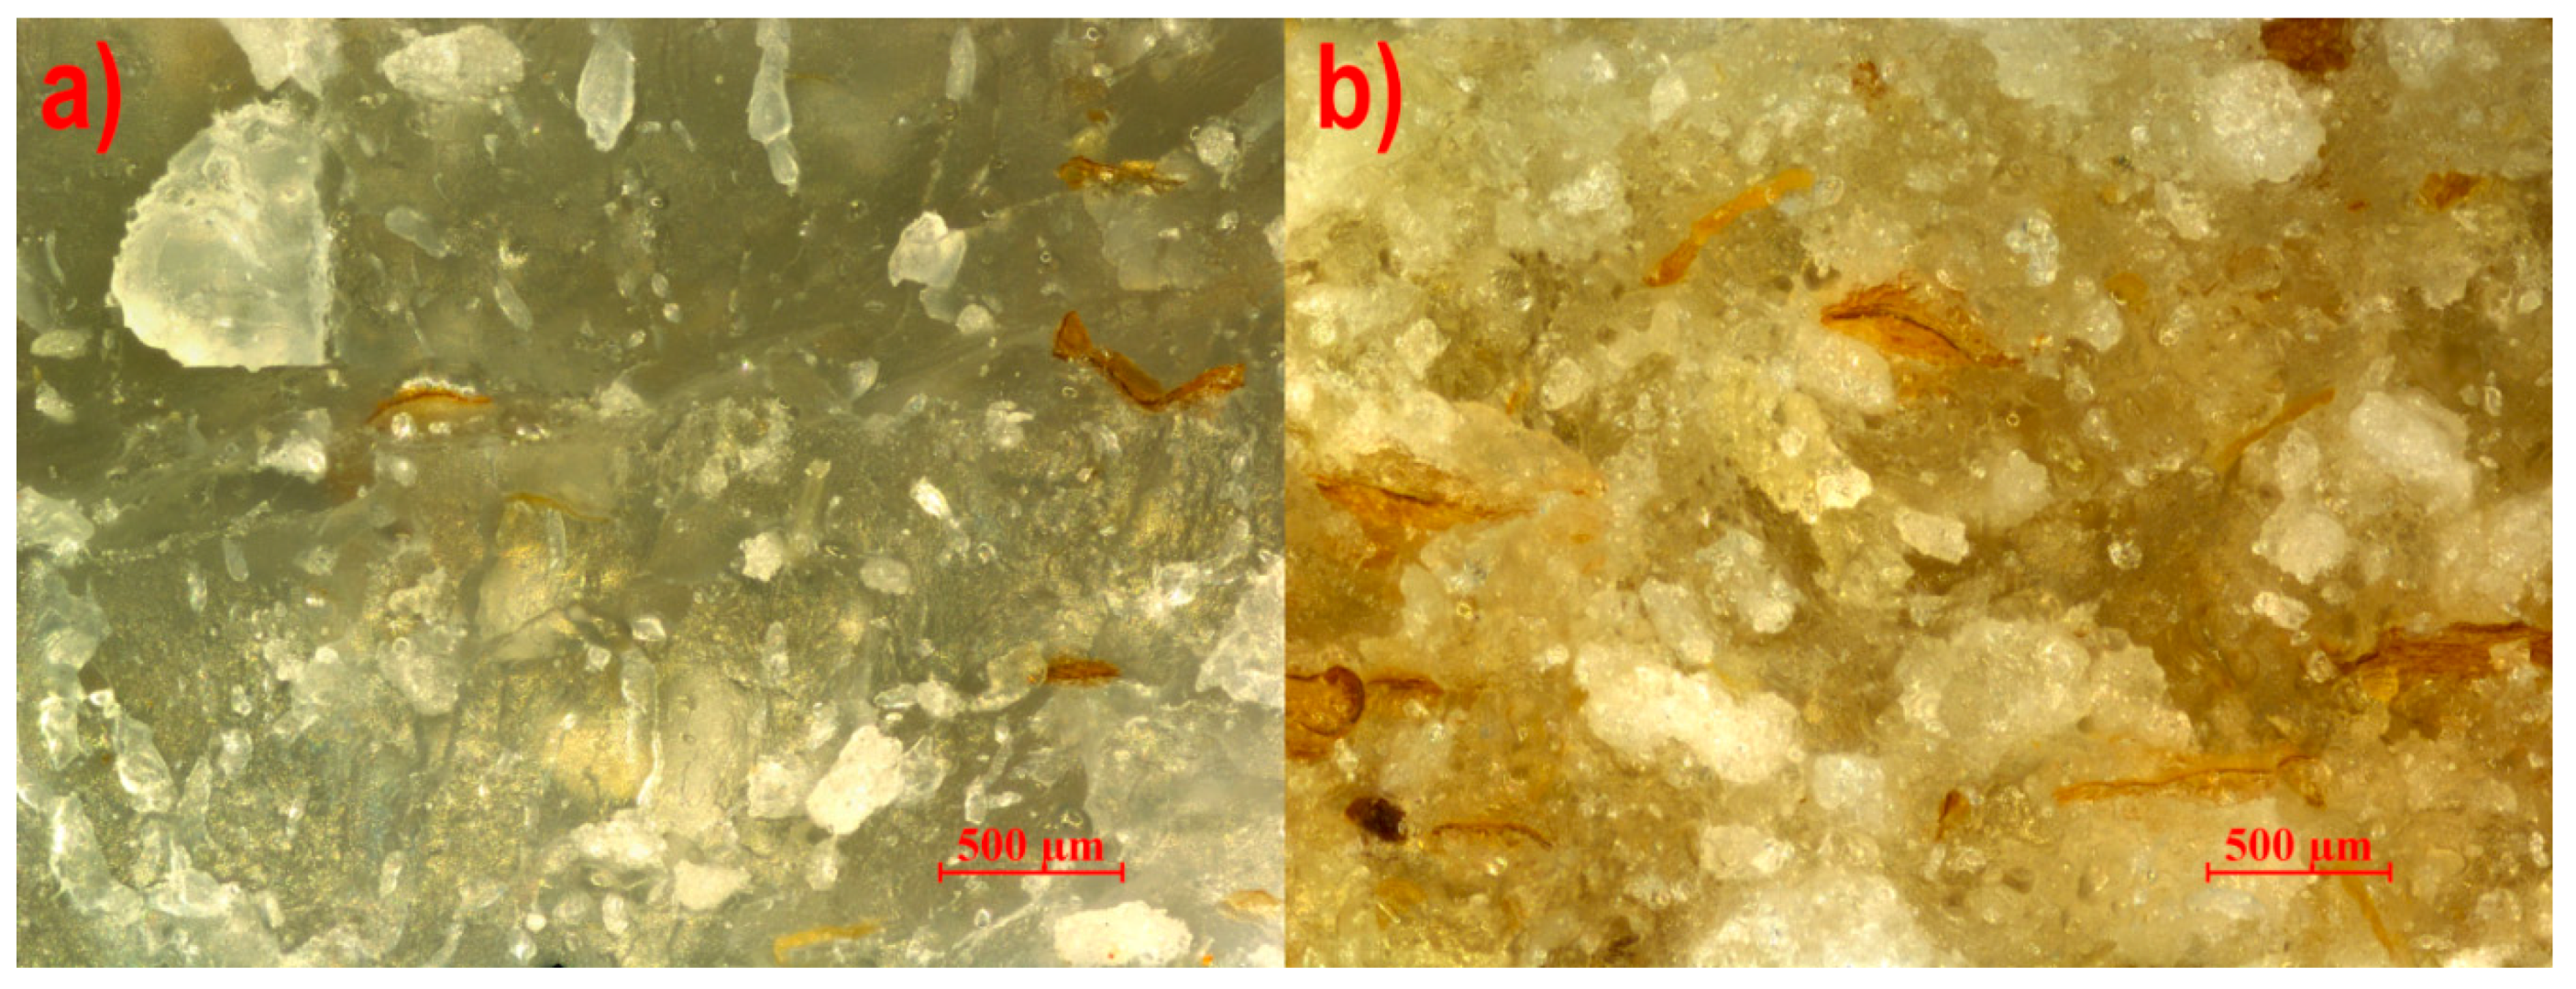
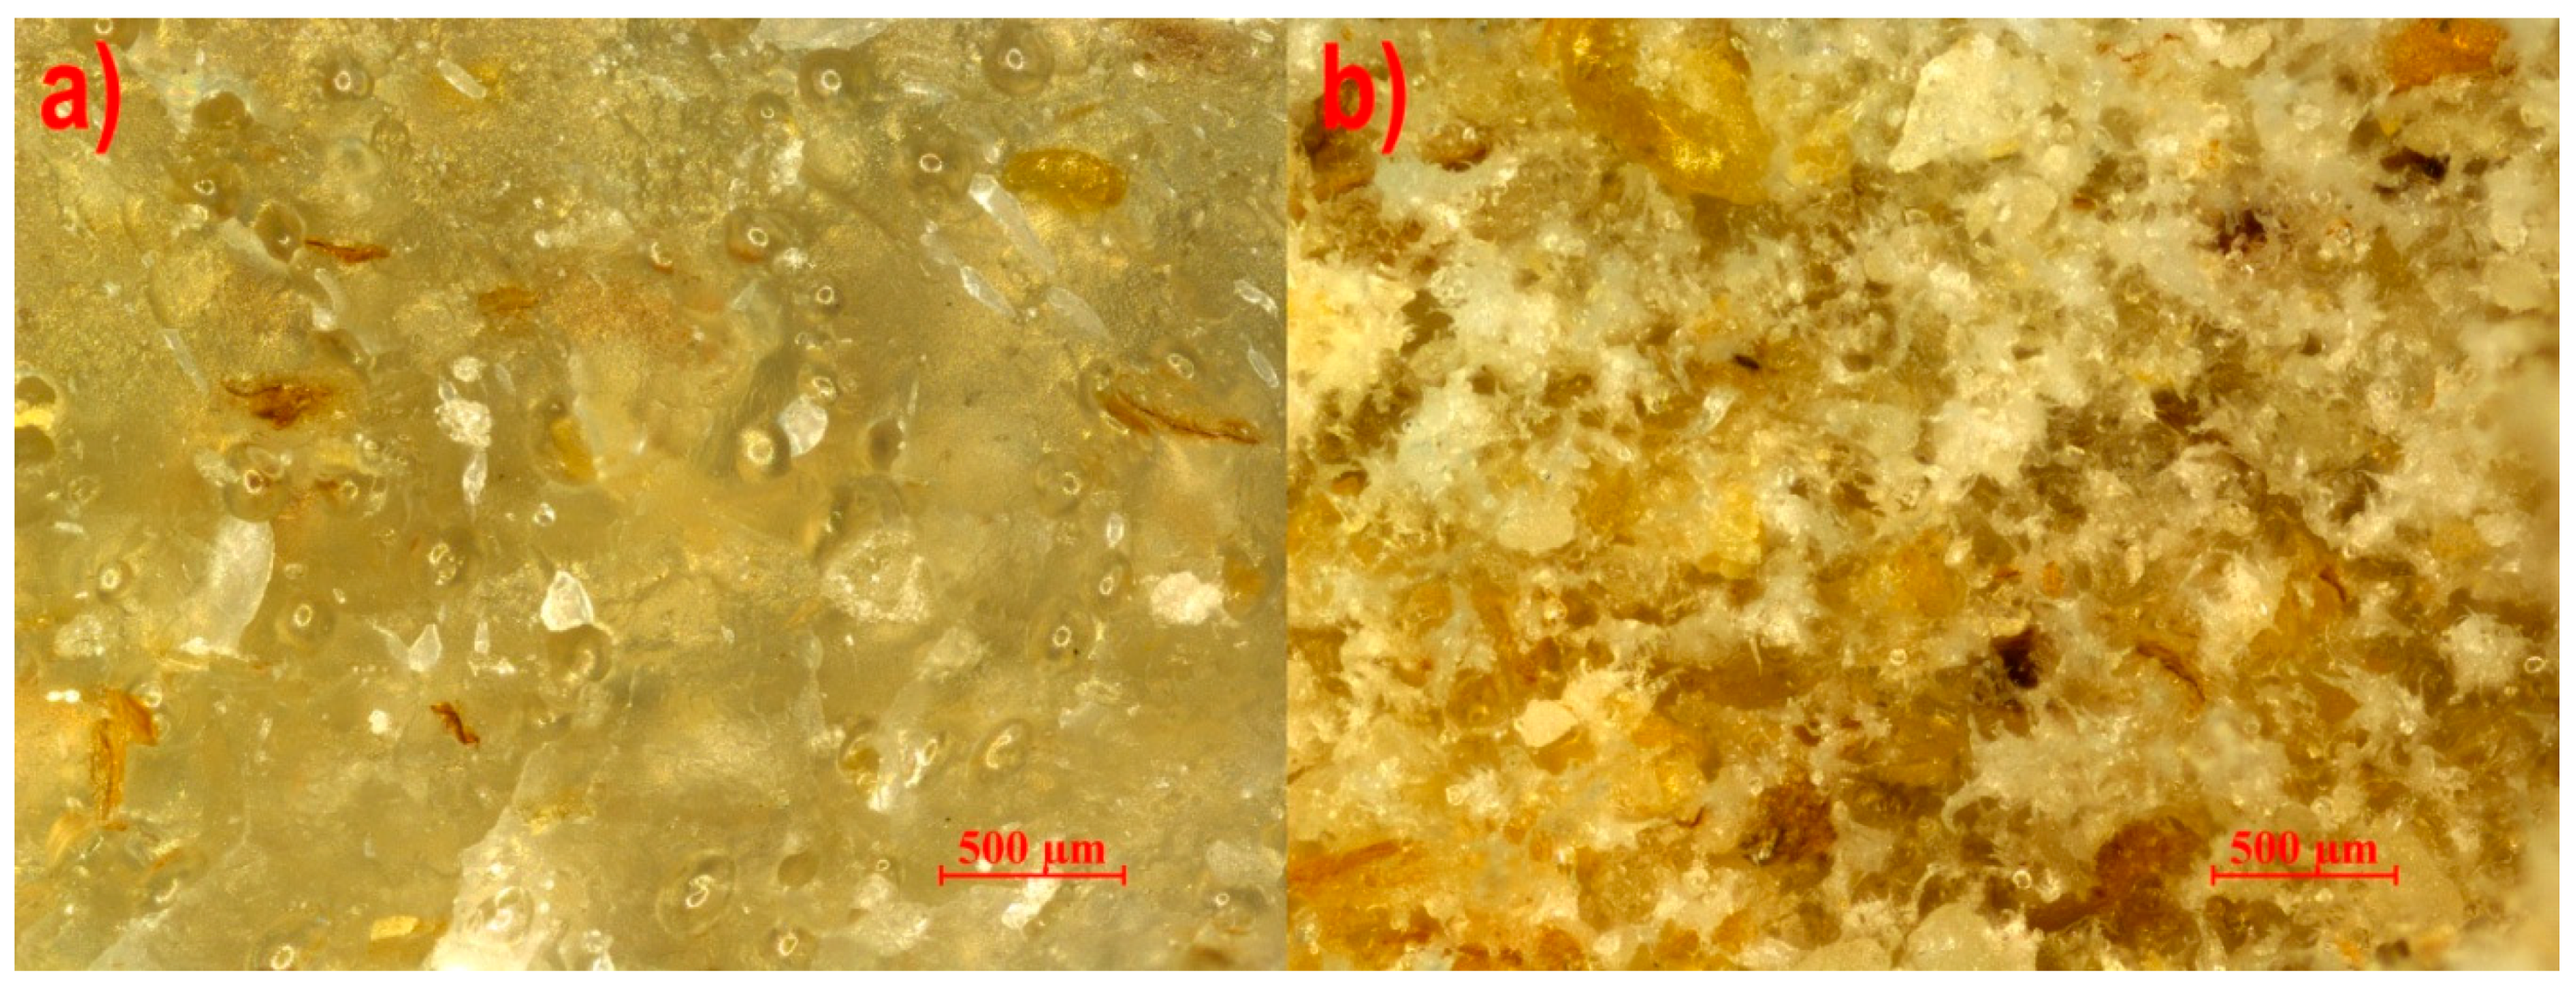
- Observation of the structure of the extrudate samples using a NIKON optical microscope model Eclipse LV100ND equipped with a DS-U3 camera. Image analysis was performed in the NIS-Elements AR 4.20.00 software. The extrudate samples were prepared for microscopic observation by making their fractures perpendicular to the direction of the extrusion. In order to achieve a brittle breakthrough, the strips were cooled in liquid nitrogen for one minute before breaking. The dark field method was used for observation;
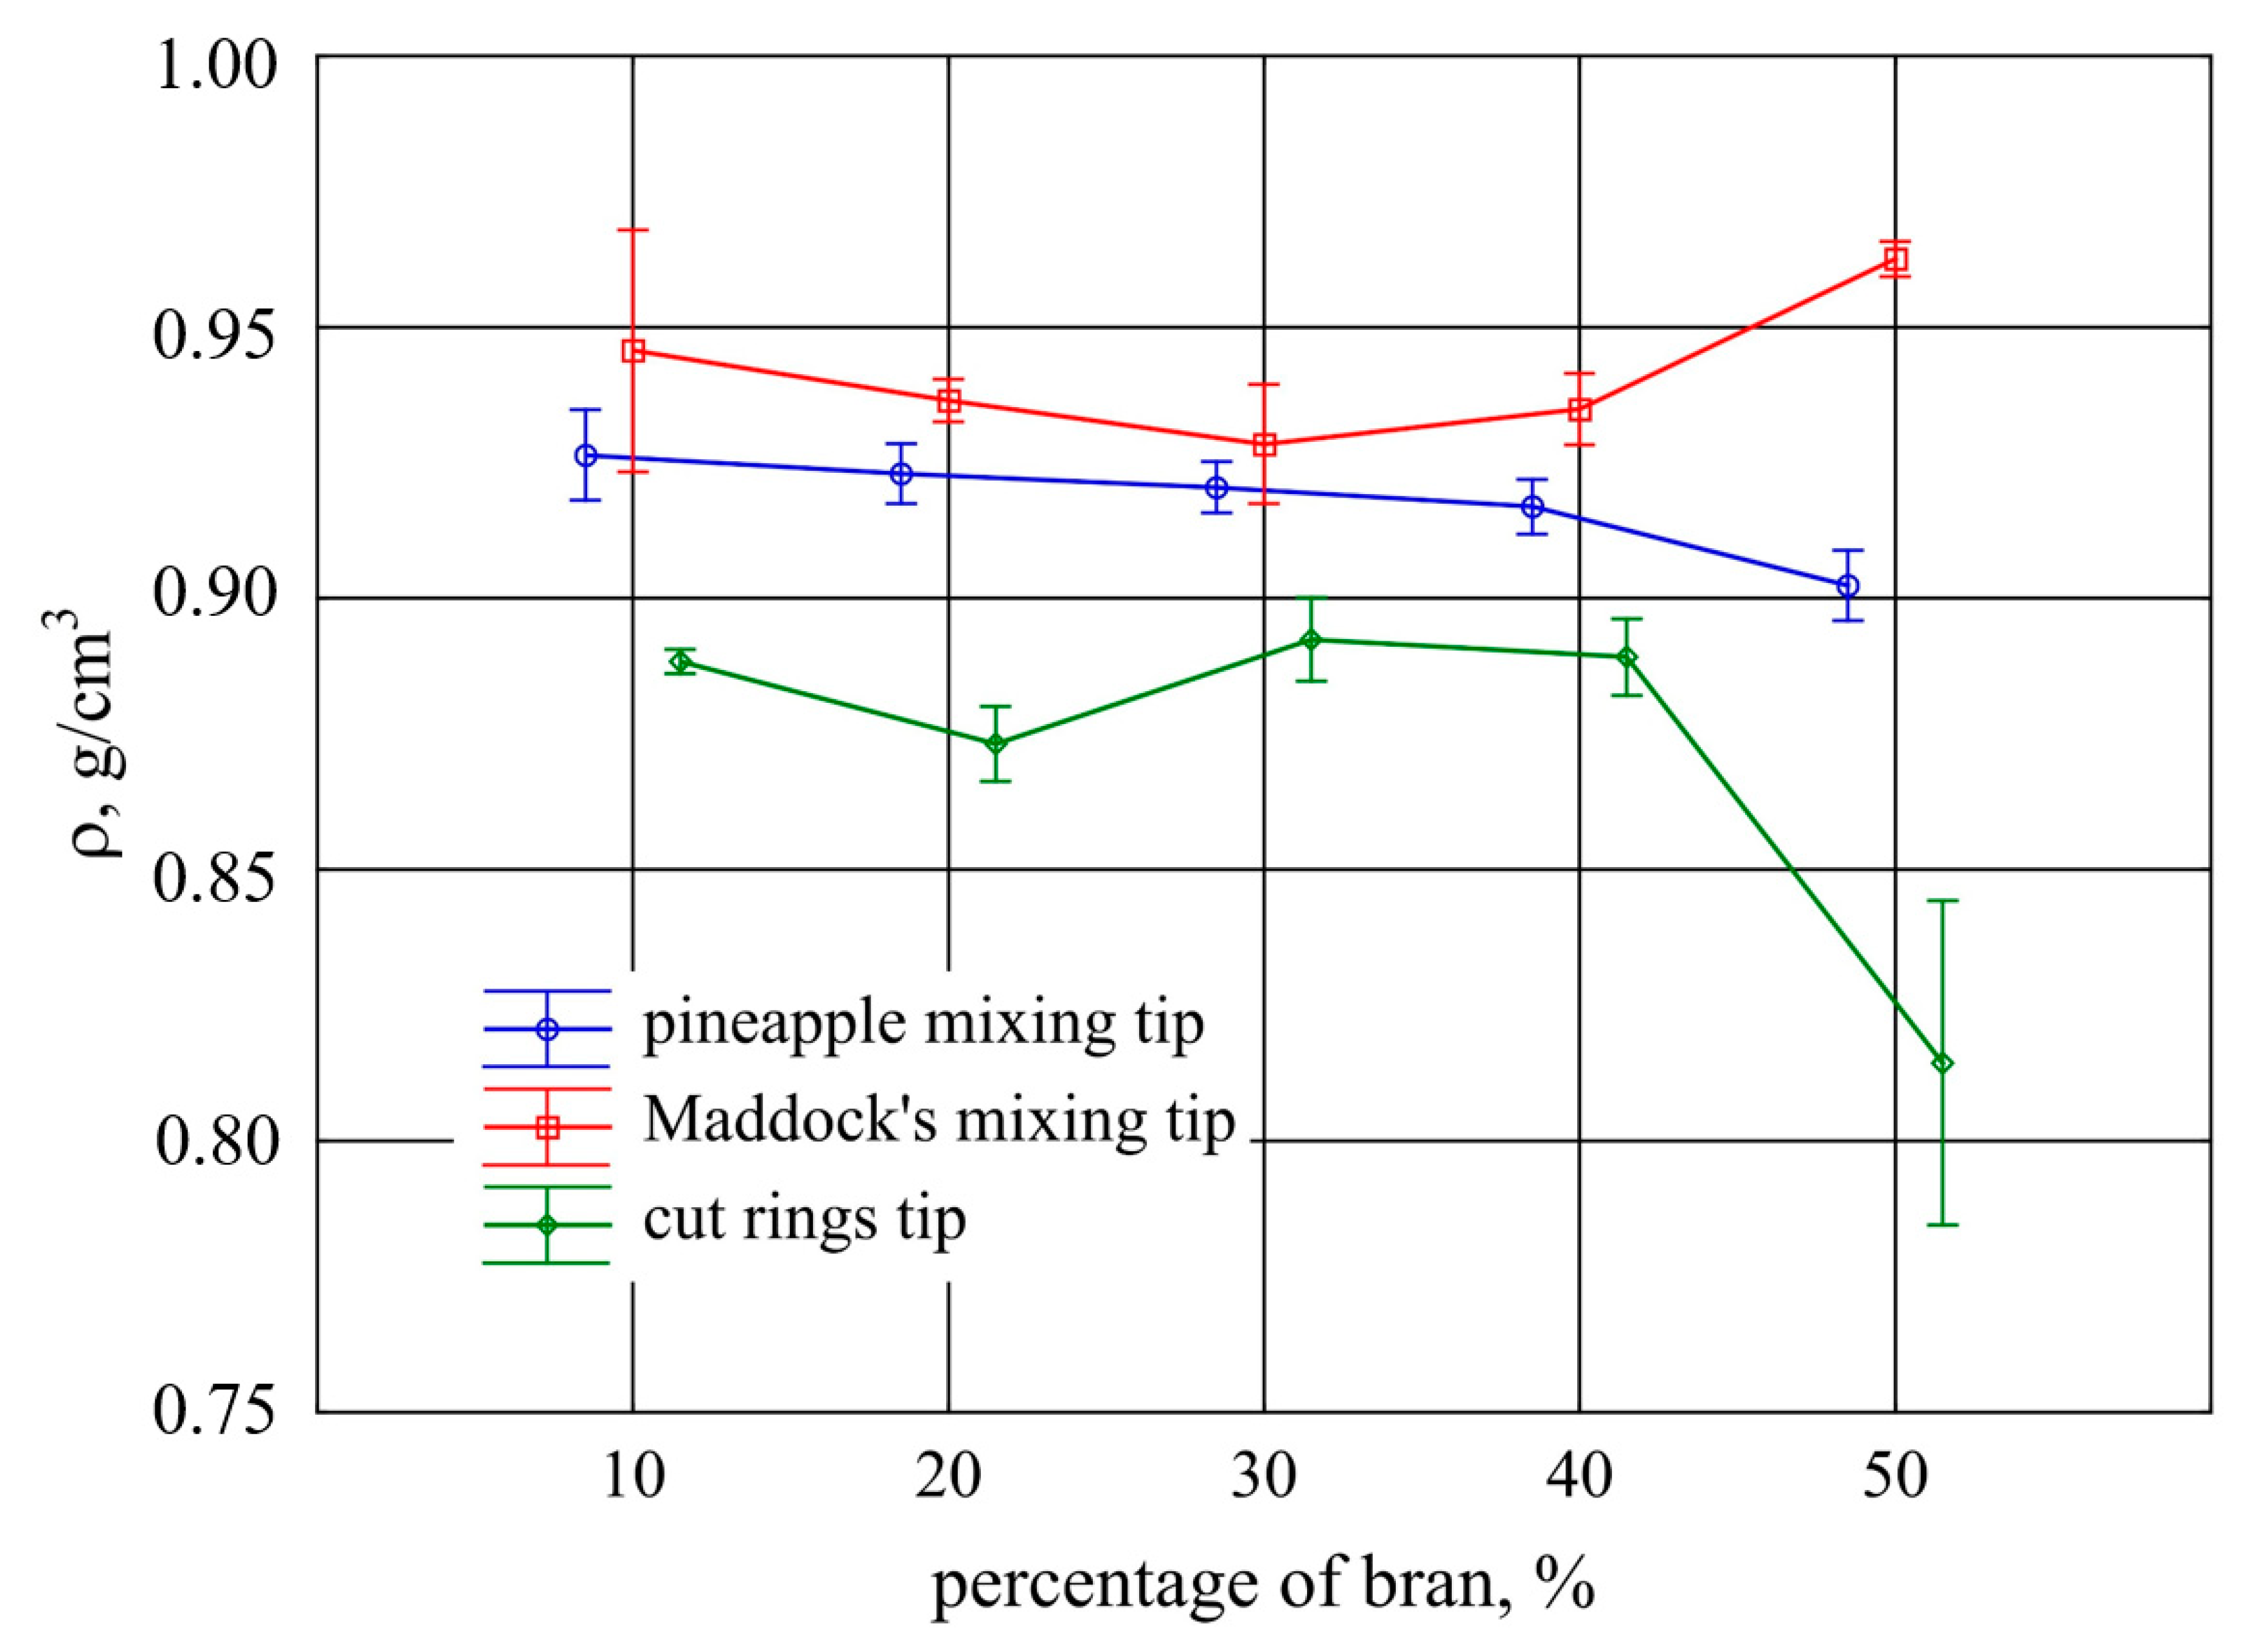
- Normal density measurement of the extrudate ρ g/cm3, in accordance with EN ISO 1183-1:2019 [76], using a Radwag AS 82/220.R2 digital scale with a density measurement attachment;
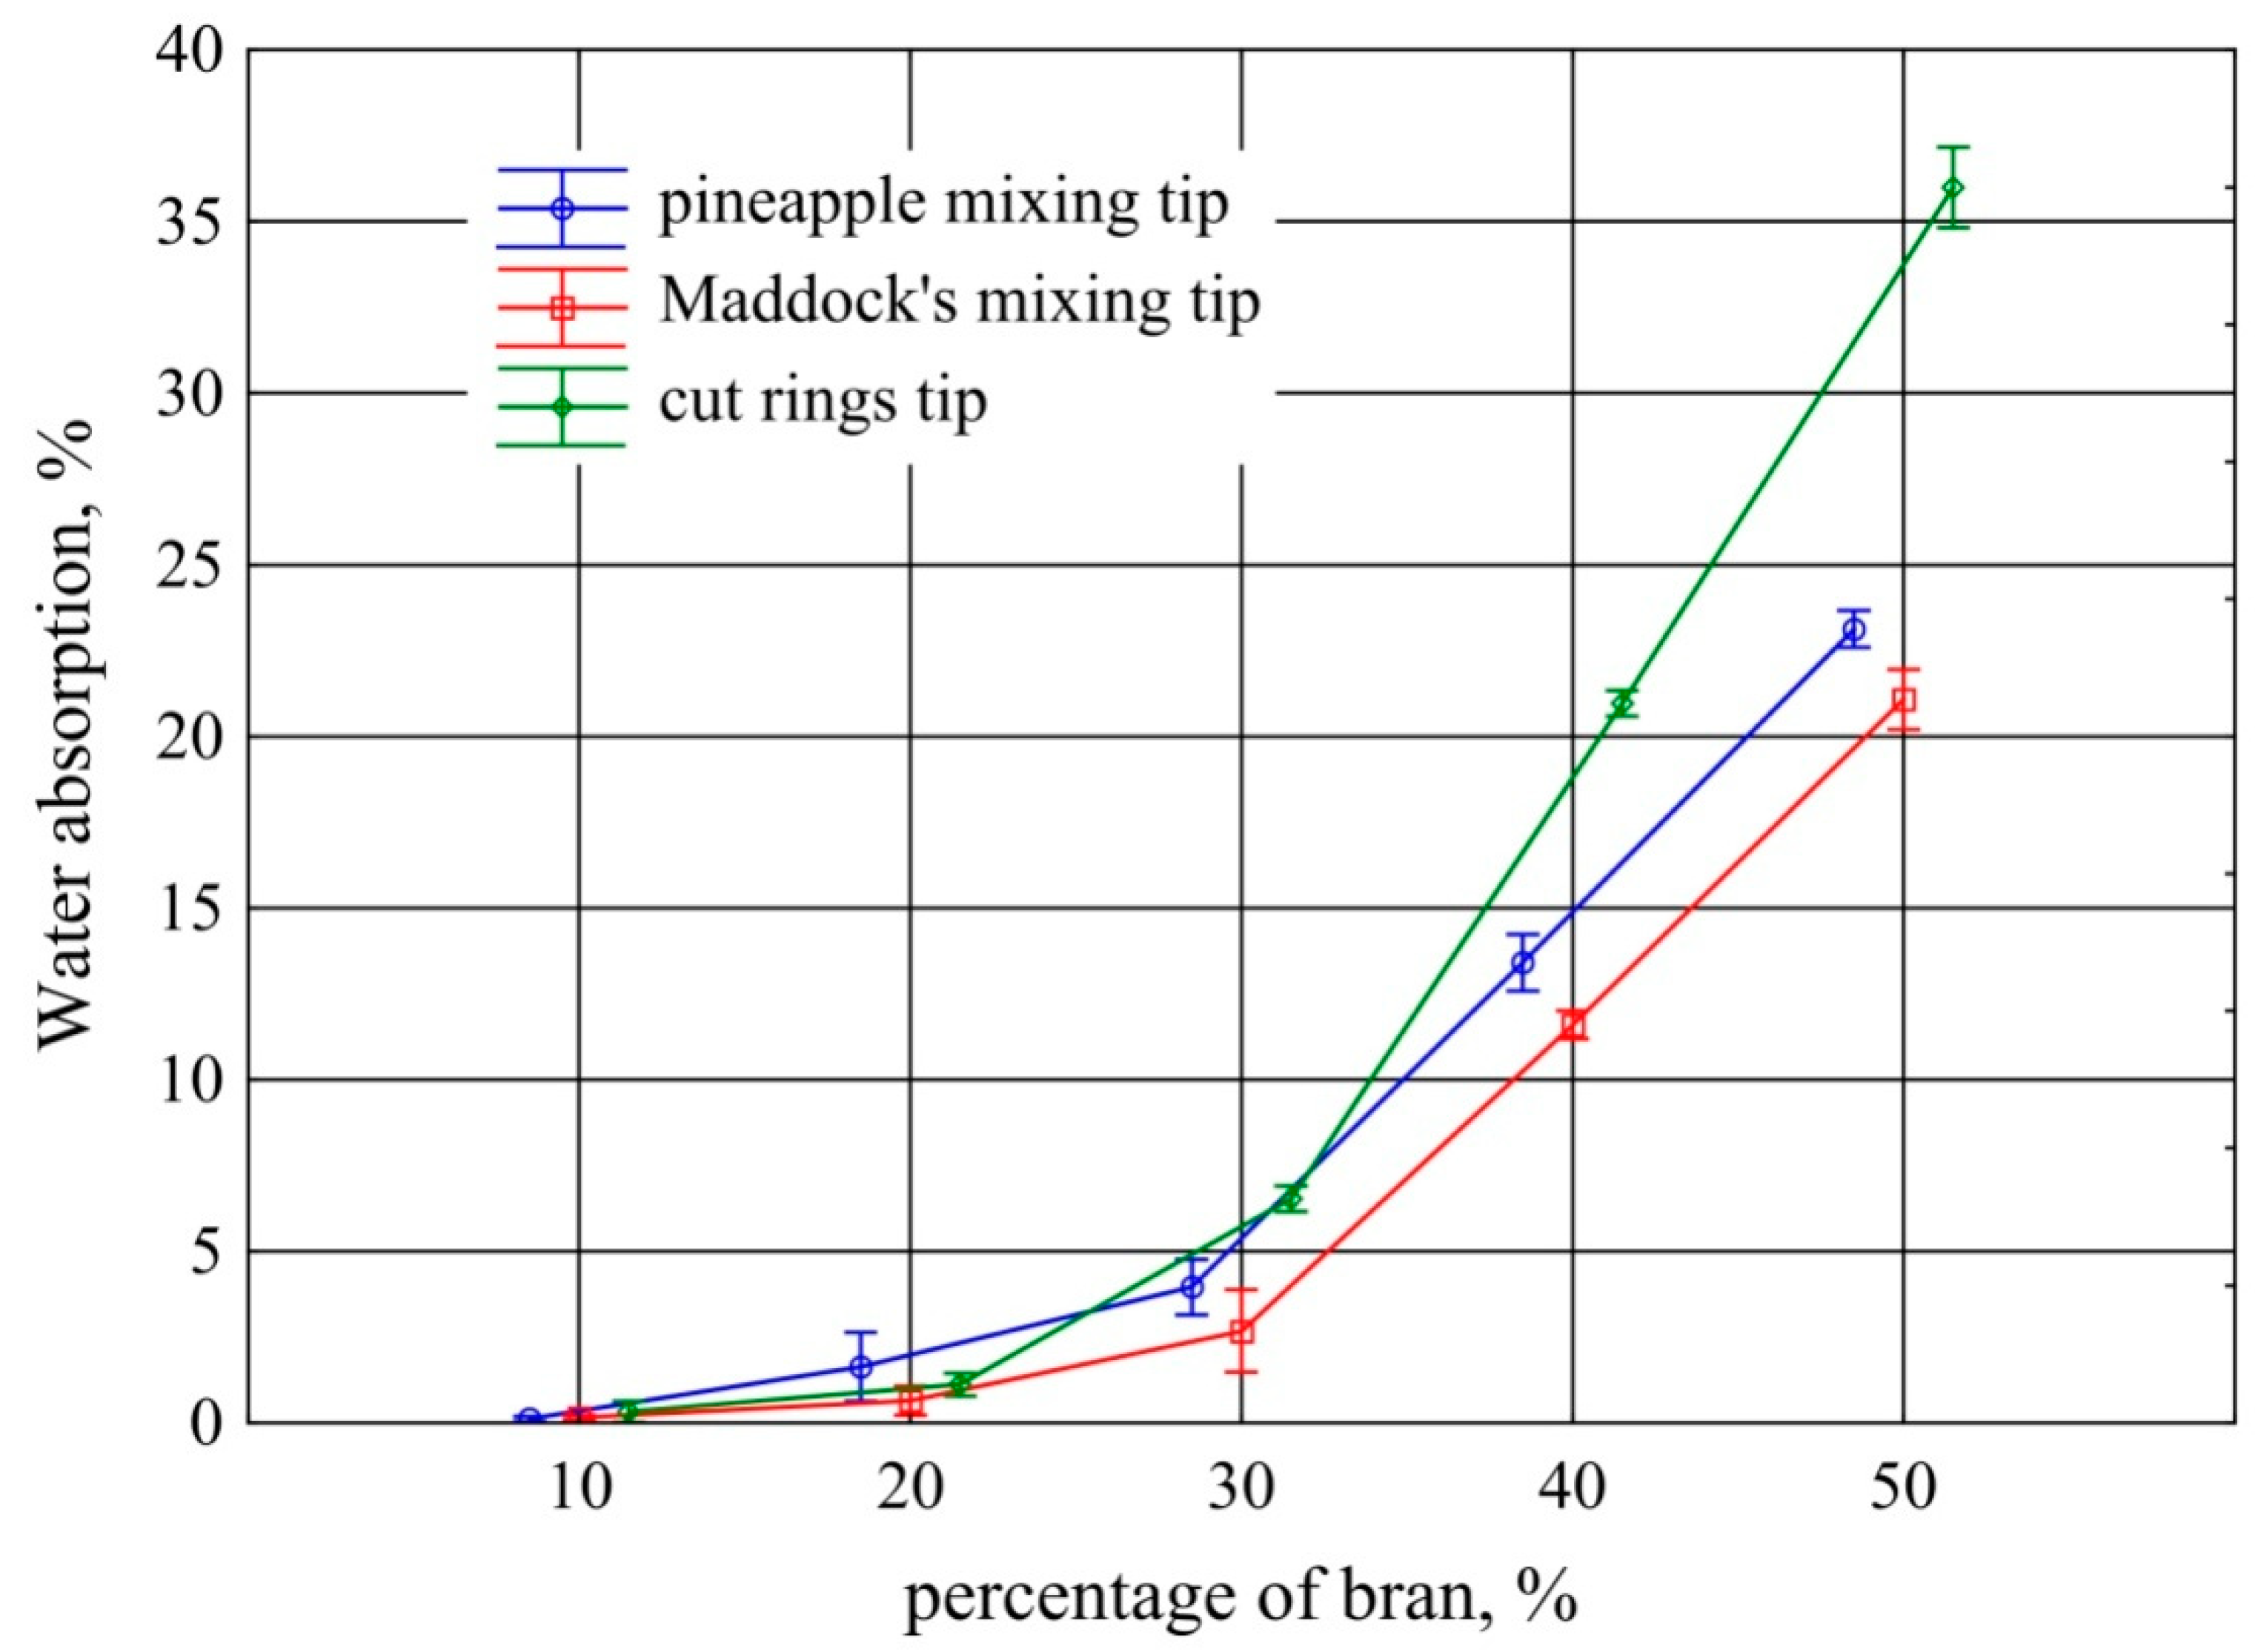
- Measurement of water absorption in percentage. In order to determine the water absorption, the obtained extrudate was predried in a thermal chamber and weighed. Then, the samples were kept in water at 22 °C for 7 days. Then, the extrudate samples were weighed again, and water absorption was determined in accordance with EN ISO 62:2008 [77];
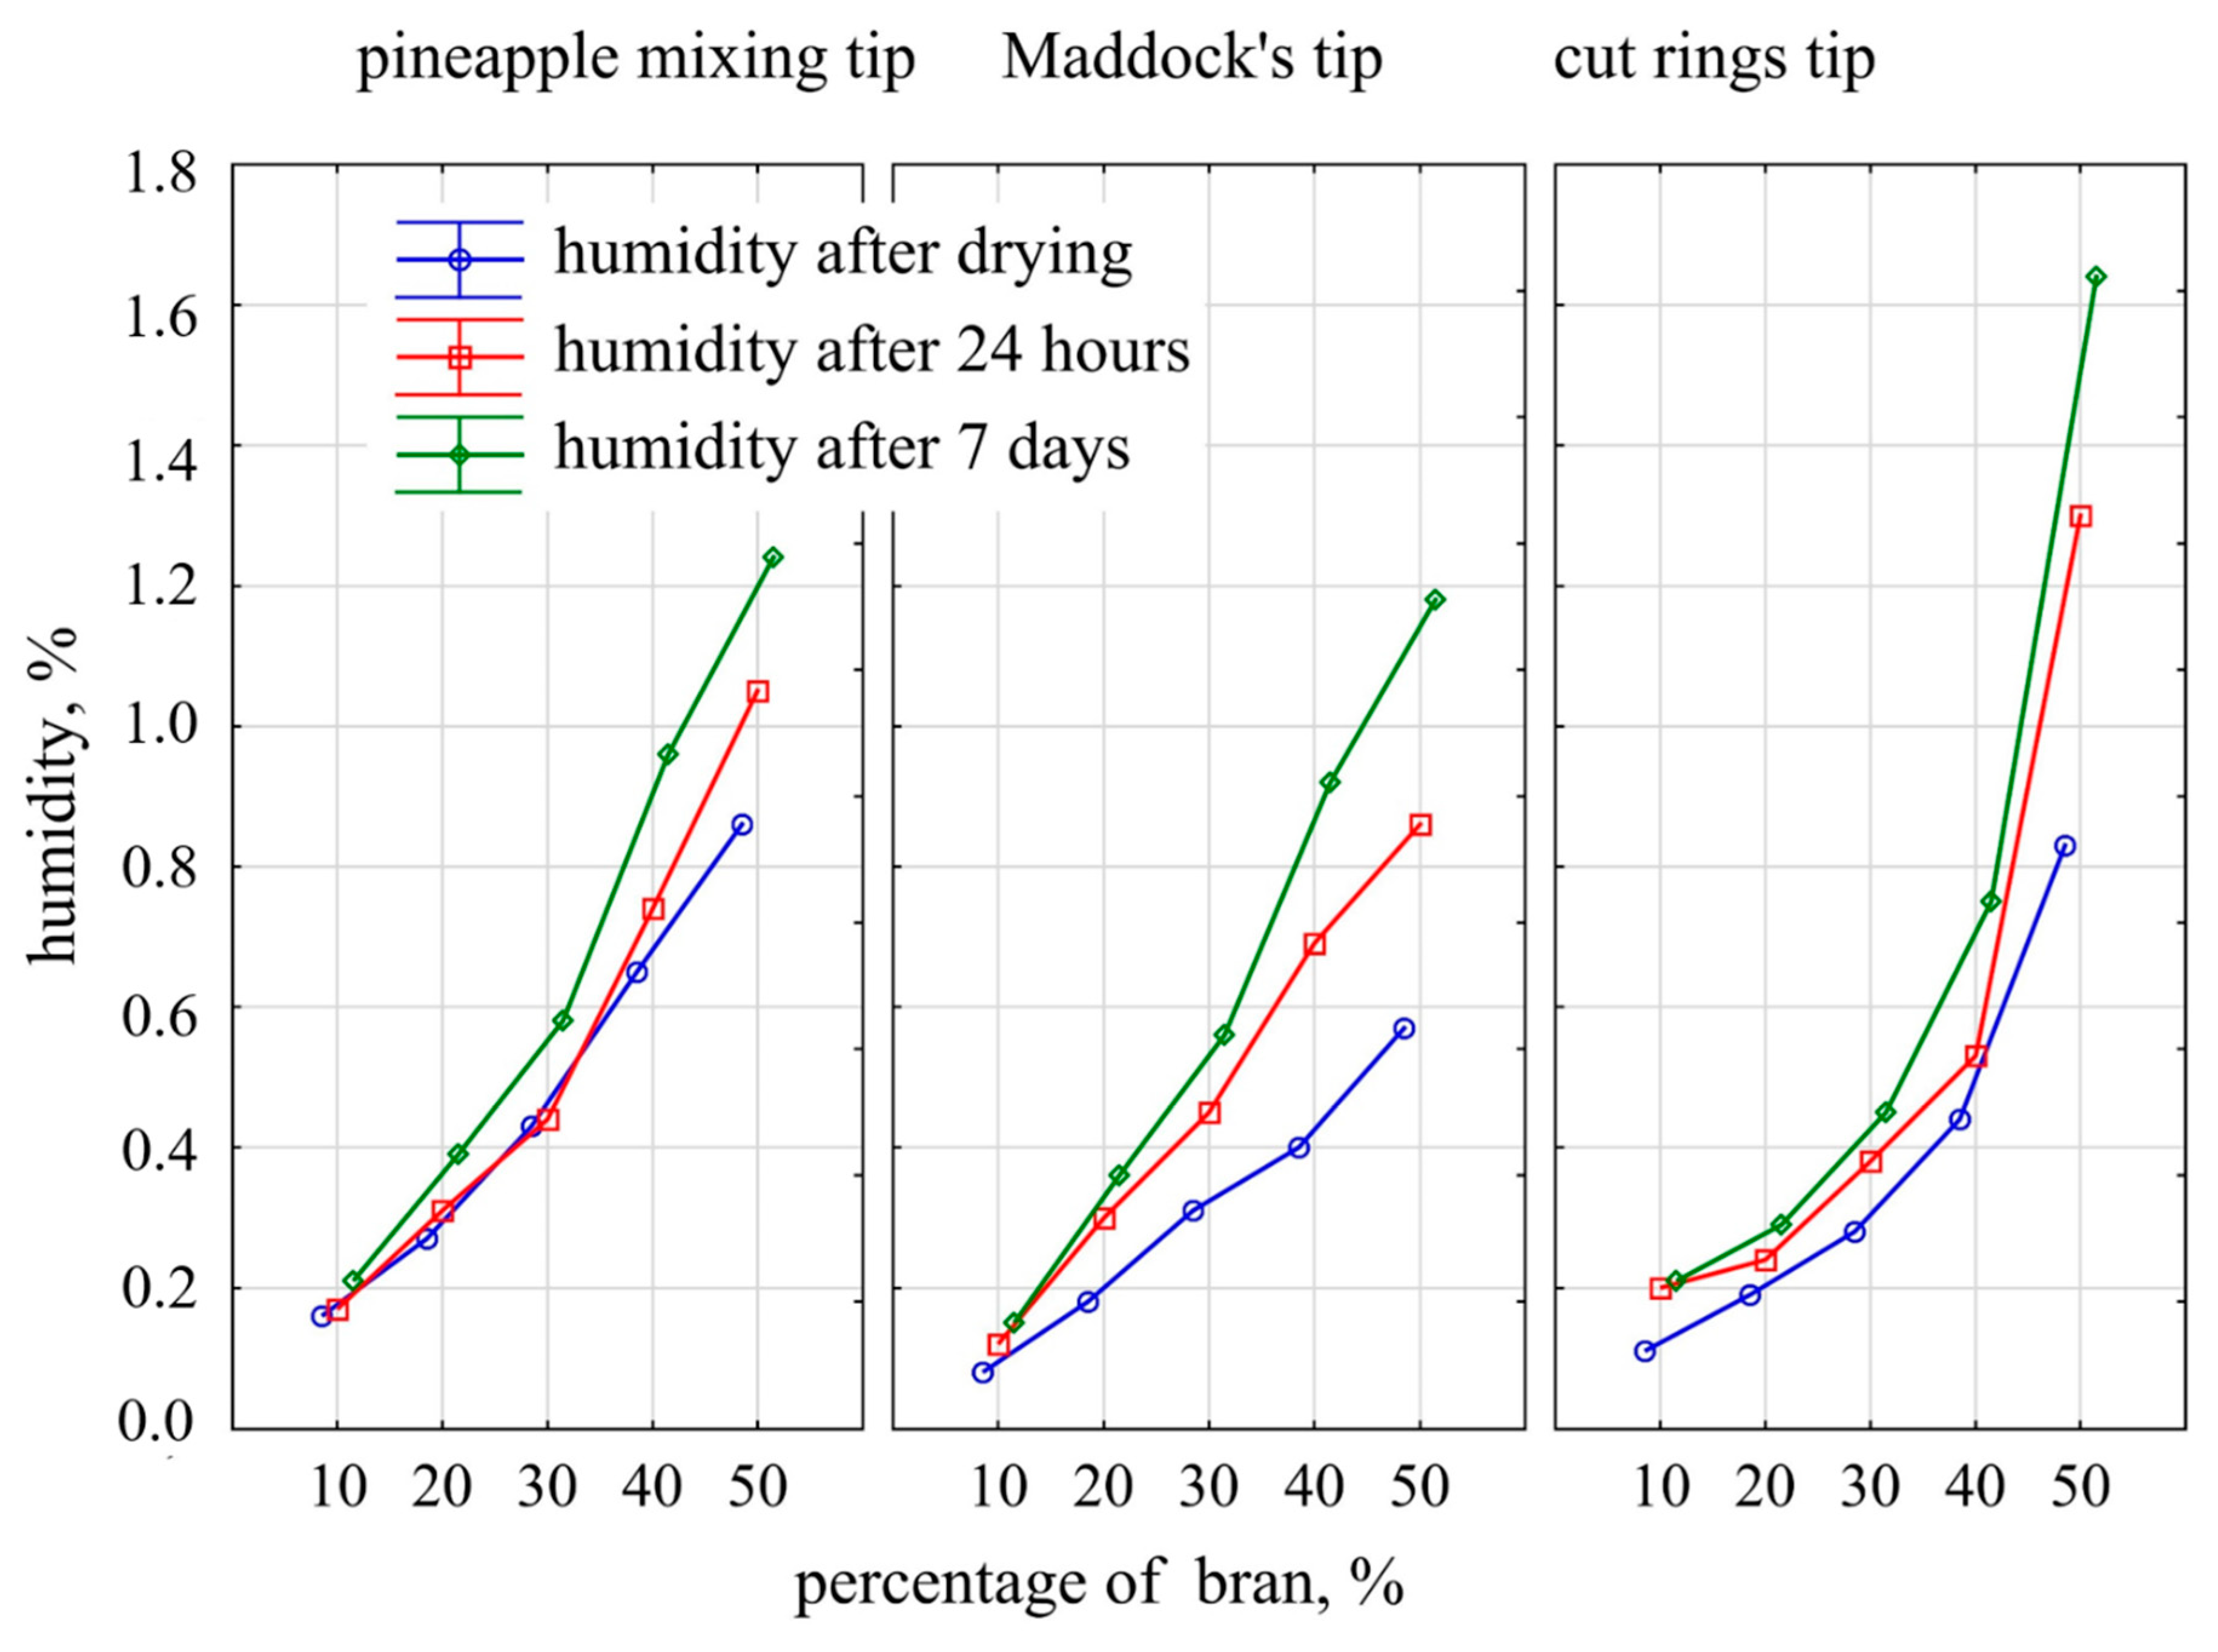
- Measurement of the moisture content of the extrudate in accordance with EN ISO 585:1990 [78] with a Radwag WPS 50SX moisture analyzer. The obtained extrudate was predried in a thermal chamber at 40 °C for 24 h. Then, the samples were stored in a room with a humidity of 25% at 22 °C. The moisture content of the extrudate after drying, after 24 h, and after 7 days was measured at 105 °C with the use of a moisture analyzer;
- Determination of the tensile strength of the extrudate σ [MPa], relative nominal elongation at maximum tensile stress ε [%], and Young modulus [MPa], using a Zwick/RoellZ010 test machine in accordance with EN ISO 527-2 [79] at a tensile speed of 50 mm/min;
- Color measurement of the extrudate samples using an X-Rite Ci4200 spectrophotometer. The color was described in the CIELab system, where it is defined in a L*, a*, b* space. The a parameter describes the color from green (negative values) to red (positive values), the b parameter describes the color from blue (negative values) to yellow (positive values), while the L parameter is the luminance–brightness, representing the gray scale from black to white (value 0 corresponds to black and value 100 corresponds to white). The difference between two colors—two points in the three-dimensional lab space—can be expressed with the following function:whereΔL, Δa, Δb are the difference in color parameters between the samples being compared, respectively;
- Melt flow rate index (MFR) (150 °C/5 kg) [g/10 min]. The measurement was performed with a CEAST extrusion plastometer model MeltFlow TQ6841 based on the recommendations of EN ISO 1133-1:2011 method A [80].
- The mass flow rate of the extruded plastic material G g/s; the extrudate samples were taken at constant time intervals and then weighed using a Fawag TP-3/1 scale. Flow rate was calculated by dividing the mass of the extrudate by the extrusion time;
- AnFTIR analysis of the samples was performed using an FTIR TENSOR 27 spectrophotometer (Bruker, Germany) equipped with an ATR attachment with a diamond crystal. Spectra (16 scans per spectrum) were collected in the range of 600–4000 cm−1 with a resolution of 4 cm−1;
- DSC tests of the obtained extrudate were performed using a DSC 204 F1 Phoenix differential scanning calorimeter (NETZSCH, Günzbung, Germany) and NETZSCH Proteus data processing software. Crystallinity degree Xc and melting enthalpy ΔH were determined, along with the melting point Tm and crystallization temperature Tc of the obtained extrudate. The crystallinity degree was calculated using the following function:assuming that for PE ΔH100% = 293 J/g [81]. DSC curves were recorded in the system for heating(I) from −140 to 150 °C (10 K/min), for cooling from 150 to −140 °C (10 K/min), and for heating (II) from −140 to 150 °C (10 K/min). The analyses were carried out in an inert gas (argon) atmosphere at a gas flow rate of 20 mL/min. The samples were analyzed in aluminium crucibles with a pierced lid;
- TG tests of the extrudate in oxidizing atmosphere were carried out using an STA 449 F1 Jupiter thermal analyzer (NETZSCH, Günzbung, Germany) combined with the FTIR TENSOR 27 spectrophotometer (Bruker, Germany), which enabled the simultaneous analysis of gaseous products of the decomposition of the analyzed samples. The analyses were carried out at 40–900 °C in synthetic air, at a flow rate of 25 mL/min. Samples weighing about 12 mg were analyzed in crucibles made of Al2O3.
3. Results
3.1. Microstructure
3.2. Density
3.3. Water Absorption
3.4. Moisture Content
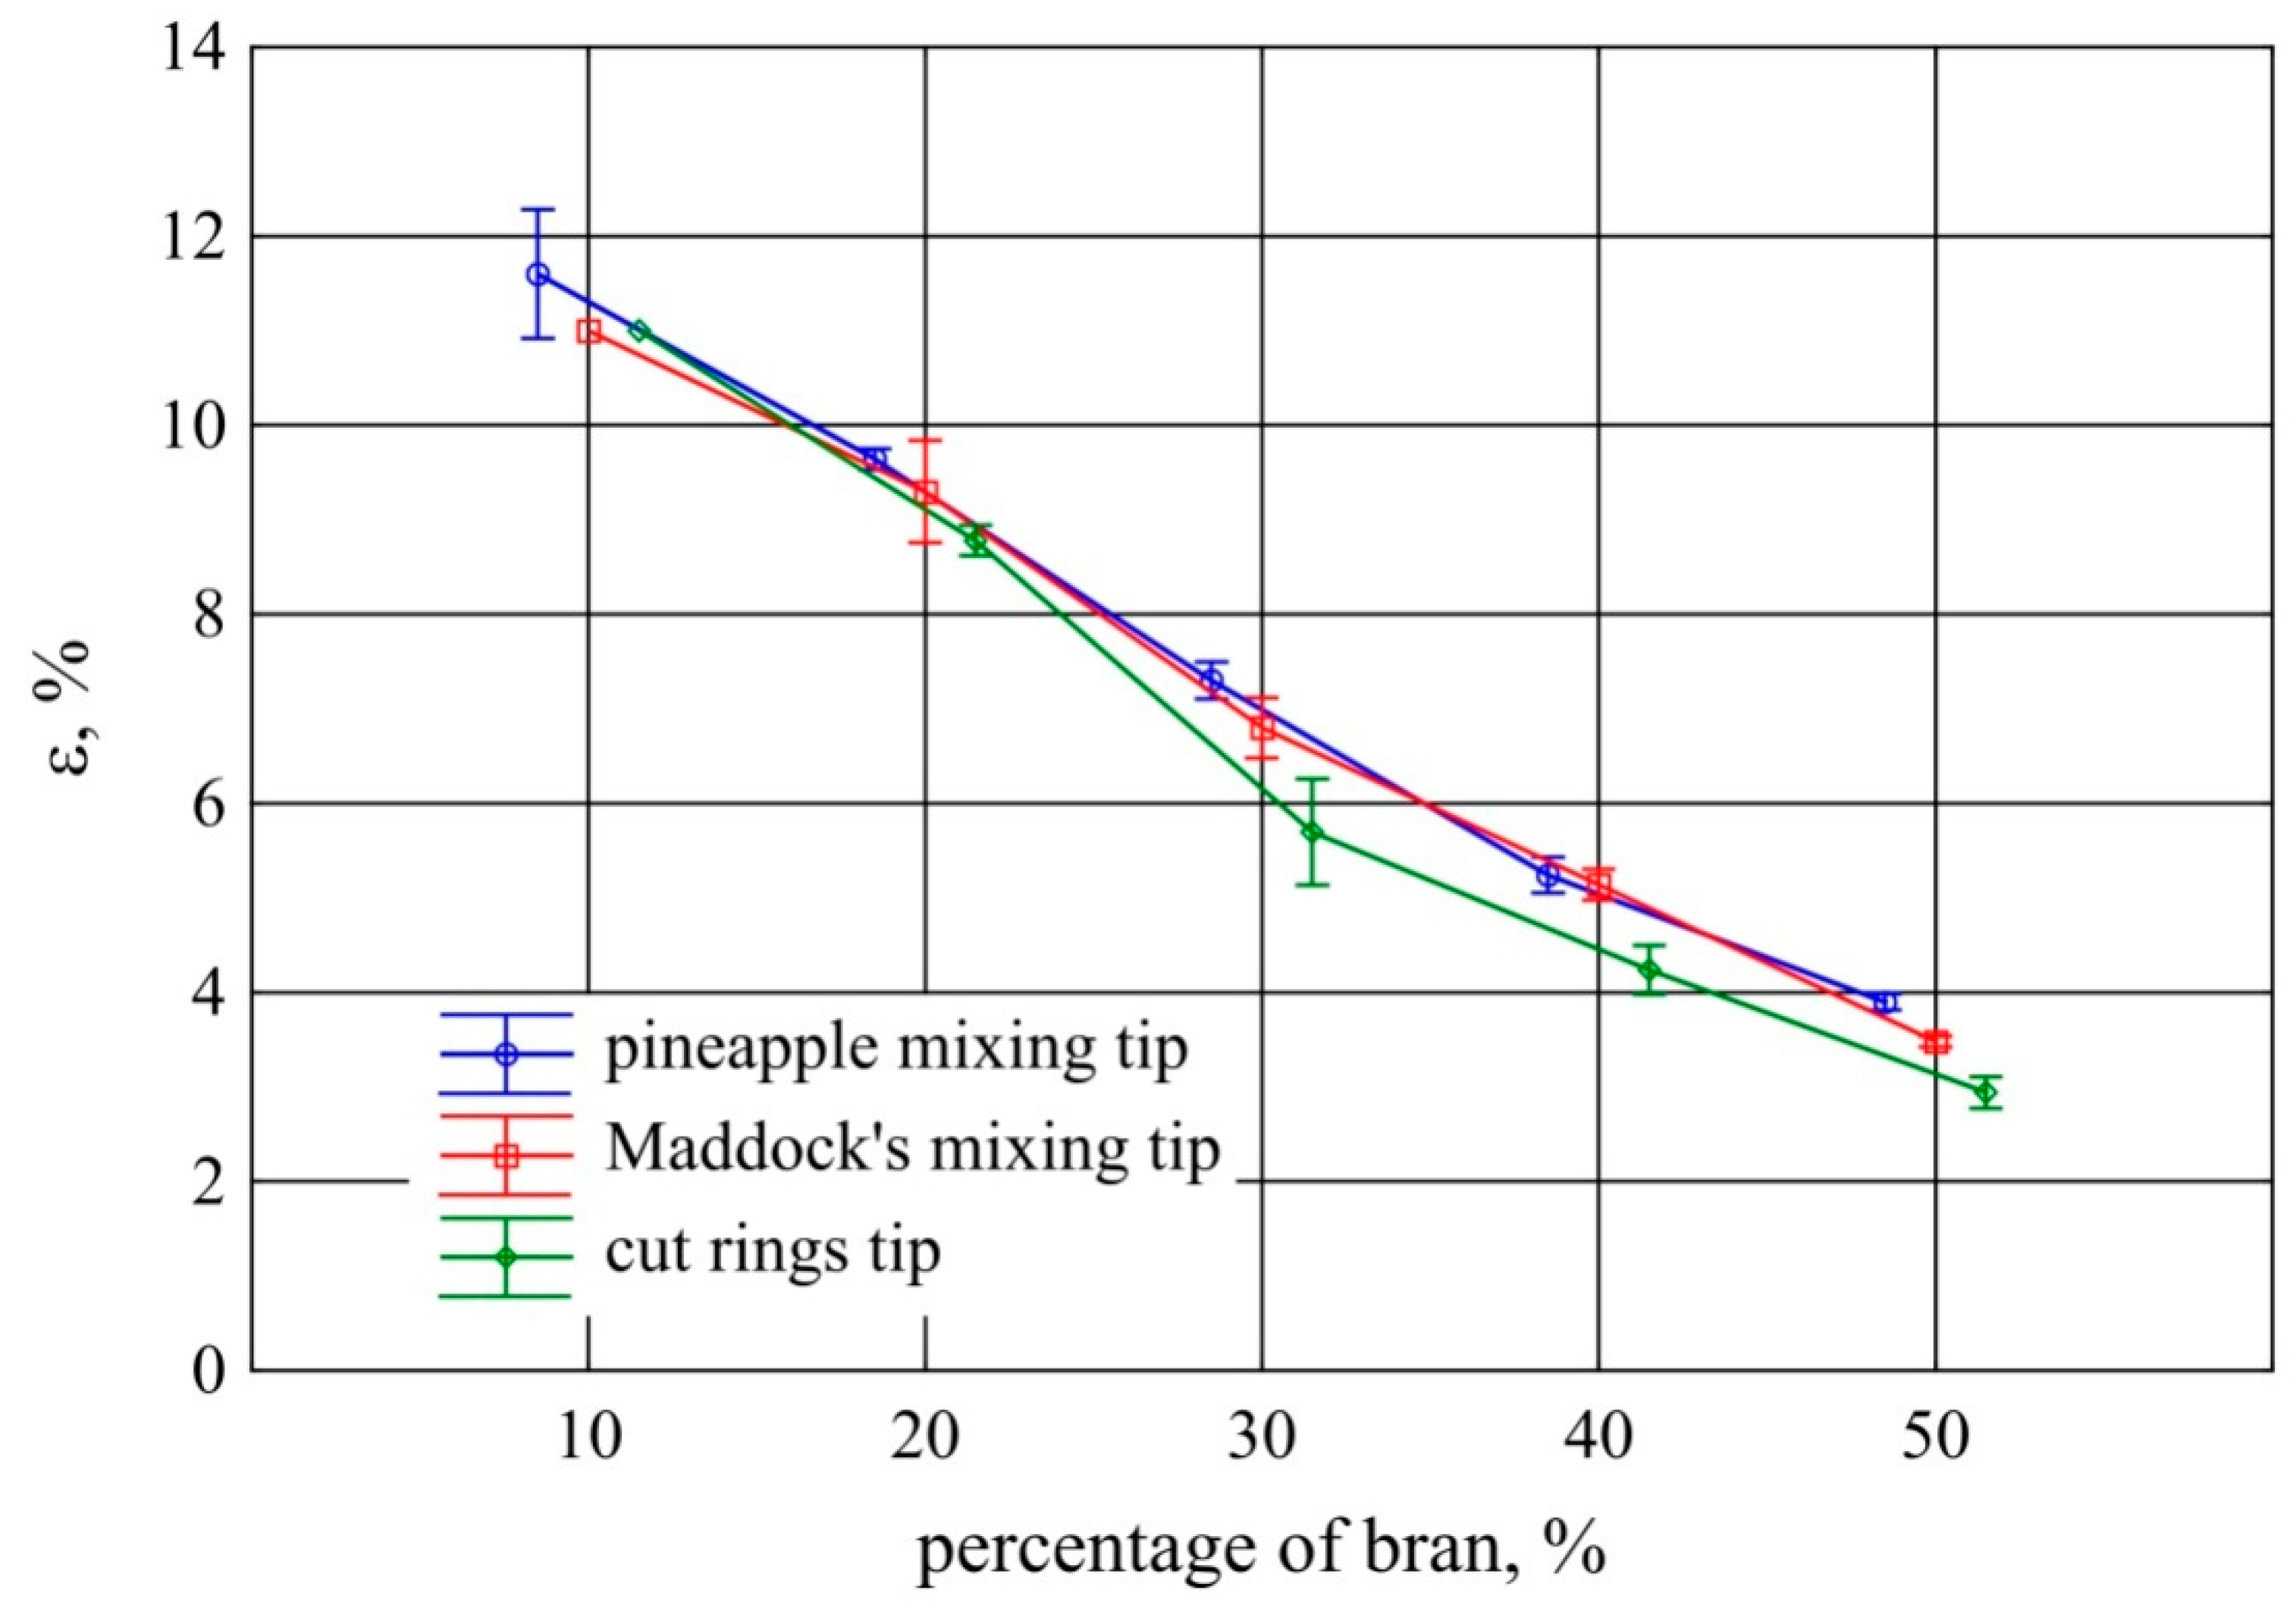
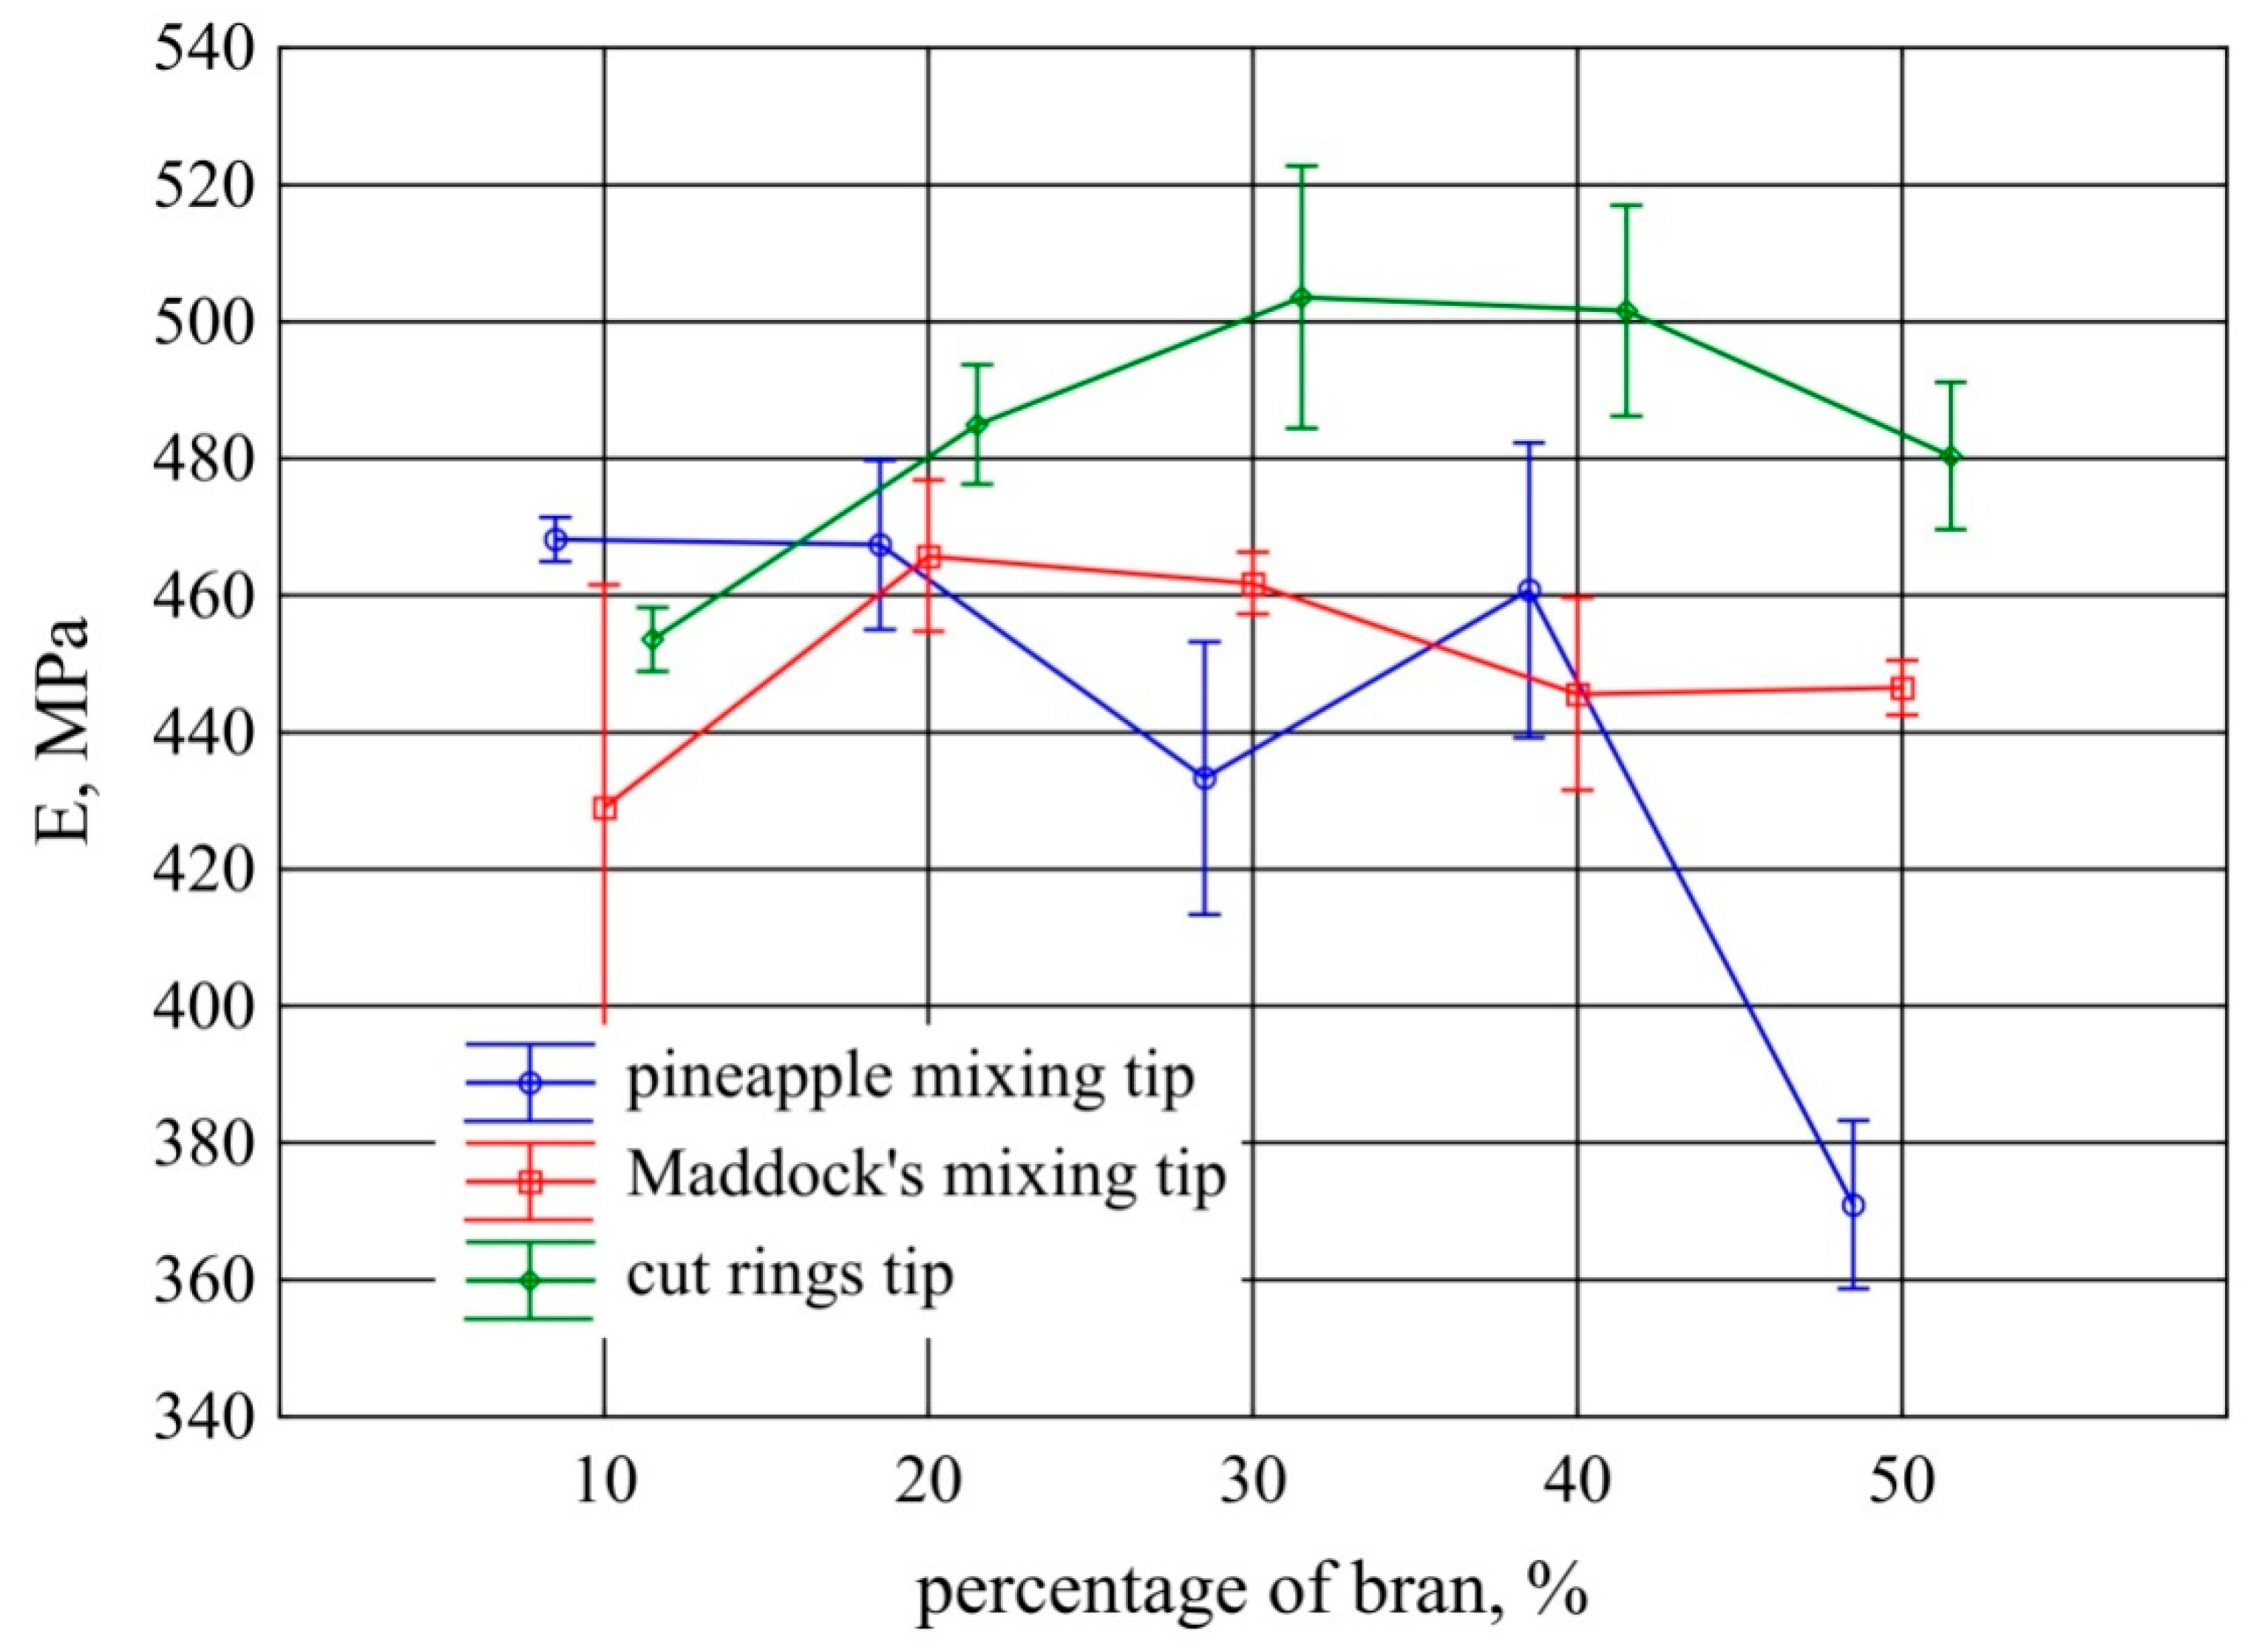
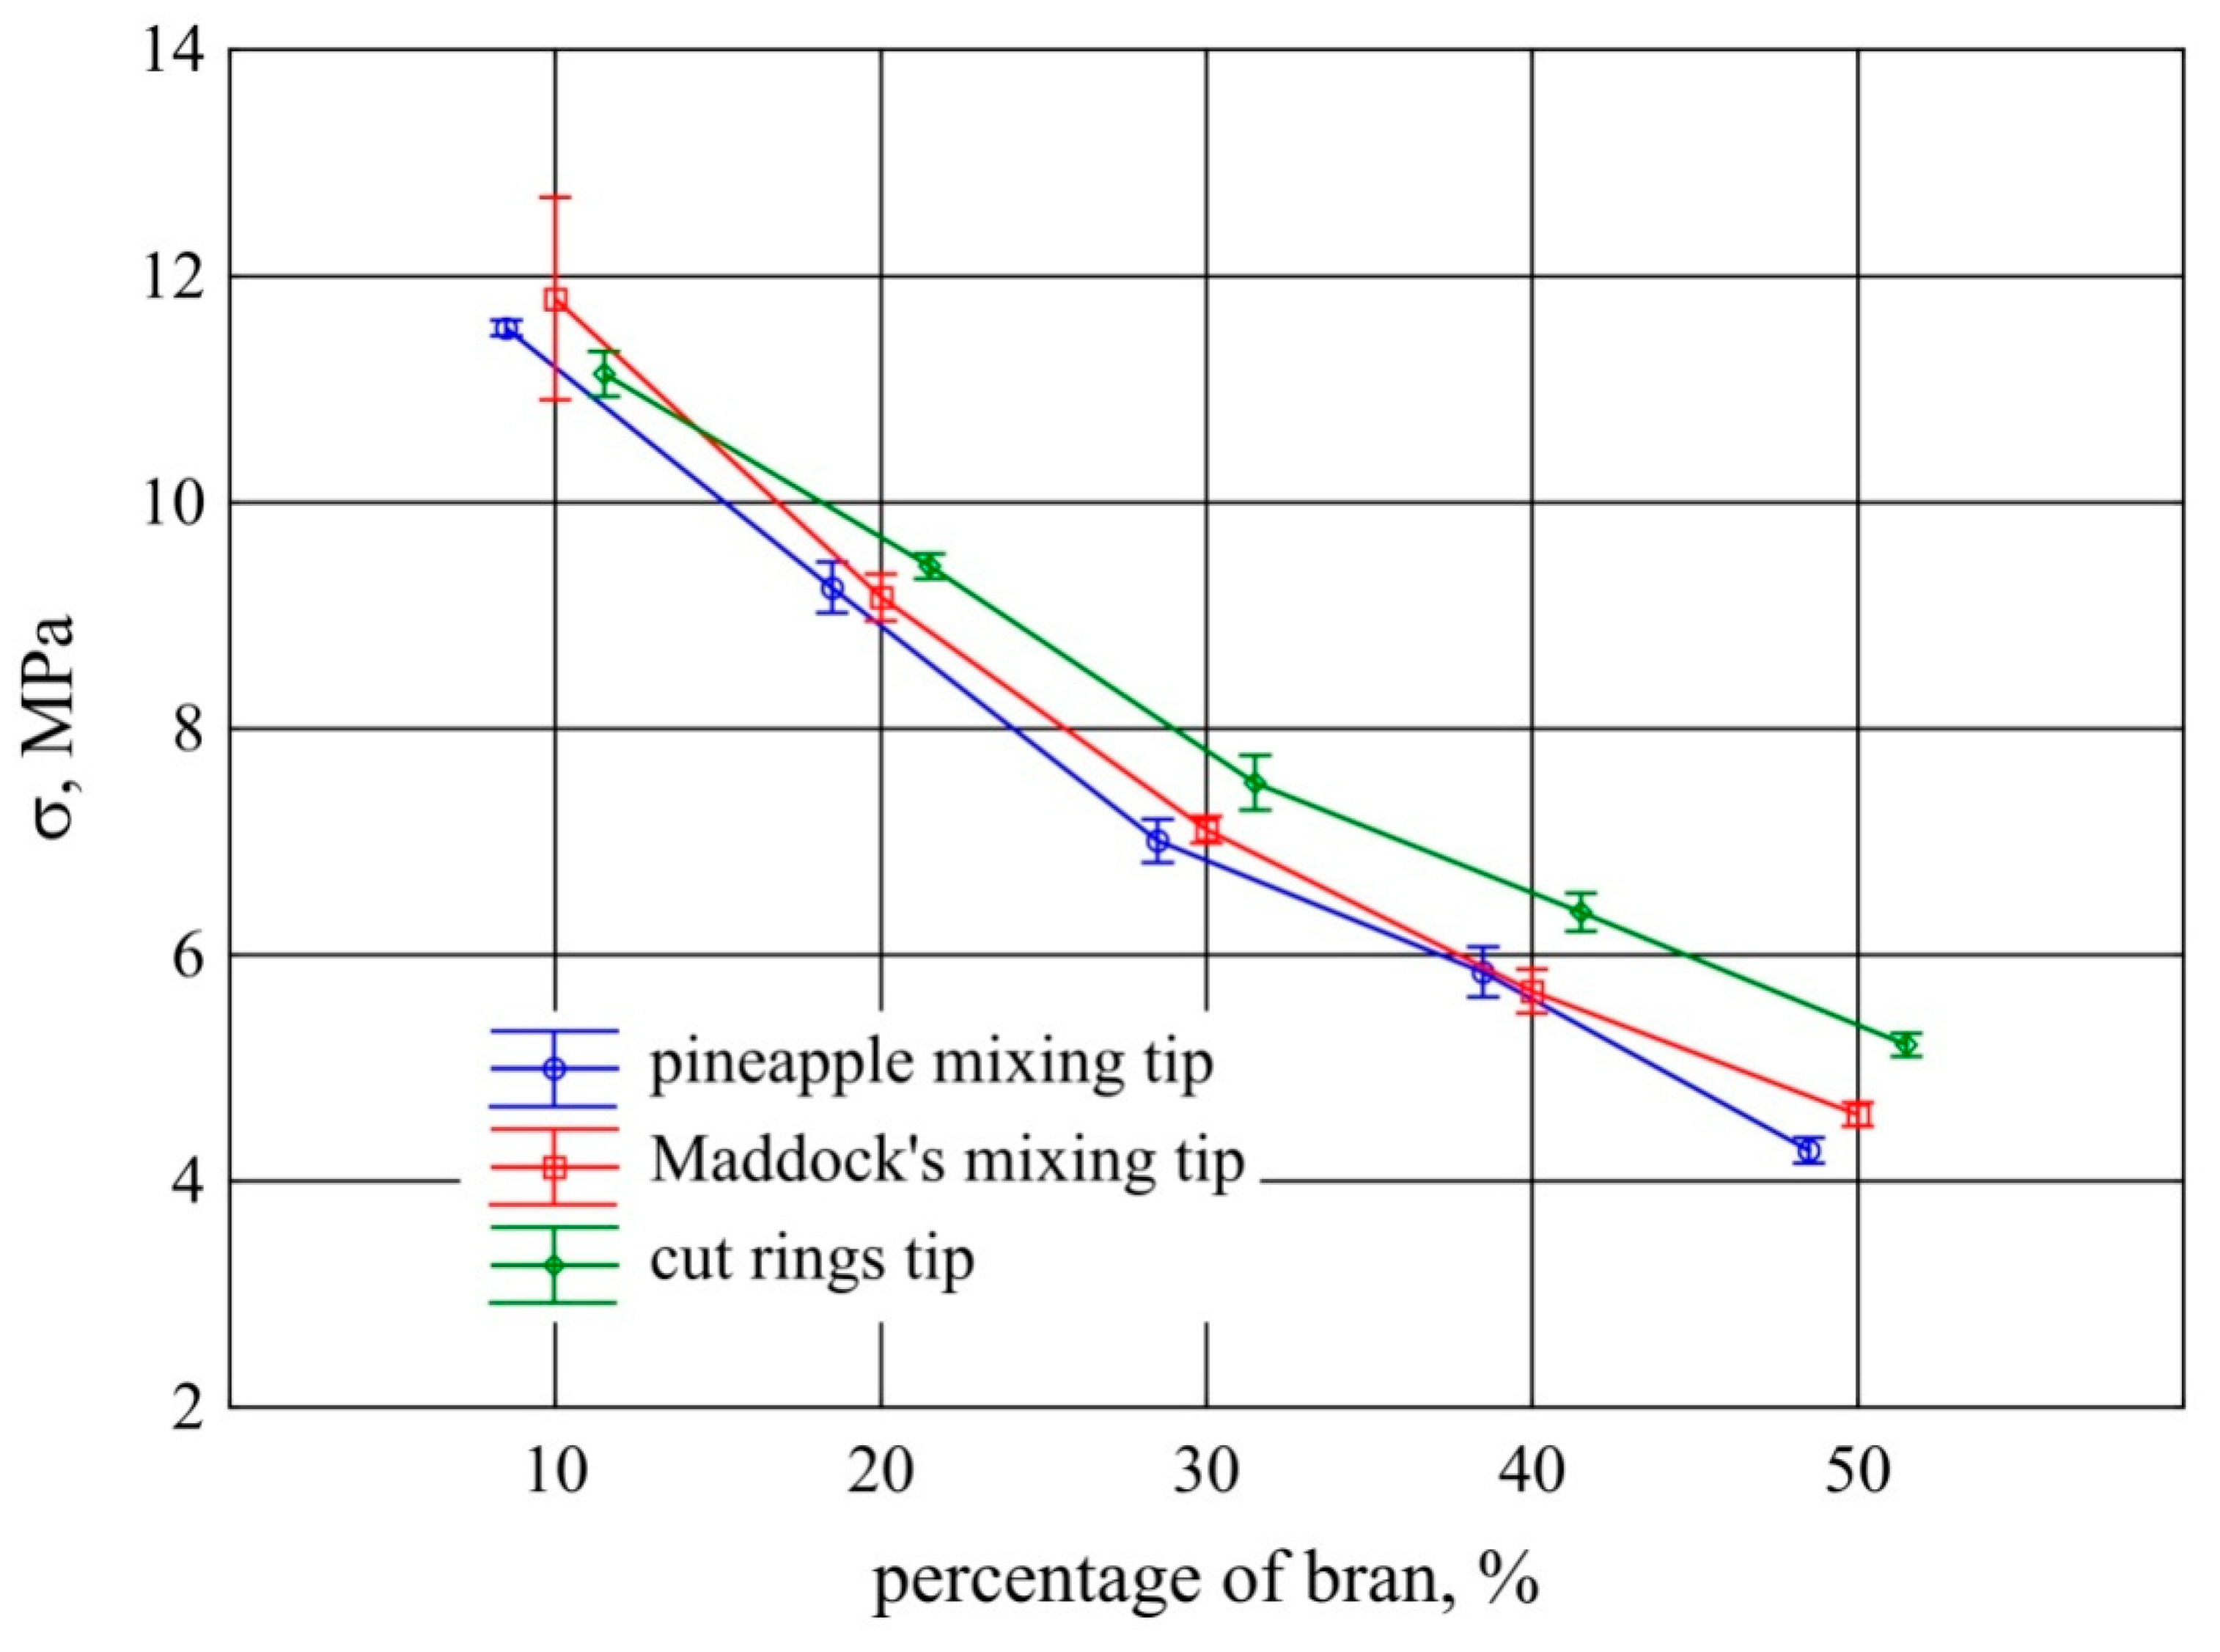
3.5. Tensile Testing
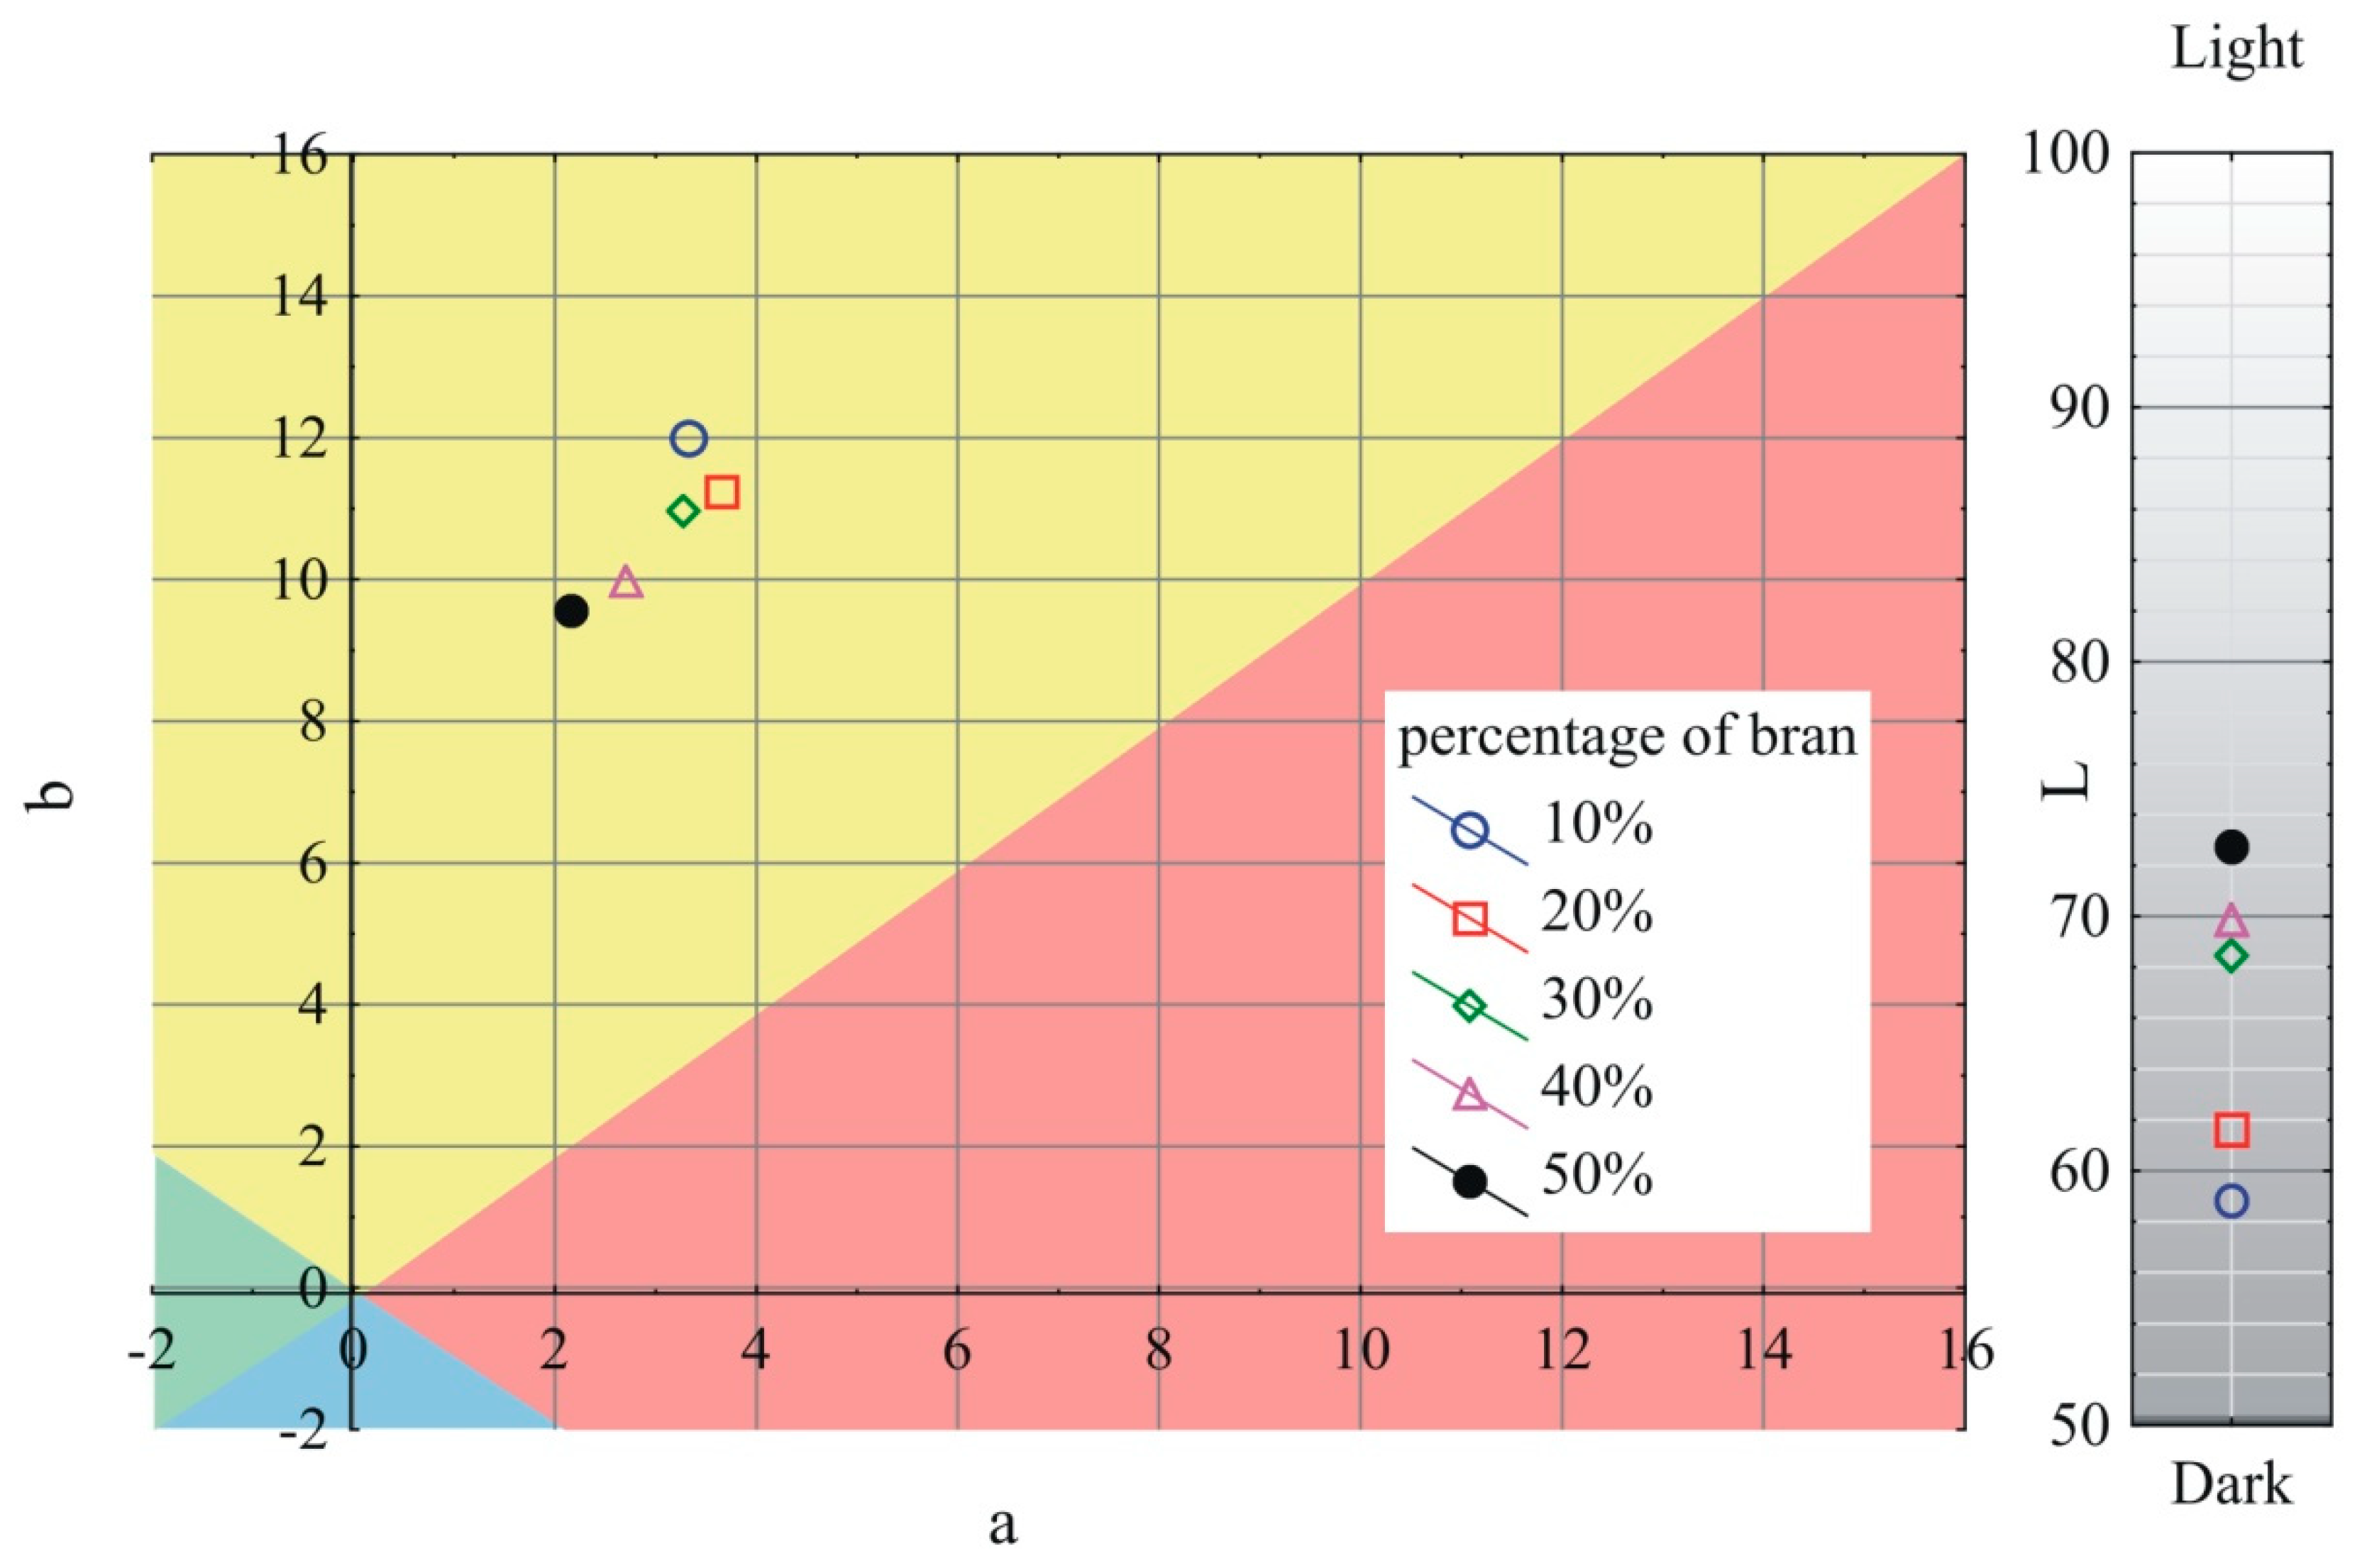
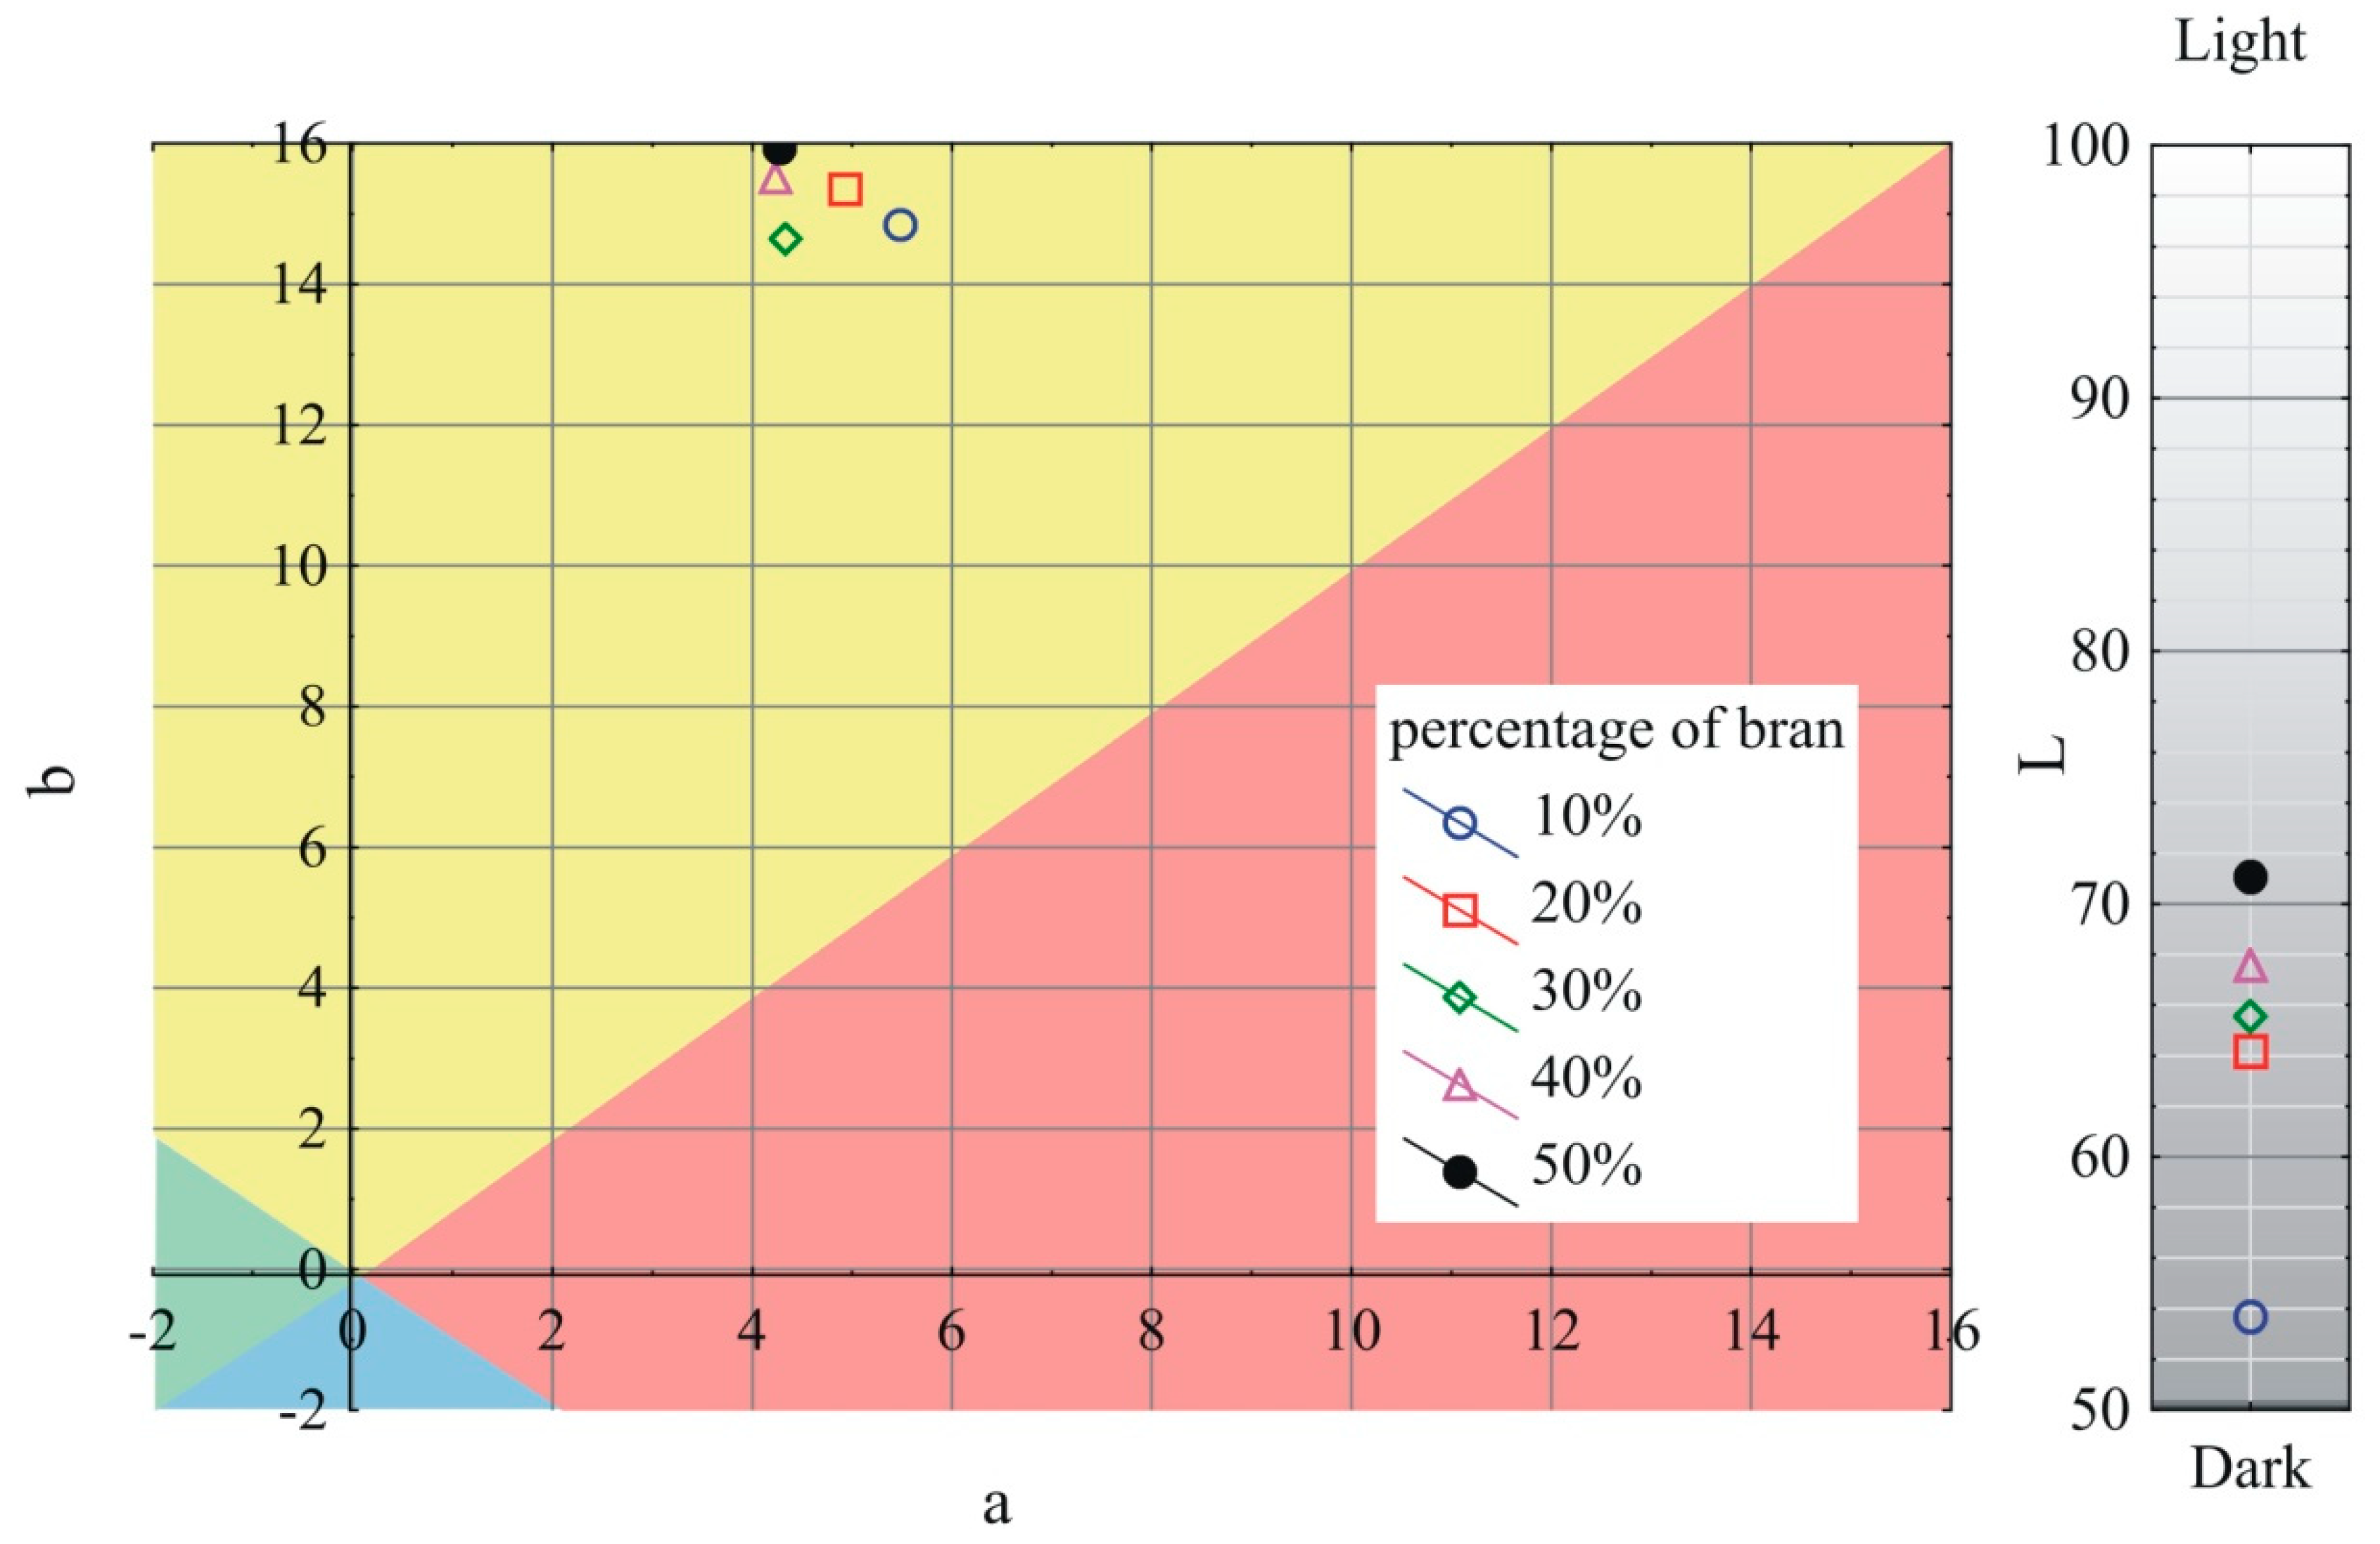
3.6. Color
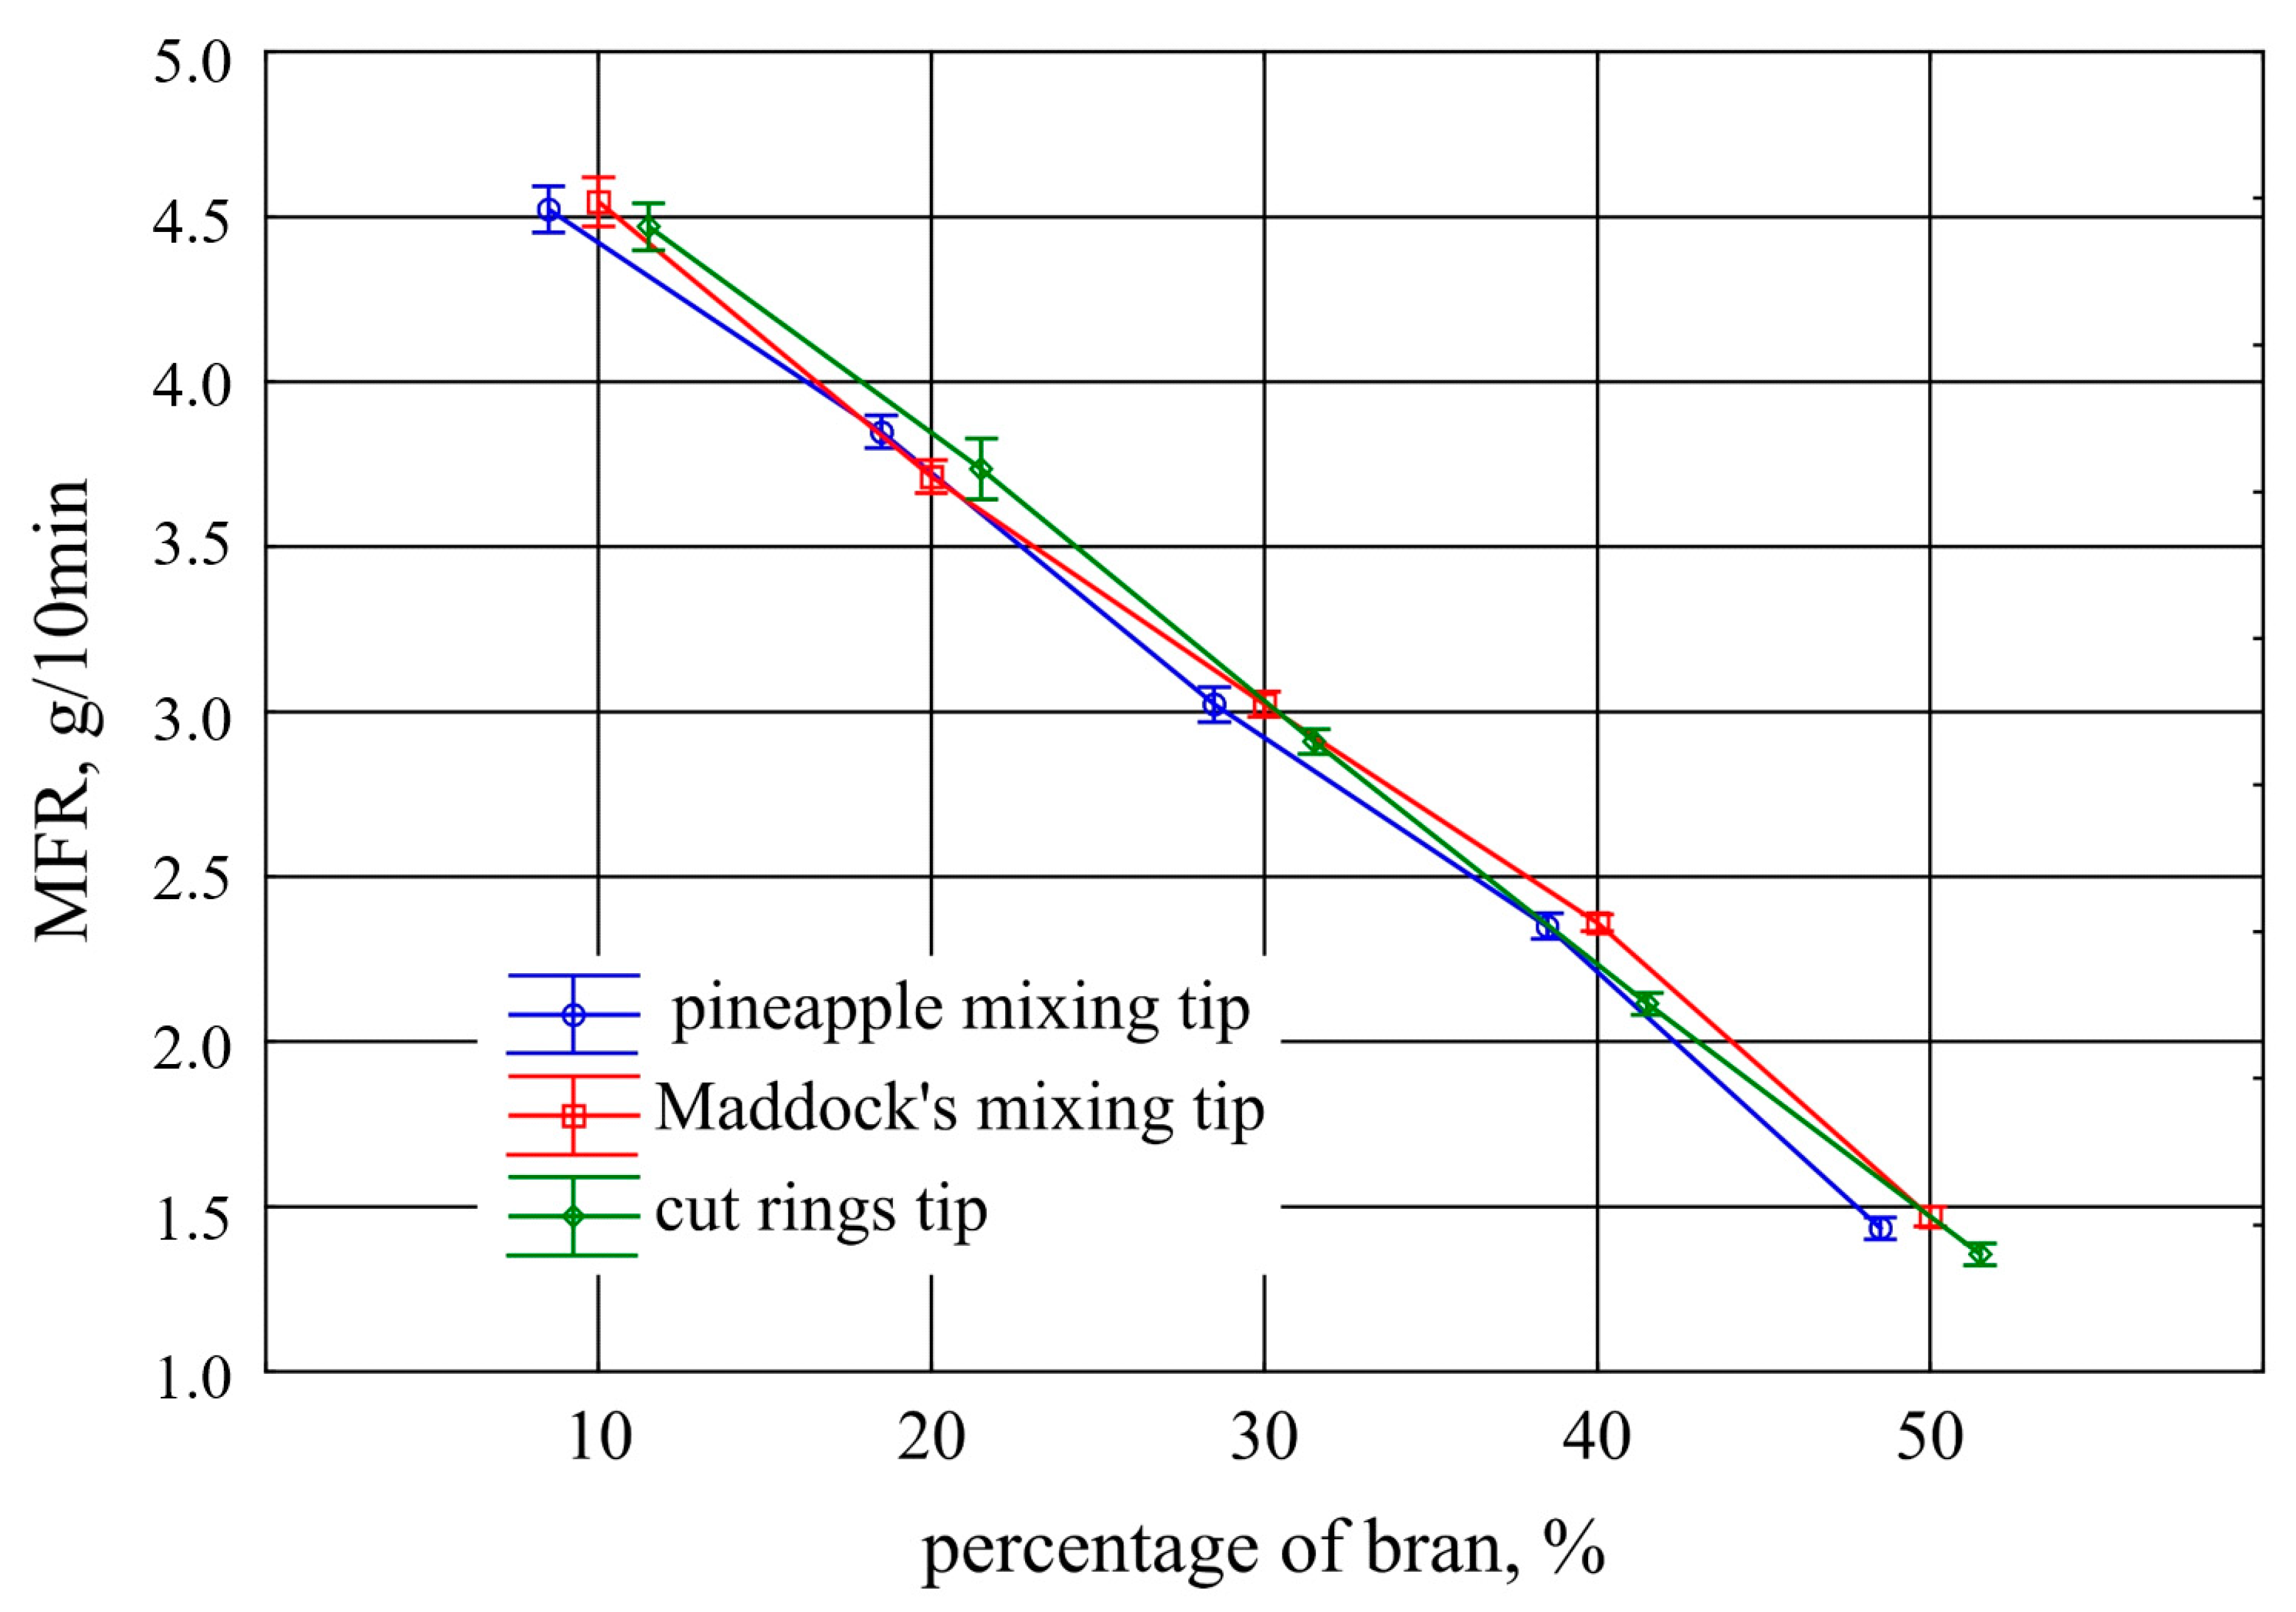
3.7. Melt Flow Rate
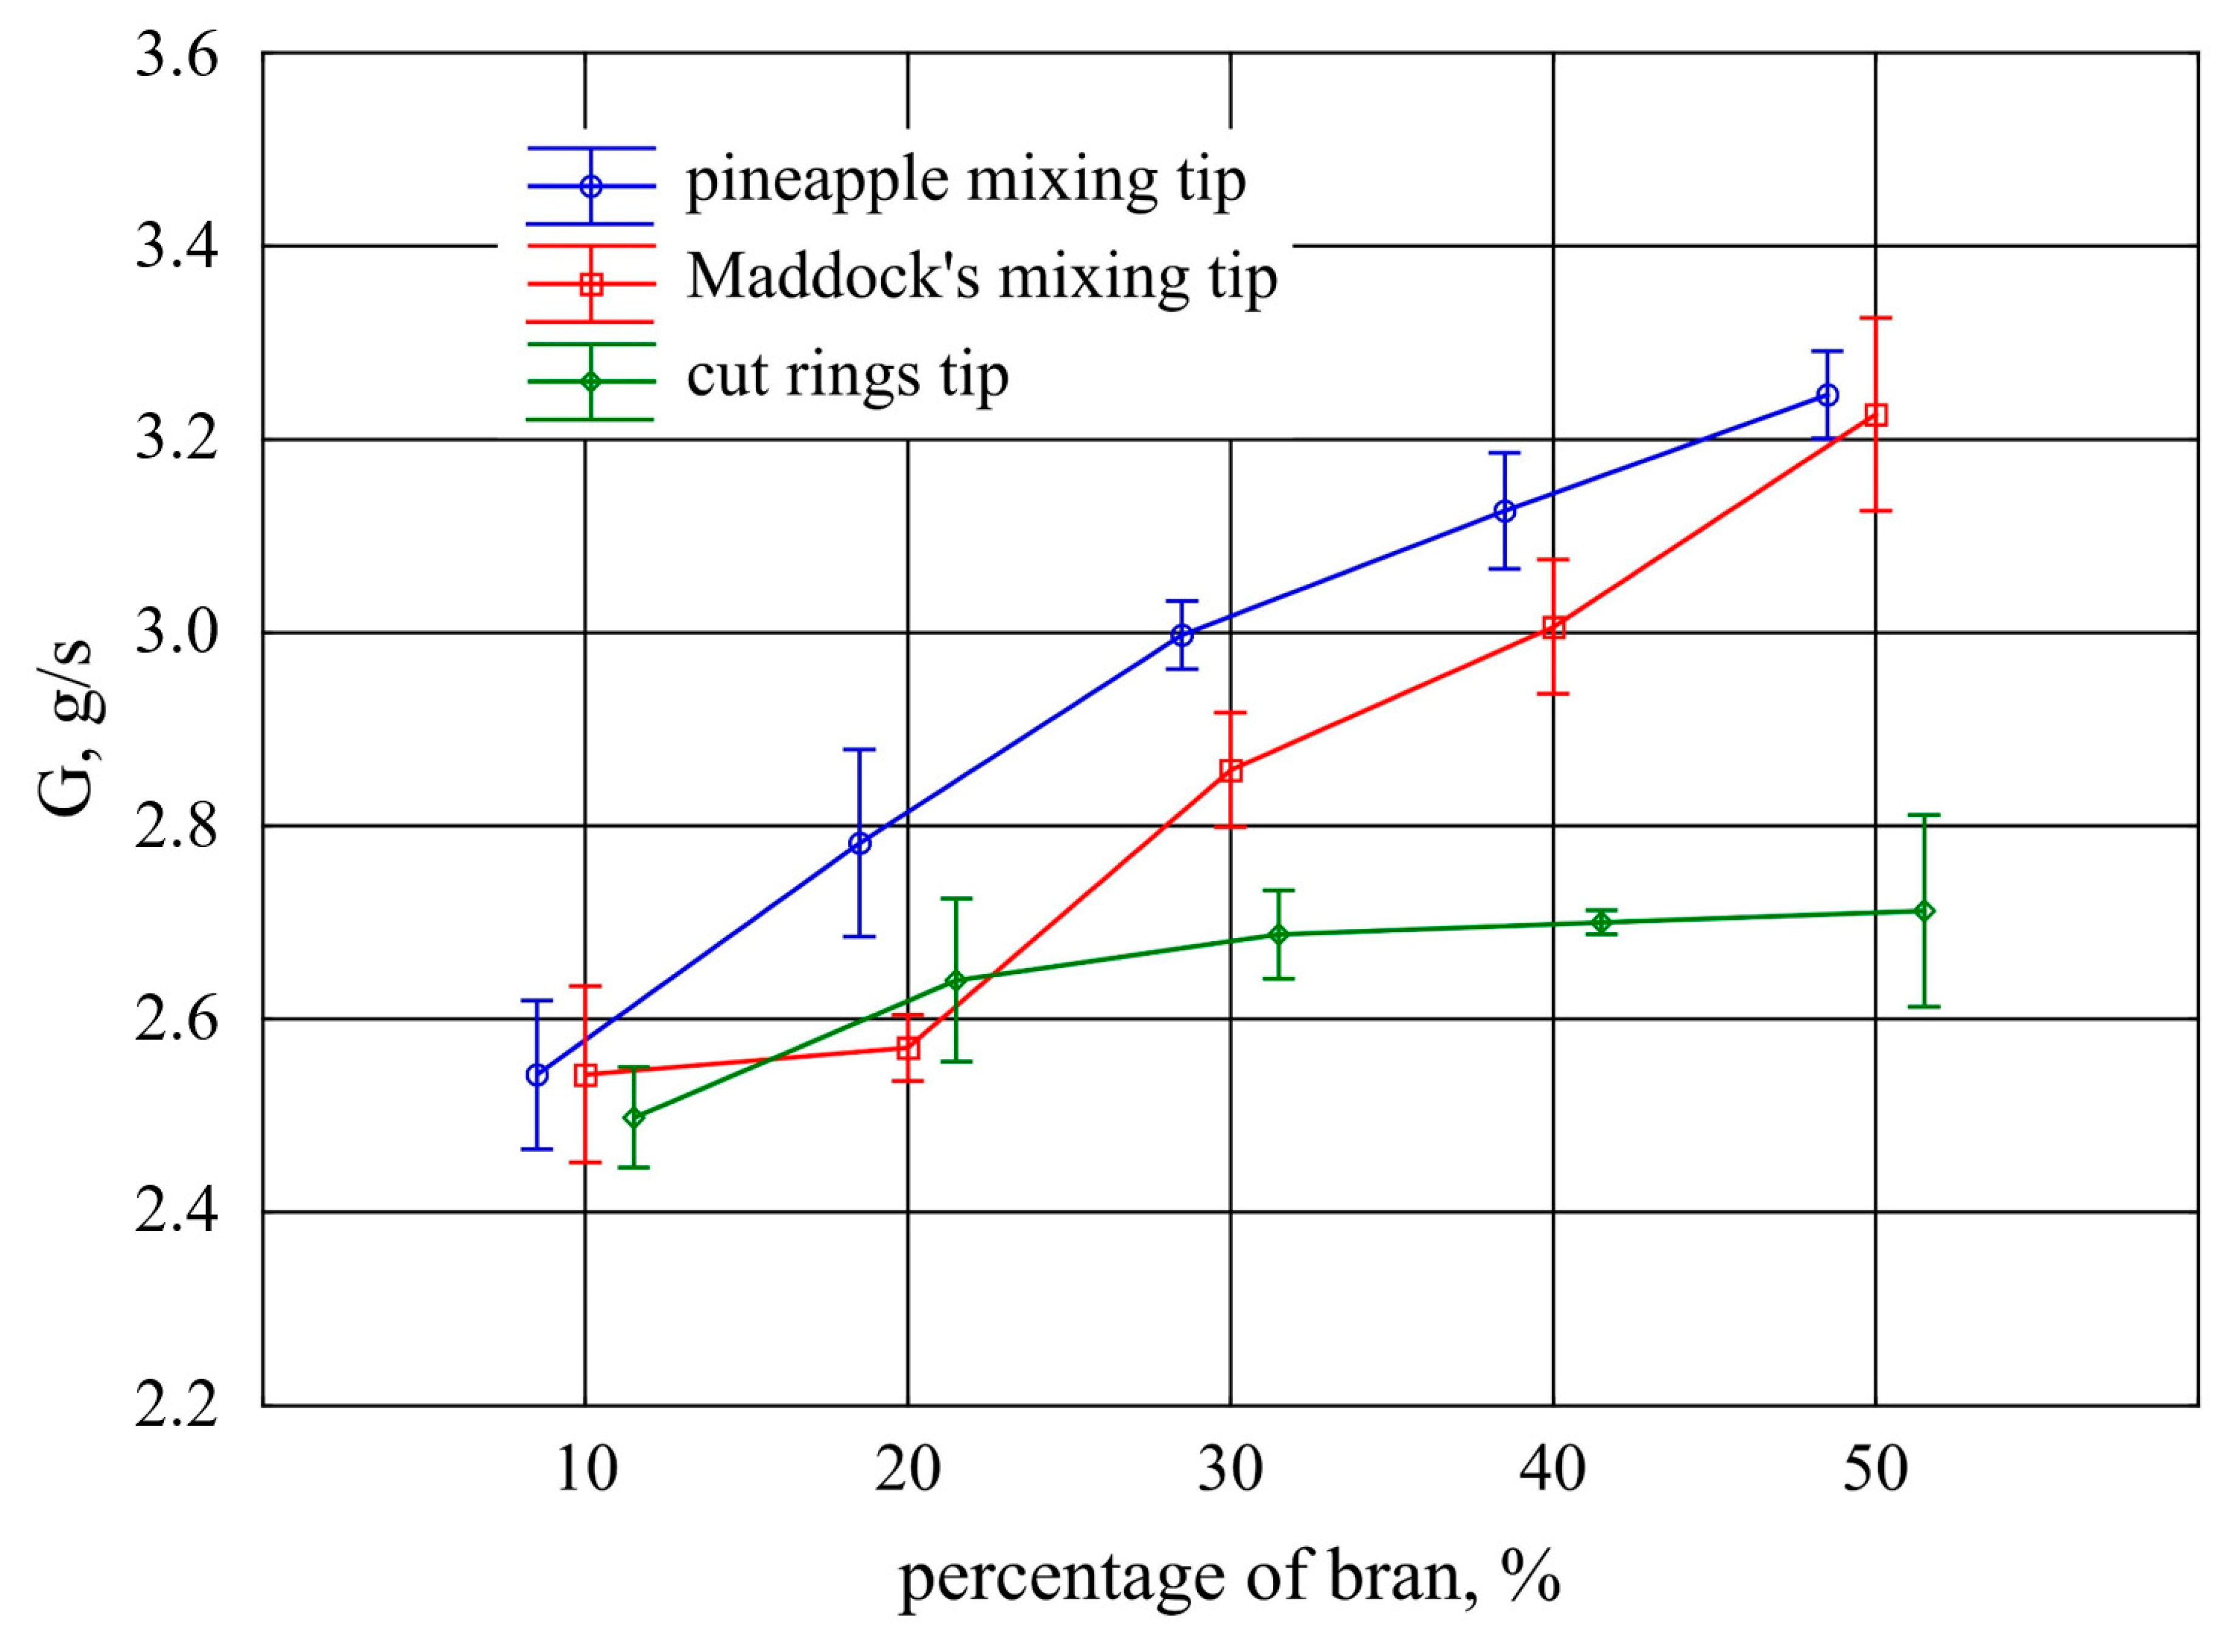
3.8. Mass Flow Rate
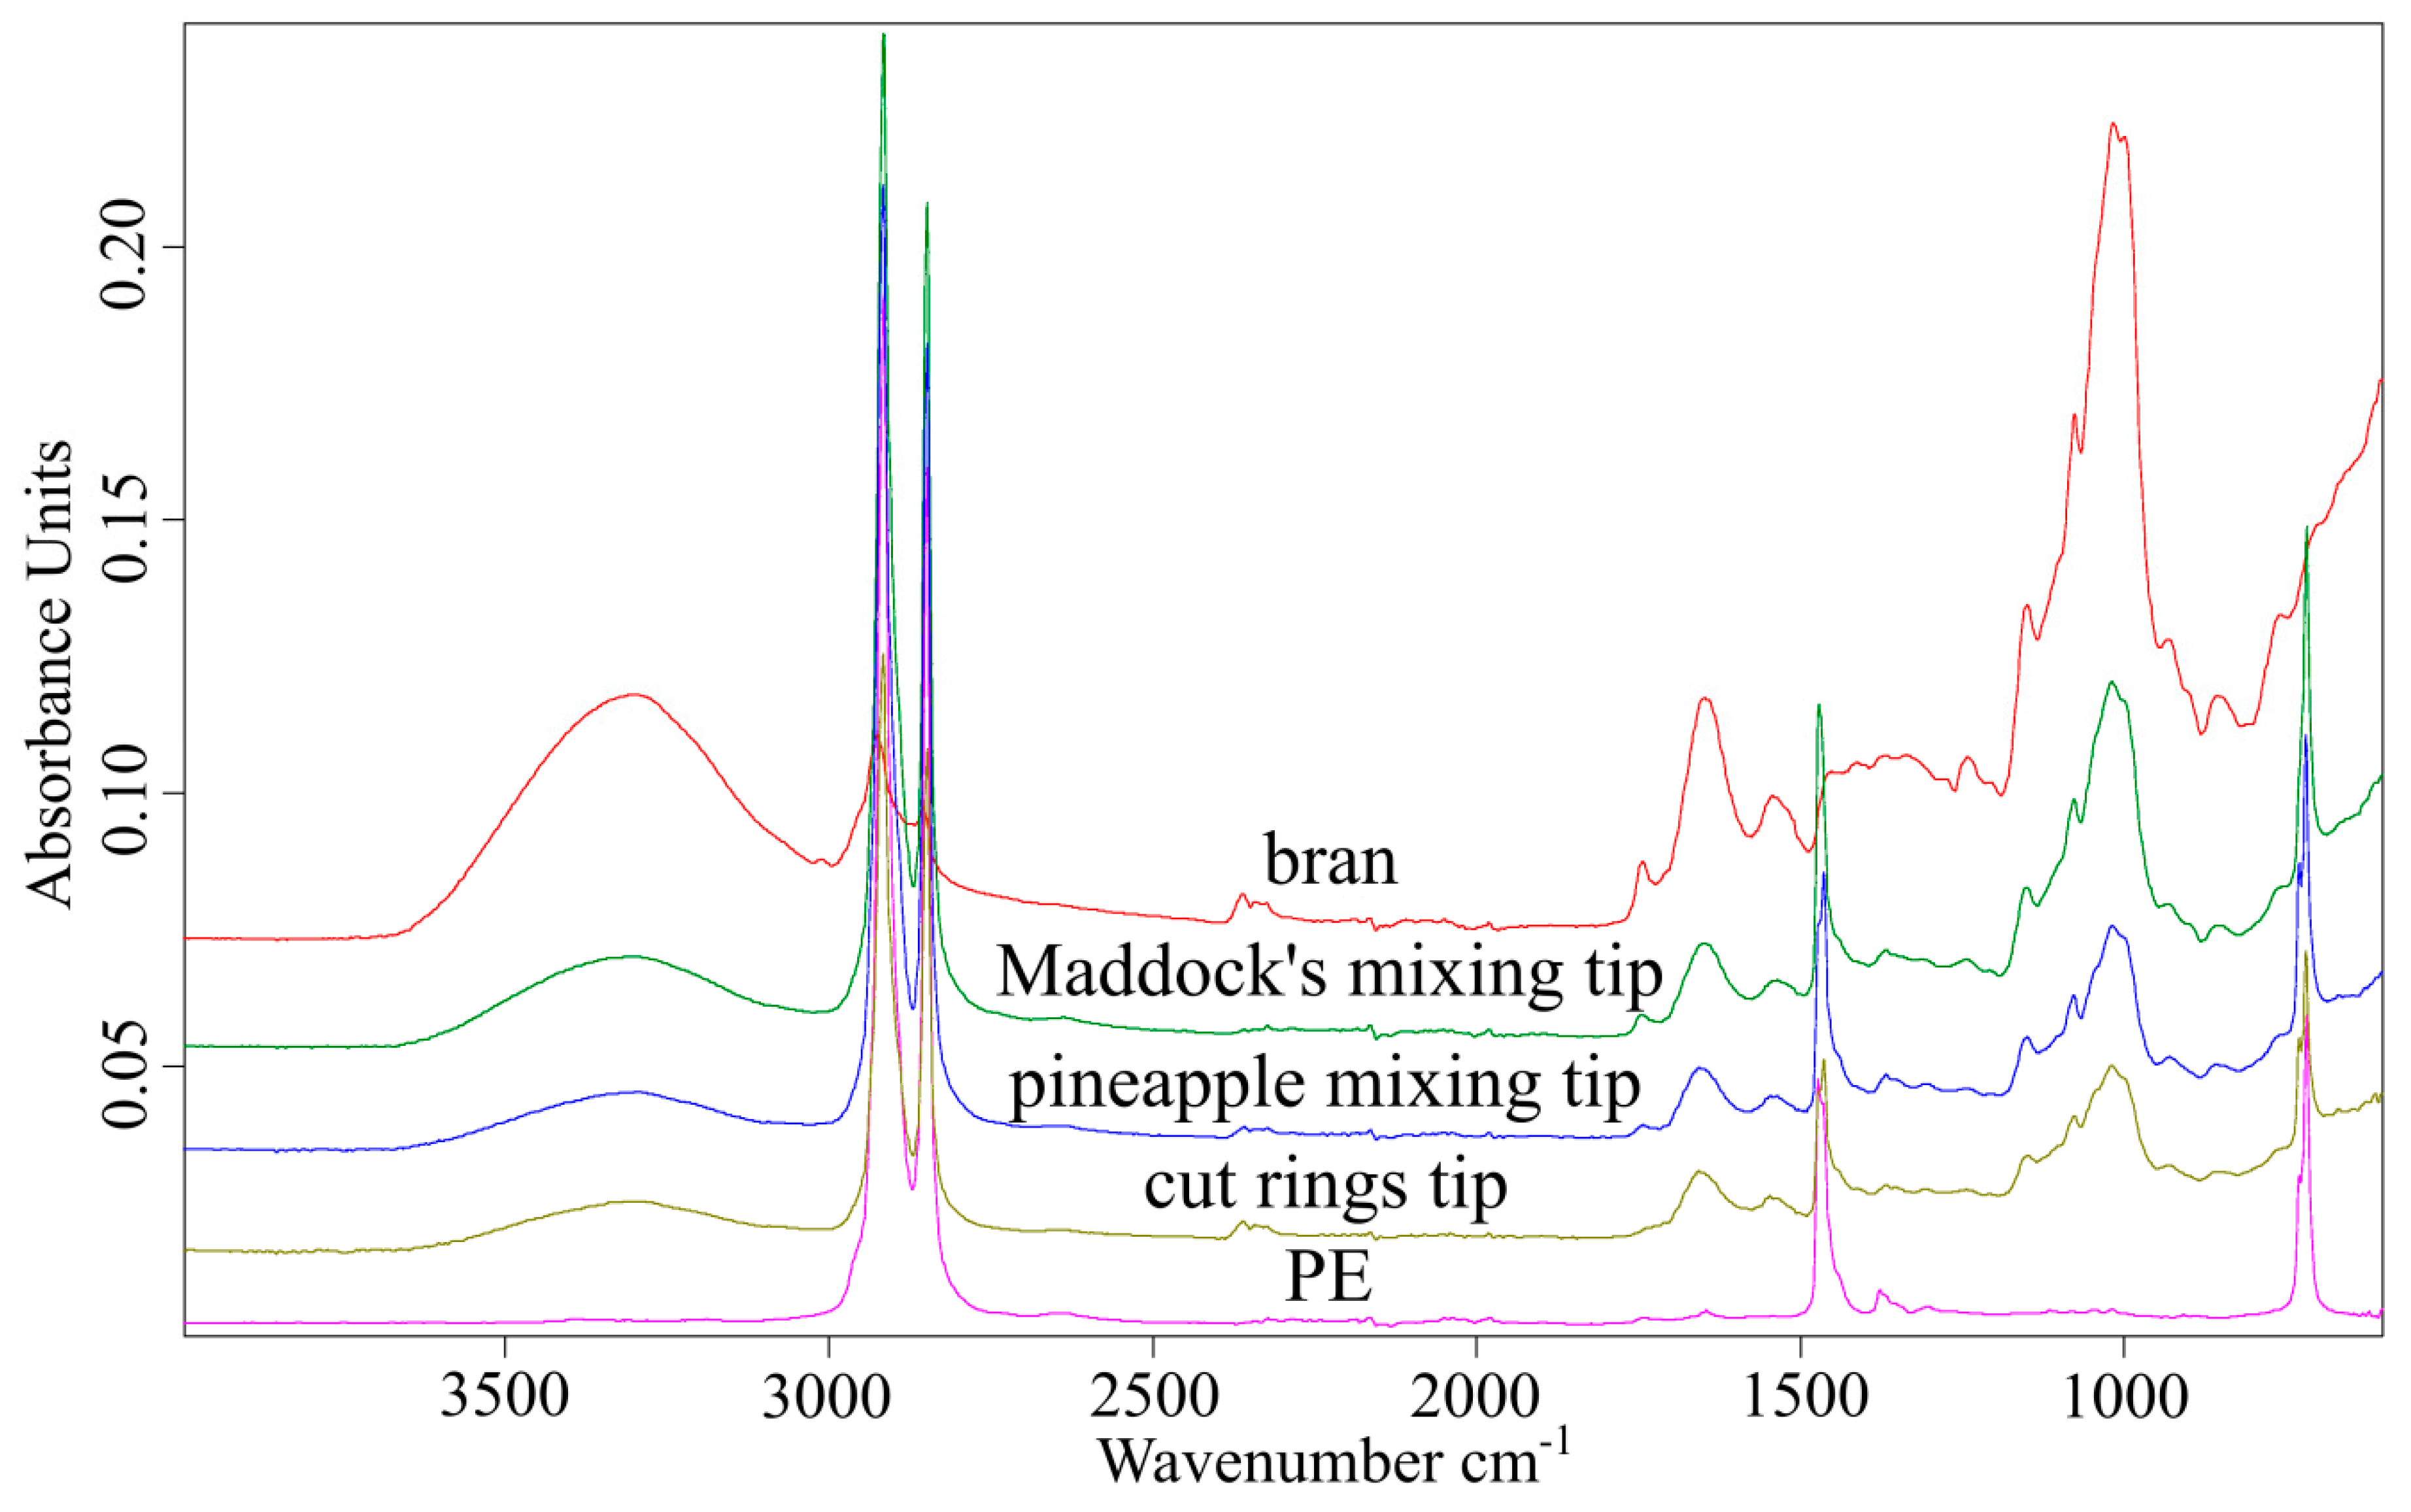
3.9. FTIR Spectroscopy
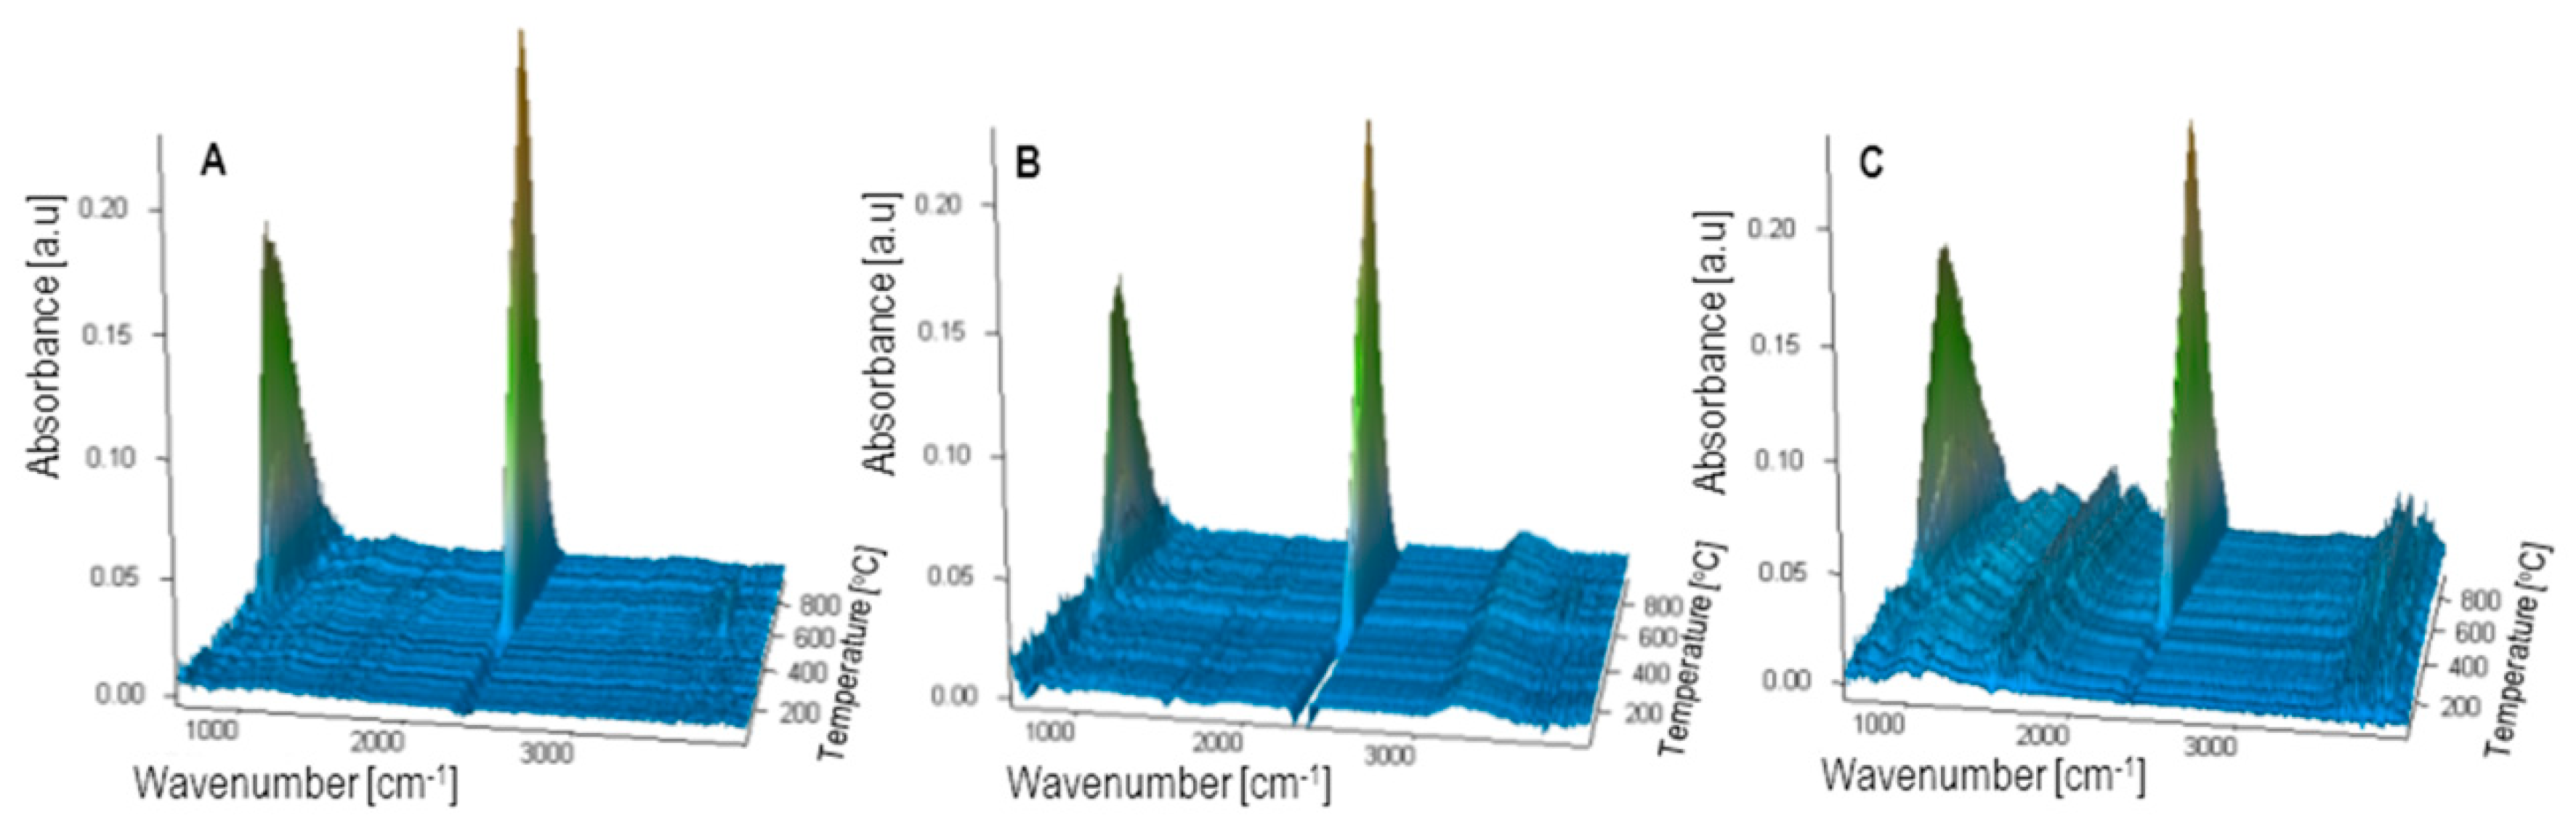
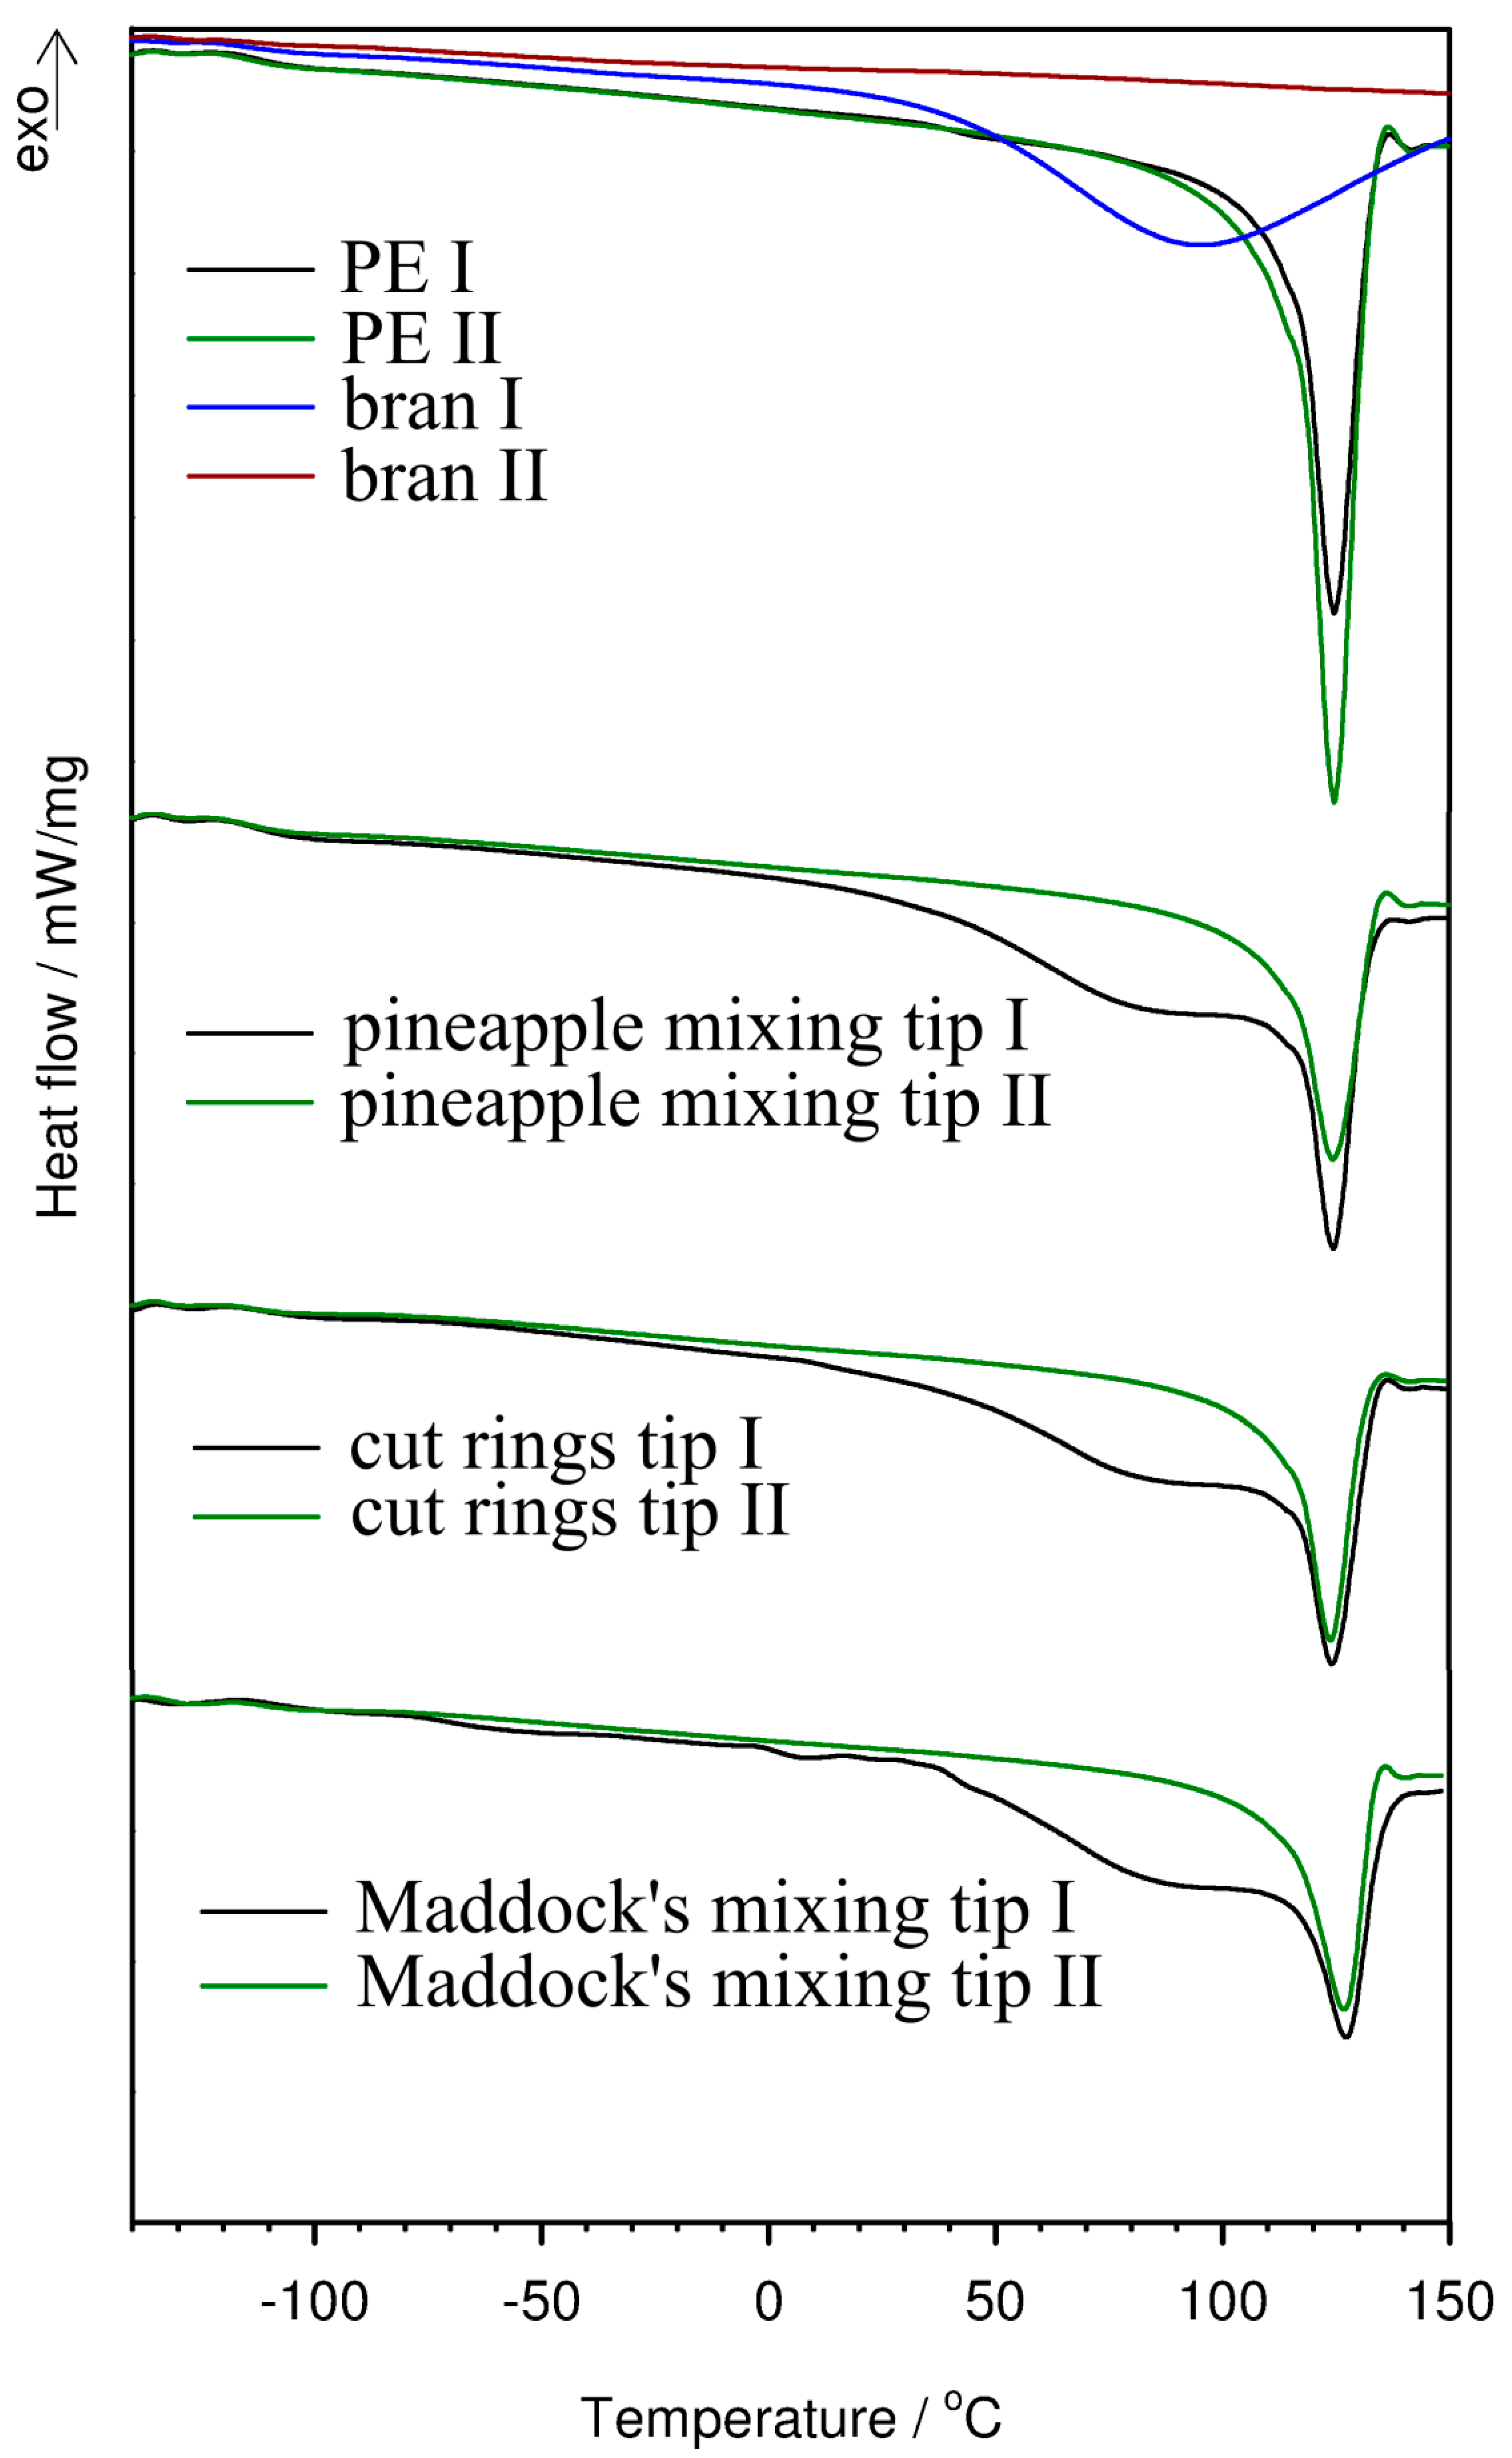
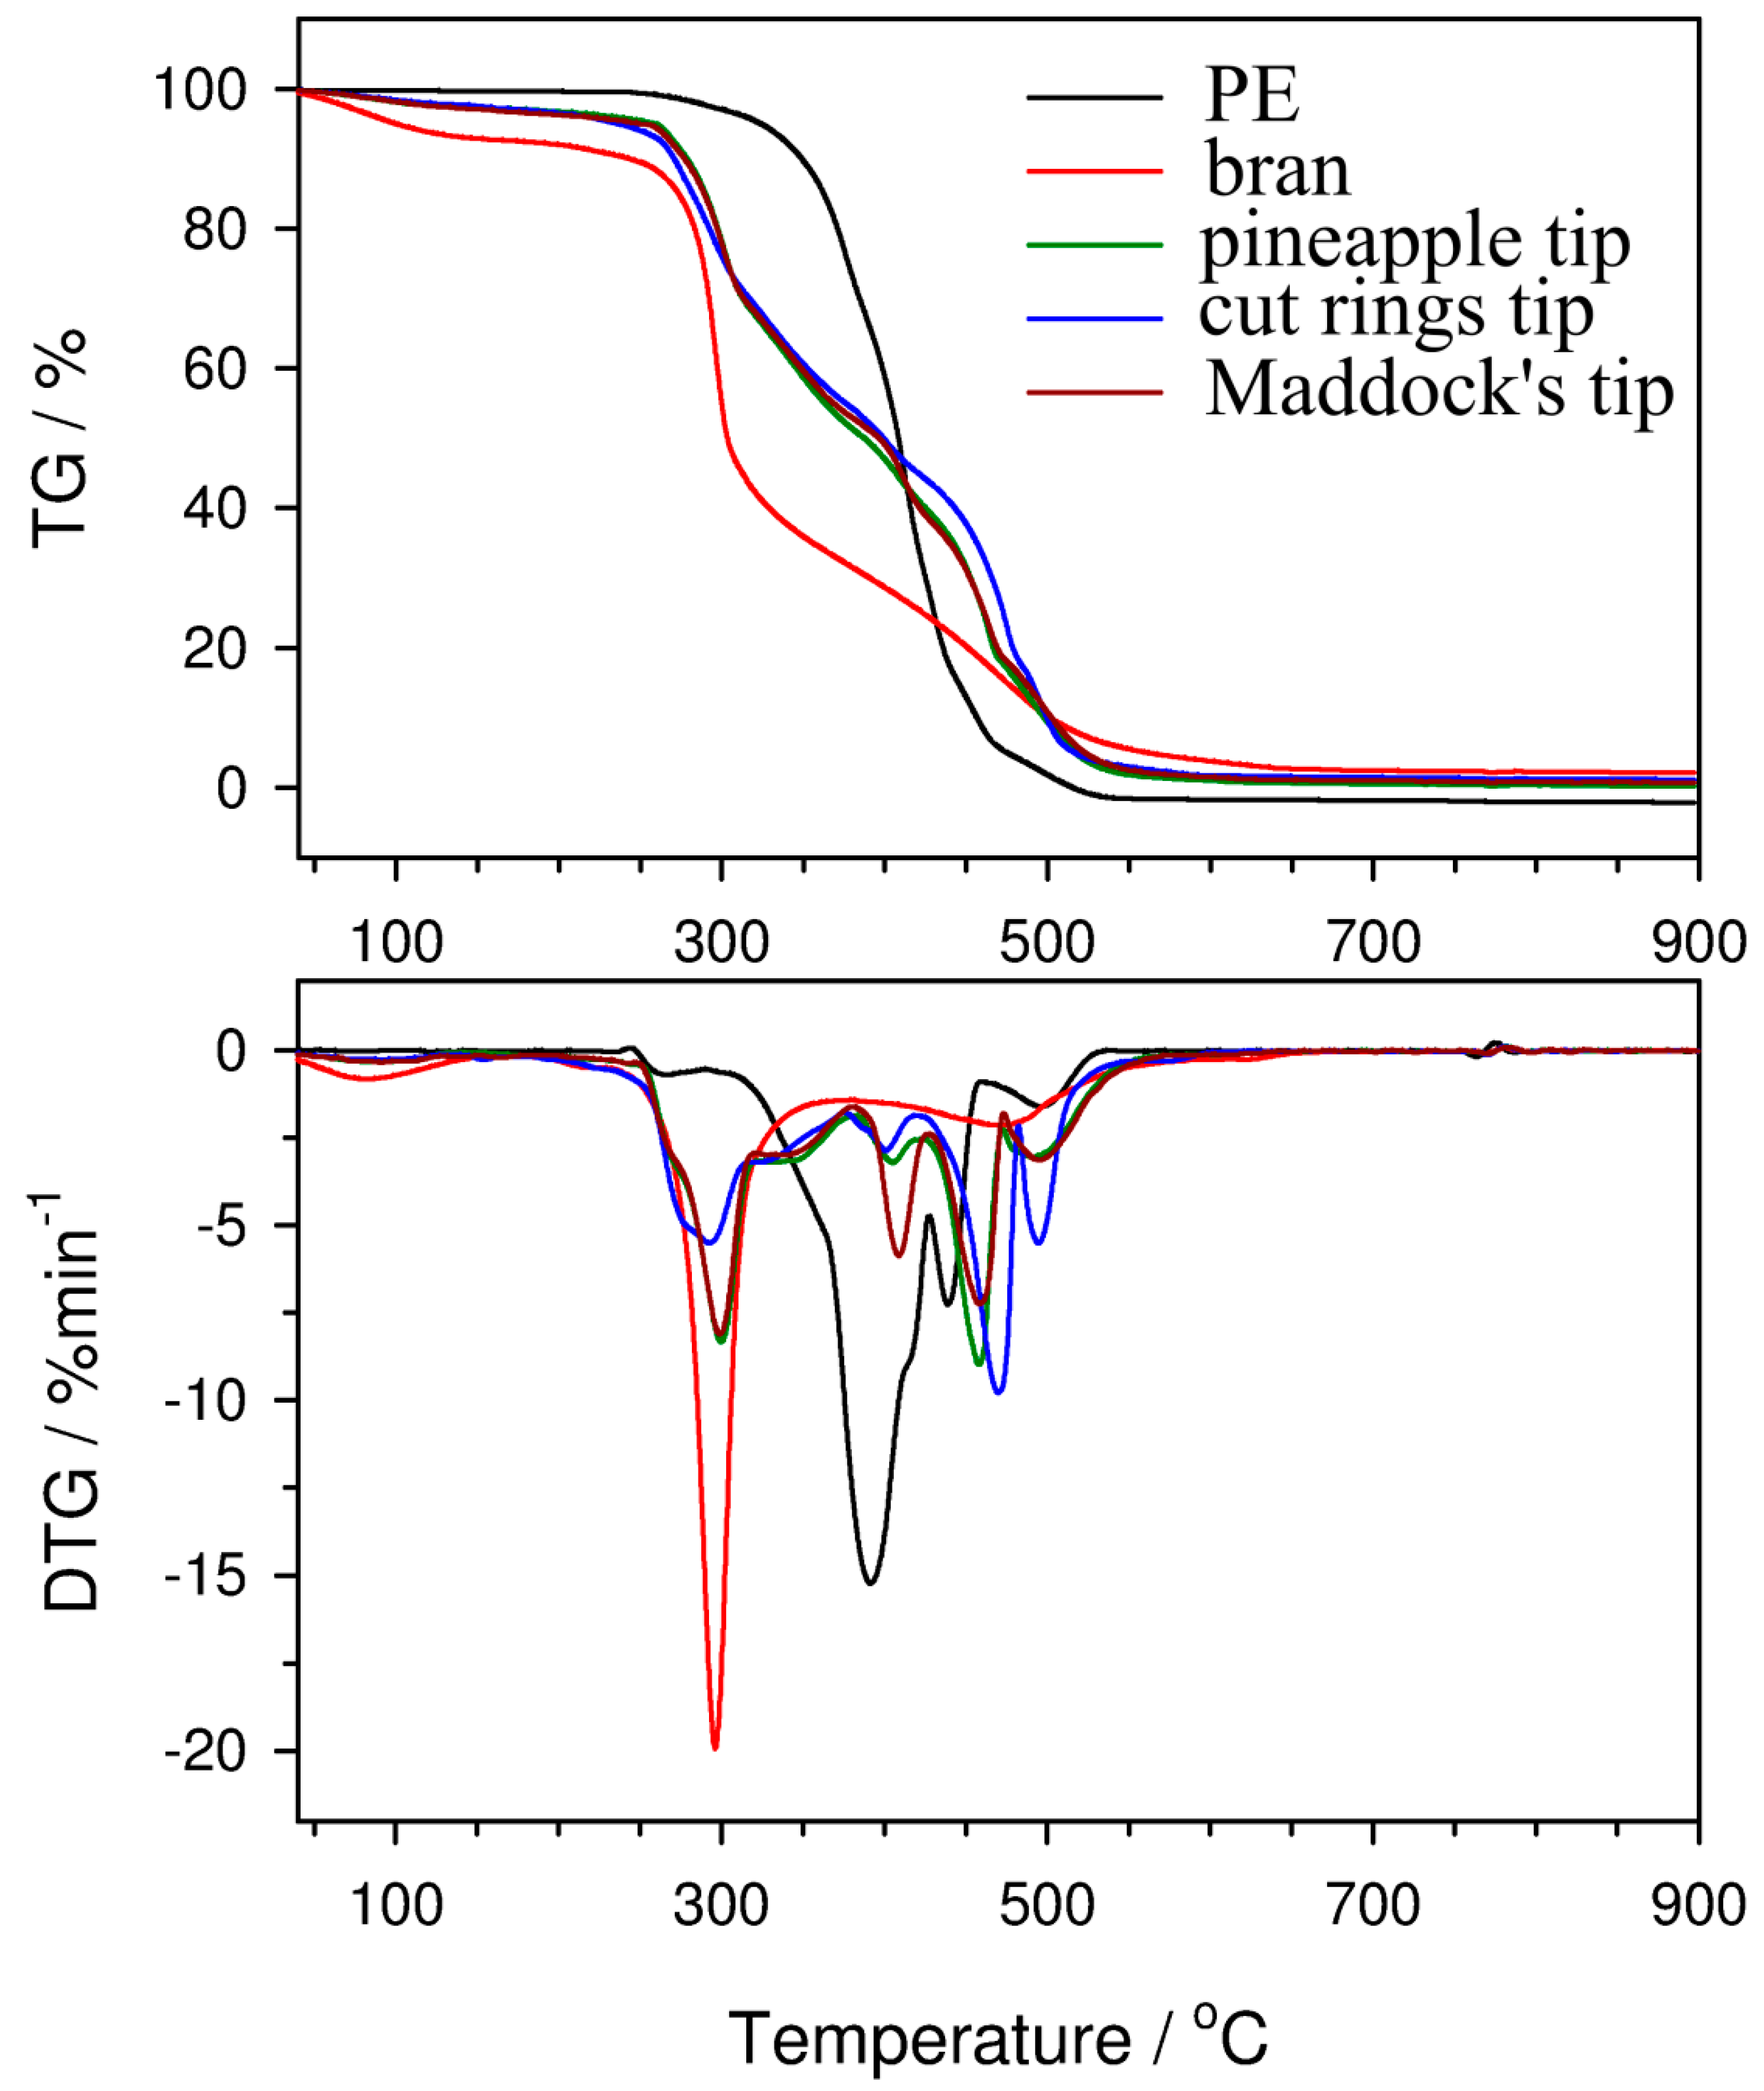
3.10. Thermal Properties
4. Conclusions
Author Contributions
Funding
Conflicts of Interest
References
- Muniyadi, M.; Yit Siew Ng, T.; Munusamy, Y.; Xian Ooi, Z. Mimusopselengi seed Shell powder as a new bio-filler for polypropylene-basedbio-composites. Bioresources 2018, 13, 272–289. [Google Scholar]
- Hamad, K.; Kaseem, M.; Deri, F. Recycling of waste from polymer materials: An overview of the recent works. Polym. Degrad. Stab. 2013, 98, 2801–2812. [Google Scholar] [CrossRef]
- Obasi, H.C. Peanut husk filled polyethylene composites: Effect of filler content and compatibilizer on properties. J. Polym. 2015, 2015, 189289. [Google Scholar] [CrossRef] [Green Version]
- Obasi, H.C.; Onuegbu, G.C. Biodegradability and mechanical properties of low density polyethylene/waste maizecob flour blends. Int. J. Appl. Sci. Eng. Res. 2013, 2, 242–249. [Google Scholar]
- Hanfi, I.; Rohani, A.M.; Razaina, M.T. Effect of soil burial on properties of linear low density polyethylene/thermoplastic sago starch blends. Pertanika J. Sci. Technol. 2011, 19, 189–197. [Google Scholar]
- Faruk, O.; Bledzki, A.K.; Fink, H.P.; Sain, M. Biocomposites reinforced with natural fibers: 2000–2010. Prog. Polym. Sci. 2012, 37, 1552–1596. [Google Scholar] [CrossRef]
- Satyanarayana, K.G.; Prasad, V.S. Starch-based “Green” composites. In Biodegradable Green Composites; Kalia, S., Ed.; John Wiley and Sons, Inc.: Hoboken, NJ, USA, 2016; pp. 199–298. [Google Scholar]
- Bekele, L.D.; Zhang, W.; Liu, Y.; Duns, G.J.; Yu, C.; Jin, X.; Li, X.; Jia, Q.; Chen, J. Preparation and characterization of lemongrass fiber (Cymbopogonspecies) for reinforcing application in thermoplastic composites. Bioresources 2017, 12, 5664–5681. [Google Scholar] [CrossRef]
- Schirp, A.; Mannheim, M.; Plinke, B. Influence of refiner fibre quality and fibre modification treatment on properties of injection-moulded beech wood-plastic composites. Compos. Part A Appl. Sci. Manuf. 2014, 61, 245–257. [Google Scholar] [CrossRef]
- Haque, M.; Hasan, M.; Islam, S.; Ali, E. Physico-mechanical properties of chemically treated palm and coir fiber reinforced polypropylene. Bioresour. Technol. 2009, 100, 4903–4906. [Google Scholar] [CrossRef]
- Raju, G.U.; Kumarappa, S.; Gaitonde, V.N. Mechanical and physical characterization of agricultural waste reinforced polymer composites. J. Mater. Environ. Sci. 2012, 3, 907–916. [Google Scholar]
- Ashori, A.; Nourbakhsh, A. Bio-based composites from waste agricultural residues. Waste Manag. 2010, 2, 680–684. [Google Scholar] [CrossRef] [PubMed]
- Malkapuram, R.; Kumar, V.; Singh Negi, Y. Recent development in natural fiber reinforced polypropylene composites. J. Reinf. Plast. Compos. 2009, 28, 1169–1189. [Google Scholar] [CrossRef]
- Tian, G.; Zhuang, J.; Fu, Y.; Wang, Z.; Li, Q. Enhanced mechanical strength of polypropylene-based lignocellulosic-plastic composites by cellulose fibers. Bioresources 2019, 14, 1668–1678. [Google Scholar]
- Fabiyi, J.S.; McDonald, A.G. Effect of wood species on property and weathering performance of wood plastic composites. Compos. Part A Appl. Sci. Manuf. 2010, 41, 1434–1440. [Google Scholar] [CrossRef]
- Mirmehdi, S.M.; Zeinaly, F.; Dabbagh, F. Date palm wood flour as filler of linear low-density polyethylene. Compos. Part B Eng. 2014, 56, 137–141. [Google Scholar] [CrossRef]
- Hattotuwa, G.; Premalal, B.; Ismail, H.; Bahrain, A. Comparison of the mechanical properties of rice husk powder filled polypropylene composites with talc filled polyethylene composites. Polym. Test. 2002, 21, 833–839. [Google Scholar]
- Salemane, M.G.; Luyt, A.S. Thermal and mechanical properties of polypropylene-wood powder composites. J. Appl. Polym. Sci. 2006, 100, 4173–4180. [Google Scholar] [CrossRef]
- Nishiyama, Y.; Langan, P.; Chanzy, H. Crystal structure and hydrogen-bonding system in cellulose lbeta from synchrotron X-ray and neutron fiber diffraction. J. Am. Chem. Soc. 2002, 124, 9074–9082. [Google Scholar] [CrossRef]
- Scheller, H.V.; Ulvskov, P. Hemicelluloses. Annu. Rev. Plant Biol. 2010, 61, 263–289. [Google Scholar] [CrossRef]
- Majewski, Ł.; Gaspar Cunha, A. Evaluation of suitability of wheat bran as a natural filler in polymer processing. Bioresources 2018, 13, 7037–7052. [Google Scholar]
- De Menezes, A.J.; Siqueira, G.; Curvelo, A.A.S.; Dufresne, A. Extrusion and characterization of functionalized cellulose whiskers reinforced polyethylene nanocomposites. Polymer 2009, 50, 4552–4563. [Google Scholar] [CrossRef]
- Rahmat, W.; Tin Sin, L.; Rahmat, A.R.; Isa, N.M.; Salleh, M.S.N.; Mokhtar, M. Comparison of rice husk-filled polyethylene composite and natural wood under weathering effects. J. Compos. Mater. 2010, 45, 1403–1410. [Google Scholar] [CrossRef]
- Luz, S.M.; Tio, J.D.; Rocha, G.J.M.; Goncalves, A.R.; Del’Arco, A.P. Cellulose and cellullignin from sugarcane bagasse reinforced polypropylene composites: Effect of acetylation on mechanical and thermal properties. Compos. Part A Appl. Sci. Manuf. 2008, 39, 1362–1369. [Google Scholar] [CrossRef]
- Saxena, M.; Morchhale, R.K.; Asokan, P.; Prasad, B.K. Plant fiber-industrial waste reinforced polimer composites as potential Wood substitute material. J. Compos. Mater. 2008, 42, 367–384. [Google Scholar] [CrossRef]
- Habibi, Y.; El-Zawawy, W.K.; Ibrahim, M.M.; Dufresne, A. Processing and characterization of reinforced polyrthylene composites made with lignocellulosic fibers from Egyptian agro-industries residues. Compos. Sci. Technol. 2008, 68, 1877–1885. [Google Scholar] [CrossRef] [Green Version]
- Taha, I.; Ziegmann, G. A comparison of mechanical properties of natural fiber filled biodegradable and polyolefin polymers. J. Compos. Mater. 2006, 40, 1933–1946. [Google Scholar] [CrossRef]
- Yeh, S.; Agarwal, S.; Gupta, R.K. Wood-plastic composites formulated with virgin and recycled ABS. J. Compos. Mater. 2009, 69, 2225–2230. [Google Scholar] [CrossRef]
- Saheb, D.N.; Jog, J.P. Natural fiber polymer composites: A review. Adv. Polym. Technol. 1999, 18, 351–363. [Google Scholar] [CrossRef]
- Dai, H.; Smith, M.J.; Ramani, K. Design and processing of a thermoplastic composite reinforced wood structure. Polym. Compos. 2004, 25, 119–133. [Google Scholar] [CrossRef]
- Zhang, S.; Rodrigue, D.; Riedl, B. Preparation and morphology of polypropylene/wood flour composite foams via extrusion. Polym. Compos. 2005, 26, 731–738. [Google Scholar] [CrossRef]
- Bengtsson, M.; Oksman, K.; Stark, N.M. Profile extrusion and mechanical properties of crosslinked wood-thermoplastic composites. Polym. Compos. 2006, 27, 184–194. [Google Scholar] [CrossRef]
- Petchwattana, N.; Covavisaruch, S.; Chanakul, S. Mechanical properties, thermal degradation and natural weathering of high density polyethylene/rice hull composites compatibilized with maleic anhydride grafted polyethylene. J. Polym. Res. 2012, 19, 9921–9926. [Google Scholar] [CrossRef]
- Cerqueira, E.F.; Baptista, C.A.R.P.; Mulinari, D.R. Mechanical behavior of polypropylene reinforced sugarcane bagasse fibers composite. Procedia Eng. 2011, 10, 2046–2051. [Google Scholar] [CrossRef] [Green Version]
- Hubbe, M.A.; Ferrer, A.; Tyagi, P.; Yin, Y.; Salas, C.; Pal, L.; Rojas, O.J. Nanocellulose in thin films, coatings, and plies for packaging applications: A review. Bioresources 2017, 12, 2143–2233. [Google Scholar] [CrossRef] [Green Version]
- Hubbe, M.A.; Rojas, O.J.; Lucia, L.A.; Sain, M. Cellulosic nanocomposites: A review. Bioresources 2008, 3, 929–980. [Google Scholar]
- Thakur, V.K.; Thakur, M.K. Processing and characterization of natural cellulose fibers/thermoset polymer composites. Carbohydr. Polym. 2014, 109, 102–117. [Google Scholar] [CrossRef]
- George, J.; Kumar, R.; Jayaprahash, C.; Ramakrishna, A.; Sabapathy, S.N.; Bawa, A. Rice bran-filled biodegradable low-density polyethylene films: Development and characterization for pachaking applications. J. Appl. Polym. Sci. 2006, 105, 4514–4522. [Google Scholar]
- Tufan, M.; Ayrilmis, N. Potential use of halzenut husk in recycled high-density polyethylene composites. Bioresources 2016, 11, 7476–7489. [Google Scholar] [CrossRef] [Green Version]
- Sarsari, N.A.; Pourmousa, S.; Tajdini, A. Physical and mechanical properties of walnut shell flour-filled thermoplastic starch composites. Bioresources 2016, 11, 6968–6983. [Google Scholar]
- Chun, K.S.; Husseinsyah, S.; Osman, H. Properties of coconut shell powder filled polylactic acid ecocomposites: Effect of maleic acid. Polym. Eng. Sci. 2013, 53, 1109–1116. [Google Scholar] [CrossRef]
- Essabir, H.; Achaby, M.E.; Hilali, E.M.; Bouhfid, R.; Qaiss, A.E. Morphological, structural, thermal and tensile properties of high density polyethylene composites reinforced with treated argan nut shell particles. J. Bionic Eng. 2015, 12, 129–141. [Google Scholar] [CrossRef]
- Abdul Khalil, H.P.S.; Poh, B.T.; Issam, A.M.; Jawaid, M.; Ridzuan, R. Recycled polypropylene-oil pal biomass: The effect on mechanical and physical properties. J. Reinf. Plast. Compos. 2010, 29, 1117–1130. [Google Scholar] [CrossRef]
- Özdemir, F.; Serin, Z.O.; Mengeloglu, F. Utilization of red pepper fruit steam as reinforcing filler in plastic composites. Bioresources 2013, 8, 5299–5308. [Google Scholar] [CrossRef] [Green Version]
- Mengeloglu, F.; Karakus, K. Thermal degradation, mechanical properties and morphology of wheat straw flour filled recycled thermoplastic composites. Sensors 2008, 8, 500–519. [Google Scholar] [CrossRef] [PubMed] [Green Version]
- Ashori, A.; Nourbakhsh, A. Characteristics of wood-fiber plastic composites made of recycled materials. Waste Manag. 2009, 29, 1291–1295. [Google Scholar] [CrossRef]
- Bledzki, A.K.; Mamuna, A.A.; Volk, J. Barley husk and coco nut shell reinforced polypropylene composites: The effect of fibre physical, chemical and surface properties. Compos. Sci. Technol. 2010, 70, 840–846. [Google Scholar] [CrossRef]
- Wang, P.; Liu, J.; Yu, W.; Zhou, C. Isothermal crystallization kinetics of highly filled wood plastic composites: Effect of wood particles content and compatibilizer. J. Macromol. Sci. Part B 2011, 50, 2271–2289. [Google Scholar] [CrossRef]
- Ku, H.; Wang, H.; Pattarachaiyakoop, N.; Trada, M. A review on the tensile properties of natural fiber reinforced polymer composites. Compos. Part B Eng. 2011, 42, 856–873. [Google Scholar] [CrossRef] [Green Version]
- Abba, H.A.; Zahari, I.N.; Sapuan, S.M.; Leman, Z. Characterization of millet (Pennisetumglaucum) husk fiber (MHF) and its use as filler for high density polyethylene (HDPE) composites. Bioresources 2017, 12, 9287–9301. [Google Scholar]
- Jayamani, E.; Hamdam, S.; Rahman, M.R.; Bakri, M.K.B. Study of sound absorption coefficient and characterization of rice straw stem fibers reinforced polypropylene composite. Bioresources 2015, 10, 3378–3392. [Google Scholar] [CrossRef] [Green Version]
- Valle, G.C.; Tavares, M.I.; Luetkemeyer, L.; Stael, G.C. Effect of wood content on the thermal behavior and on the molecular dynamics of wood/plastic composites. Macromol. Symp. 2007, 258, 113–118. [Google Scholar] [CrossRef]
- Hammajam, A.A.; Ismarrubie, Z.; Sapuan, S. Effect of fiber loading on the mechanical properties of millet husk filled high density polyethylene composites. Appl. Mech. Mater. 2014, 564, 350–354. [Google Scholar] [CrossRef]
- Pickering, K.L.; Efendy, M.A.; Le, T.M. A review of recent developments in natural fibre composites and their mechanical performance. Compos. Part A Appl. Sci. Manuf. 2016, 83, 98–112. [Google Scholar] [CrossRef] [Green Version]
- Gurunathan, T.; Mohanty, S.; Nayak, S.K. A review of the recent developments in biocomposites based on natural fibres and their application perspectives. Compos. Part A Appl. Sci. Manuf. 2015, 77, 1–25. [Google Scholar] [CrossRef]
- Feng, J.; Shi, Q.; Chen, Y.; Huang, X. Mold resistance and water absorption of wood/HDPE and bamboo/HDPE composites. J. Appl. Sci. 2014, 14, 776–783. [Google Scholar]
- Tserki, S.; Matzinos, P.; Kokkou, S.; Panayiotou, C. Novel biodegradable composite based on treated lignocellulosic waste and characterization of waste flour. Compos. Part A Appl. Sci. Manuf. 2005, 36, 965–974. [Google Scholar] [CrossRef]
- Maneesh, T.; Singh, V.K.; Gope, P.C.; Chaudhary, A.K. Evaluation of mechanical properties of bagasse-glass fibre reinforced composites. J. Mater. Environ. Sci. 2012, 3, 171–184. [Google Scholar]
- Arrakhiz, F.Z.; El Achaby, M.; Bouhfid, R.; Vaudreuil, S.; Essassi, M.; Qaiss, A. Mechanical and thermal properties of polypropylene reinforced with alfafiber under different chemical treatment. Mater. Des. 2012, 35, 318–322. [Google Scholar] [CrossRef]
- Arrakhiz, F.Z.; El Achaby, M.; Kakou, A.C.; Vaudreuil, S.; Benmoussa, K.; Bouhfid, R.; Fassi-Fehri, O.; Qaiss, A. Mechanical properties of high density polyethylene reinforced with chemically modified coir fibers: Impact of chemical treatments. Mater. Des. 2012, 37, 379–383. [Google Scholar] [CrossRef]
- Essabir, H.; Hilali, E.; El Gharad, A.; El Minor, H.; Imad, A.; El Amraoui, A.; Al Gaoudi, O. Mechanical and thermal properties of bio-composites based on polypropylene reinforced with nut shells of argan particles. Mater. Des. 2013, 49, 442–448. [Google Scholar] [CrossRef]
- Essabir, H.; Nekhlaoui, S.; Malha, M.; Bensalah, M.O.; Arrakhiz, F.Z.; Qaiss, A.; Bouhfid, R. Biocomposites based on polypropylenereinforced with almond shells particles: Mechanical and thermal properties. Mater. Des. 2013, 51, 225–230. [Google Scholar] [CrossRef]
- La Mantia, F.P.; Morreale, M.; MohdIshak, Z.A. Processing and mechanical properties of organic filler-polypropylene composites. J. Appl. Polym. Sci. 2005, 96, 1906–1913. [Google Scholar] [CrossRef]
- Pickering, K.; Abdalla, A.; Ji, C.; McDonald, A.G.; Franich, R.A. The effect of silane coupling agent on radiate pine fibre for use in thermoplastic matrix composites. Compos. Part A Appl. Sci. Manuf. 2003, 34, 915–926. [Google Scholar] [CrossRef] [Green Version]
- Klepka, T.; Garbacz, T.; Bociąga, E. Some properties of of extruded porous microducts. Przemysł Chemiczny 2014, 93, 907–910. [Google Scholar]
- Jachowicz, T.; Garbacz, T.; Tor-Świątek, A.; Gajdoš, I.; Czulak, A. Investigation of selected properties of injection-molded parts subjected to natural ageing. Int. J. Polym. Anal. Charact. 2015, 20, 307–315. [Google Scholar] [CrossRef]
- Rauwendaal, C. Understanding Extrusion, 3rd ed.; Carl Hanser Verlag: Munich, Germany, 2019. [Google Scholar]
- White, J.L.; Kim, K.J. Thermoplastic and Rubber Compounds, Technology and Physical Chemistry; Carl Hanser Verlag: Munich, Germany, 2008. [Google Scholar]
- Panthapulakkal, P.; Law, S.; Sain, M. Enhancement of processability of rice husk filled high density polyethylene composite profiles. J. Thermoplast. Compos. Mater. 2005, 18, 445–458. [Google Scholar] [CrossRef]
- Li, T.Q.; Wolcott, M.P. Rheology of wood plastics melt. Part 1. Capillary rheometry of HDPE filled with maple. Polym. Eng. Sci. 2005, 45, 549–559. [Google Scholar] [CrossRef]
- Santi, C.R.; Hage, E.; Vlachopoulos, J.; Correa, C.A. Rheology and processing of HDPE/wood flour composites. Int. Polym. Process. 2009, 24, 346–353. [Google Scholar] [CrossRef]
- Li, H.; Law, S.; Sain, M. Process rheology and mechanical property correlationship of wood flour-polypropylene composites. J. Reinf. Plast. Compos. 2004, 23, 1153–1158. [Google Scholar] [CrossRef]
- Maiti, S.N.; Subbarao, R.; Ibrahim, M.N. Effect of wood fibers on the rheological properties of i-PP/wood fiber composites. J. Appl. Polym. Sci. 2003, 91, 644–650. [Google Scholar] [CrossRef]
- Rauwendaal, C. Polymer Mixing: A Self-Study Guide; Carl Hanser Verlag: Munich, Germany, 1998. [Google Scholar]
- Dowlex 2631.10EU Polyethylene Resin—Technical Data Sheet. Available online: https://www.dow.com/en-us/document-viewer.html?ramdomVar=9174234036439704424&docPath=/content/dam/dcc/documents/en-us/productdatasheet/400/400-00089061en-dowlex-2631ue-tds.pdf (accessed on 25 April 2019).
- ISO 1183-1:2019—Plastics—Methods for Determining the Density of Non Cellular Plastics—Part 1: Immersion Method, Liquid Pycnometer Method and Titration Method; ISO: Geneva, Switzerland, March 2019.
- ISO 62:2008—Plastics—Determination of Water Absorption; ISO: Geneva, Switzerland, February 2008.
- ISO 585:1990—Plastics—Unplasticized Cellulose Acetate—Determination of Moisture Content; ISO: Geneva, Switzerland, December 1990.
- ISO 527-2:2012—Plastics—Determination of Tensile Properties—Part 2: Test Conditions for Moulding and Extrusion Plastics; ISO: Geneva, Switzerland, February 2012.
- ISO 1133-1:2011—Plastics—Determination of the Melt Mass-Flow Rate (MFR) and Melt Volume-Flow Rate (MVR) of Thermoplastics—Part 1: Standard Method; ISO: Geneva, Switzerland, December 2011.
- Mathot, V.B.F. Calorimetry and Thermal Analysis of Polymers; Carl Hanser Verlag: Munich, Germany, 1994. [Google Scholar]
- Poletto, M.; Zattera, A.J.; Santana, R.M. Structural differences between Wood species: Evidence from chemical composition, FTIR spectroscopy, and thermogravimetric analysis. J. Polym. Sci. 2012, 126, E337–E344. [Google Scholar] [CrossRef]
- Szymańska-Chargot, M.; Zdunek, A. Use of FT-IR spectra and PCA to the bulk characterization of cell Wall residues of fruits and vegetables along a fraction process. Food Biophys. 2013, 8, 29–42. [Google Scholar] [CrossRef] [PubMed] [Green Version]
- Stevenson, L.; Philips, F.; O’Sullivan, K.; Walton, J. Wheat bran: Its composition and benefits to health, a European perspective. Int. J. Food Sci. Nutr. 2012, 63, 1001–1013. [Google Scholar] [CrossRef] [PubMed] [Green Version]
- Pozo, C.; Rodríguez-Llamazares, S.; Bouza, R.; Barral, L.; Castaño, J.; Müller, N. Study of the structural order of native starch granules using combined FTIR and XRD analysis. J. Polym. Res. 2018, 25, 266. [Google Scholar] [CrossRef]
- Fang, J.M.; Fowler, P.A.; Tomkinson, J.; Hill, C.A.S. The preparation and characterization of a series of chemically modified potato starches. Carbohydr. Polym. 2002, 47, 245–252. [Google Scholar] [CrossRef]
- Piotrowicz, I.B.B.; Salas-Mellado, M.M. Protein concentrates from defatted rice bran: Preparation and characterization. Food Sci. Technol. 2017, 37. [Google Scholar] [CrossRef] [Green Version]
- Spina, R. Technological characterization of PE/EVA blends for foam injection molding. Mater. Des. 2015, 84, 64–71. [Google Scholar] [CrossRef]
- Liu, W.; Wang, Y.J.; Sun, Z. Effects of polyethylene-grafted maleic anhydride (PE-g-MA) on thermal properties, morphology, and tensile properties of low density polyethylene (LDPE) and corn starch blends. J. Appl. Polym. Sci. 2003, 88, 2904–2911. [Google Scholar] [CrossRef]
- Rotliwala, Y.C.; Parikh, P.A. Thermal degradation of rice-bran with high density polyethylene: A kinetic study. Korean J. Chem. Eng. 2011, 28, 788–792. [Google Scholar] [CrossRef]


| Sample | Heating I | Cooling | Heating II | |||||
|---|---|---|---|---|---|---|---|---|
| Tm [°C] | ΔHm [J/g] | Xc [%] | Tg [°C] | Tc [°C] | Tm [°C] | ΔHm [J/g] | Xc [%] | |
| PE | 125.5 | 155.3 | 56.99 | −113.6 | 108.3 | 125.0 | 177.0 | 64.96 |
| Pineapple tip | 126.0 | - | - | −114.4 | 107.4 | 126.5 | 93.5 | 63.82 |
| Cut rings tip | 126.0 | - | - | −111.7 | 107.7 | 125.7 | 87.6 | 59.80 |
| Maddock tip | 128.2 | - | - | −106.6 | 107.1 | 127.0 | 80.4 | 54.88 |
| Sample | Tmax1 [°C] | Δ m1 [%] | Tmax2 [°C] | Δ m2 [%] | Tmax3 [°C] | Δ m3 [%] | Tmax4 [°C] | Δ m4 [%] | Rm [%] |
|---|---|---|---|---|---|---|---|---|---|
| PE | - | - | 398 | 78.3 | 445 | 15.7 | 502 | 7.0 | 0 |
| Bran | 296 | 66.0 | - | - | - | - | 473 | 31.5 | 2.5 |
| Pineapple tip | 300 | 48.7 | 405 | 10.3 | 458 | 22.3 | 491 | 16.9 | 1.8 |
| Cut rings tip | 293 | 45.0 | 401 | 10.1 | 470 | 26.5 | 495 | 16.8 | 1.6 |
| Maddock tip | 299 | 32.3 | 409 | 29.6 | 458 | 19.4 | 495 | 17.4 | 1.3 |
© 2019 by the authors. Licensee MDPI, Basel, Switzerland. This article is an open access article distributed under the terms and conditions of the Creative Commons Attribution (CC BY) license (http://creativecommons.org/licenses/by/4.0/).
Share and Cite
Sasimowski, E.; Majewski, Ł.; Grochowicz, M. Influence of the Design Solutions of Extruder Screw Mixing Tip on Selected Properties of Wheat Bran-Polyethylene Biocomposite. Polymers 2019, 11, 2120. https://doi.org/10.3390/polym11122120
Sasimowski E, Majewski Ł, Grochowicz M. Influence of the Design Solutions of Extruder Screw Mixing Tip on Selected Properties of Wheat Bran-Polyethylene Biocomposite. Polymers. 2019; 11(12):2120. https://doi.org/10.3390/polym11122120
Chicago/Turabian StyleSasimowski, Emil, Łukasz Majewski, and Marta Grochowicz. 2019. "Influence of the Design Solutions of Extruder Screw Mixing Tip on Selected Properties of Wheat Bran-Polyethylene Biocomposite" Polymers 11, no. 12: 2120. https://doi.org/10.3390/polym11122120
APA StyleSasimowski, E., Majewski, Ł., & Grochowicz, M. (2019). Influence of the Design Solutions of Extruder Screw Mixing Tip on Selected Properties of Wheat Bran-Polyethylene Biocomposite. Polymers, 11(12), 2120. https://doi.org/10.3390/polym11122120