3.1. Comparison of Commercial Printers
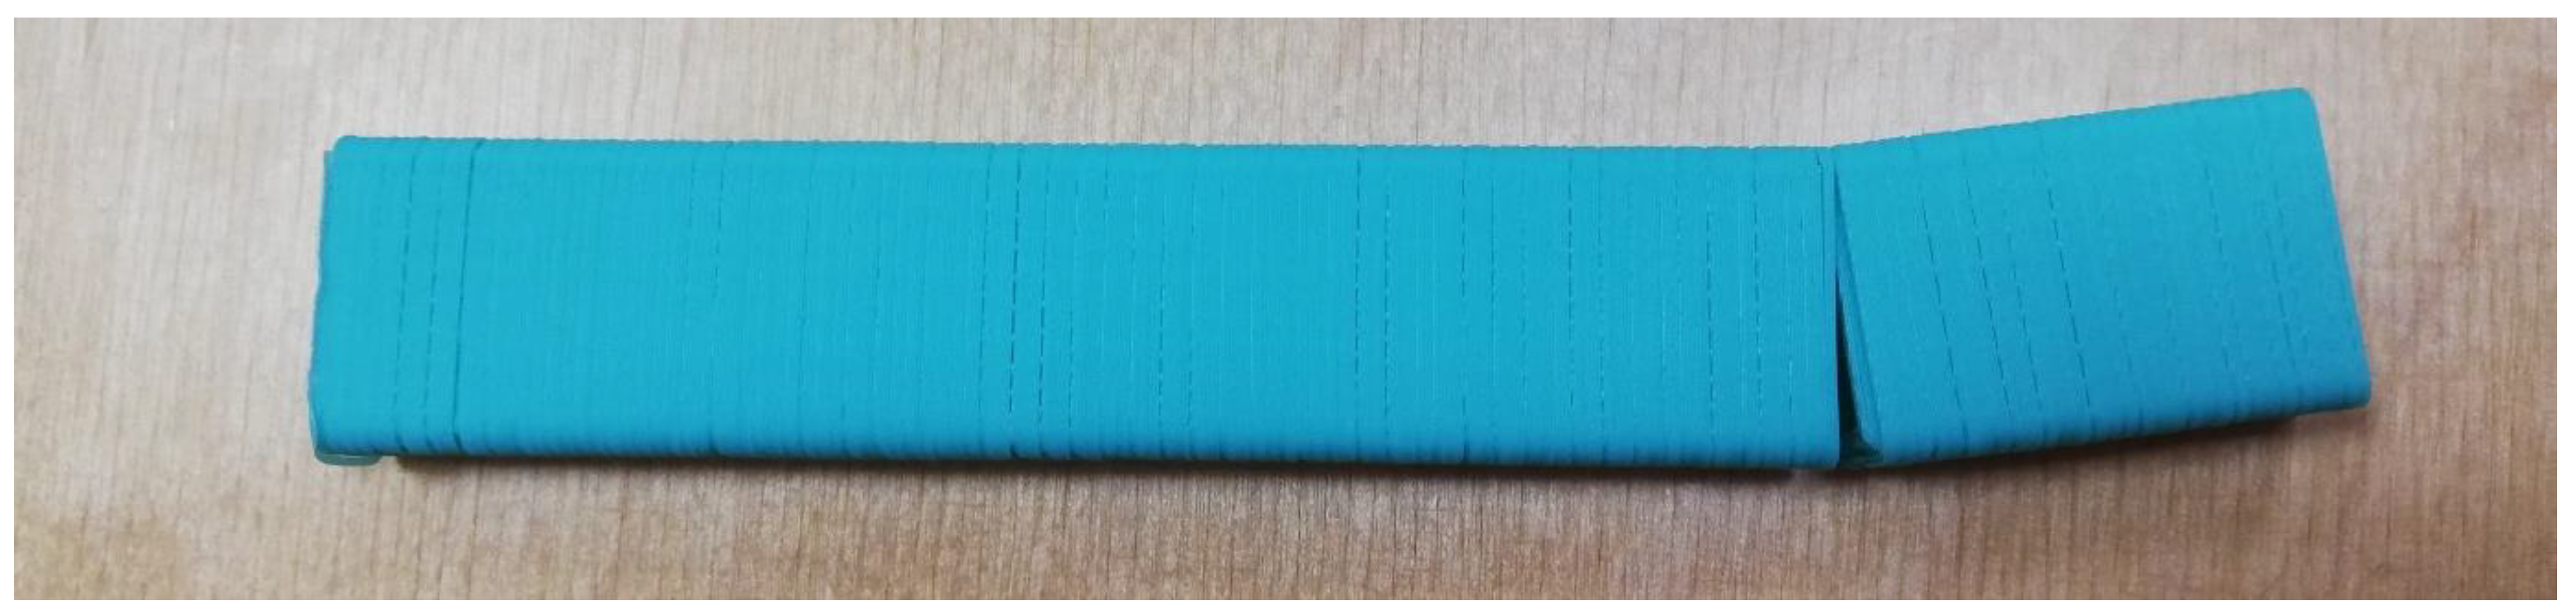
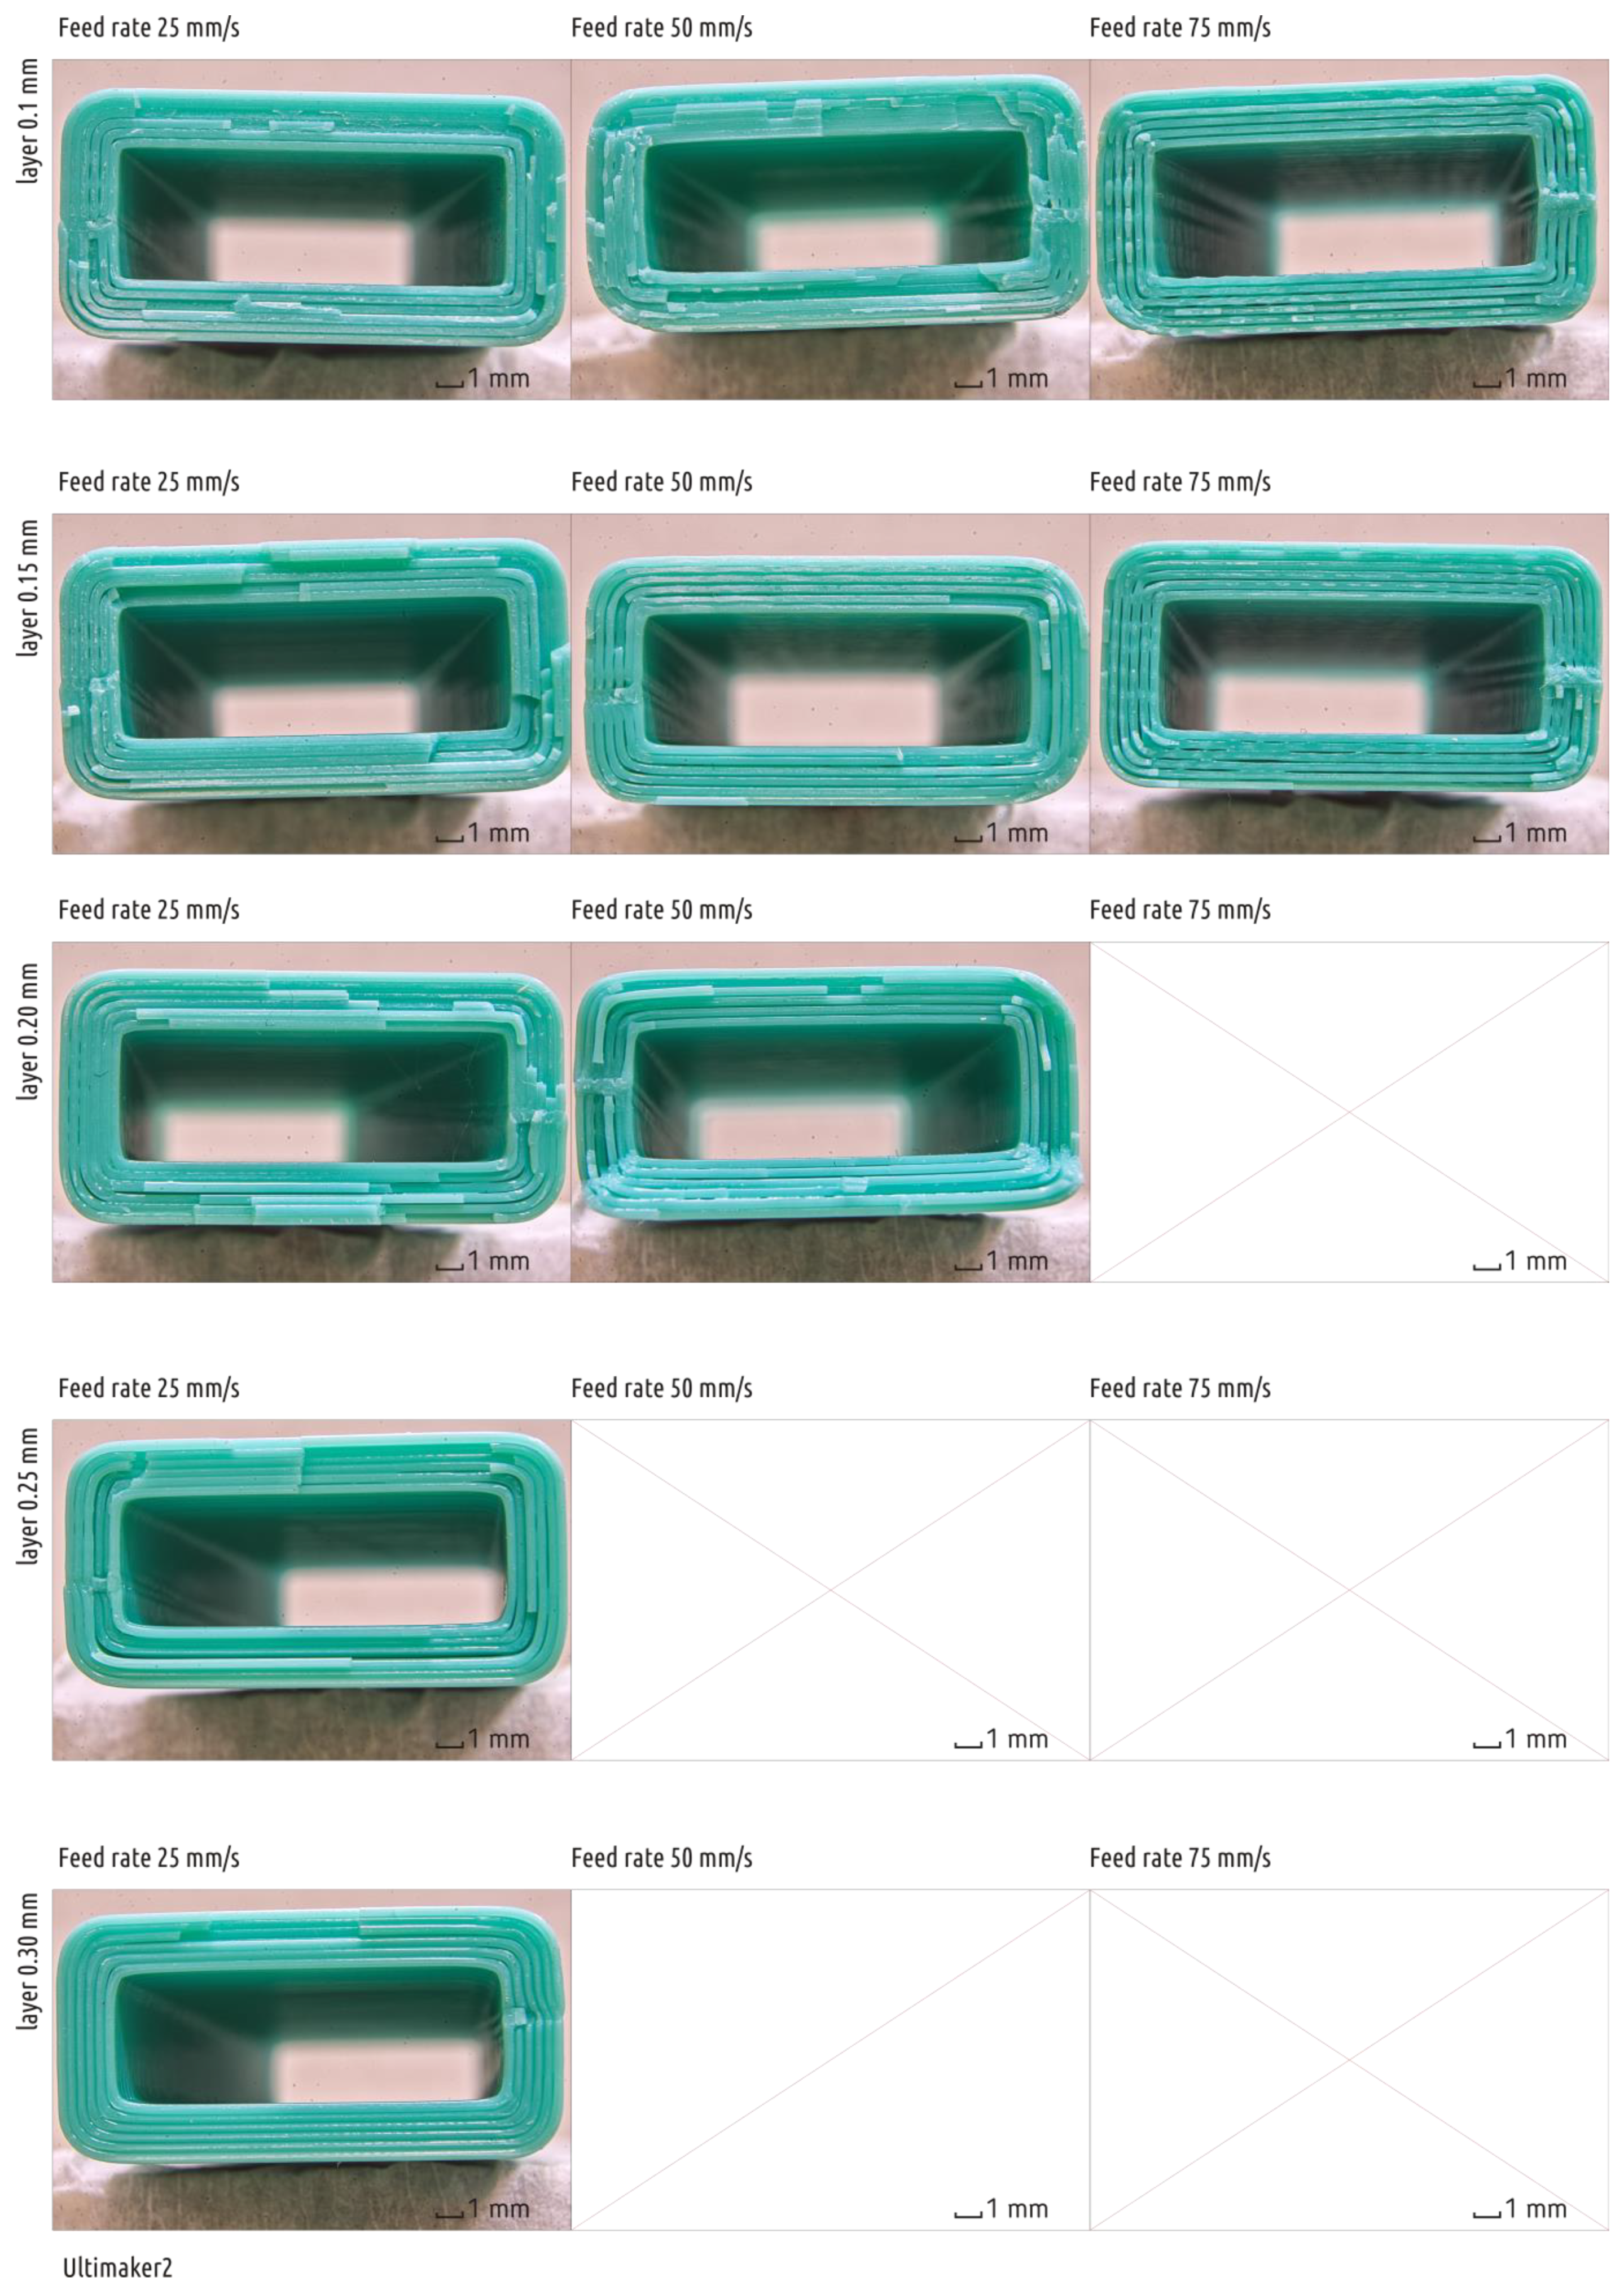
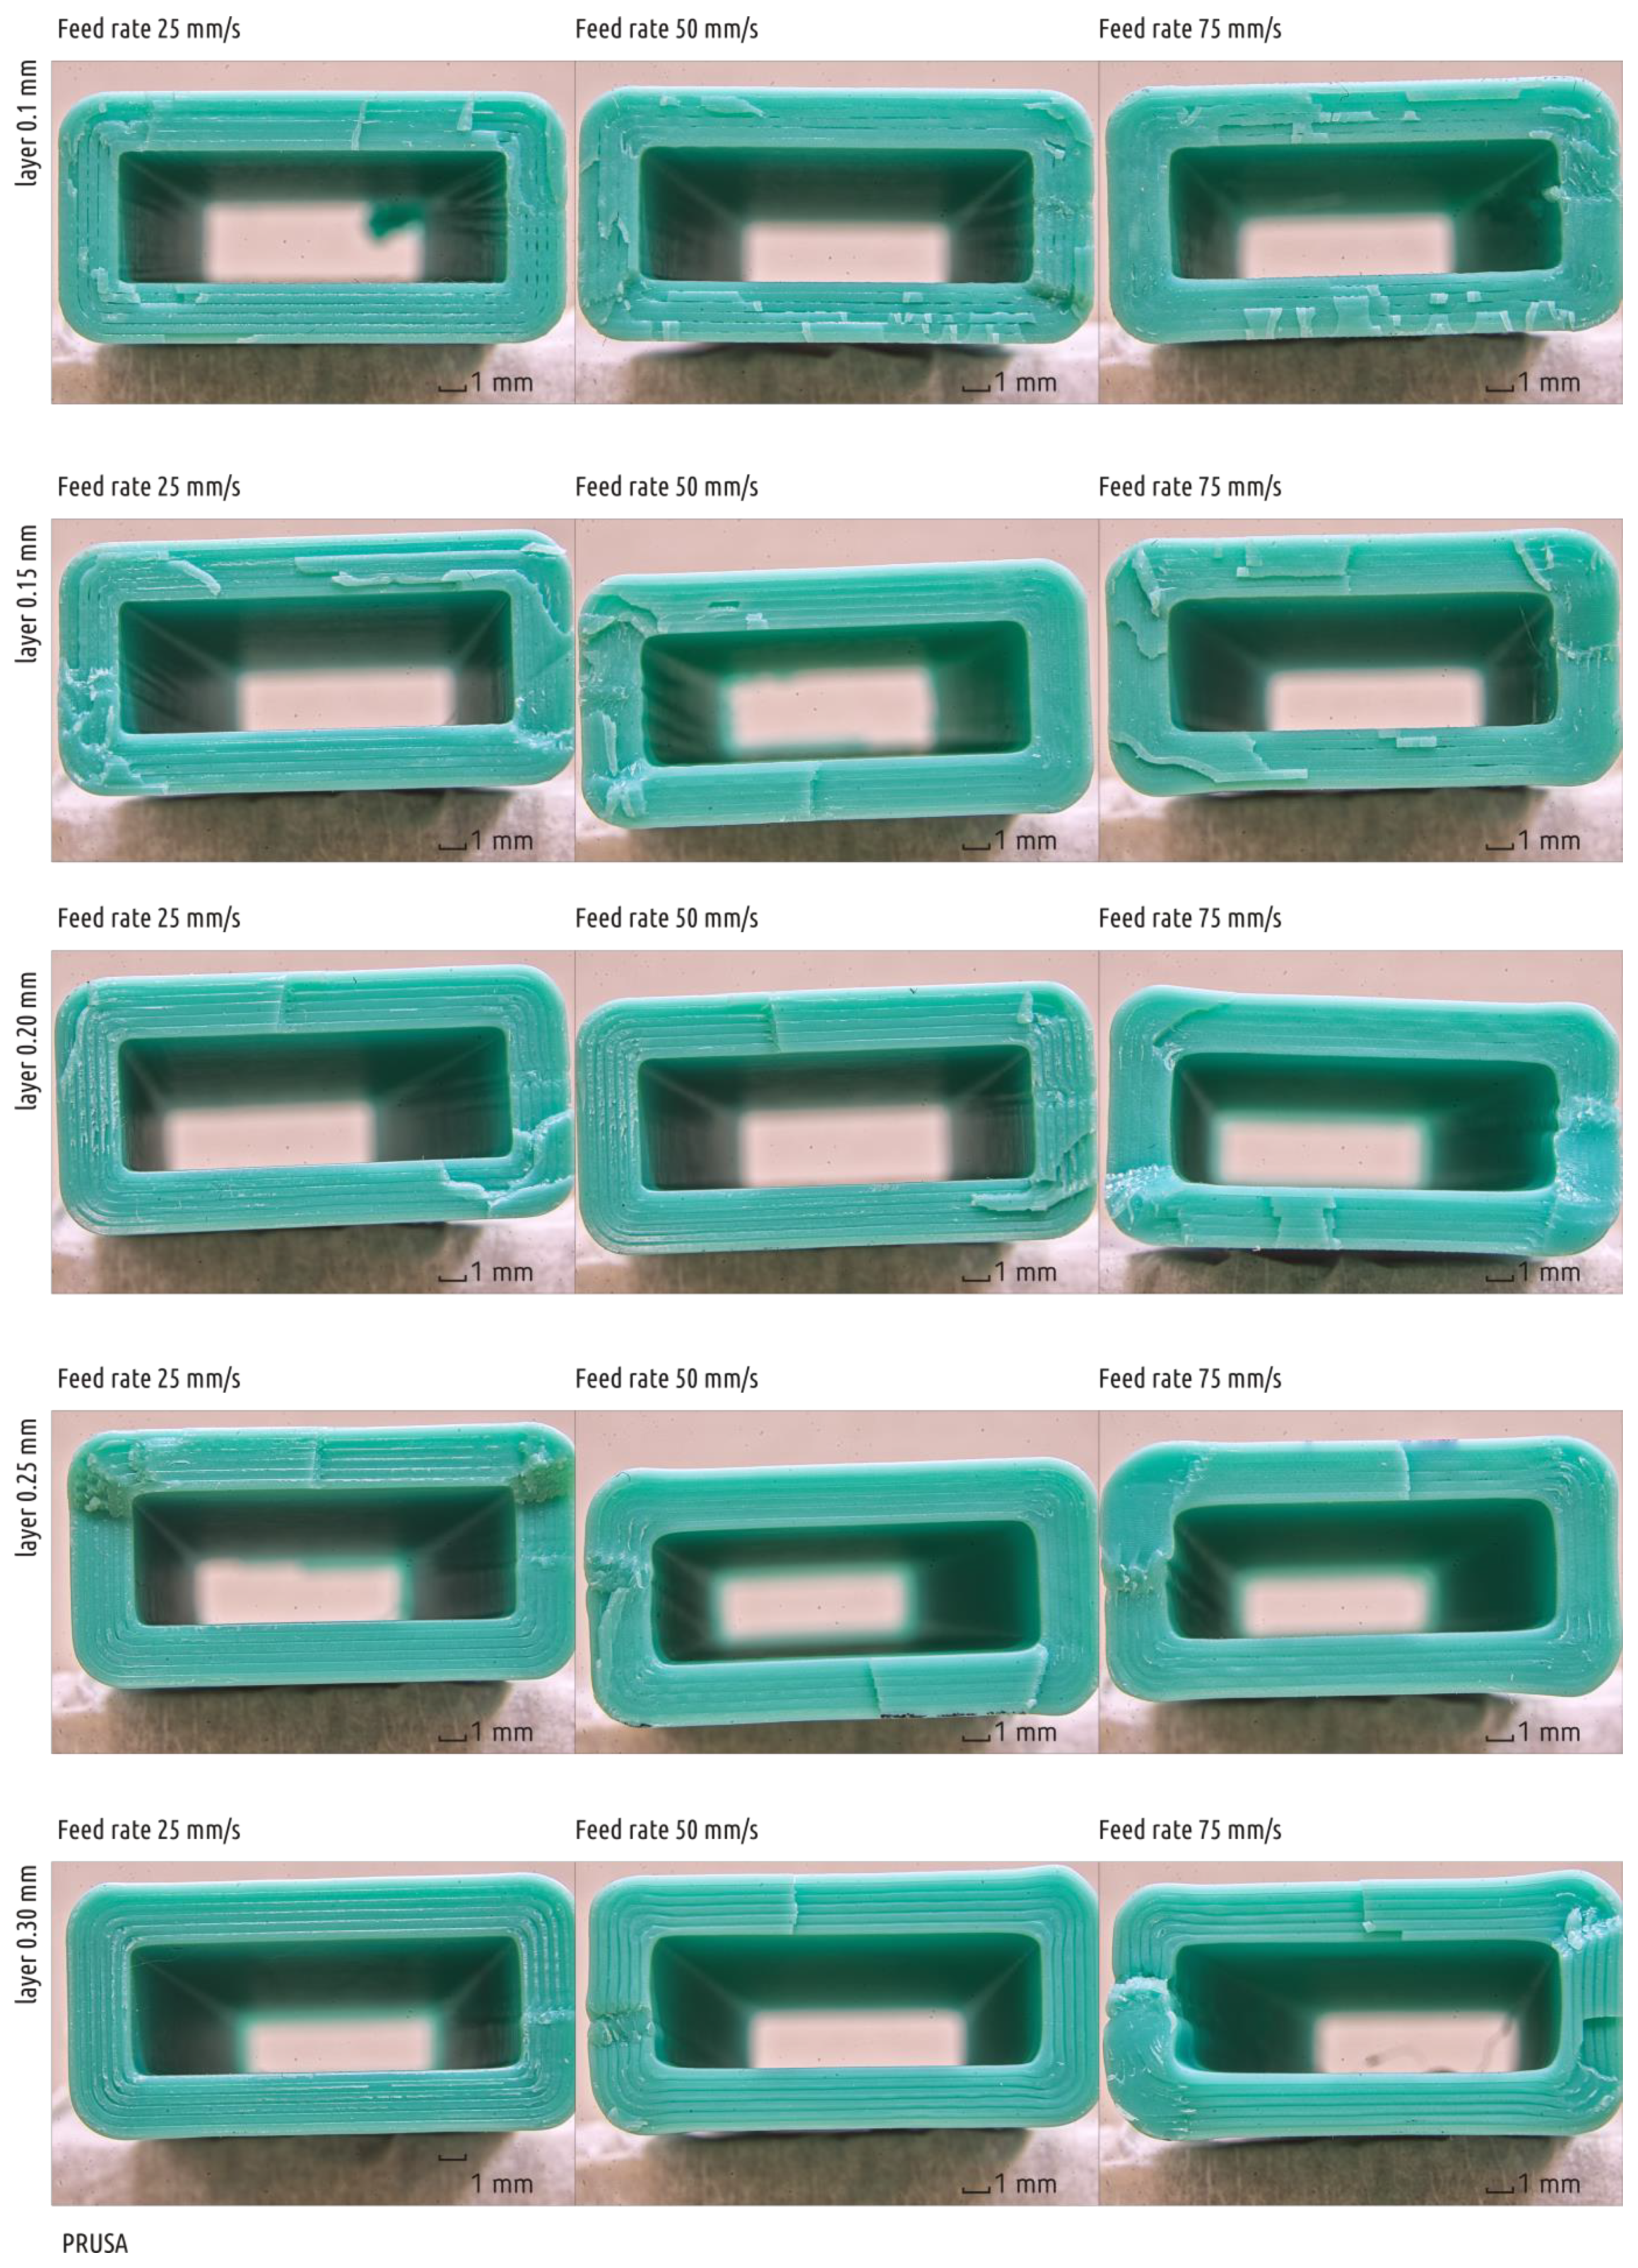
The full testing program of the current research stage was only completed on the WASP machine and, with certain limitations, on PRUSA. The samples printed on PRUSA with 0.3 mm layers at 75 mm/s linear motion speed had distinctive defects caused by sample oscillation (
Figure 3).
The defective zone did not lie in the destruction area in the three-point bending test, and thus these samples were not excluded from the scope. Samples printed on the UM2 machine with a speed of 50 mm/s with a layer thickness of 0.25 mm and above, and samples printed with 75 mm/s speed and 0.2 mm layer and above contained explicit underextrusion defects and were excluded. The 3DQ machine could not provide reliable motion at 75 mm/s. Samples printed at 50 mm/s speed suffered from underextrusion (
Figure 4) even with a 0.2 mm layer, and thus were excluded. The results obtained are summarized in
Table 3,
Table 4,
Table 5 and
Table 6.
The sublayer temperature of the printed samples differed significantly depending on machine (see
Figure 5). This can be explained by the design differences between the machines considered, primarily by the case type and cooling system design and performance.
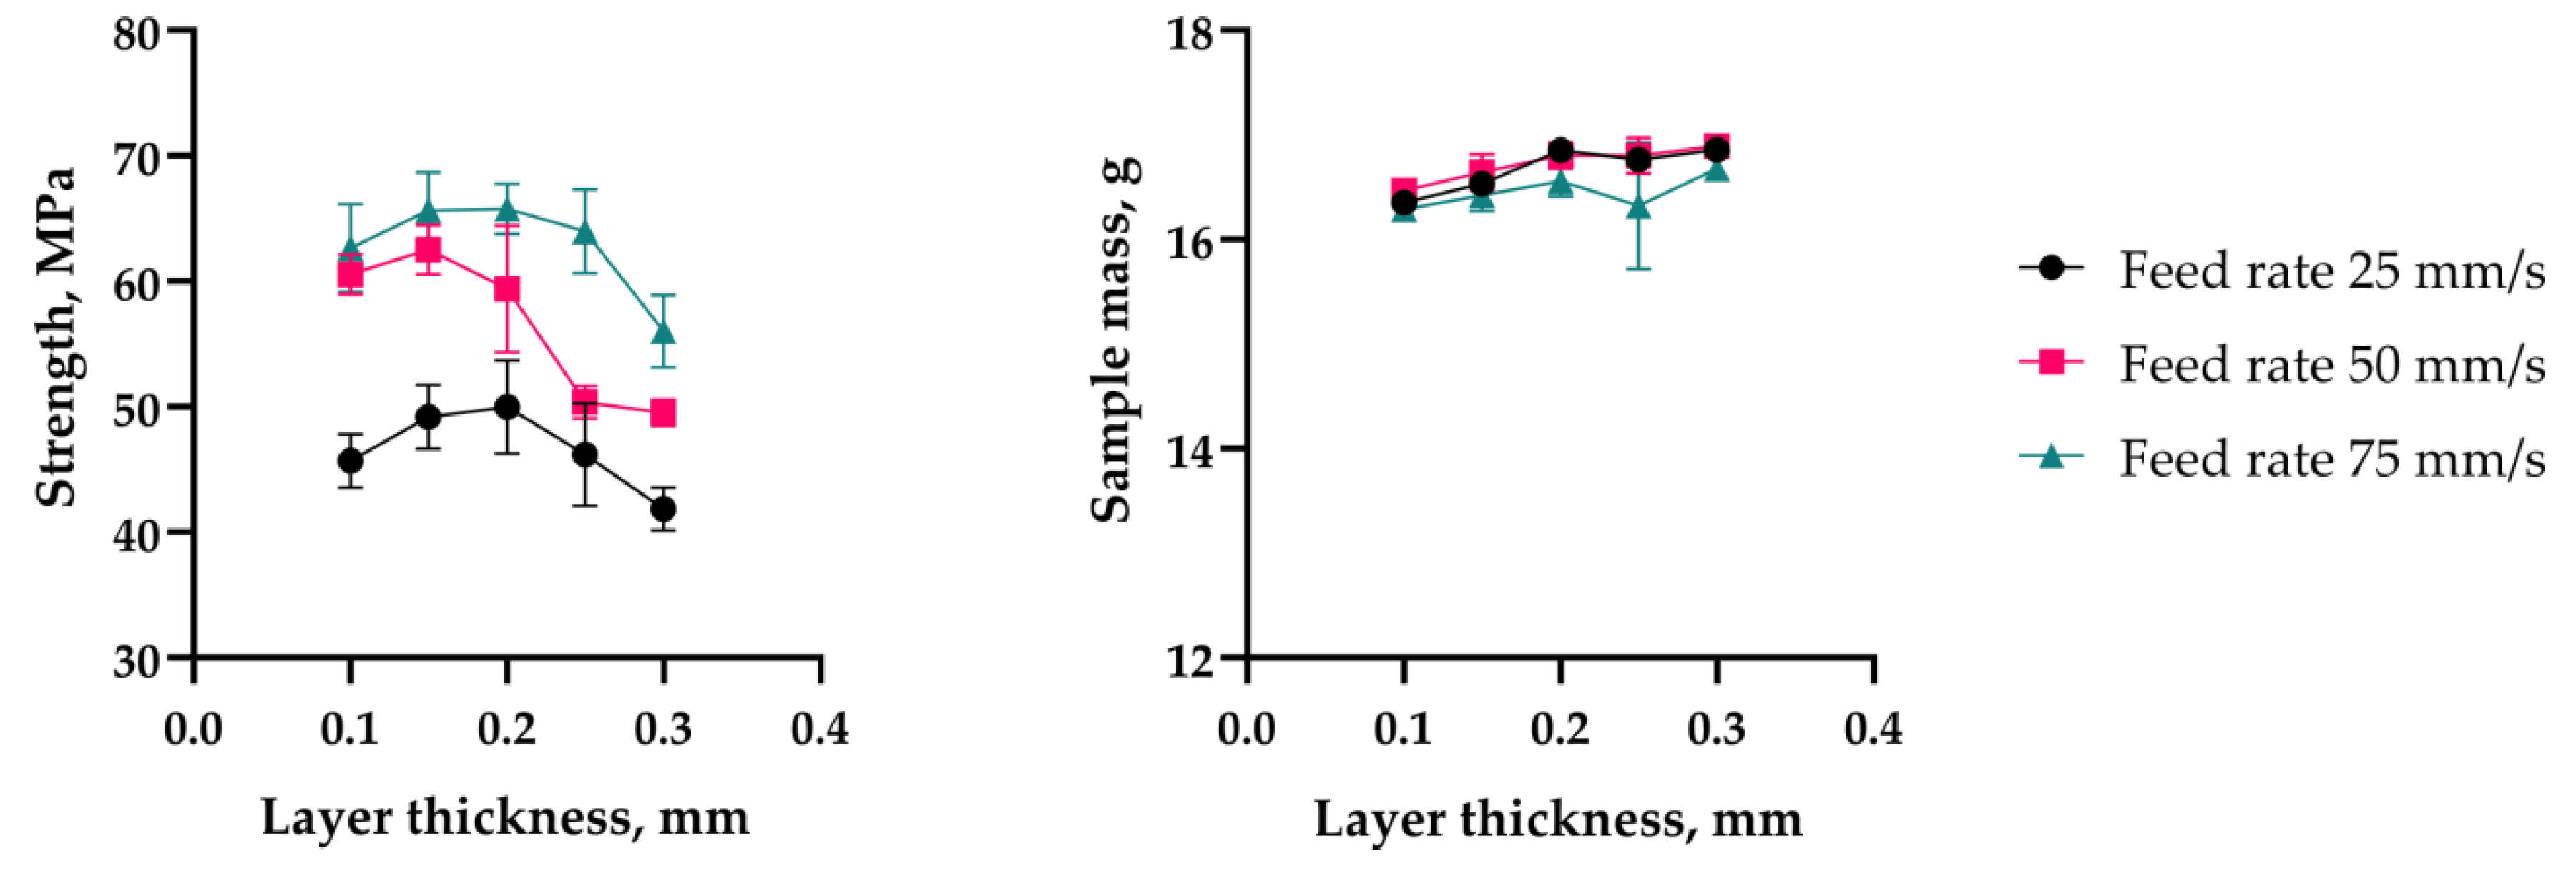
The maximum strength values recorded for each machine considered were nearly at the same level of ~47 ± 2.5 MPa. However, the dependency of the sample mass and strength on layer thickness and printing speed had different natures on machines of different kinds (see
Figure 6).
3.1.1. Bowden vs. Direct: Extruder Type Influence
In the context of the study, type of the extruder (
Figure 7) appeared to be the most significant feature of the hardware setup.
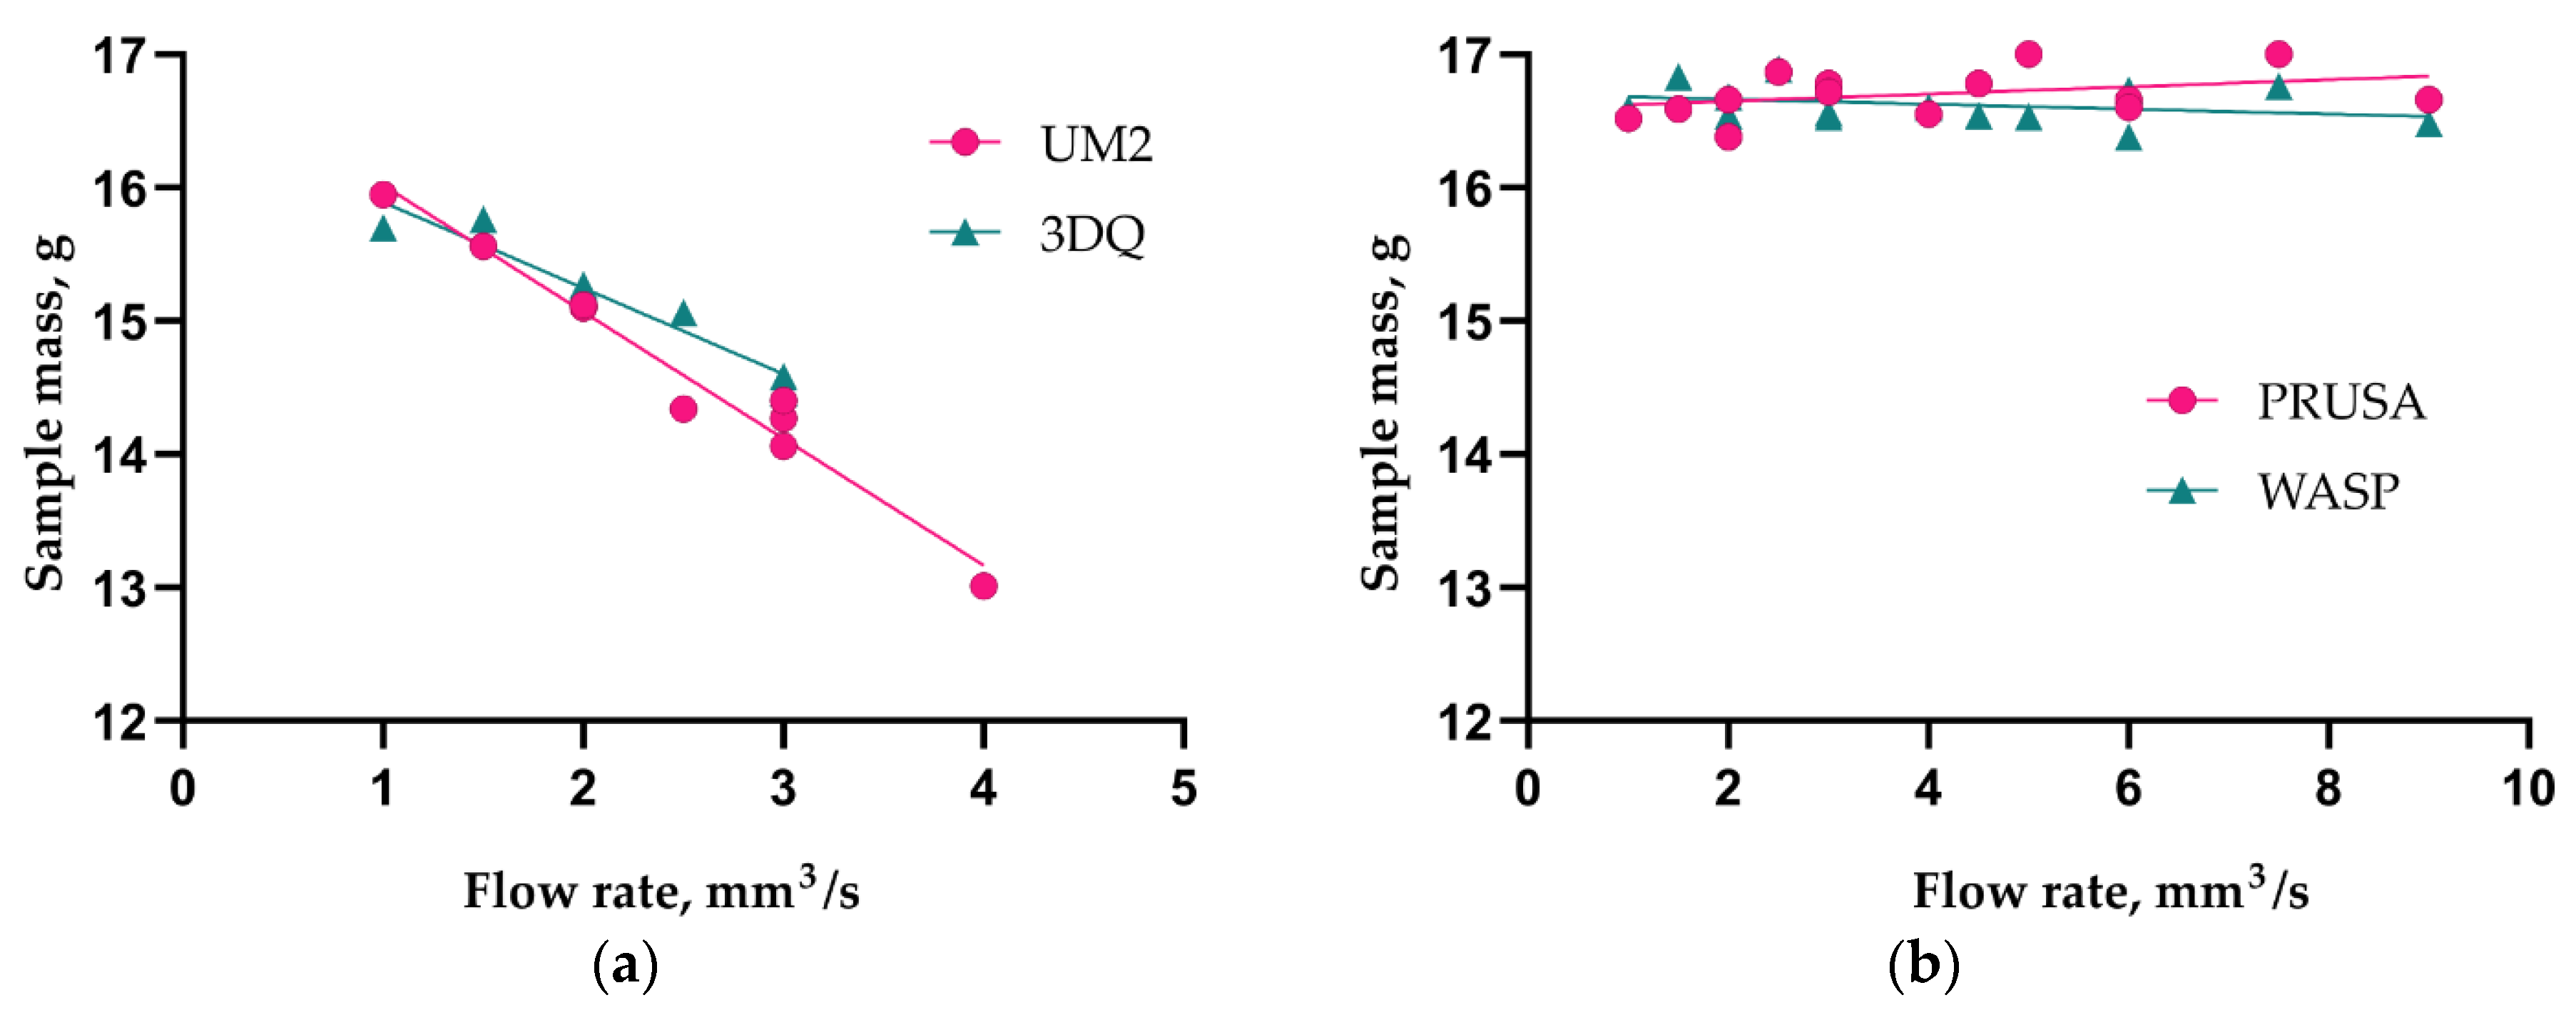
As can be seen from the diagram (
Figure 8), the extrusion efficiency for extruders of the Bowden type strictly depends on the extrusion resistance. Within a single hardware setup with the Bowden extruder, the extrusion efficiency linearly dropped when increasing the flow rate (with increasing layer thickness or feed rate). The flow rate was calculated by the slicer used in the study (Cura 15.04) by multiplying the layer height, nozzle diameter, and linear motion speed (feed rate). Eventually, increasing flow rate will result in visible underextrusion defects. In contrast, extruders of the direct type work literally in binary mode. When the flow rate is within the hardware productivity limit, it does not affect the extrusion efficiency. When the flow rate goes beyond the limit, the extrusion is interrupted (the extruder motor begins to skip steps or the toothed drive wheel starts to carve filament instead of pushing it forward).
The Bowden extruder with a short tube (WASP) demonstrates similar behavior to the direct extruder (PRUSA); it does not suffer from extrusion resistance. Across the whole range of the flow rate values tested, the mass of samples remained statistically constant. The difference between the Bowden and direct or short tube Bowden extruders is well illustrated by plots of sample mass vs. flow rate (
Figure 8). The extrusion efficiency directly affects the contact area between two adjacent layers and thus the bonding strength; this has been verified by the current and previous studies [
25,
30].
3.1.2. Cartesian vs. Delta: Influence of Motion Scheme
The current study did not reveal either significant advantages or drawbacks of both the Cartesian and delta motion systems. Delta printers are more sensitive to increased printhead weight, thus they often feature Bowden extruders, which can be treated as a drawback. However, the Bowden extruder with shorter tube used on the WASP machine demonstrated results close to the direct extruder on PRUSA.
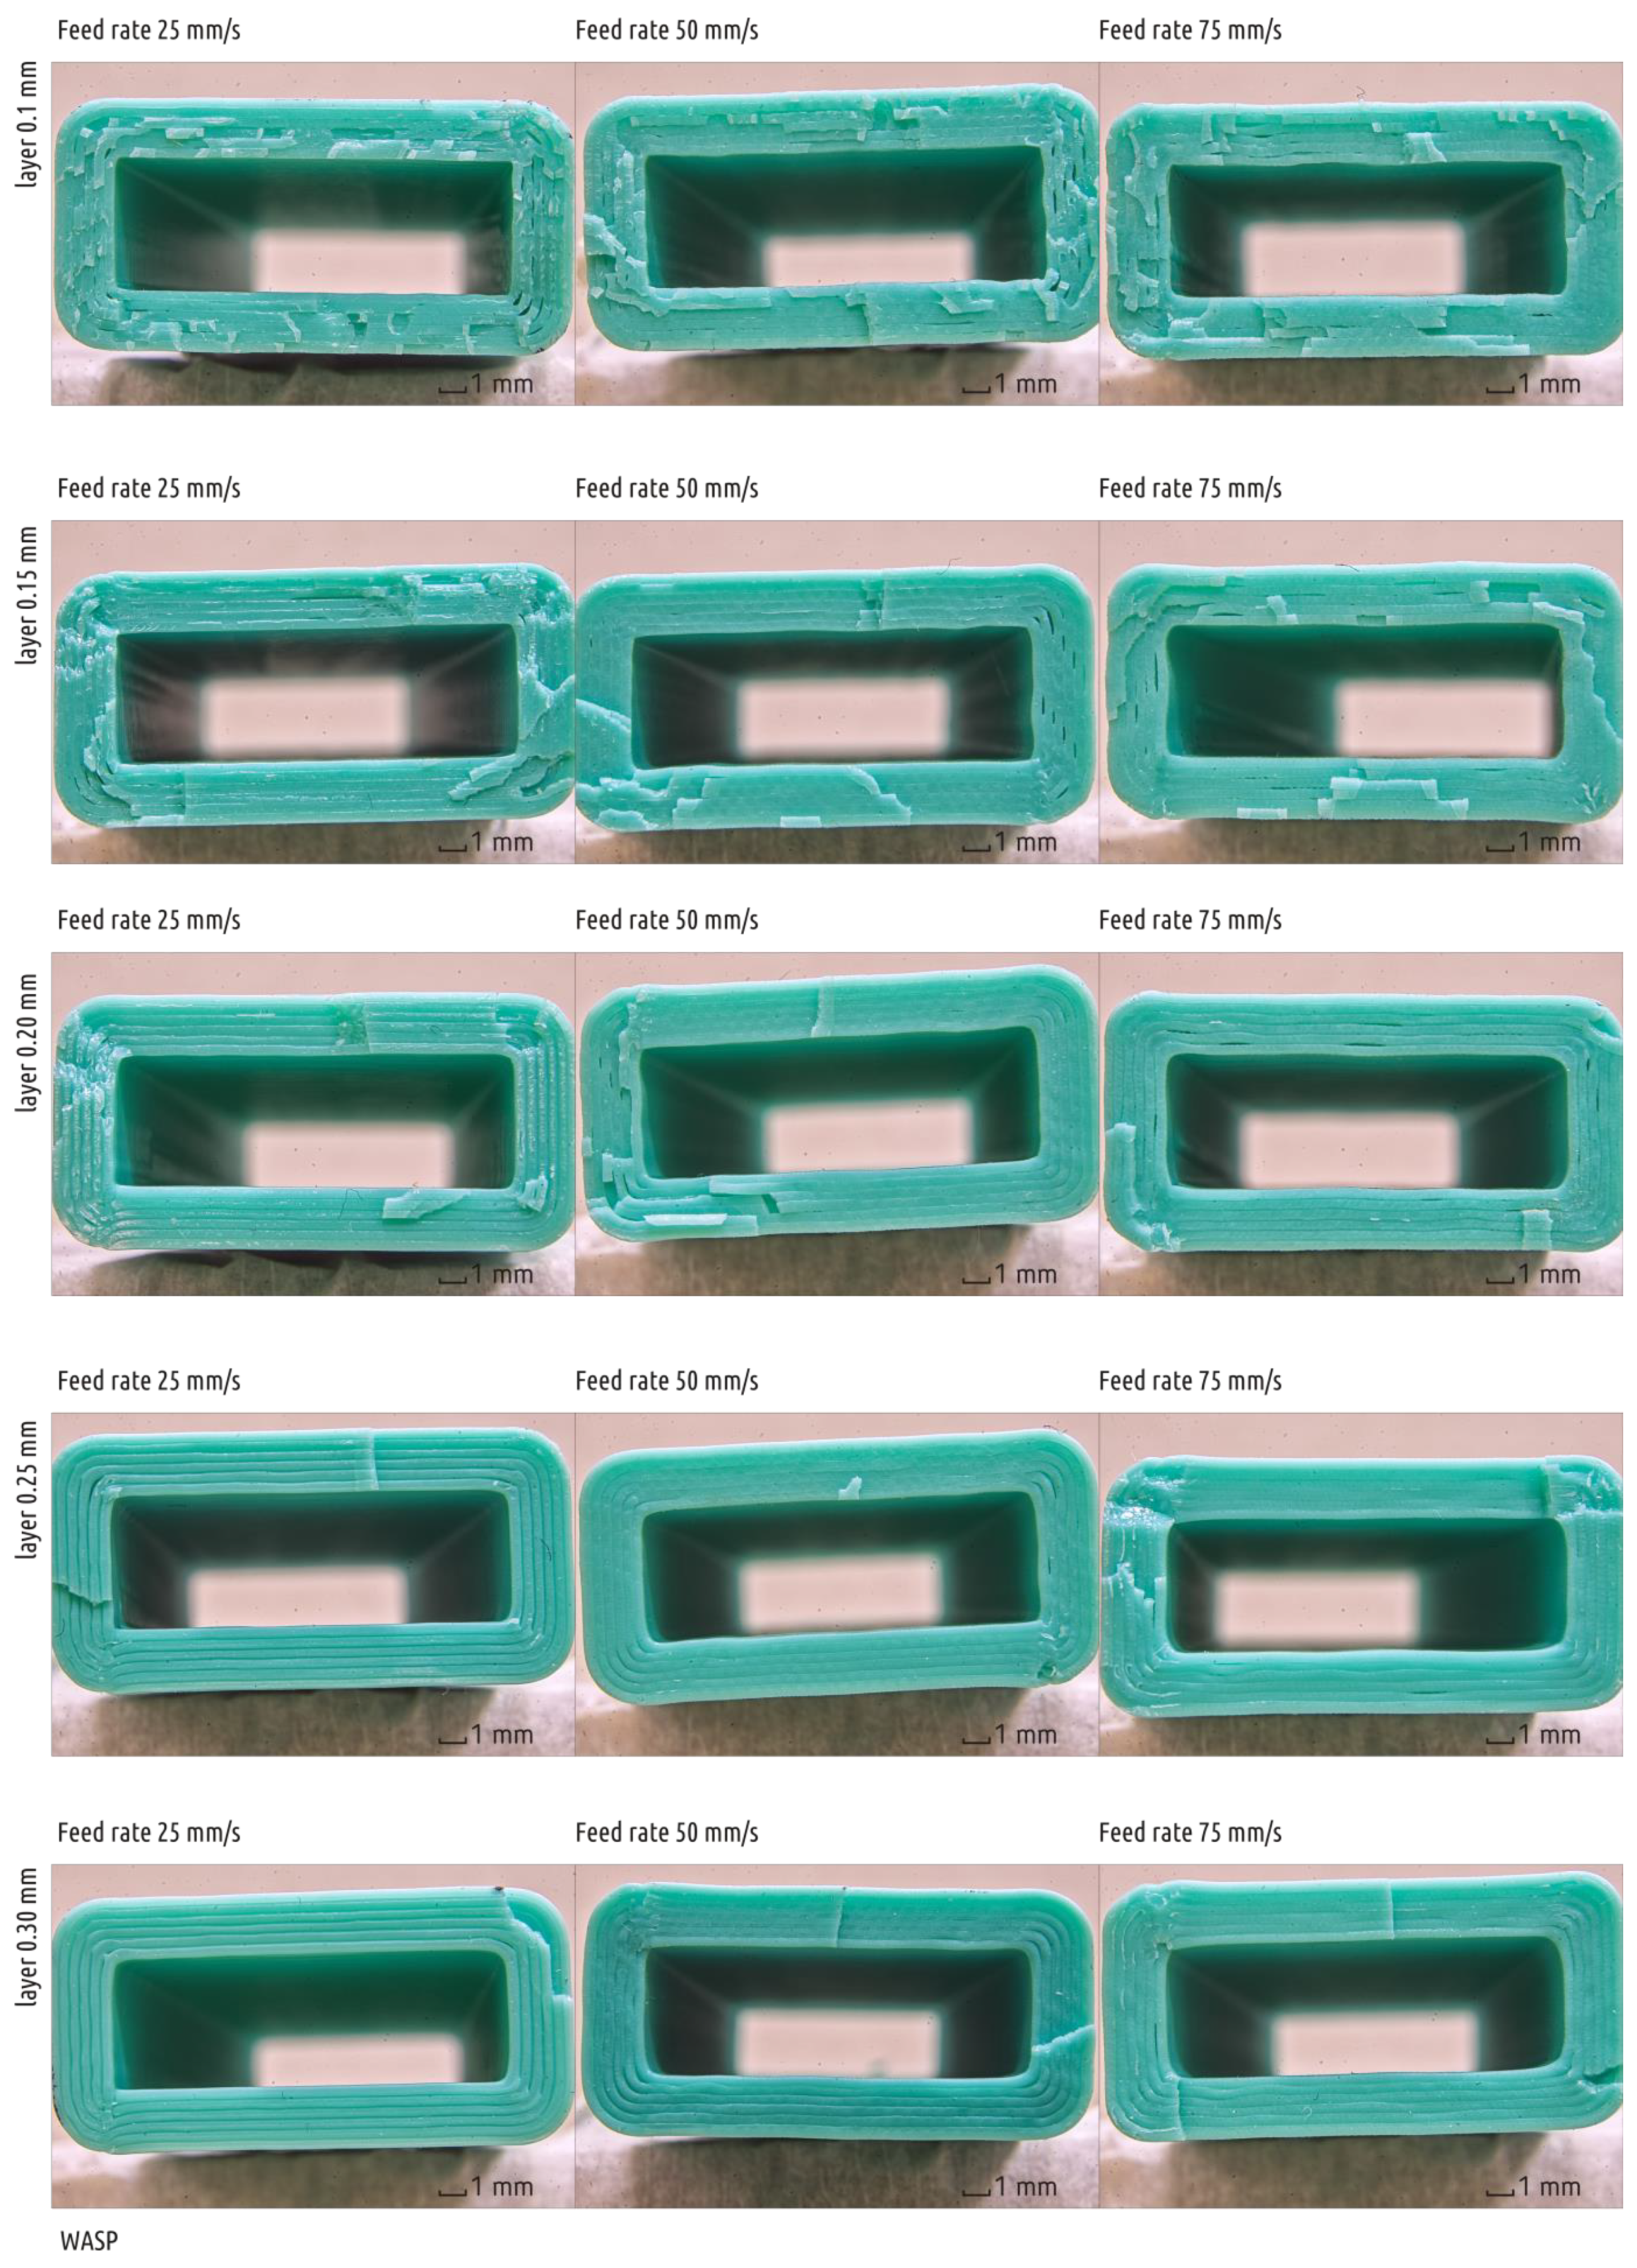
Considering printing stability and sample surface quality, the following can be said. The coordinate system has a smaller influence on the print quality than the implementation accuracy, especially at higher printing speeds (above 30–40 mm/s). The PRUSA with the Cartesian coordinate system uses the bed moving along the Y axis, resulting in significant vibrations and oscillations of a sample having a high height to bed surface projection ratio while printing at a relatively high speed. This leads to affluxes and other imperfections on the surface, and even grave defects may occur. The delta-shaped WASP printer also has significant vibrations at 75 mm/s speed, thus careful bed setup was required to ensure that the printing sample was not torn away during printing. It also seems that high-speed printing on the WASP machine is not only limited by the mechanics, but by the limited performance of an 8-bit controller that recalculates linear motion in Cartesian coordinates into gentle movement of all three motors. The 3DQ printer with a similar mechanical scheme features a more powerful 32-bit controller, however, high linear feed rates were spoiled by poor linear guides and carriages with loose coupling as well as an arguable hot end holder that allows the nozzle to oscillate. Finally, the Cartesian UM2 contains a bed that is moved along the Z axis, while the lightweight printing head has a similar motion mechanism along both the X and Y axes. There were no stability issues even at high printing speeds. However, high-speed printing (75 mm/s) was limited to layers of 0.1 and 0.15 mm, only due to limited extruder performance.
3.1.3. Thick vs. Thin: Filament Diameter Influence
There was no significant difference discovered for filaments of two popular gauges. The only machine using 2.85 mm filament, the UM2, exhibited results very close to 3DQ. The latter also features a Bowden-type extruder, but consumes the 1.75 mm filament. Further research is needed to set up an experiment involving two similar machines with the only difference being the consumable filament gauge.
3.1.4. Open vs. Closed: Printer Enclosure and Cooling Conditions
Even with the same temperature values set for the nozzles and heated beds and maximum cooling fan speed, there was some variance in the sublayer temperature registered, which has a very high influence on the layers’ cohesion strength [
25].
Depending on layer thickness and printing speed, the sublayer temperature varied between 48 to 54 °C on the UM2 machine, with the printing area enclosed from four sides. Printers with an open setup featured lower sublayer temperatures: 34 to 39 °C on PRUSA and 35 to 40 °C on the 3DQ machine. This difference could be explained by a slightly more efficient cooling subsystem in PRUSA.
It can be stipulated that the partially enclosed UM2 machine has certain advantages over open ones (e.g., PRUSA). Therefore, the maximum strength value obtained on UM2 was almost equal to the maximum value for PRUSA. While PRUSA had significantly better extrusion efficiency, perhaps, the higher sublayer temperature compensated for the lack of extruded material.
Finally, the fully enclosed WASP machine exhibited sublayer temperatures in the range of 35 to 45 °C, which is more typical for open type printers. This could be explained by the design and power of the cooling system. Unlike all other machines considered, there is a single cooling fan that pumps the air through the hot end radiator onto the printed part on two sides of the nozzle. With a power consumption of 0.8 A at 12 V, at full speed, it seems that the fan in WASP provides the most intensive airflow of all the machines considered.
3.2. Building and Testing a New Machine
One of the conclusions drawn from the first stage results is that none of the machines considered is perfect. In order to approach the ideal, a custom-made machine was created that would only include the strong sides and avoid the weak ones. As a platform, an existing Ultimaker 2 printer was sacrificed (as opposed to building the perfect machine from scratch). As pointed out above, an original UM2 featured the best motion accuracy and fluency. Its only (but significant) problem is the decrease in the extrusion efficiency with increased flow rate values. Replacing the original Bowden extruder with a direct one will obviously dramatically increase the effector (printhead) weight, which in turn is in conflict with the main advantage of the platform, the quick, accurate, and fluent movement. It was thus decided to design a suspended extruder similar to the one found in the WASP printer.
It should be noted that the suspended extruder with a relatively short Bowden tube is not an exclusive feature of WASP 3D printers. The first occurrence of a similar solution named the “flying extruder mod” was found at the RepRap forum as a record made by a user with the
ähM_Key nickname [
47]. The author aimed to extend the speed limitations of FFF technology by using a lightweight effector together with a short guiding tube. A well-known negative feature of Bowden-type extruders is the need to apply relatively long retractions to avoid molten filament dripping from the nozzle during the moves. There are several implementations of a flying extruder used on delta printers; however, we have not found any open source applications of such a scheme on printers with Cartesian geometry.
The hot end for the new machine was E3D V6 1.75 mm [
48] (E3D-Online Ltd., Chalgrove, Oxfordshire, UK); the same model used on PRUSA and 3DQ printers considered in the current paper. It was mounted on UM2 shafts using an open-source part [
49], printed on PRUSA with black PET-G filament (REC company, Moscow, Russia). The cooling fans (one for the hot end radiator and two for the printed part) of the new hot end assembly were taken from the original UM2 machine. The filament supply mechanism was a Titan Extruder (E3D-Online Ltd., Chalgrove, Oxfordshire, UK) [
50] equipped with 1.75 mm Bowden adaptor. The mechanism was suspended over the hot end effector on a specially designed frame [
51] and four rubber strings (
Figure 9), similar to the three-string suspension in WASP. UM2 firmware was not altered, but the E-step parameter was set in accordance with the installation manual [
52] from the feeder supplier to 837 steps/mm. Flow parameter for PLA filament was set to 95% in the material setup menu in order to achieve extrusion efficiency (in fact, sample weight) similar to figures on the WASP and PRUSA machines. The hot end design allowed to check the adequacy of the built-in temperature sensor with the same nozzle with the thermocouple, as performed earlier for UM2, PRUSA, and 3DQ. The results are shown in
Table 7; the difference between the readings of the built-in temperature sensor and thermocouple is insignificant and can be ignored.
The new printer can be named as the Ultimaker 2 with suspended 1.75 mm extruder, or UM2SE in short. This new printer was used to obtain a new set of samples that was later tested following the same routine as described in the first chapter of the research. There were no issues with sample stability or any visual defects occurring across the whole range of layer thickness and printing speed values used. The test results are presented in
Table 8 and plotted in
Figure 10.
The maximum average sample strength value obtained with the new printer reached 65.8 MPa. This significantly exceeded the values for the samples from the first stage, which were obtained with the commercial printers. As it can be seen in the chart (
Figure 11), the new printer did not suffer from extrusion resistance, and the samples’ mass remained constant regardless the flow rate setting. The new printer also exhibited noticeable increase in the sublayer temperature (
Figure 12) when compared with the stock UM2. This effect took place due to the better extrusion efficiency and changed cooling conditions: the suspension system increased the printer case height and might have contributed to better heat retention.
There were no stability issues detected, and the correlation between printing speed and sample strength was different than for the other printers previously considered. While PRUSA and WASP make weaker parts as the motion speed increased, UM2SE exhibited the opposite: in the range of speeds chosen, the faster the part was printed, the higher the strength. This phenomenon can be explained by the reduced interval between printing the individual layers and, thus, increased sublayer temperature (
Figure 12). Macro images of the fracture surfaces of samples obtained with the UM2SE are shown in
Figure A5.
3.3. Influence of Technological Parameters with Respect to Hardware Setup
3.3.1. Influence of Printing Speed
In general, increasing the printing speed resulted in a decrease in sample strength for all machines considered in the first stage of the study. Multiple reasons behind this effect might be the cause. There was a single hardware setup (UM2 with 0.6 mm nozzle) considered in a recent study [
25] where it was shown that printing speed had a dual effect on bonding strength. On one hand, reducing the layer printing time results in a higher sublayer temperature, which has a positive effect on sample strength. On the other hand, extrusion efficiency is reduced, which adversely affects the strength. The current study resulted in a different situation. First, printing with 0.4 mm nozzles did not result in significant sublayer temperature variance, thus, the positive effect of increasing printing speed was close to zero. Second, a decrease in extrusion efficiency along with increased speed was registered only for Bowden-type extruders. Finally, increasing the printing speed may cause issues with 3D printer motion accuracy. Only the UM2 and the UM2SE machines had no issues with positioning accuracy with increased printing speed. All other machines had one or another issue, although they were different depending on the mechanical design (sample oscillations on a moving heated bed on PRUSA; nozzle colliding into the sample on delta printers, i.e., WASP and 3DQ). These have a negative effect on sample strength.
The macroscopic photographs (
Figure A1,
Figure A2,
Figure A3,
Figure A4 and
Figure A5) of the fracture surface may explain the influence of printing speed on sample strength. Samples obtained on PRUSA with the same layer height with linear motion speeds of 25 mm/s and 50 mm/s exhibited similar properties as well as images of the breakage (see
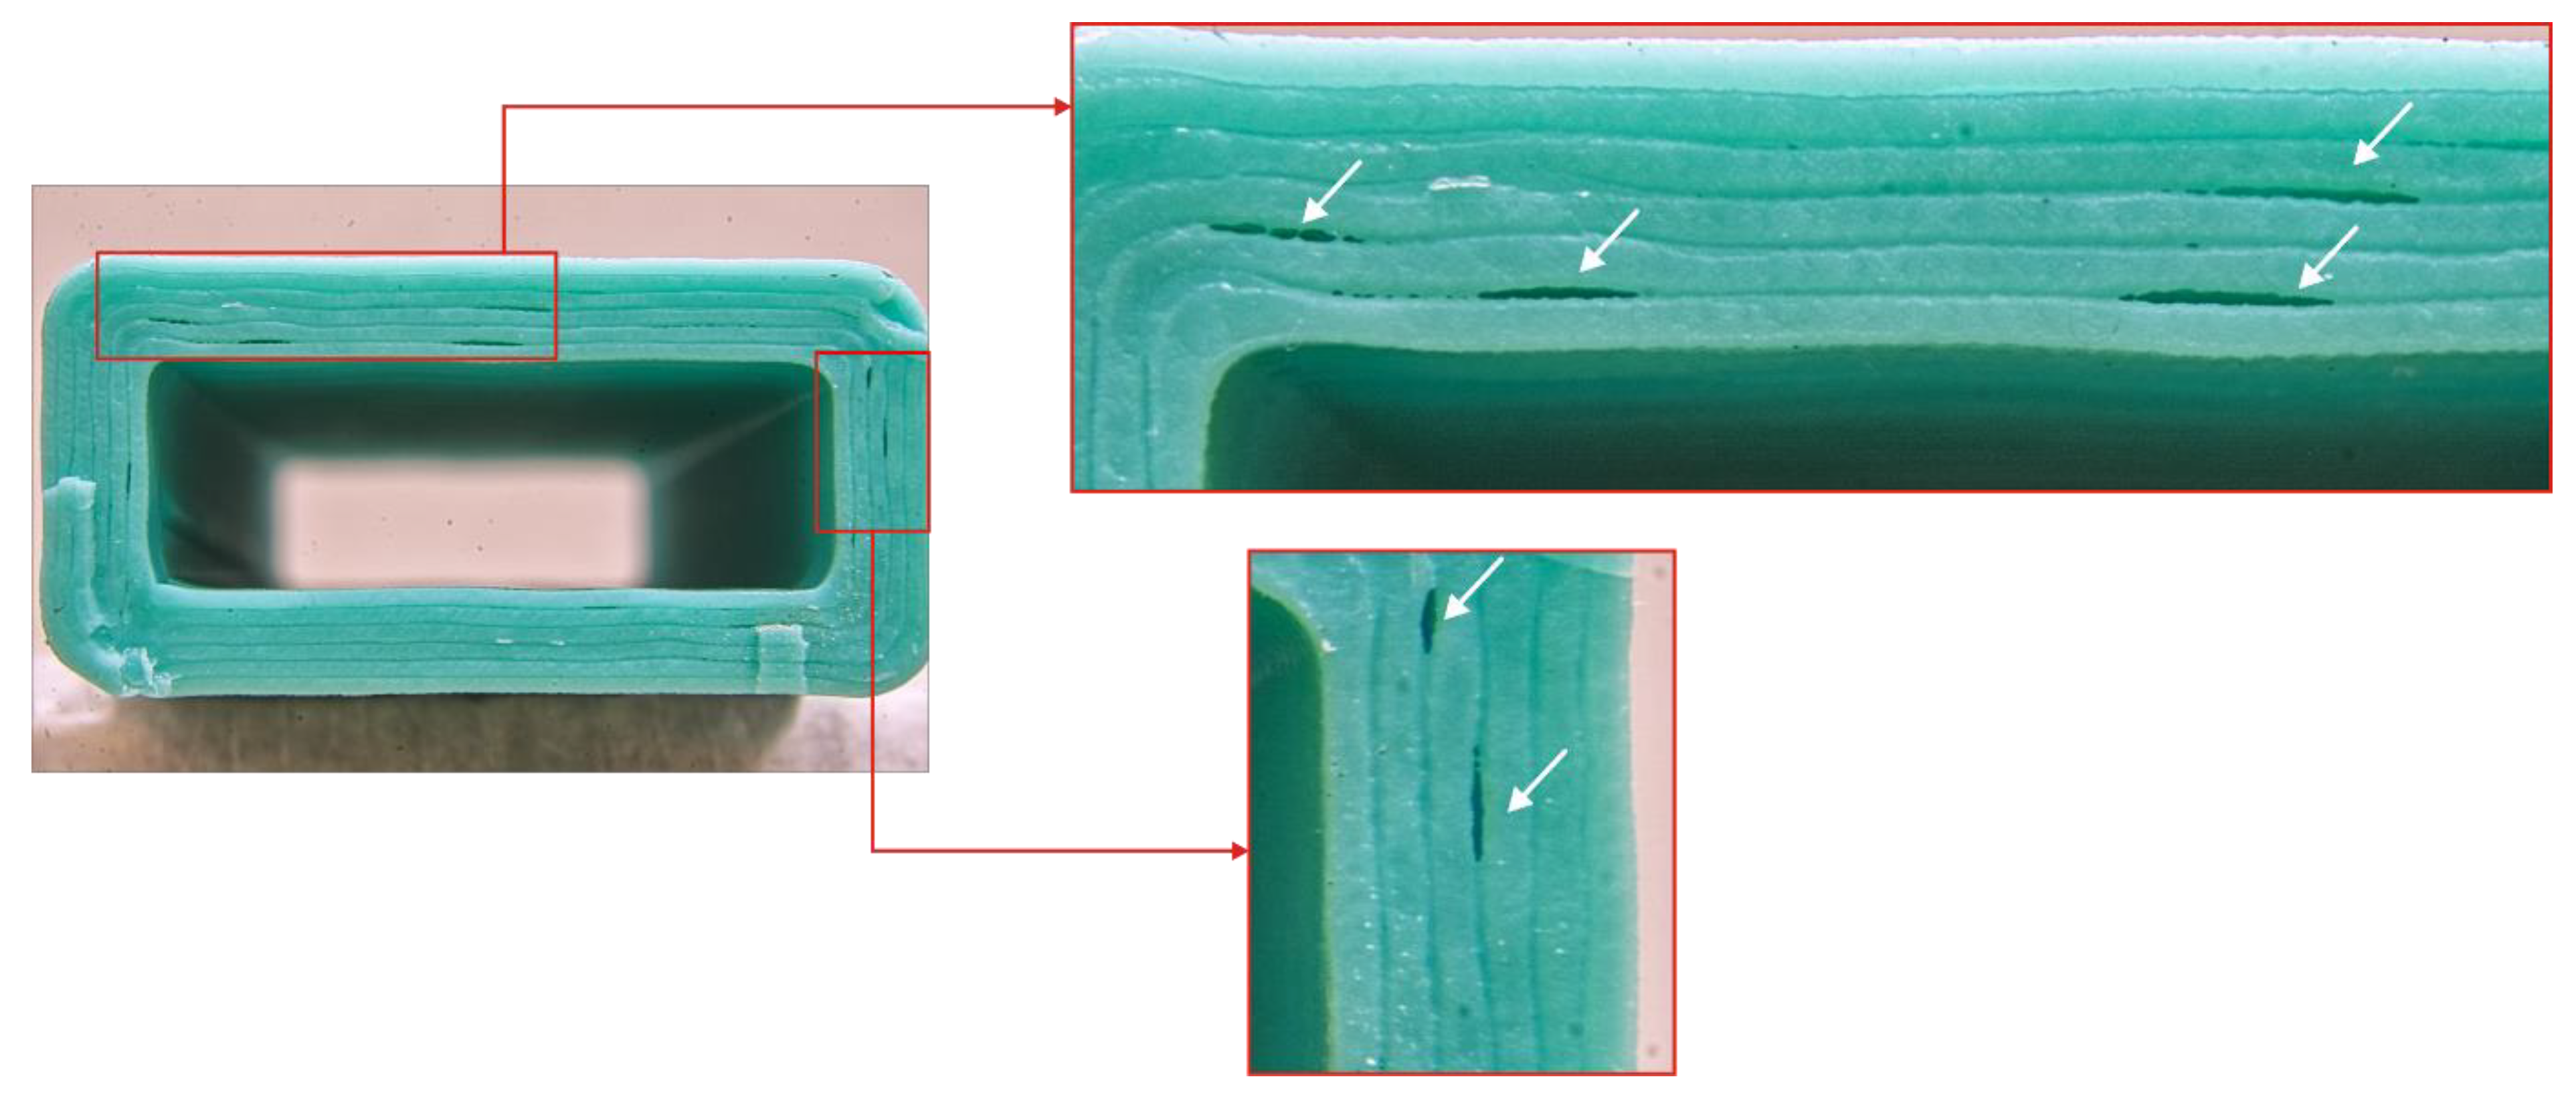
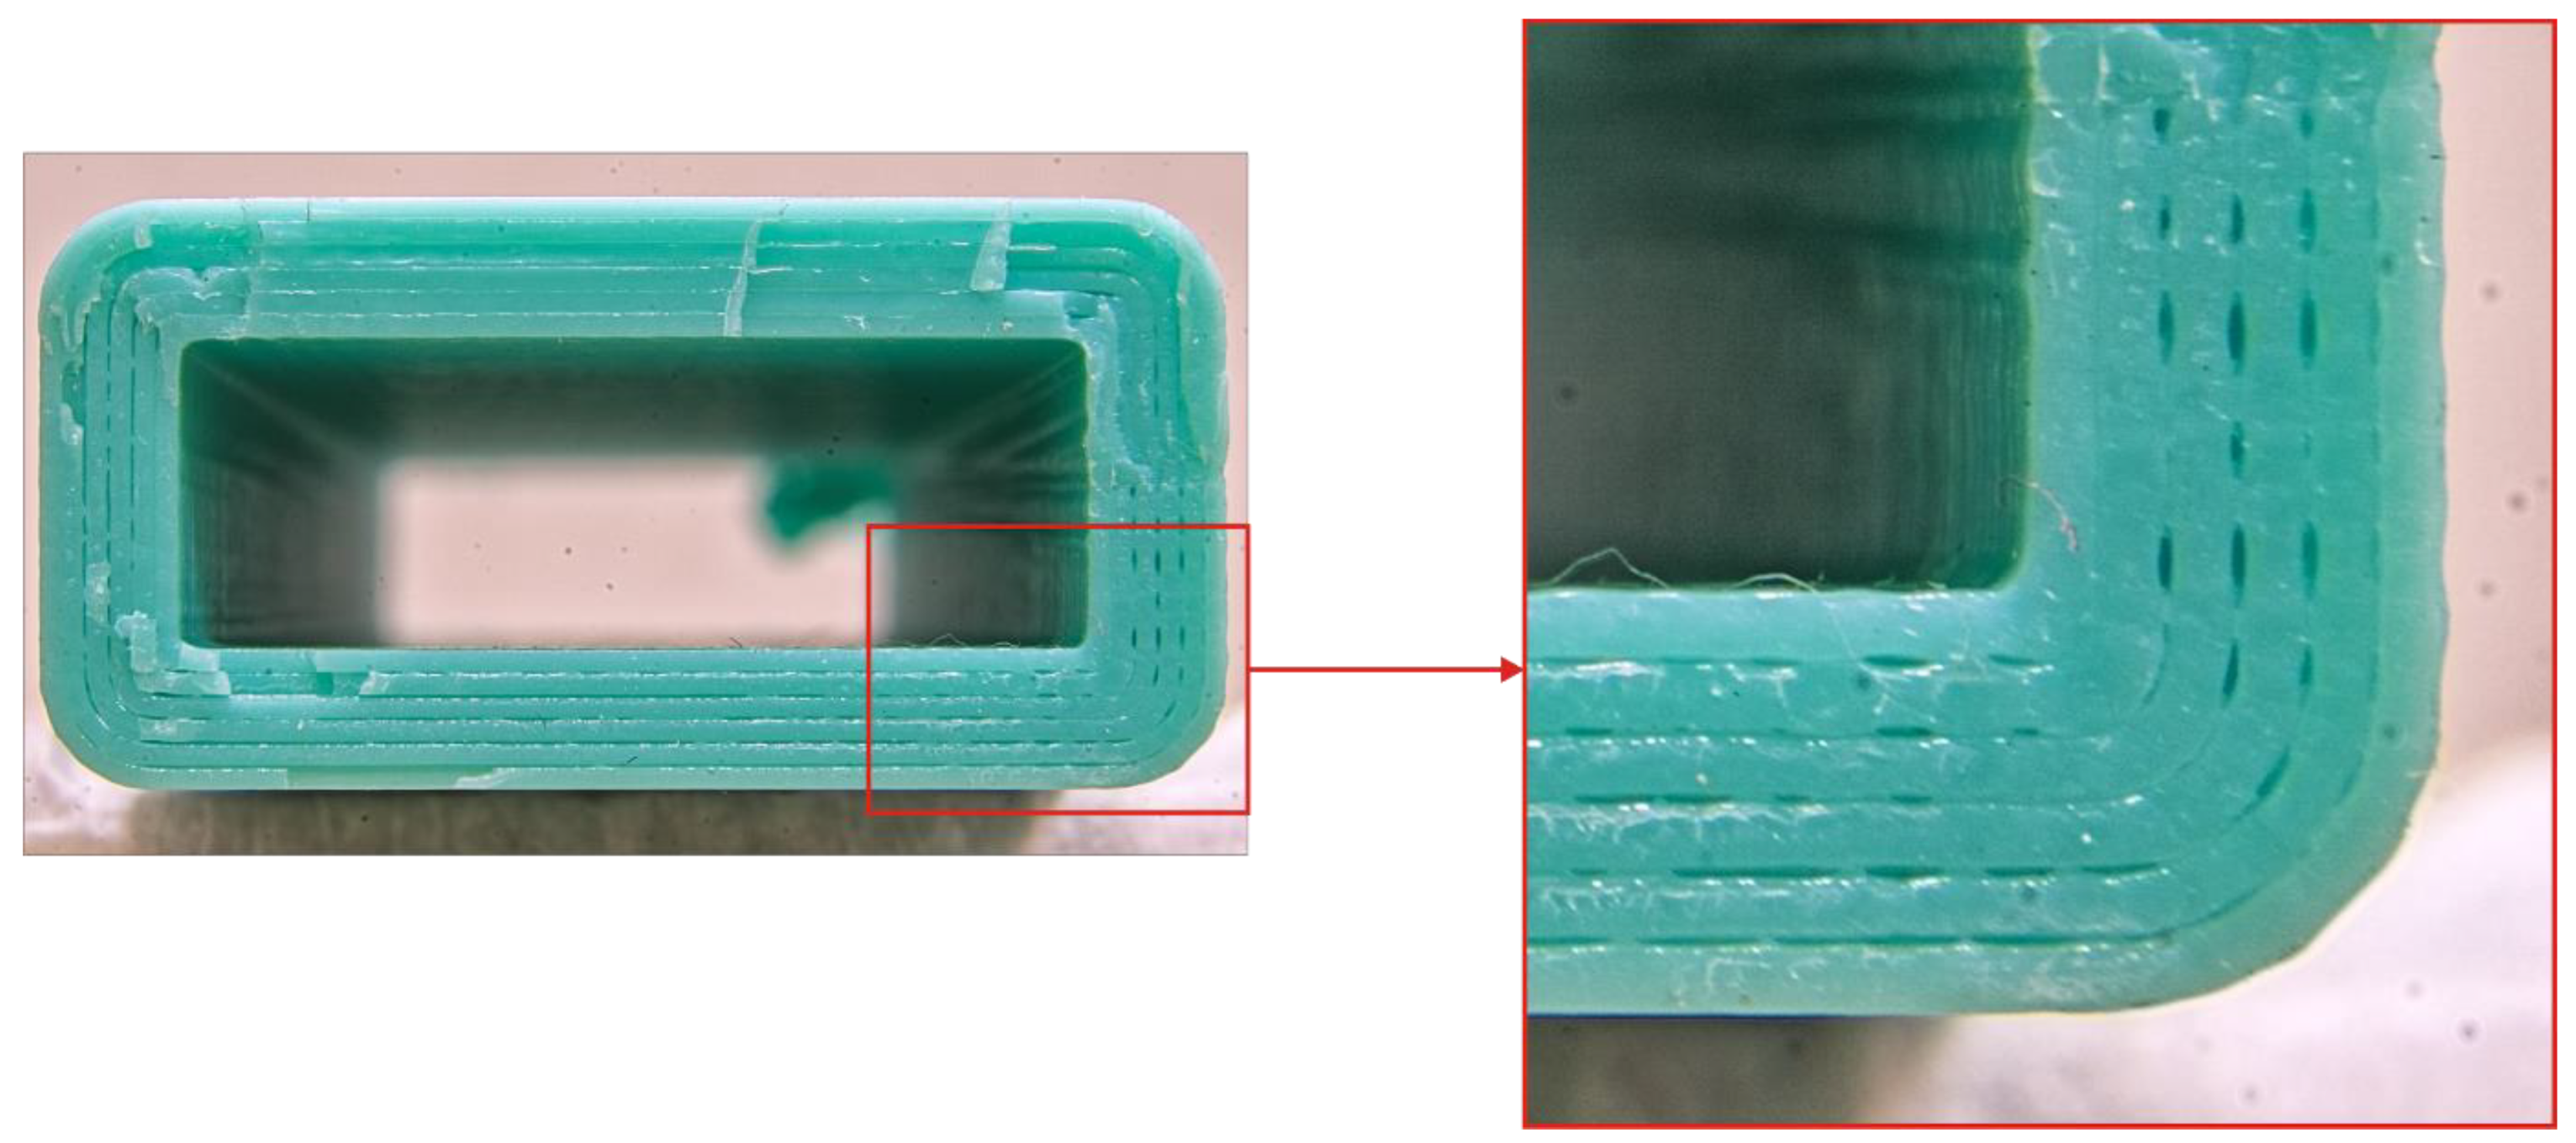
Figure A3). At the same time, the fracture surface of the samples printed at 75 mm/s had specific defects of intermittent voids between the polymer threads. These might be caused by sample oscillation during the process. A section of the thread seems to have shifted along the Y axis (
Figure 13), thus forming a void at the boundary with the neighboring thread.
These deviations in thread geometry will adversely affect the sample strength, which was observed in the current study where increasing the printing speed to 75 mm/s on PRUSA significantly reduced the sample strength.
The WASP exhibited noticeable strength reduction when printing speed was raised from 25 to 50 mm/s, and the difference reached 50% at 75 mm/s. The analysis of zoomed images uncovered printing defects similar to those seen on PRUSA even at 50 mm/s, and further speed increases made them even graver. Unlike PRUSA, the thread was skewed along its full length, which was mostly noticeable on straight chunks (see
Figure 14).
These defects might be caused by the hardware specificity of the WASP printer. It is controlled by an 8-bit controller that might not have enough performance to calculate the motions of a delta printing system. While enough accuracy was achieved with a 25 mm/s linear movement rate, higher motion speeds incur a higher computational cost that is not available, and the planner strategy might sacrifice accuracy for overall speed. Thus, the calculations are performed with reduced accuracy and the movement is jittered.
Finally, the samples obtained on the custom designed machine (UM2SE) exhibited distorted and smoothed edges on sample breakage surfaces (
Figure A5), but the polymer threads remained parallel to each other. It can be concluded that there were no issues with the sample stability added. Thus, increasing linear motion speed in the range considered positively affected the sample strength. The faster the sample is printed, less intervals occur between printing the adjacent layers, so the higher the sublayer temperature becomes, the stronger the sample.
It should be noted that the effect of strengthening the sample is caused not by increased printing speed itself, but by increased sublayer temperature. If multiple parts are printed at the same time, or the layer cross section has a larger area, the effect of increased printing speed will be different.
3.3.2. Layer Thickness Influence with Respect to Hardware Setup
The distinctive feature of printers with a Bowden-type extruder is the noticeable and sharp drop in unit strength when layer thickness is increased, correlated with reduced extrusion efficiency. This phenomenon is well illustrated by SEM scans of cross-sections of broken parts printed with different setups in [
30] as well as breakage surface images obtained in the current study. It can be clearly seen that the voids are becoming wider when increasing layer thickness both on UM2 (
Appendix A Figure A1) and 3DQ (
Figure A2). Thus, the machines with a common long Bowden tube exhibited a decrease in sample strength when the layer thickness was set to higher values. This fact agrees with the previous study devoted to the UM2 machine [
30].
The picture, however, is less clear for printers with a direct extruder (PRUSA) and with a short Bowden tube (WASP, UM2SE). These machines maintain a constant extrusion efficiency rate across the whole range of layer thicknesses and feed rates considered. Thus, increasing the layer thickness did not result in increased voids volume, except for the thickest layers of 0.3 mm, which exhibited the lowest strength values. Even with an extrusion efficiency of 1.0, the threads forming the sample will not be ideally rectangular in cross-section (with sides equal to the layer thickness and nozzle diameter, respectively), but still retain the barrel shape, being squeezed between the nozzle and the sublayer. The morphology of the layer boundary is detailed in [
53,
54]. Thus, the FFF printing process inevitably results in the formation of voids and cavities at the boundaries of individual threads, and the projection of these voids onto the XY plane grows in area when the layer thickness approaches the nozzle diameter. The fracture surface images (
Figure A1,
Figure A2,
Figure A3,
Figure A4 and
Figure A5) show that increasing the layer thickness from 0.25 to 0.30 mm is accompanied by a significant increase in the voids’ width. Thus, the minimal values of tensile strength for the samples printed with the thickest layers considered are expected for WASP, PRUSA, and UM2SE.
At the same time, the dependency of the layer thickness in the range between 0.1 and 0.25 mm on sample strength is not clear for PRUSA, WASP, and UM2SE. The difference in the strength of samples printed with 0.15 to 0.25 mm layers on PRUSA is not statistically significant. The fracture surfaces also do not feature visible differences. However, the samples printed with 0.1 mm layers contained specific defect patterns that might be caused by sample oscillation and collisions between the sublayer and the nozzle (
Figure 15). With other layer height values, the gap between the nozzle and the sublayer is larger and such collisions do not occur.
A similar situation also took place with the WASP printer. Despite the bed being fixed, oscillations along the Z-axis occurred when the nozzle was moved in the XY plane. Such oscillations become critical when the layer height is low and the nozzle travels close to the sublayer. The fracture images (
Figure A4) demonstrated much larger void areas with samples with a 0.1 mm layer height than with other values.
Finally, UM2SE exhibited a statistically insignificant difference in the strength of the samples printed with layer thicknesses between 0.1 and 0.25 mm. The only outlier observed occurred at 50 mm/s with the layer set to 0.25 mm.
For all machines considered that provided a stable extrusion efficiency (PRUSA, WASP, UM2SE), the maximum strength values were obtained with layer thickness of 0.15 or 0.2 mm.

 ,
, 


