3.1. DSC
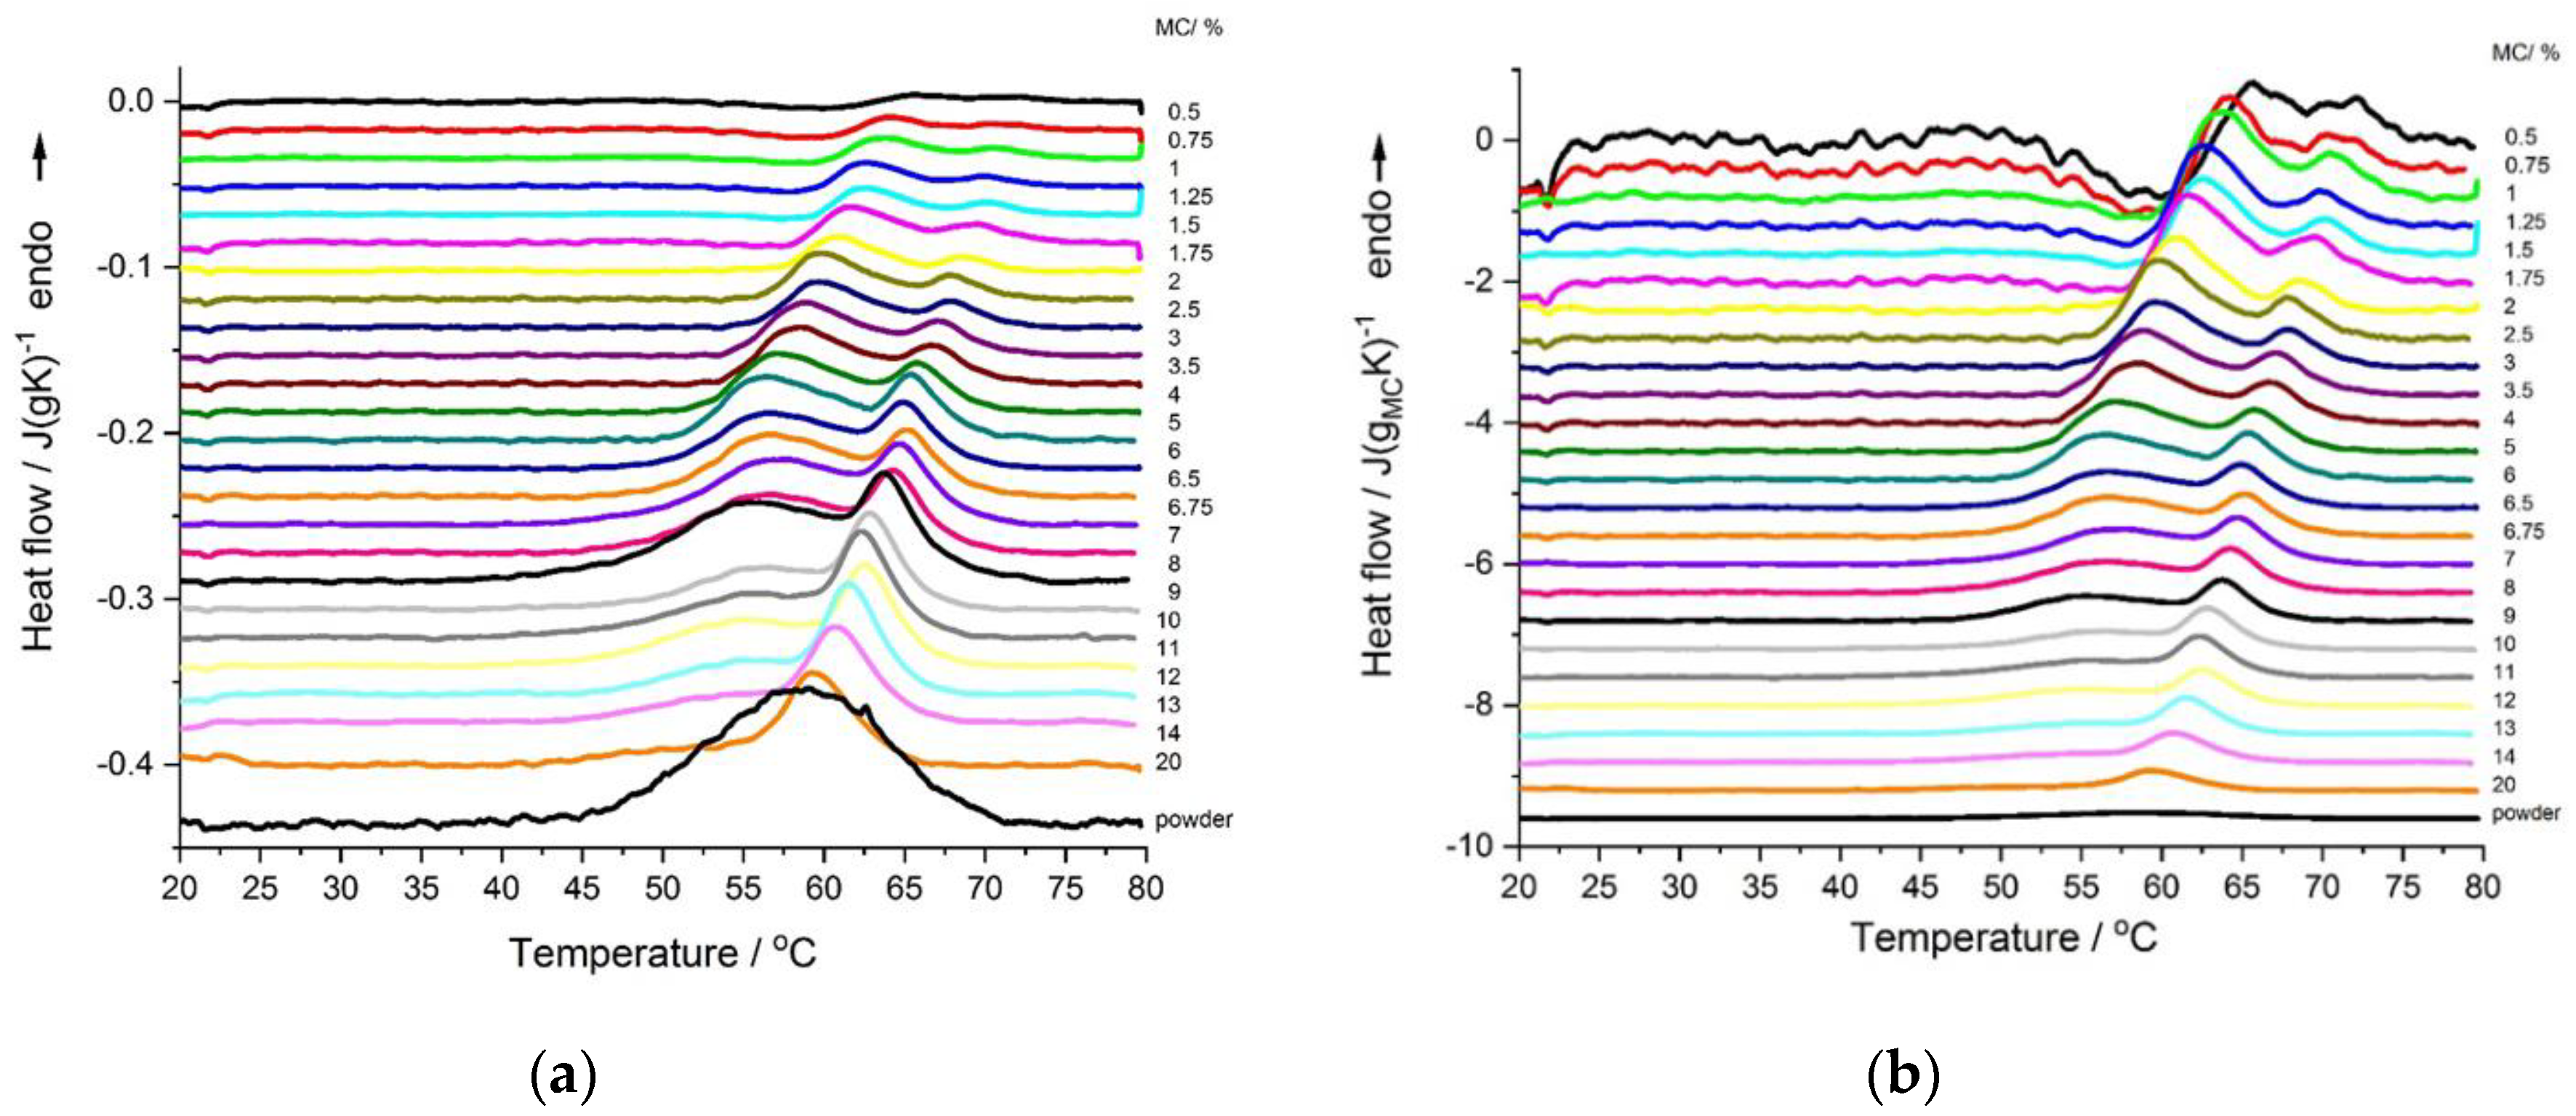
The DSC heating thermograms of MC solution showed quite complex thermal behavior and complex changes of the effects with varying MC concentration. For better understanding of the effect of the MC content on the thermal effects, all thermograms are presented in
Figure 1a,b, as normalized to sample weight and normalized to MC weight, respectively. Except for the MC powder, all thermograms generally presented two endothermic effects. Both effects were more evident for low MC concentrations (0.5–8 wt.%). The low-temperature effect dominated over the high-temperature one, as far as the MC concentration decreased. It was seen that both endothermic peaks shifted to lower temperatures with increasing MC concentrations, (
Figure 1) with the low-temperature peak becoming broader, which was particularly evident at MC concentrations of above 8 wt.%. (
Figure 1a). MC in the powder form (~100 wt.%) only showed one broad endothermic peak (
Figure 1a).
In
Figure 1b, it could also be seen that, for the lowest MC concentrations, i.e., <wt.%, there appeared an additional effect, which was exothermic and preceded the low-temperature endothermic effect. The exothermic effect became stronger with a decrease in the MC concentration.
Based on the literature [
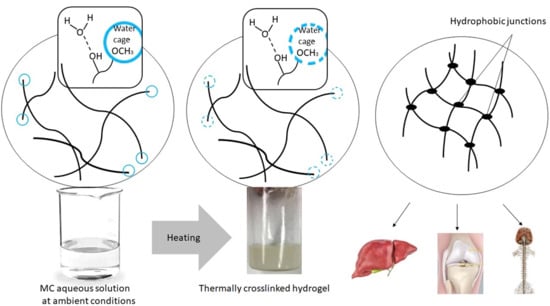
16], we interpreted that the low-temperature endothermic effect was due to the destruction of the water cages and the high-temperature endothermic effect was due to the MC thermal crosslinking. For the exothermic effect observed in concentrations <2 wt.%, we interpreted it as due to the formation of water cages around methoxy groups. A more detailed explanation is given below.
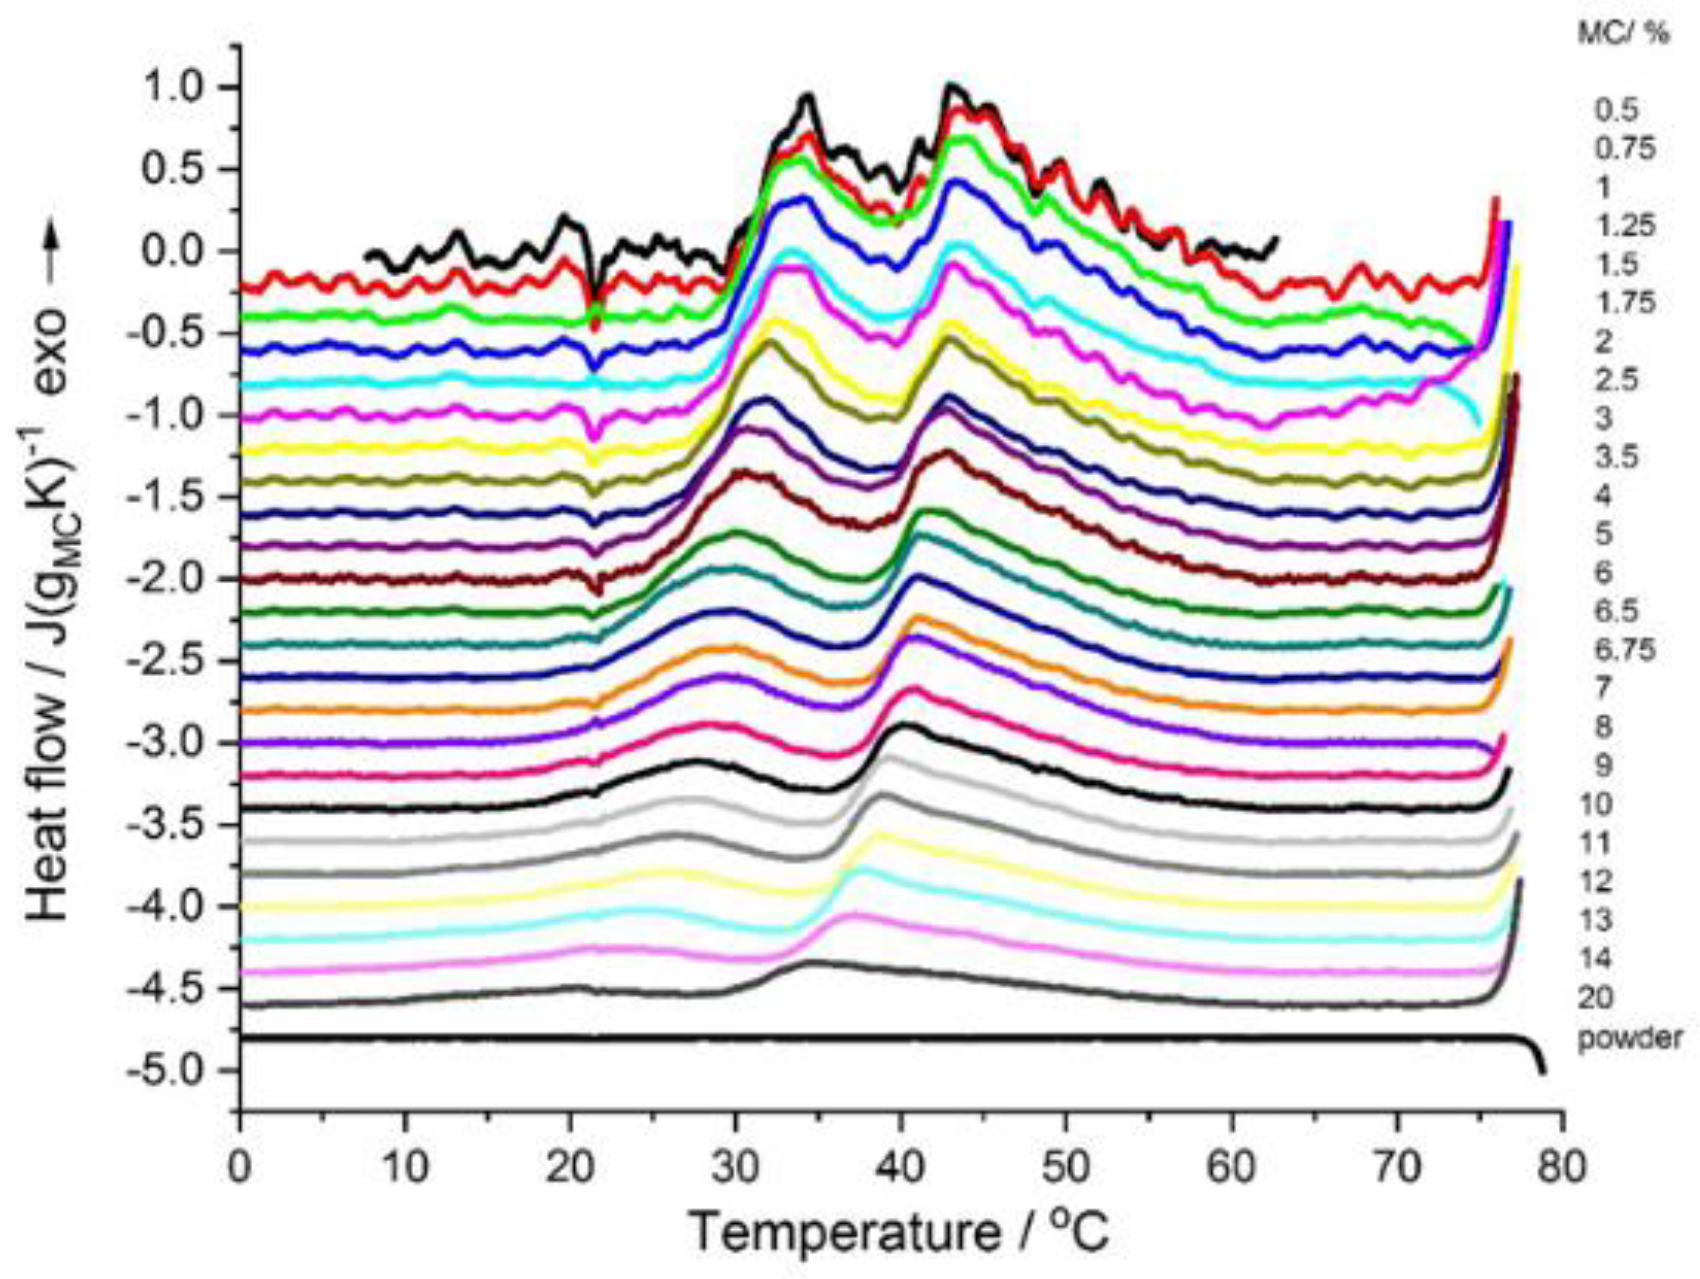
The DSC cooling thermograms showed two exothermic effects (
Figure 2), a high-temperature effect dominating over the low-temperature one. These effects gave evidence of the reverse processes, i.e., first decomposition of the three dimensional hydrogel network followed by water “incorporation” into the polymer structure. Both effects appeared in the temperature range of 30–55 °C. The most significant finding here was that the MC physical crosslinking was fully thermoreversible. Additionally, for MC concentrations <2 wt.%, the reverse effect of the destruction of water cages, which should be endothermic, was not observed, however, the occurrence of this process was evident from the repeating appearance of the exothermic peak upon a subsequent heating scan. Detailed analysis of the cooling scans would provide more insight into this question, however, the current study was devoted to the crosslinking kinetics and the cooling scans were not studied in detail. Additionally, it might be noted that, for the MC powder, the crosslinking was non-reversible as, upon cooling and subsequent heating scans, no thermal effect was observed (
Figure 2).
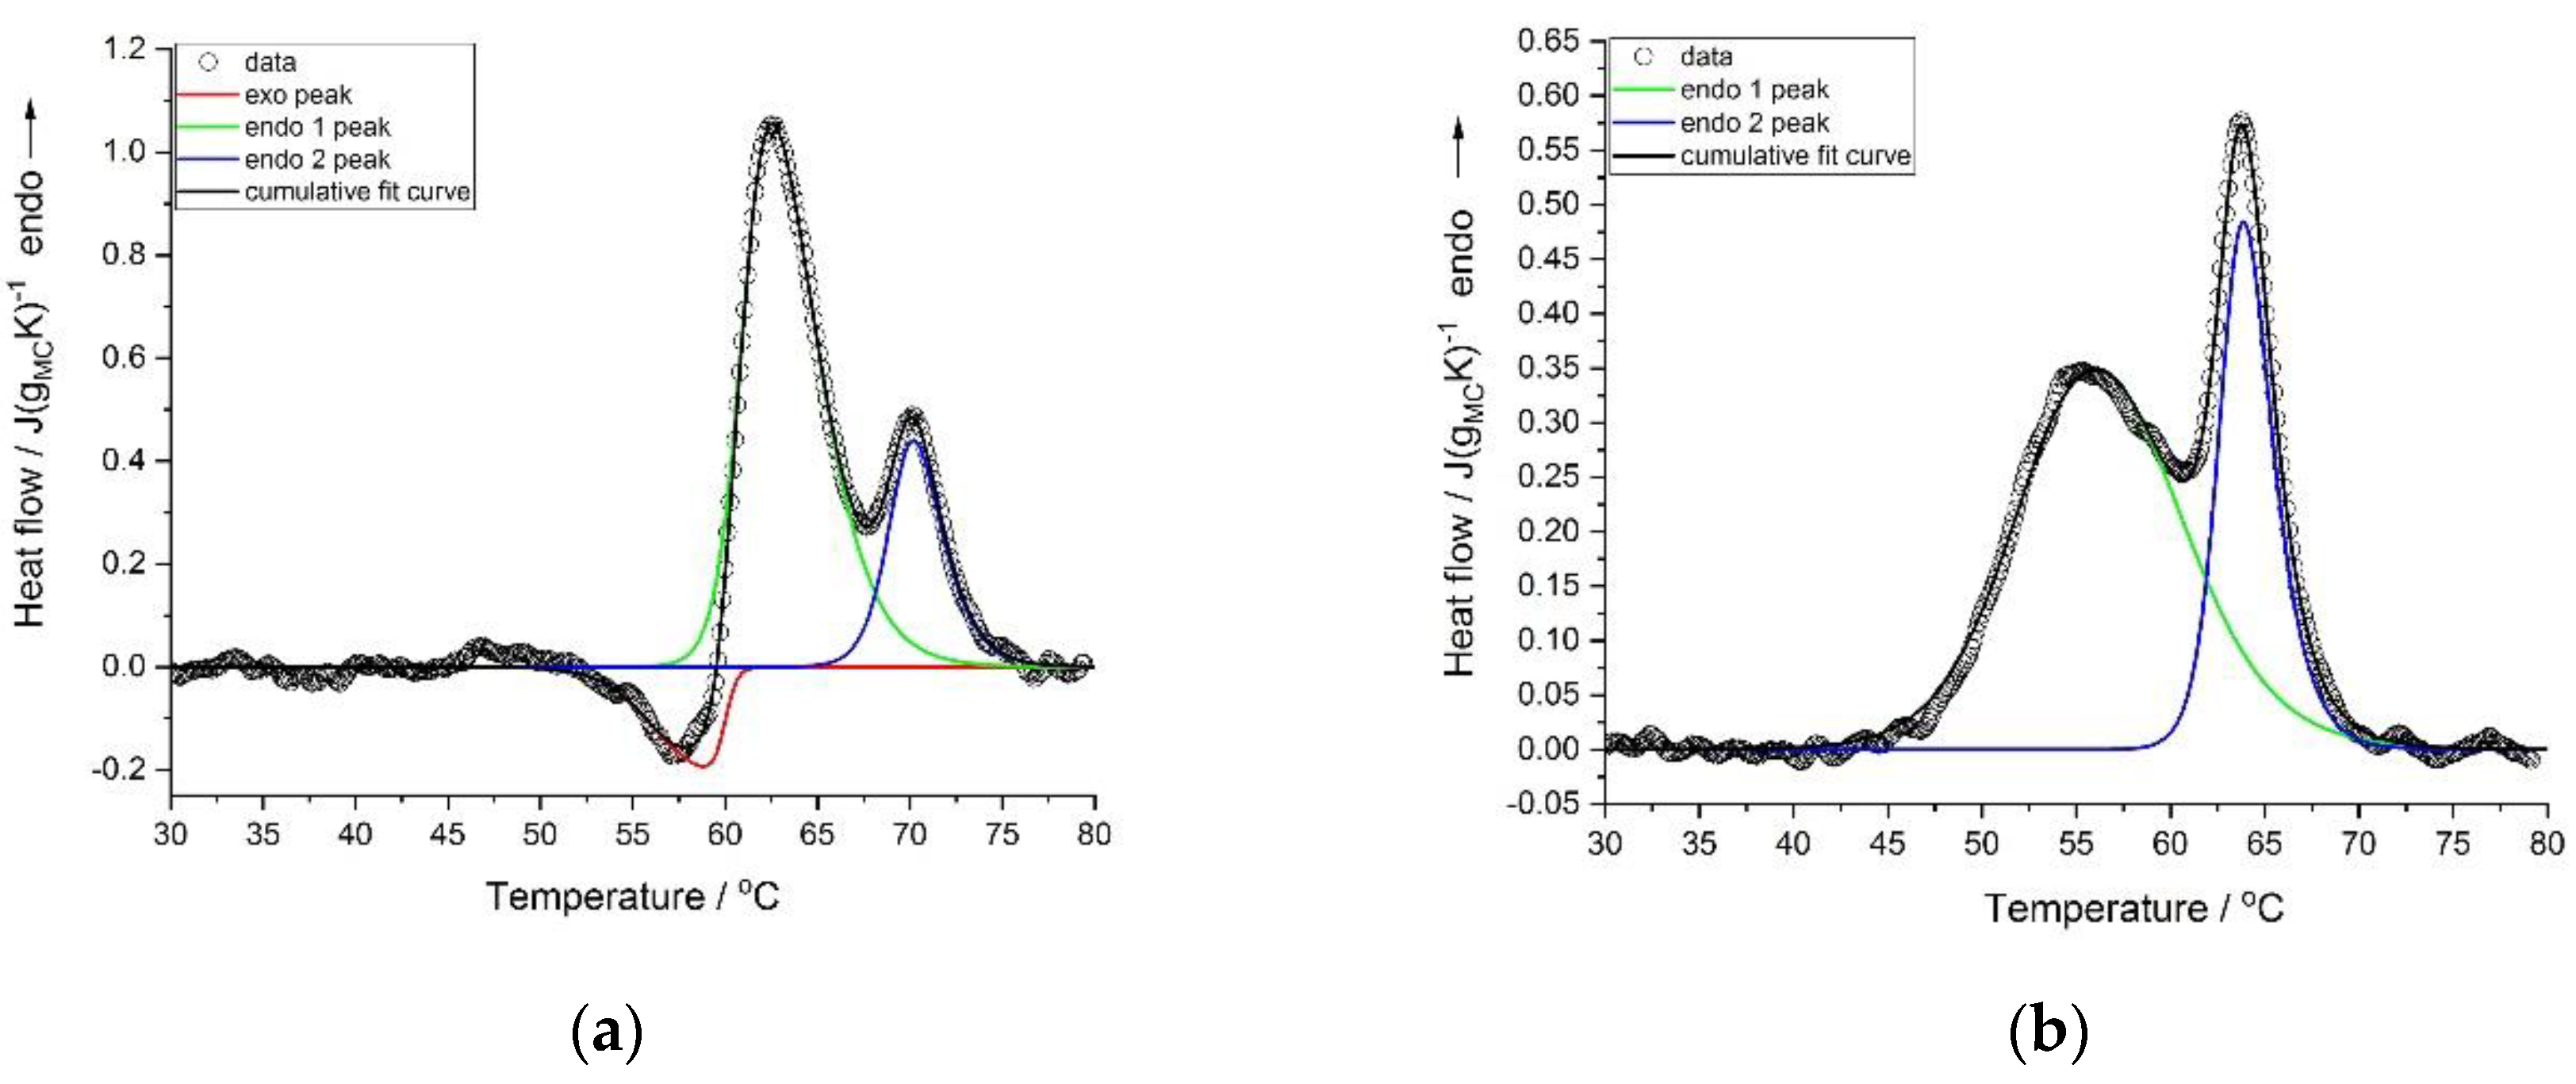
Deconvolution of the thermal effects was performed using the asymmetric double sigmoidal function. The examples of the deconvolution of the heating scans with and without the exothermic effects are presented in
Figure 3a,b, respectively.
Detailed analysis of the deconvoluted peaks provided quantitative information on the effect of the MC concentration on the kinetics of the processes. The results are presented in
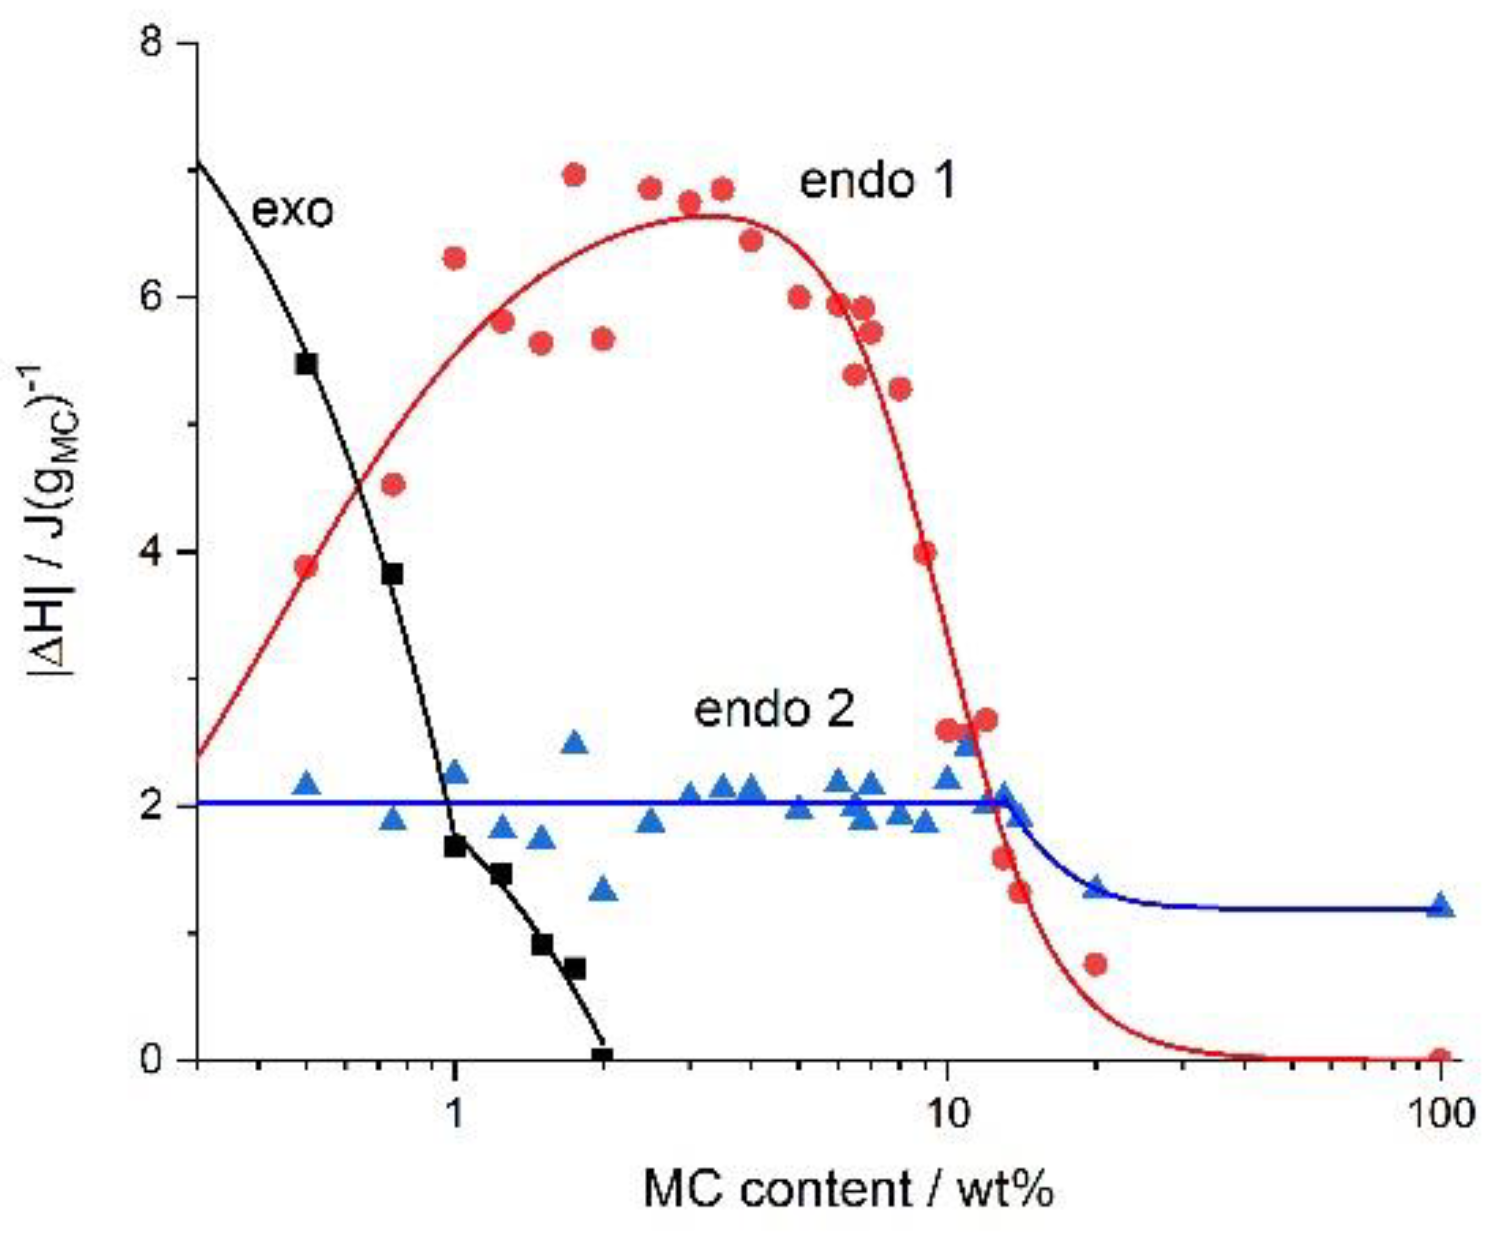
Figure 4,
Figure 5 and
Figure 6, showing the heat exchanged,
ΔH, the temperatures at the start of the processes,
Tonset, and their rates,
k, respectively. In
Figure 4, it can be seen that the maximum of the low-temperature endothermic effect (endo 1) was ca. 7 J/g
MC, whereas for the high-temperature endothermic effect (endo 2), the maximum heat was ca. 2 J/g
MC. In case the water cages were destructed (low-temperature endothermic effect), the highest heat levels were seen for the medium range of MC concentrations, i.e., 2–6 wt.%. In the case of the crosslinking process (high-temperature endothermic effect), the heat was constant up to 14 wt.% of the MC. At the highest MC concentrations, both heat levels dramatically decreased the low-temperature endothermic effect to 0 and the high-temperature endothermic effect to ca. 1 J/g
MC. In the left panel of
Figure 4, in the low MC concentration range of <2 wt.%, the heat of the low-temperature endothermic effect decreased with decrease in the MC content. It was accompanied by the appearance of the exothermic effect, whose heat levels increased with a decrease in the MC content. Interestingly, the change in the exothermic heat showed two ranges of MC content dependence with a boundary at 1 wt.%.
There are some ideas to explain the genesis of the endothermic nature of the MC crosslinking during heating. Sekiguchi et al. [
28] suggested that crosslinking might not only involve hydrophobic interactions. Other interactions might also be responsible for the double MC crosslinking process. Our explanation of the observed phenomena based on the DSC results during the heating of the MC solutions was the following. In the ambient conditions, MC was characterized by prevalence and dominance of hydrophilic interactions in the solution, such as water–water interaction and these same interactions between the hydrophilic parts of MC and the water molecules. Additionally, in the solution, the water molecules might have created ordered structures, i.e., water cages around the hydrophobic regions of MC, and intramolecular interactions between the polymeric chains were also formed. Formation of water cages around the methoxy groups was accompanied by heat release and entropy reduction, which was manifested by the exothermic effect preceding the endothermic effects for highly diluted MC solutions. The exothermic effect disappeared at higher MC concentrations. It is possible that in more densely packed polymeric networks, hydrophobic aggregates were previously created at lower temperatures than what was caused by the limited available space in the solution and the dominance of the polymeric phase over the solvent.
While heating, an appropriate amount of energy (heat) is delivered to the system, the water cages are destroyed, and the methoxy groups are released, and the number of ordered form of water molecules start to change. Heat was consumed to make the layer of the water cages thinner, increasing disordering and, thus, entropy (ΔS > 0). This process was accompanied by the low-temperature endothermic effect.
Soon after the destruction of the water cages, the exposed methoxy groups in the MC chains underwent cross-linking due to intra- and intermolecular hydrophobic interactions. As we mentioned previously this step was considered to be the high-temperature endothermic effect.
The maximum effect of the heat on the water-cage destruction (low-temperature endothermic effect), at a particular range of MC concentration, in all probability could have been related to the presence of two limitations. In a dilute MC solution, the MC molecules might form micelles, providing a limited number of the methoxy groups to the solution and to the water cages around these molecules. On the other hand, at relatively high MC concentrations, the chains become densely packed, and their molecular mobility is limited, which also affects the mobility of the water molecules, and results in a reduction of the low-temperature endothermic effect. In the case of a high-temperature endothermic effect, the constant value of the heat at low and medium MC concentrations, might suggest similar employment of the methoxy groups, which at dilute MC solutions would create separated molecules that form micelles and at high-enough MC concentrations would form a hydrophobic network. Decrease in the heat of the high-temperature endothermic effect, at above 14 wt.% of MC was understood to be due to the aforementioned limited molecular mobility.
The dependence of the exothermic heat on the MC concentration in
Figure 4, showed an abrupt change at 1 wt.% of the MC content. This behavior indicated the existence of some boundary, above which the exothermic heat weakly depended on the MC concentration and below which it depended strongly on the MC concentration. This might suggest the boundary between semi-dilute and dilute solution, respectively, however, this assumption needs further investigations.
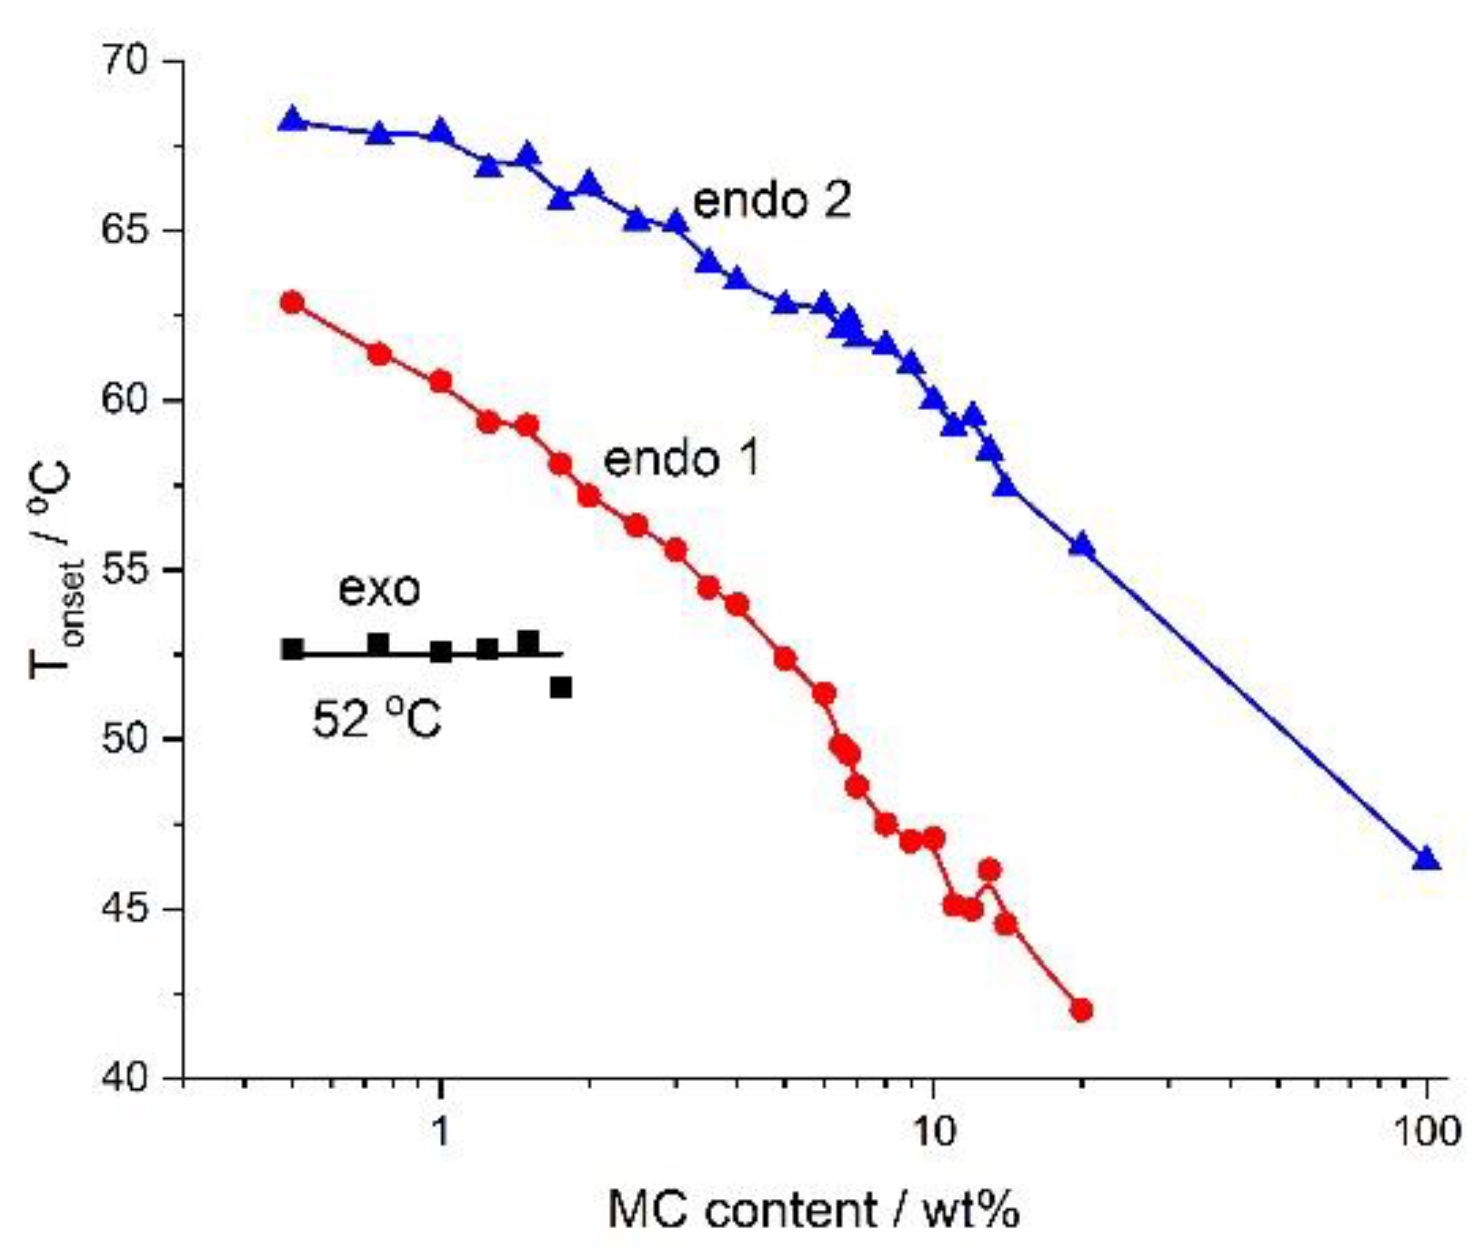
Figure 5 presents the dependencies of
Tonset and MC concentrations, which might serve as a phase diagram. It is rather clear that below the
Tonset of the low-temperature endothermic effect, there existed a one-phase solution in the form of sol. Between the low-temperature and the high-temperature endothermic effect there was a sol–gel transition, while above the high-temperature endothermic effect there might have existed a cross-linked polymer (gel). According to [
29], the MC gel remains stable up to 80 °C, where phase separation takes place. Additionally,
Figure 4 shows the dependence of the
Tonset of the exothermic effect, which showed a constant value. It suggests the existence of two sub-areas in dilute or semi-dilute sol, characterized by a lack of and formation of water cages below and above 52 °C, respectively.
The kinetics of the processes, described using rate,
k, determined as the reciprocal of the half time of the process is presented in
Figure 6.
Figure 6 illustrates the effect of the MC concentration on the rates of the processes. From
Figure 6a, it is evident that the low- and the high-temperature endothermic processes, as well as the exothermic one, differed in rates. The rate of destruction of the water cages (low-temperature endothermic effect) was seen to decrease with the MC concentration. This might have been due to a decrease in the MC molecular mobility. The rate of the formation of the water cages (exo) was seen to increase with MC concentration, confirming the reinforcing role of MC molecules in the creation of water cages. The rate of the crosslinking process (high-temperature endothermic effect) showed a reduction in the high MC concentration range. This was obviously due to a decrease in the molecular mobility. It was accompanied by a decrease in
ΔH in
Figure 4, indicating the formation of an imperfect crosslinked network of low density. At low and medium MC content, the crosslinking rate showed generally comparable values, however, it might be noted that, there existed two maxima at 2 wt.% and 9 wt.% of MC, separated by a local minimum at 4 wt.% of MC. As shown in
Figure 4, up to 14 wt.% of MC, there was a constant value of
ΔH, indicating the formation of highly dense crosslinking network. Thus, these kinetic features indicated the existence of two regimes in the MC crosslinking kinetics, which were expected to be controlled by different mechanisms. Due to these features, there were predicted differences in the structure of the crosslinked networks, however, further studies are necessary.
The kinetics was additionally affected by the temperature of the process. It can be seen in
Figure 6b, that the processes occurring at higher temperatures were faster than those at lower temperatures. We anticipated that there was a similar effect of various molecular mobility, being dependent in this case on temperature. Interestingly, all rates showed similar values at the same temperature. Moreover, it might be noticed that the rates of crosslinking and destruction of the water cages showed a similar abrupt drop at 61 °C and in case of the former rate, it also showed two additional abrupt changes at 63 °C and 66 °C. This coincidence suggested that the two crosslinking mechanisms proposed above might have been temperature activated.
3.2. DMA
Analysis of the G′ and G″ as a function of time was used to determine the crosslinking kinetics of thermoresponsive materials. In most cases described in the literature, e.g., [
29], the G′ and G″ curves intersected each other at a particular time with further domination of G′ over G″. While the G′ curve was below the G″ curve, the material presented viscous behavior characteristic for liquids. The intersection was the characteristic point, which was usually taken as the time (or temperature) of crosslinking [
5]. The dominance of G′ over G″ indicated the elastic behavior of the material [
29].
There is a specific group of materials in which the intersection of G′ and G′’ has not been detected. We observed such a situation for the isothermal measurements of the MC aqueous solutions. During every measurement, the G′ was higher than G″, showing the weak elastic character of MC aqueous solutions, even at ambient conditions. Consequently, in order to estimate the crosslinking kinetics, only G′ was analyzed as a function of time.
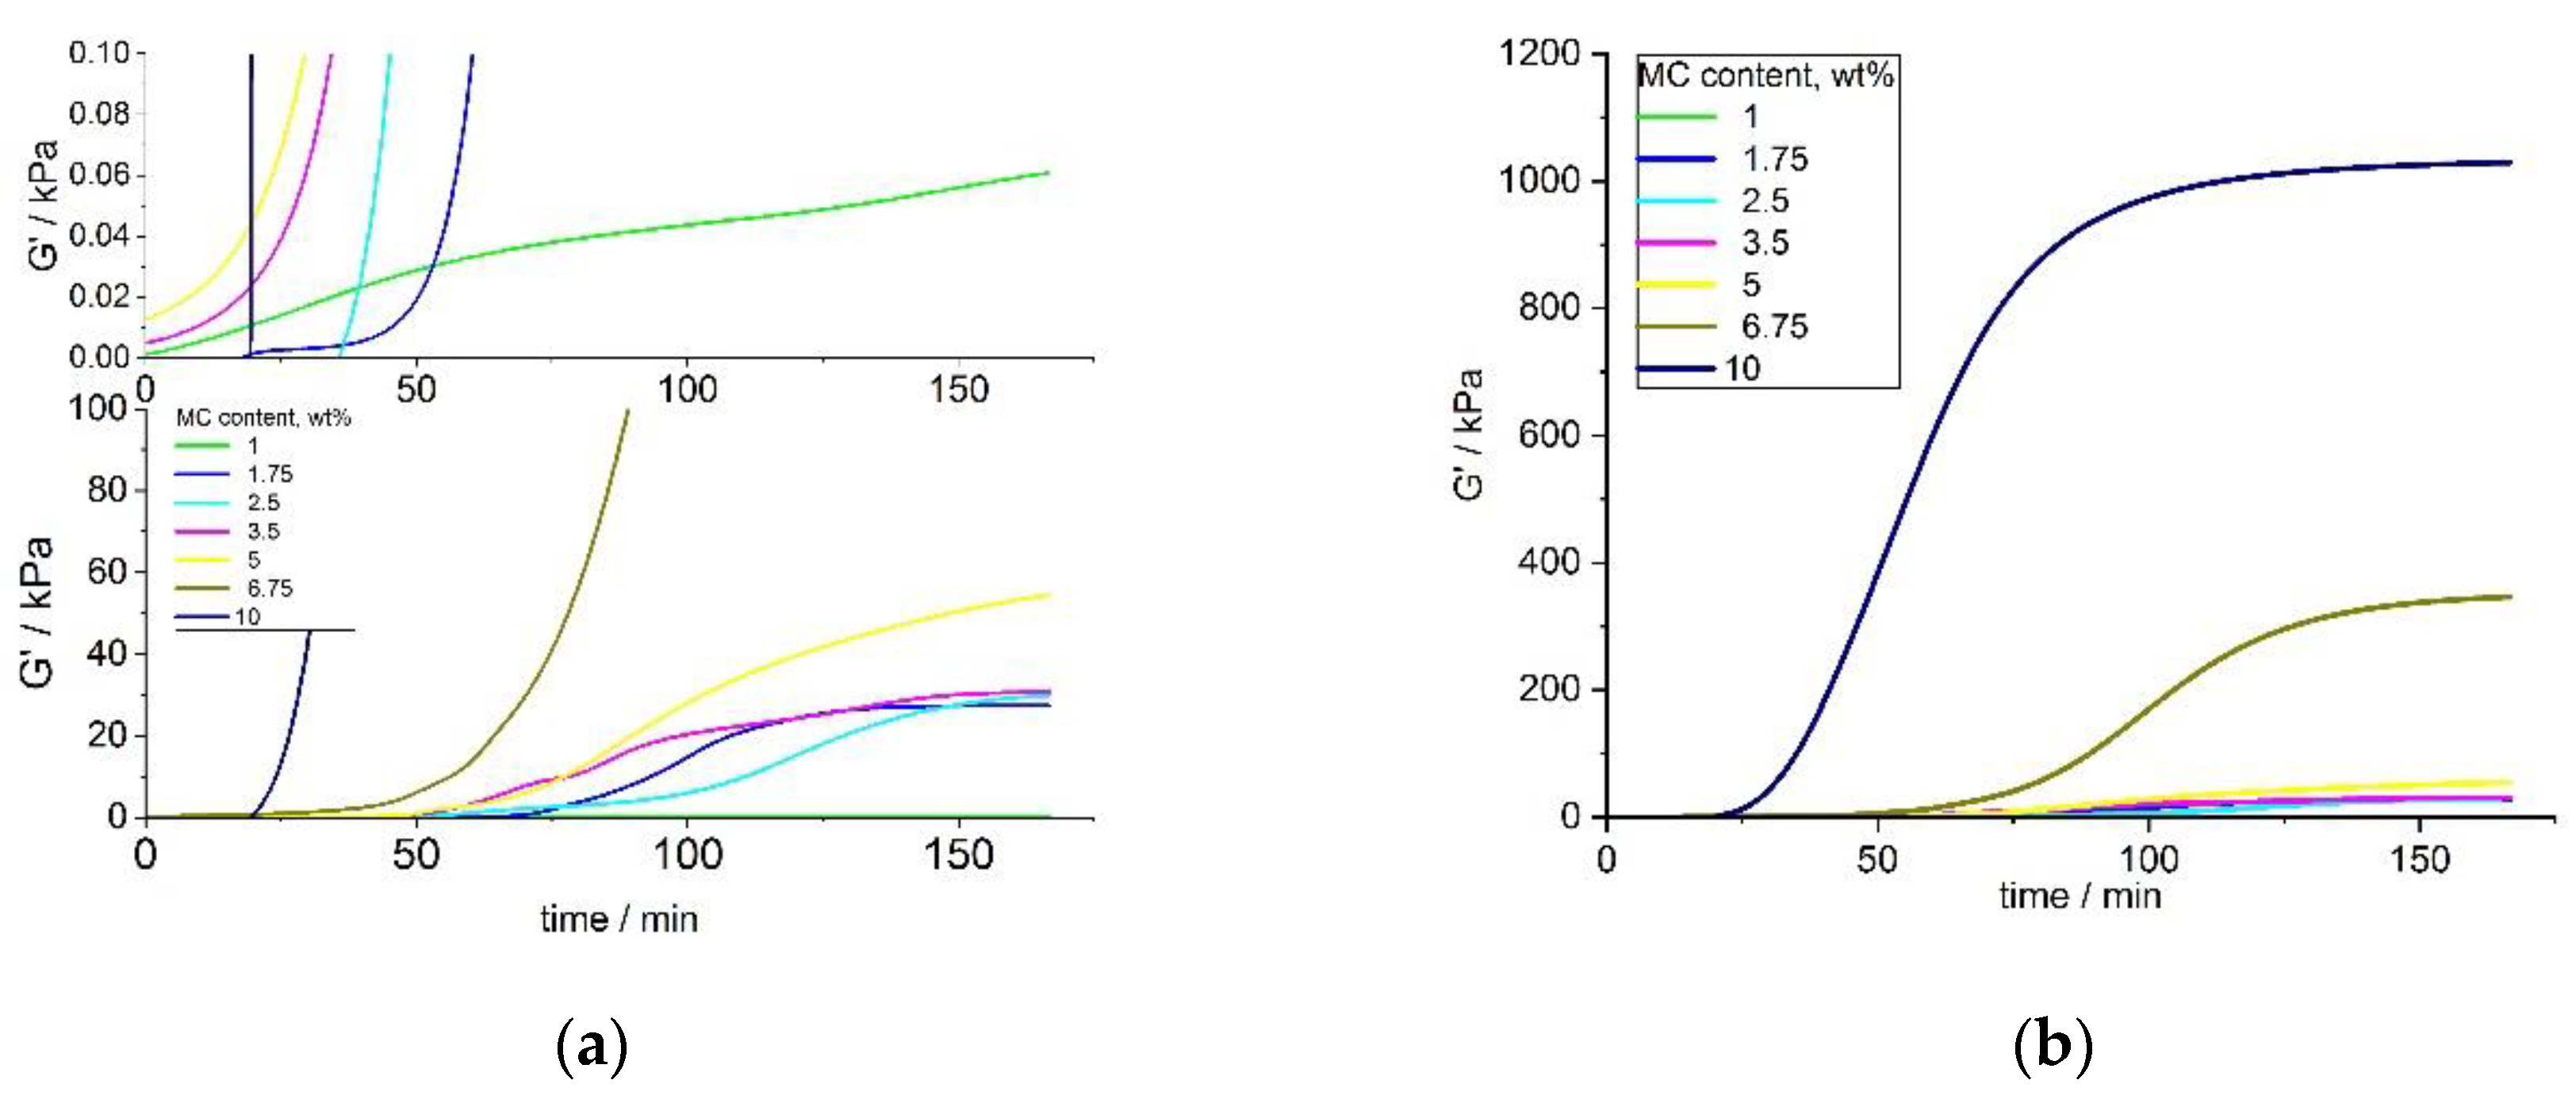
Results for small concentrations of MC ranging between 1 and 5 wt.% and the full range of MC concentrations 1–10 wt.% (shown in
Figure 7a,b) indicated a sigmoidal growth of G′, which was non-ideal, particularly for lower concentrations. Different onset time of crosslinking among the various concentrations of MC was observed. The G′ of MC at the lowest concentration of 1 wt.% showed very different behavior, compared to the solutions with higher concentrations, with a very slow growth and the lowest final value. The final values of G′, for small MC concentrations (1–5 wt.%), increased with the MC concentration. An analysis of G′ at the full range of MC concentrations (
Figure 6b) showed a smoother G′ increase for higher MC concentrations (6.75 and 10 wt.%), with a clearly marked stabilization at the end of the crosslinking. As expected, an increase in the G′ values with an increasing concentration for 5 and 10 wt.% of MC was also observed.
After heating up to 37 °C, for a long time, the MC aqueous solution showed a delayed thermal destruction of the water cages, resulting in an unstable increase of G′. The analysis of the G′ and
dG′/dt curves clearly indicated that the crosslinking rate and the final G′ value depended on the temperature and polymer concentration. However, the heating time also played a key role here. As mentioned before, diluted MC aqueous solutions need prolonged heating to destroy water cages and initiate a polymeric chain rearrangement. Since the number of methoxy groups is partial and the distance between them is prominent, the greater amount of time that is needed to ensure a contact between them results in a hydrophobic bond formation. Solutions with the highest MC concentrations showed an instant G′ increase corresponding to the first step of crosslinking. In a denser polymeric network, there are partially formed hydrophobic interactions, and hence it results in less water cages breakage. As a result, G′ increase was more stable and needed less time to form fully crosslinked network. Another reason for the multiple effect of crosslinking for small concentration might be the temperature, which was not high enough to induce crosslinking. Since the hydrophilic solvent dominated in the solution, it was difficult to destroy all of the water cages. Some of the methoxy groups were entrapped and could not form a fully formed hydrophobic network. Probably for such concentrations, a higher temperature was needed to induce crosslinking and increase the rate of the process. For the higher MC concentrations, the polymeric chains were closer to each other and it was feasible to form hydrophobic interactions. Denser packed MC chains tended to make bridges with water molecules [
30]. In a partially cross-linked network, aggregation occurred at sufficiently high temperatures, when it was easier to break down water cages at higher concentrations.
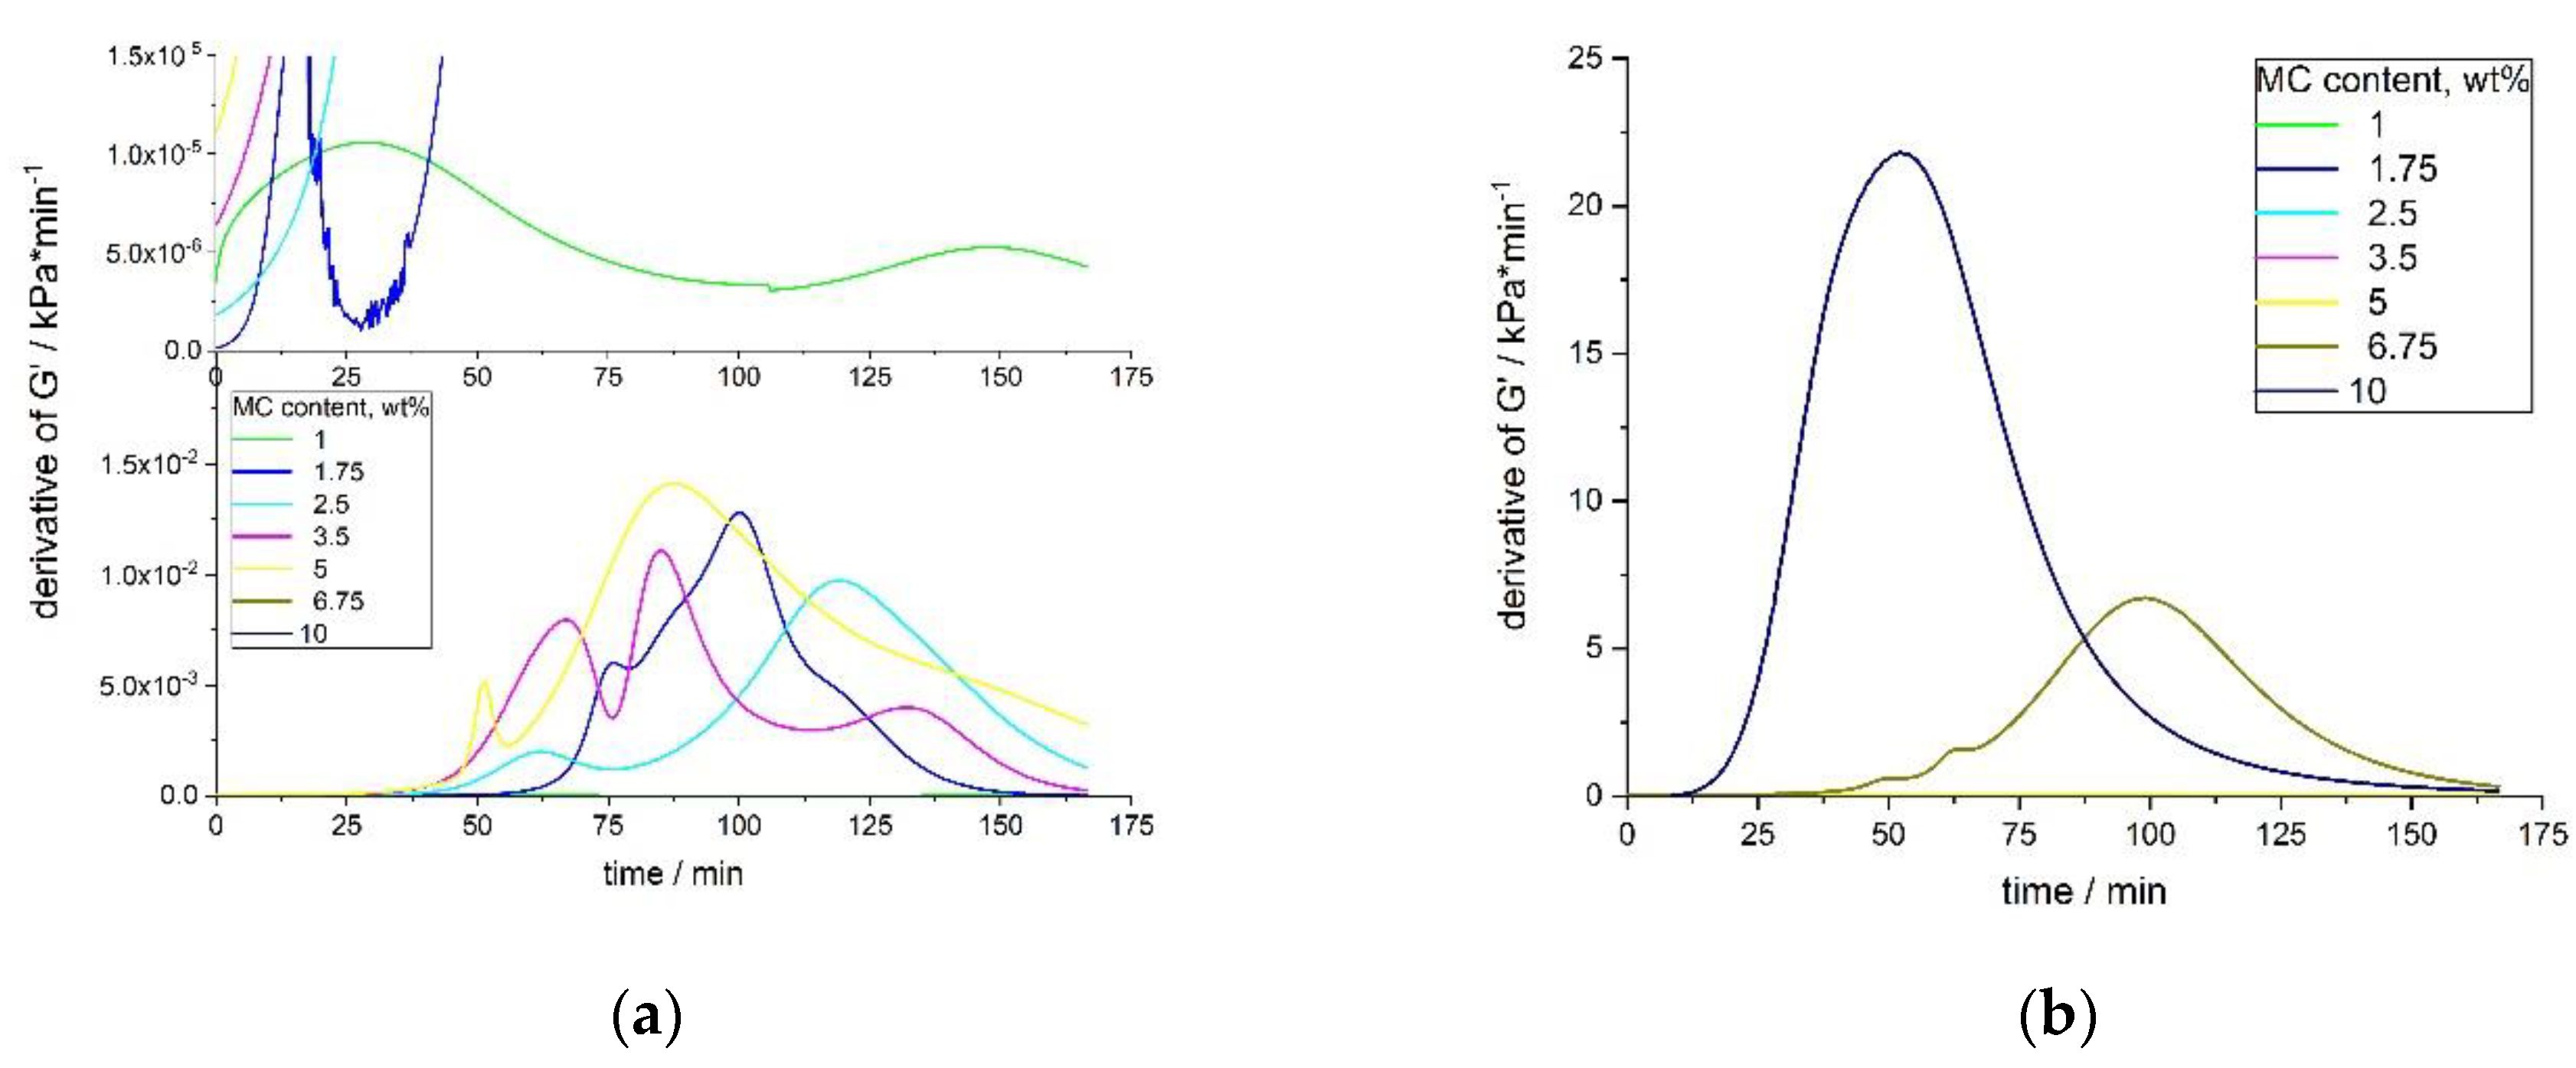
The time derivatives of G′ for low MC concentrations showed a complex multimodal character, which was a consequence of the non-ideal sigmoidal character of the G′ growth (
Figure 8a,b). For every sample, the height of the first maximum was smaller than the second one, and appeared later than 50 min of the measurement. The height of the second maximum was always the highest and appeared in the time range of 80–120 min of the measurement. In some samples (1.75 and 3.5 wt.%), there was also a third smallest maximum, appearing at the latest stage of the process.
With an increasing MC concentration, the process became more homogenous and there might have been only one maximum in the time-derivative of the G′ curve. Moreover, the process became faster (according to the height of the peak and its time position) (
Figure 8b). Although, MC at 6.75 wt.% still showed two maxima in the
dG′/dt, the first maximum was practically negligible, as compared to the second large one. MC at 10 wt.% showed only one maximum at 52 min. The onset time of the crosslinking differed for various concentrations, being shorter at higher concentrations. This was especially evident for the 6.75 and 10 wt.% of MC.
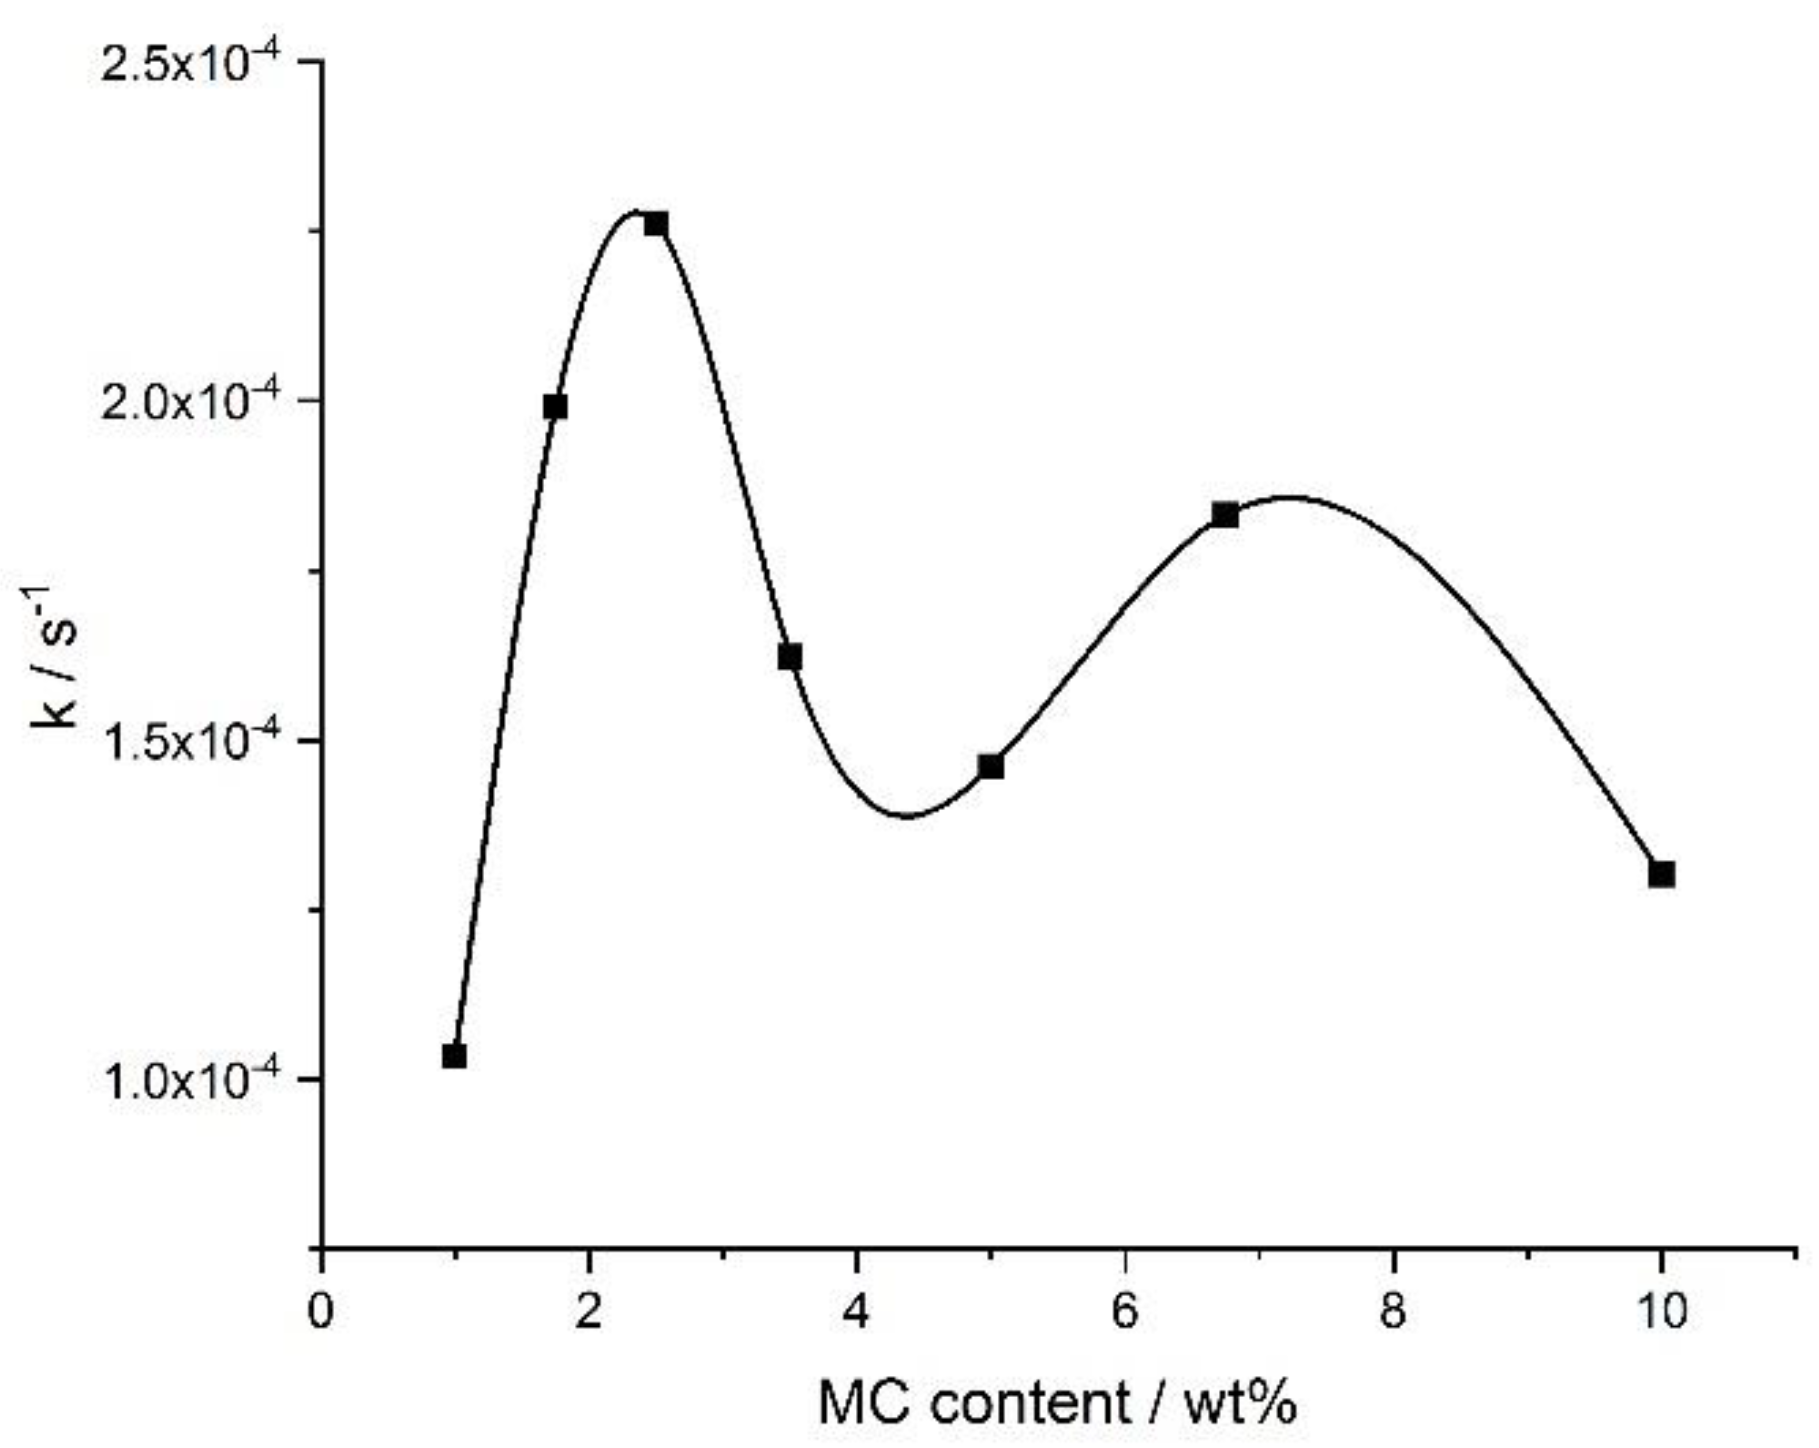
Figure 9 shows the crosslinking rate, as determined from the DMA results, as a function of the MC concentration. There were two maxima at ca. 3 wt.% and ca. 8 wt.% with the local minimum in between, which was qualitatively similar as obtained by the DSC for the crosslinking process, manifesting as the high-temperature endothermic effect (compared with the ‘endo 2’ in
Figure 6a).
Table 1 shows the final maximum values of G′, which were determined as integrated extrapolated G′ derivatives. These values were analyzed and compared to the G′ of various human tissues (
Table 2). G′ for the lowest MC concentration (1 wt.%) was significantly lower, as compared to others. MC of 1.75–3.5 wt.% showed similar values, and above these concentrations the G′ increased significantly.
The final G′ versus the MC concentration dependency was just as predicted. The higher concentration resulted in higher final hydrogel stiffness. The obtained results suggest that, with regards to the viscoelastic properties, the MC aqueous solution might be a suitable material used as a scaffold for tissue engineering. In order to definite a dedicated application of the studied MC concentrations, the obtained results were summarized and compared to the G′ of various human tissues (
Table 1 and
Table 2). According to the tables, the stiffness of MC in concentrations of 1.75–3.5 wt.% might be used for spinal cord therapies as a scaffold or drug/cell delivery system. MC at the concentration of 6.75 wt.% presents similar mechanical properties (G′ value) to the human meniscus. MC at a concentrations of 10 wt.% shows high values, which according to
Table 2, might be suitable for cartilage applications.
3.3. Biological Tests
The cytotoxicity of the MC aqueous solutions was performed by the PrestoBlue assay after 3 days. Cells were directly exposed to 1, 2.5, and 5 wt.% of the MC aqueous solutions in volumes of 25, 50, and 100 µL. Biological tests including cytotoxicity and viability of the cells on MC hydrogels were carried out to assess its relevance in tissue engineering. For MC concentrations of 1 and 2.5 wt.%, the metabolic activity was about 90% of that of the untreated cells (
Figure 10). For the lowest MC concentrations, each volume of added solution performed cell viability over 70%. MC of 5 wt.% achieved this cell viability in only one volume of 25 µL. Both of these values were ≥70%, which according to UNI ISO 10993-5 standard is considered to be non-toxic for cells. At higher MC concentrations, the metabolic viability was rather low (
Figure 10).
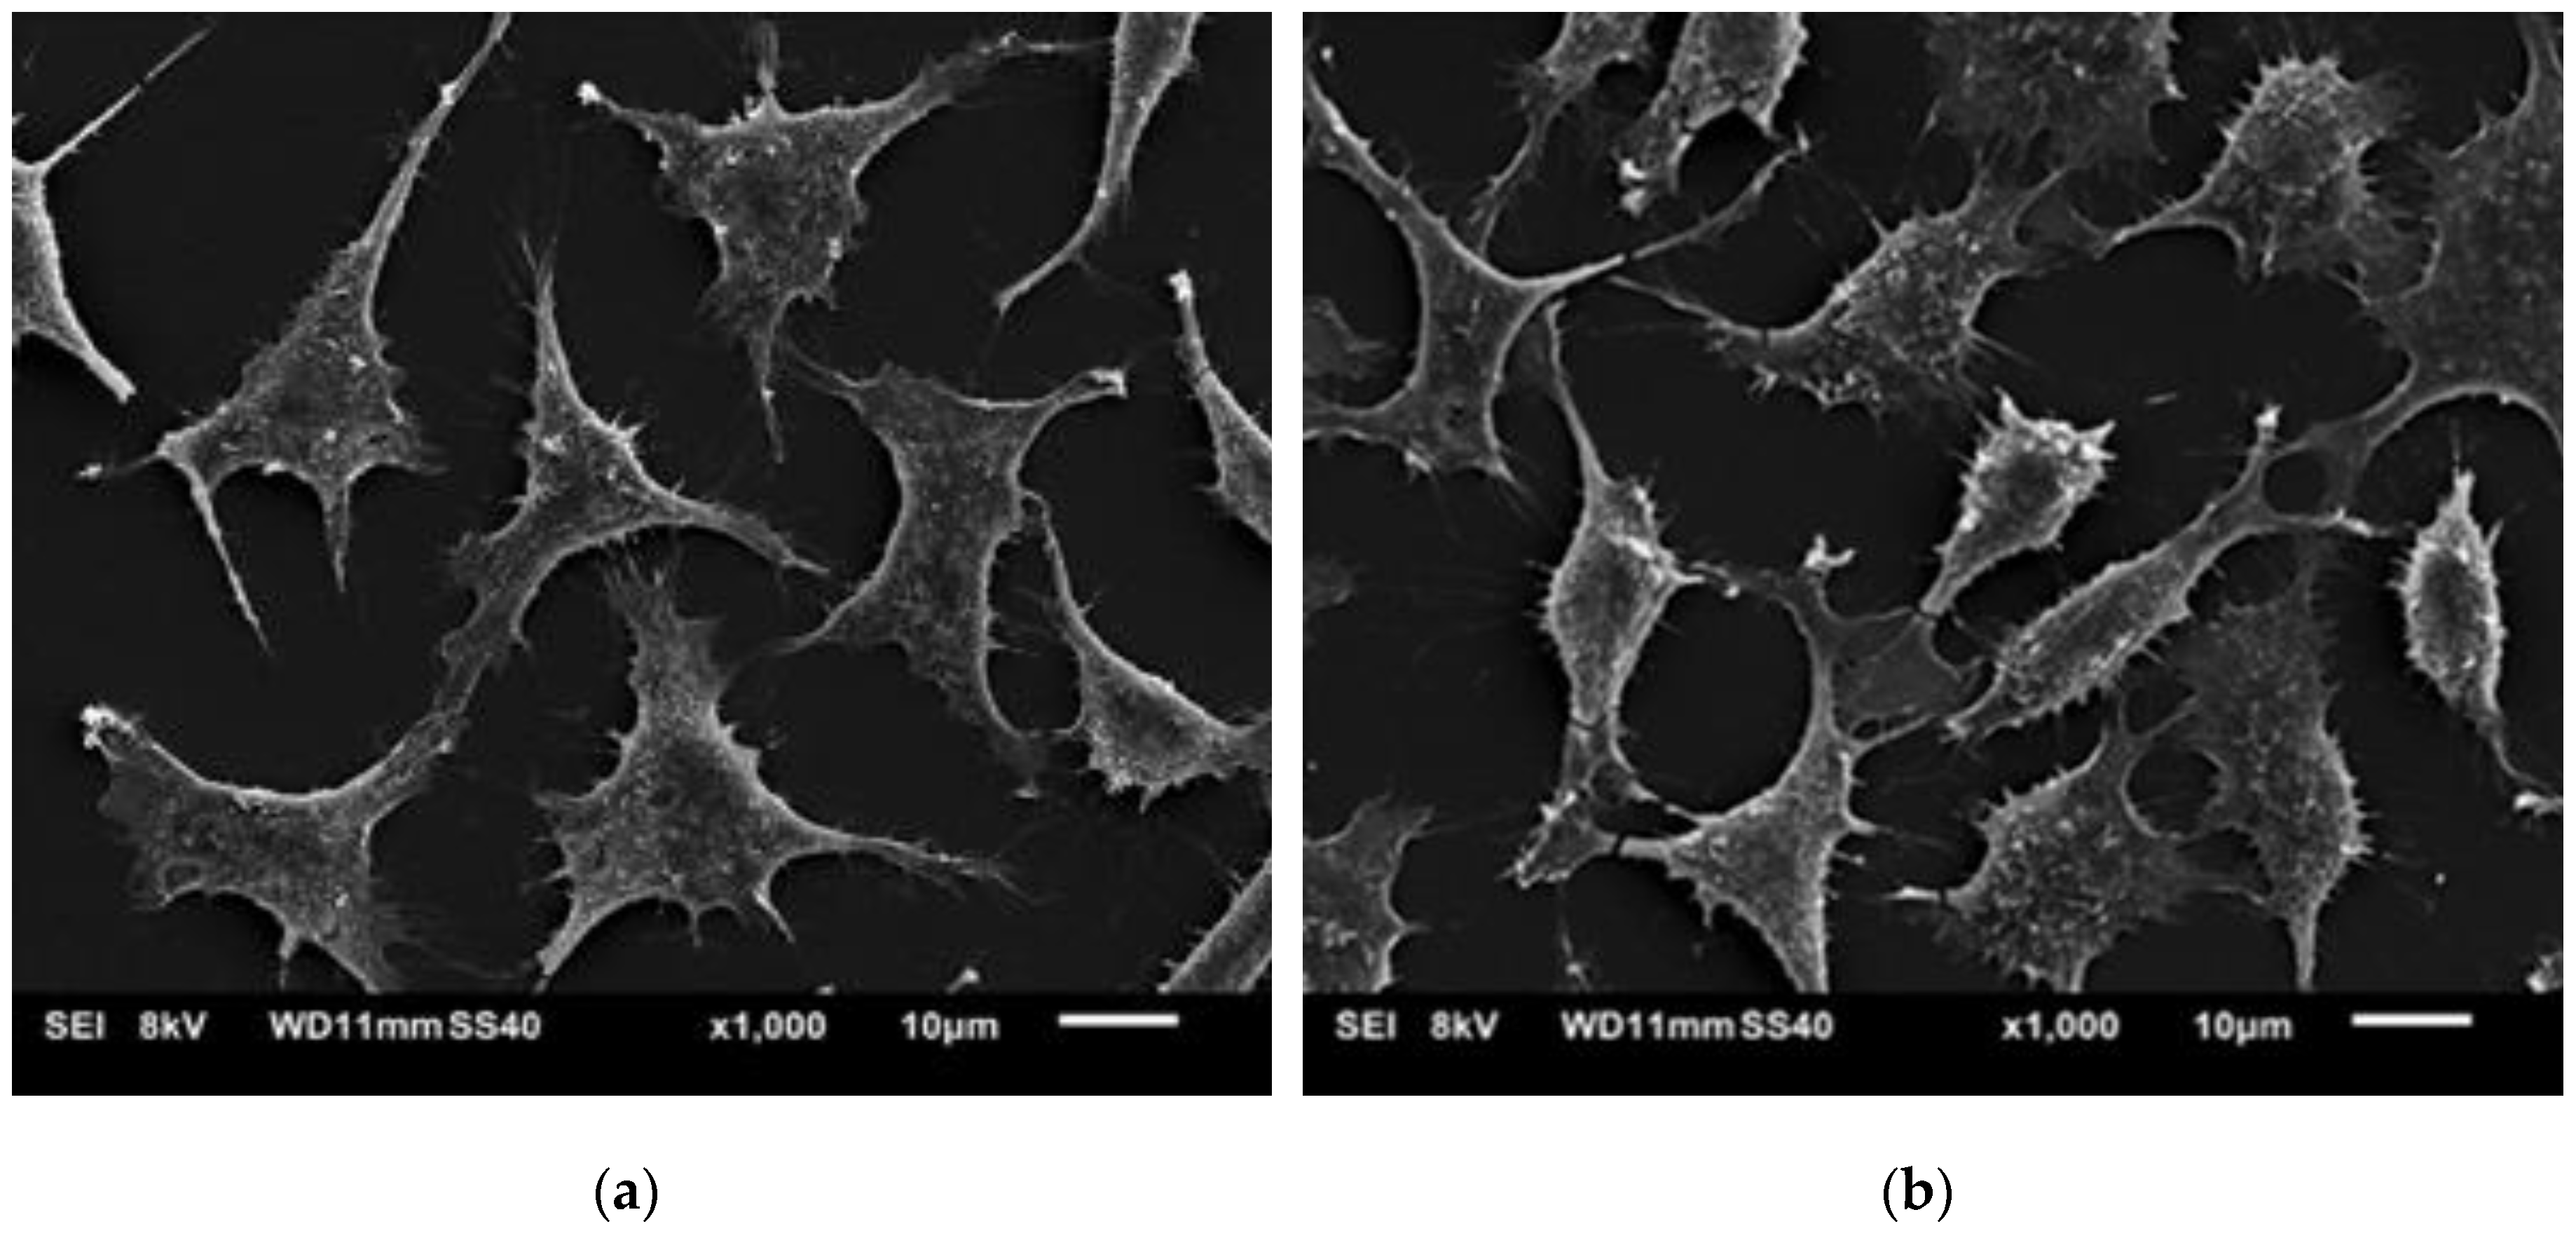
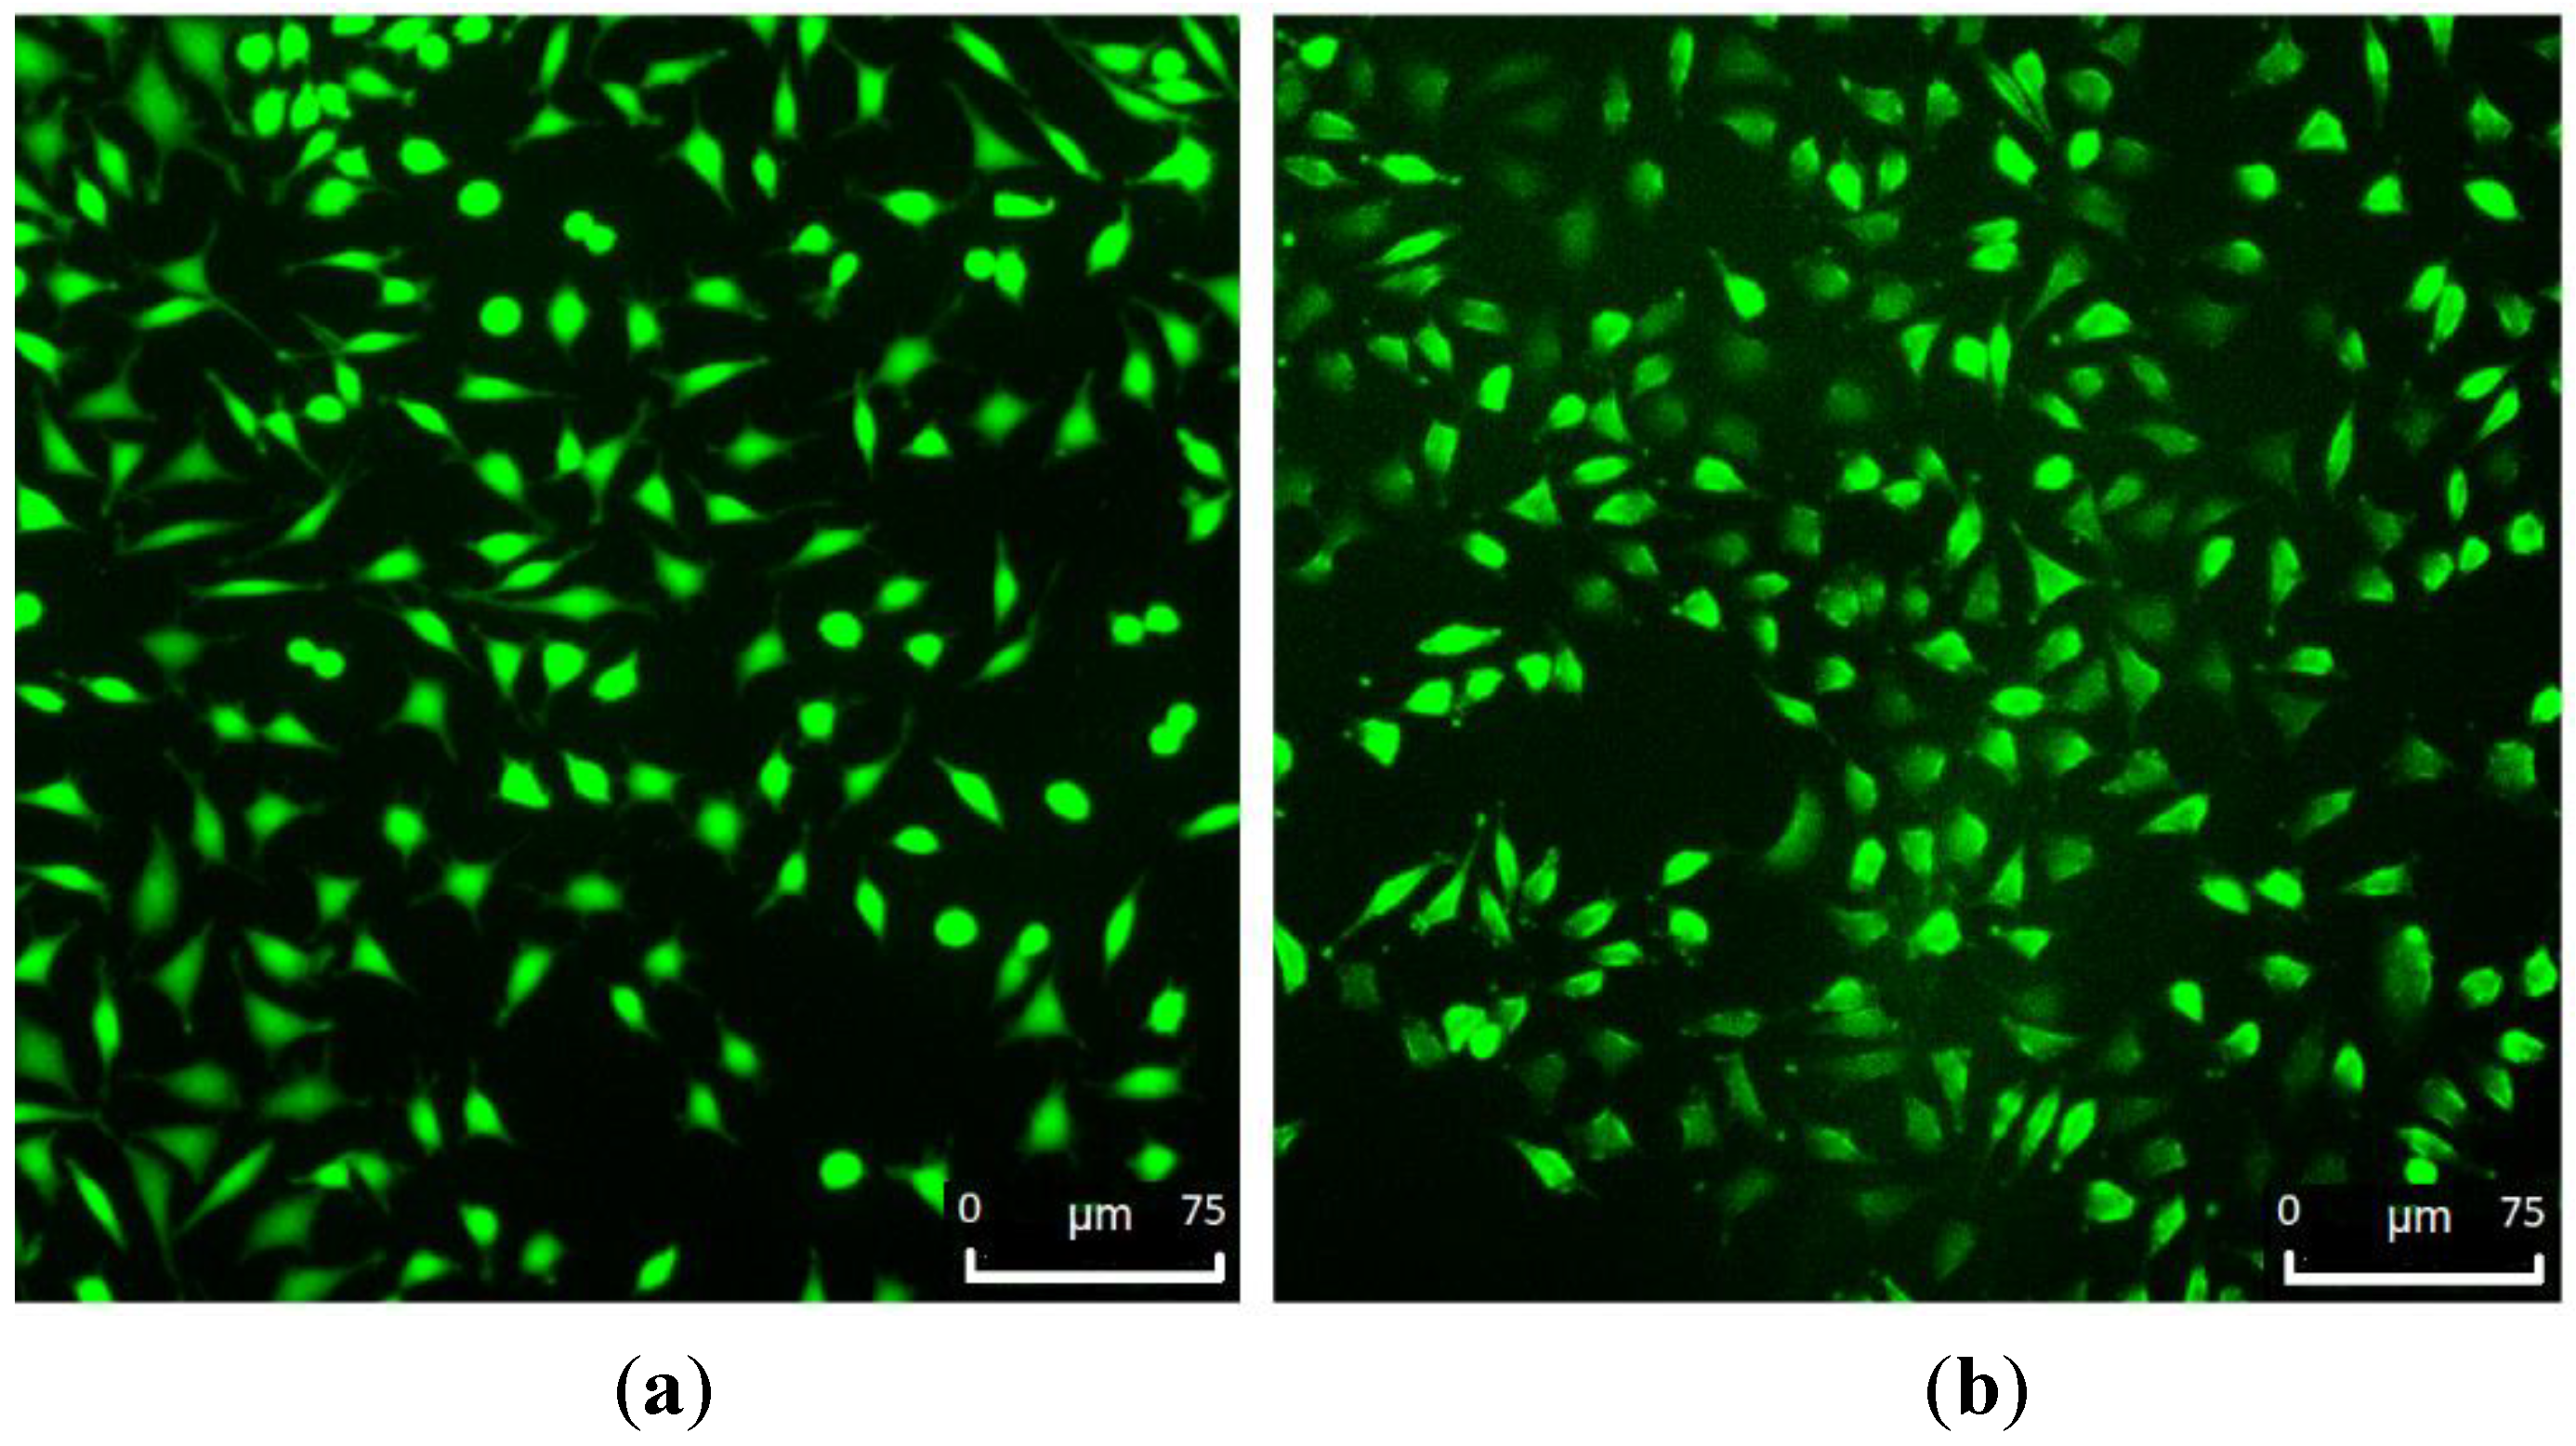
SEM and fluorescence images (
Figure 11 and
Figure 12) showed that the L929 fibroblasts penetrated the MC hydrogels to some extent. It was especially visible in fluorescent imaging that the density and viability of the cells were higher than that of the control. The varying FM cell image focus indicated different cell penetration depths into the hydrogel (
Figure 12b). This effect was less visible on the SEM images (
Figure 11b).
Our results indicated that the L929 cells seeded on top of the gels remained viable with no indication of cell death throughout the culture duration. However, the different concentrations and added volumes of MC influenced the viability, metabolic activity, and morphology of this cell line. It was evident that MC with low MC concentrations (below 2.5 wt.%) did not cause cytotoxicity. At these concentrations an appropriate pH and availability of oxygen were ensured. However, at MC concentrations ≥5 wt.% the material seemed to be toxic for fibroblast. It was probably the effect of the acidic pH and a limited availability of oxygen. The limited availability of oxygen could have been a result of the high viscosity of the hydrogel. At these MC concentrations, the cells collapsed and did no longer had the possibility to conduct any metabolic activity. It was also observed that the amount of added hydrogel significantly influenced the cells viability. The more added hydrogel, the higher toxicity, especially, at higher MC concentrations. It was probably caused by the non-controlled pH in the MC aqueous solutions. However, in the future, we plan to study a mixture of MC with PBS, in order to control the pH of the solution, which is expected to increase cell viability on the investigated materials.

 ,
, 


