3.1. Melt Spinnability of POM/PLLA Blends
In our previous work, the POM fiber with the tensile strength of 1120 MPa was successfully prepared by a melt-spinning and post-drawing method. This may open a door for the melt-spinning processing of high-strength POM fibers by use of an injection molding-grade copolymerization-type POM resin [
18]. Although the potential biodegradation performance and acceptable mechanical properties of POM/PLLA blends have been confirmed by our previous study [
35], their spinnability is still unknown. It is well known that the composition of raw materials and spinning-processing conditions are two key factors for melt spinning of POM resin and the associated blends [
39,
40]. In this work, the melt spinnability of POM/PLLA blends was first evaluated so as to determine the optimal spinning conditions for this blending system.
Figure S1 shows the MFRs of POM/PLLA blends at different contents of PLLA. Pure POM is found to have a MFR of 14.9 g/10 min, and however the MFRs of the blends tend to decrease with the incorporation of PLLA. It is noted that the higher PLLA content leads to a lower MFR for the blend. Our previous study verified that the mechanical properties of melt-spun POM fiber were strongly dependent on the MFR of POM resin, and the tensile strength of POM fiber tended to decrease in general due to the minimal loss of spinnability. To minimize the deterioration of spinnability of POM/PLLA blends as well as the mechanical performance of the melt-spun bicomponent fibers, only the blends with the PLLA contents lower than 20 wt % were chosen for further investigation of spinnability.
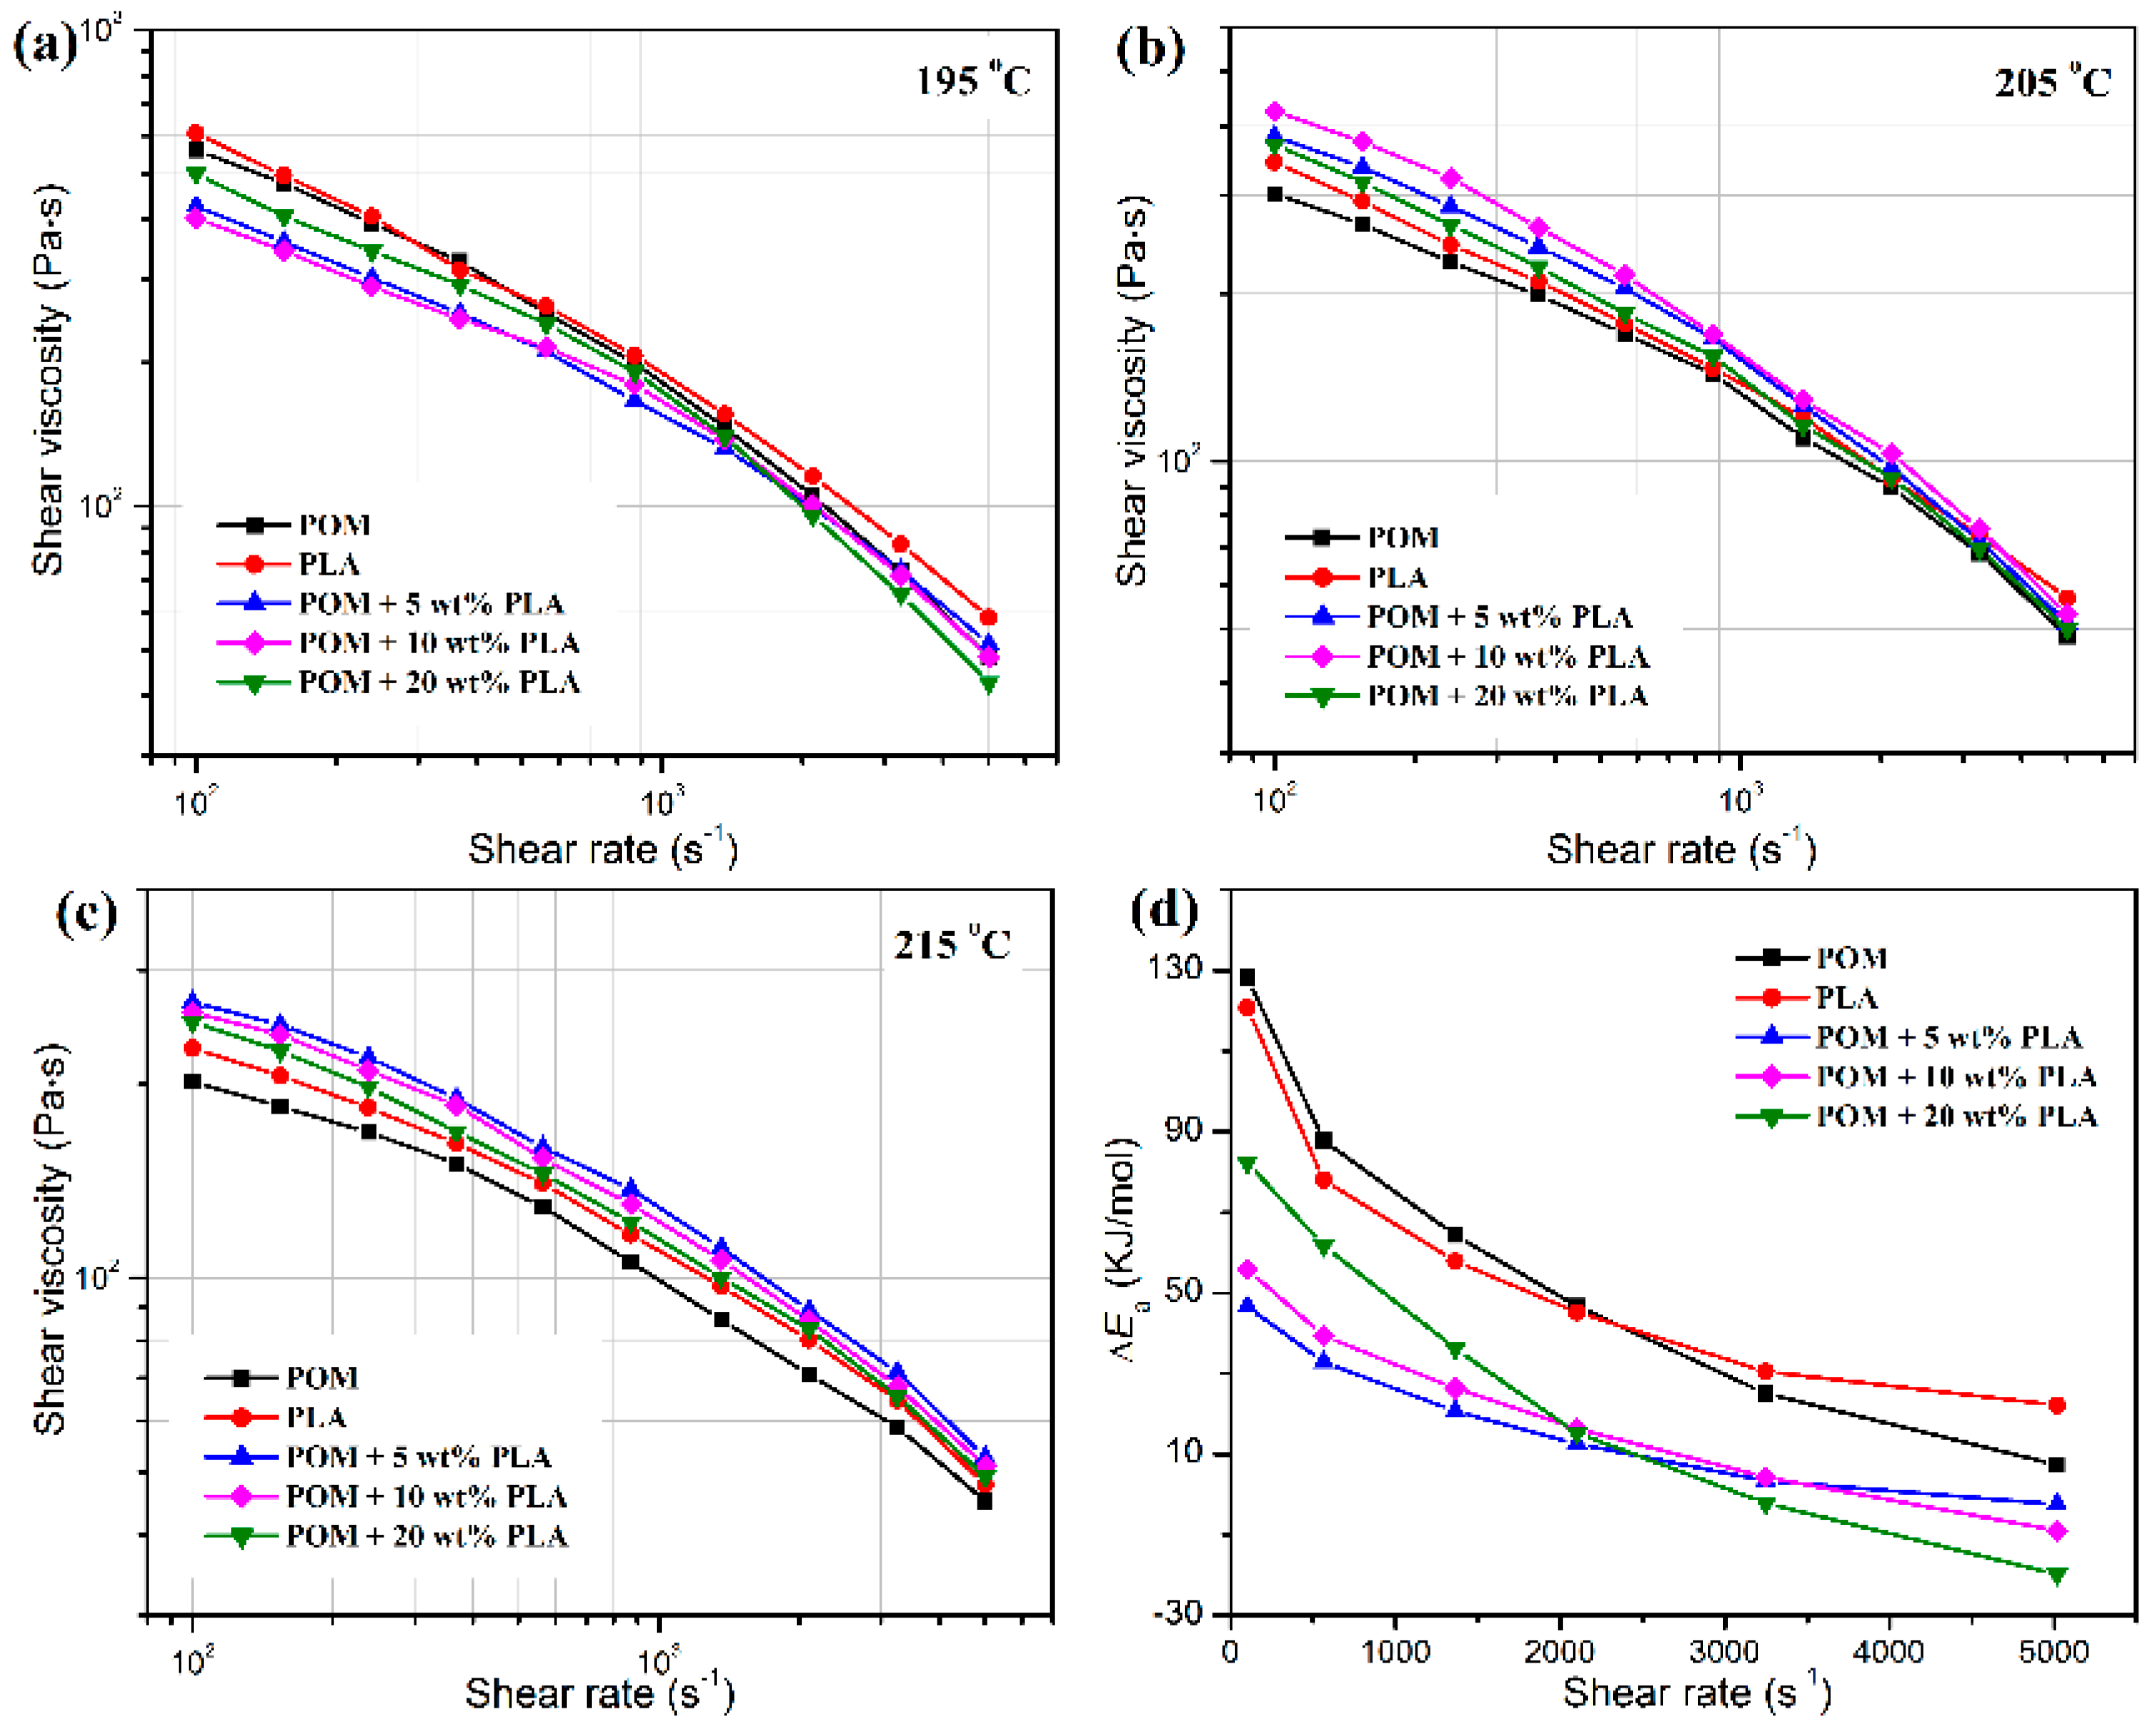
Figure 2 shows the plots of apparent shear viscosities of POM/PLLA blends as a function of the PLLA content at different temperatures, in which both pure polymers and their blends exhibit a pseudo-plastic flow and non-Newtonian behavior [
41]. As observed in
Figure 2a–c, pure POM and PLLA are found to present similar apparent shear viscosities in the shear-rate range of 100–1000 s
−1 at 195 °C; however, the apparent shear viscosity of PLLA seems to be higher than that of POM. On the other hand, the POM/PLLA blends exhibit slightly lower apparent shear viscosities in the whole shear rate range compared to two pure polymers, indicating that the presence of PLLA leads to a reduction of shear viscosity due to the slight macromolecular repellency between the two domains caused by partial miscibility. It is noteworthy that the blend containing 20 wt % PLLA present higher apparent shear viscosities in the shear-rate range of 100–2000 s
−1, but lower viscosities in the higher shear-rate range compared to the other blend samples. These results suggest that the lower PLLA content only facilitates a decrease in apparent shear viscosity at the shear rates lower than 2000 s
−1 for POM/PLLA blends at 195 °C. With increasing the test temperature, the apparent shear viscosities of pure PLLA are found to be higher than those of pure POM in the whole range of test shear rates as seen in
Figure 2b,c. Meanwhile, the POM/PLLA blends show higher apparent shear viscosities than two pure polymers due to the enhanced macromolecular entanglement at higher temperatures. It is noticeable that the blends containing 10 and 5 wt % PLLA present the highest shear viscosities at 205 and 215 °C among the three blend samples, respectively, whereas the blend containing 20 wt % PLLA shows the lowest shear viscosities in the whole range of shear rates.
The activation energy (Δ
Ea) of the flow process can be calculated from the slope of ln
η versus 1/
T using the Arrhenius equation as expressed by [
42]:
where
η is the apparent shear viscosity,
A is a pre-exponential factor, Δ
Ea the activation energy,
T the absolute temperature (K) and
R is the universal gas constant (8.314 J·K
−1·mol
−1). The obtained values of Δ
Ea are given in
Figure 2d. The Δ
Ea of melt is considered as the minimum energy required for macromolecules to just flow, which is equivalent to the energy necessary to overcome the intermolecular forces of attraction as well as the resistance due to the entanglements. Pure POM, PLLA and their blends are all found to show a decrease in Δ
Ea with an increase of shear rate because of the strong shear thinning effectiveness. However, the values of Δ
Ea of the blends are also smaller than any of two pure polymers, indicating that the incorporation of PLLA can effectively enhance the flowability of POM by reducing the energy barrier of molecular motion in the melt state and favors the melt-spinning process accordingly. It is also interestingly found that the Δ
Ea of POM/PLLA blends presents a downward trend by an order of PLLA content of 20 wt % > 10 wt % > 5 wt % in the shear-rate range of 100–2000 s
−1 but shows an obviously opposite trend in the shear-rate range of 2000–5000 s
−1. This phenomenon indicates that the higher Δ
Ea is attributed to the greater macromolecular resistance from PLLA domain at higher contents and lower shear rates, and however the disentanglement of PLLA macromolecules may play a major role at higher shear rates, thus resulting in a more significant decrease of Δ
Ea [
43]. These rheological results provide an important guideline for designing the optimal melt-spinning processing condition of POM/PLLA blends.
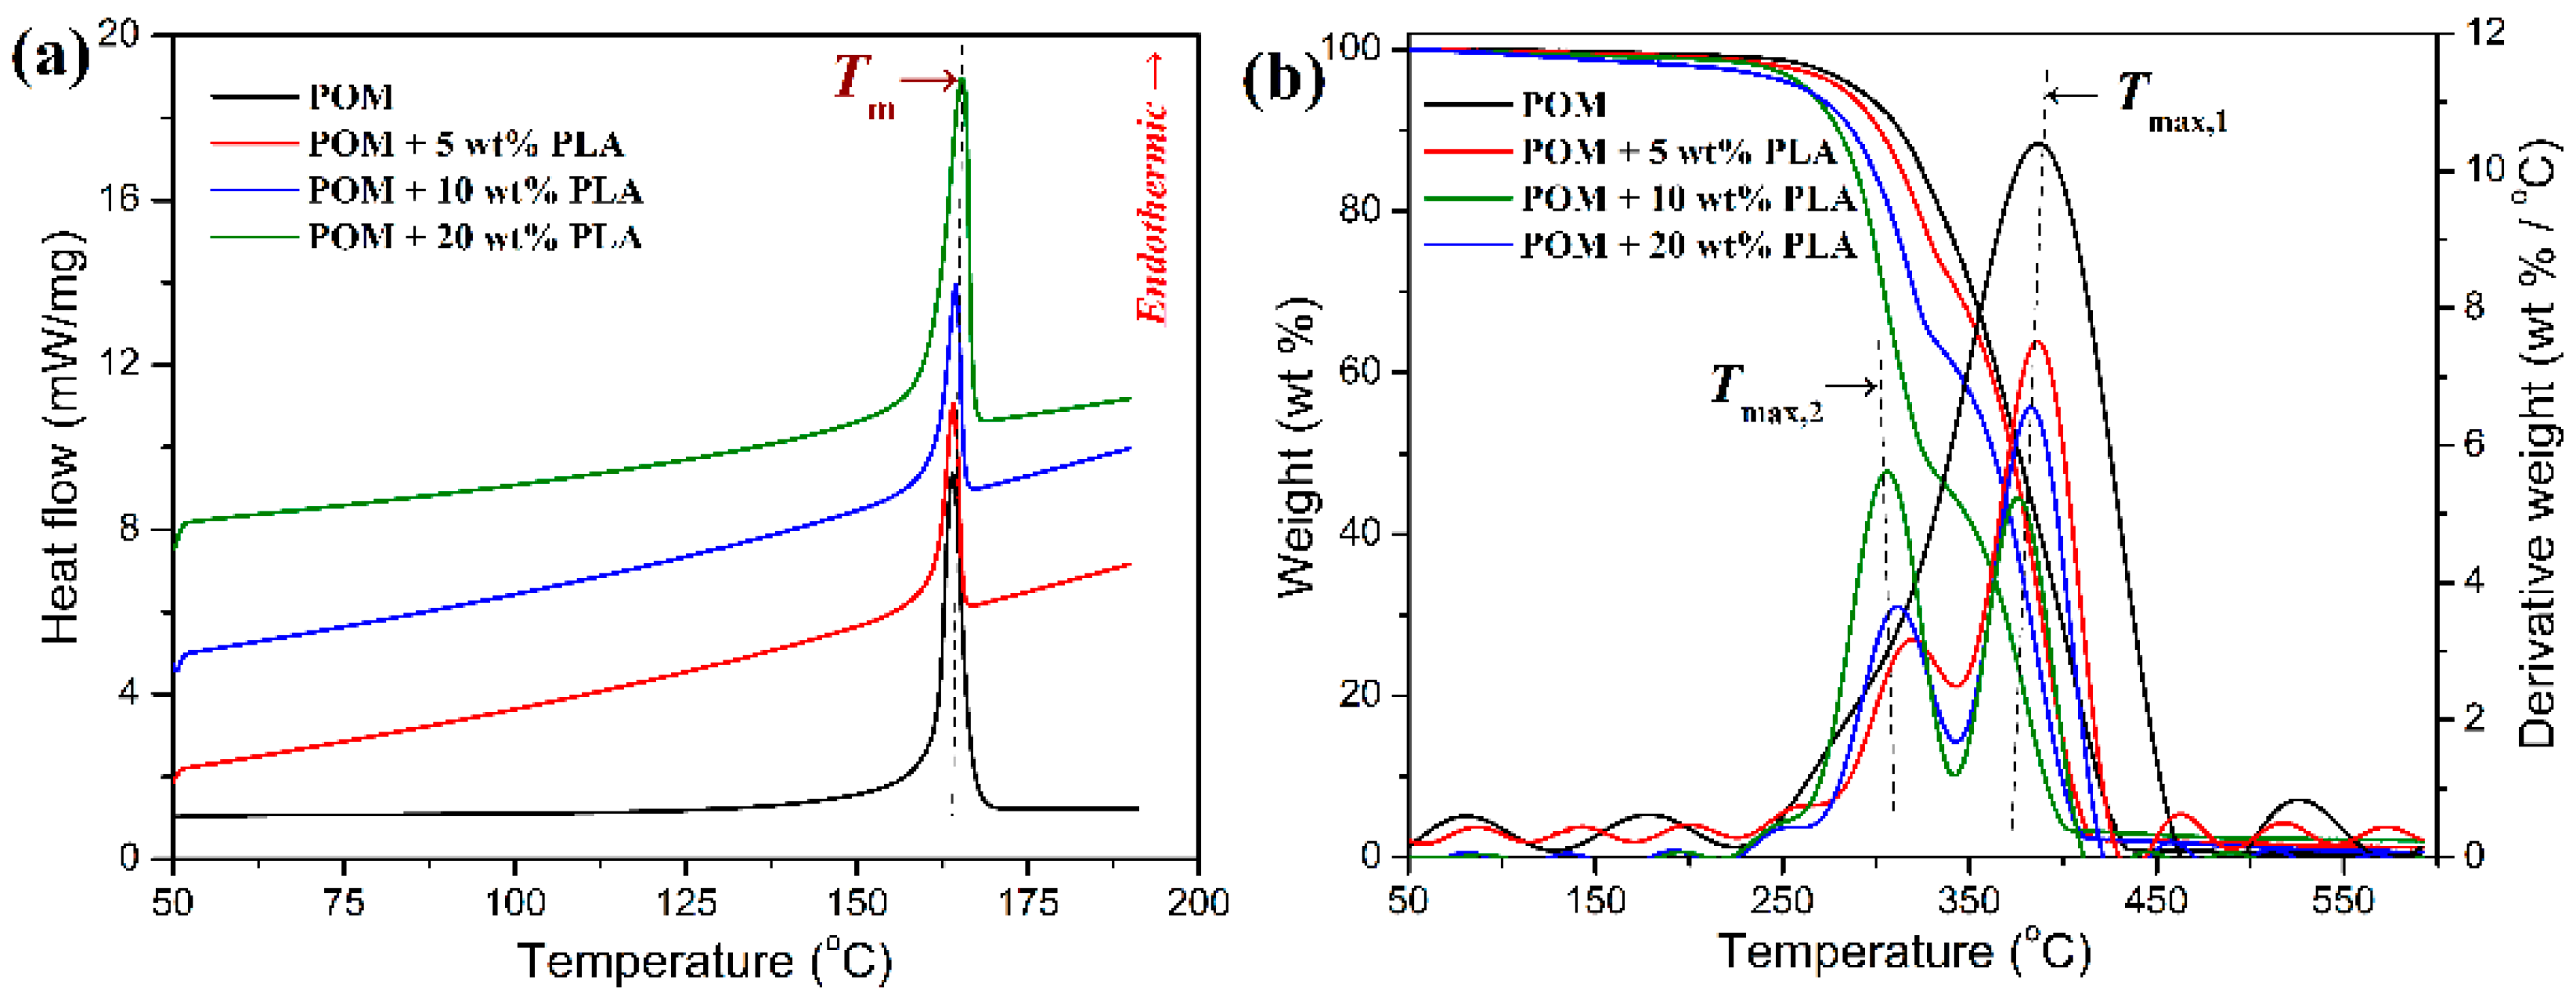
The melting behavior and thermal stability of POM/PLLA blends were evaluated by DSC and TGA to determine the lower and upper processing temperatures during the melt-spinning process, and the obtained DSC and TGA thermograms are illustrated in
Figure 3. It can be observed in
Figure 3a that all of the blends showed a single endothermic peak at around 165 °C corresponding to the melting point of POM domain in the blends, and that there is no melting peak found from the PLLA domain in the DSC thermograms of the blends. It is well known that PLLA has a much poorer crystallinity compared to POM, and it is hard to crystallize as a disperse phase in the POM matrix, especially at extremely low loadings due to a confinement effect. In this case, the POM domain can easily perform crystallization in the blends due to its strong crystallization capability, while the PLLA domain is bound to keep in an amorphous state. Therefore, the melt-spinning temperature of POM/PLLA blends is mainly determined by the POM domain. On the other hand, the thermal stability of the blends seems to decrease in the presence of PLLA as observed in
Figure 3b. This may be due to the lower thermal decomposition temperature of PLLA domain compared to that of POM one (see the DTG curves in
Figure 3b). The perceptible thermal decomposition temperature of POM/PLLA blends is found to locate at about 210 °C. Therefore, the melt-spinning temperature range should be set within 165–210 °C so as to manage adequate fluidity and appropriate thermal stability.
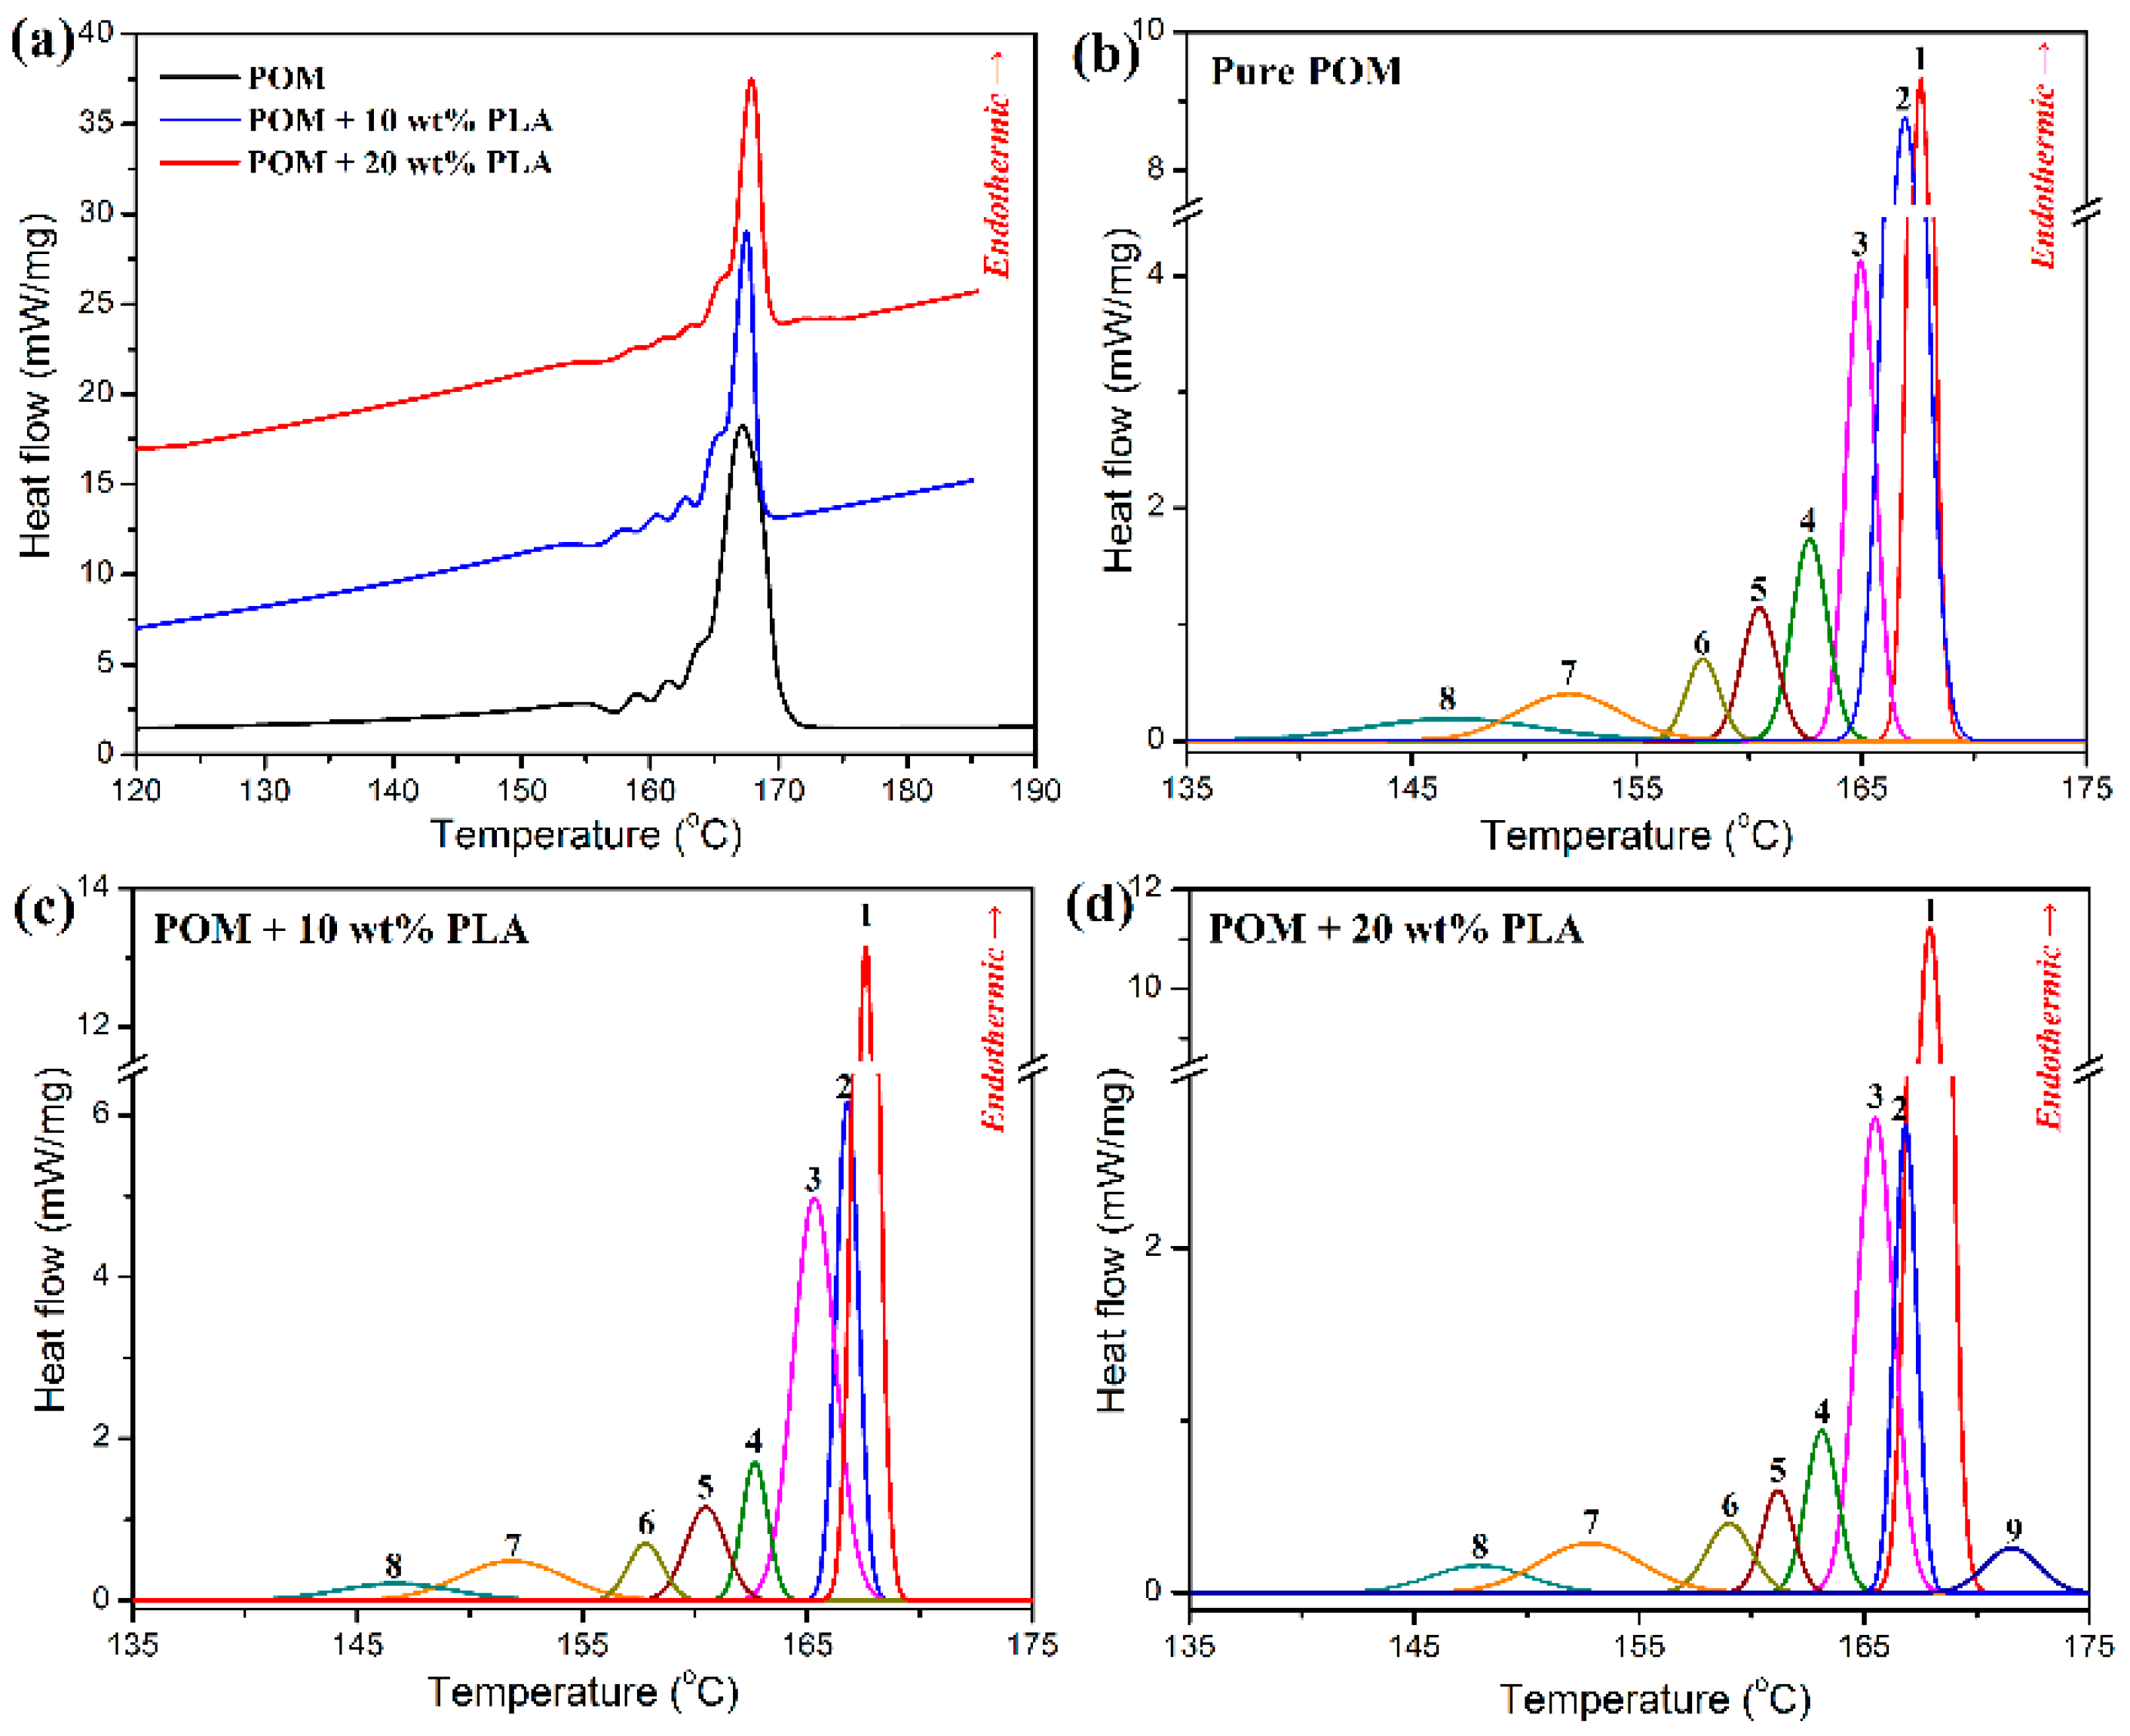
To better determine the post-drawing processing condition for the as-spun fibers derived from POM/PLLA blends, the SSA thermal fractionation experiments were conducted to understand the crystallization characteristics of the blends [
44].
Figure 4a shows the survey DSC curves obtained from thermal fractionation experiments for pure POM and its blends with PLLA, and the representative SSA thermal fractionation curves are illustrated in
Figure 4b–d. As observed in
Figure 4a, the survey DSC curve of pure POM presents multiple melting behaviors corresponding to the number of SSA cycles, and each melting endothermic peak represents the melting of crystallites formed from the POM macromolecules with the similar oxymethylene sequence length and lamellar thickness [
45], indicating that there is heterogeneity existing in POM resin [
46]. Although the POM/PLLA blends exhibit the similar survey fractionation DSC curves with pure POM, it can also be identified that the SSA peaks in the blends mainly arise from the fraction crystallization of POM domain by comparing
Figure 4b with
Figure 4c,d. Considering the fact that each SSA peak is proportional to the weight fraction of the crystallites with the same stability, the relative contents of these crystallites can be derived from the differential normalized area under the fusion of pure POM and its blends with PLLA. The detailed data obtained from the SSA thermal fractionation analysis are summarized in
Table S1 (see
Supplementary Materials). It is noted that pure POM exhibits eight well-resolved melting peaks resulting from the crystallization at 155–170 °C, and three major fractions at 167.6, 166.9, and 165.0 °C contribute more than 78% of the crystallites in the thermal fractionation. Similarly to the SSA thermal fractionation result of pure POM, the POM/PLLA blends also present three major fractions at similar temperatures contributed by the crystallization of POM domain. However, the relative content of the fraction at 167 °C is improved with an increase of PLLA content, and the relative contents of the fractions at the other two temperatures tend to decrease. This may be ascribed to the disturbance of crystallization of POM phase in the presence of PLLA domain. Such a disturbance becomes more and more serious with an increase of PLLA content and finally leads to a new small fraction of crystallites appearing at 171.6 °C for the blends containing 20 wt % PLLA. Based on the results of SSA thermal fractionation experiments for POM/PLLA blends, a gradual slow cooling program with a temperature range from 170 °C down to 155 °C were determined to offset the crystallization of POM domain in the blends.
3.2. Morphology and Microstructure
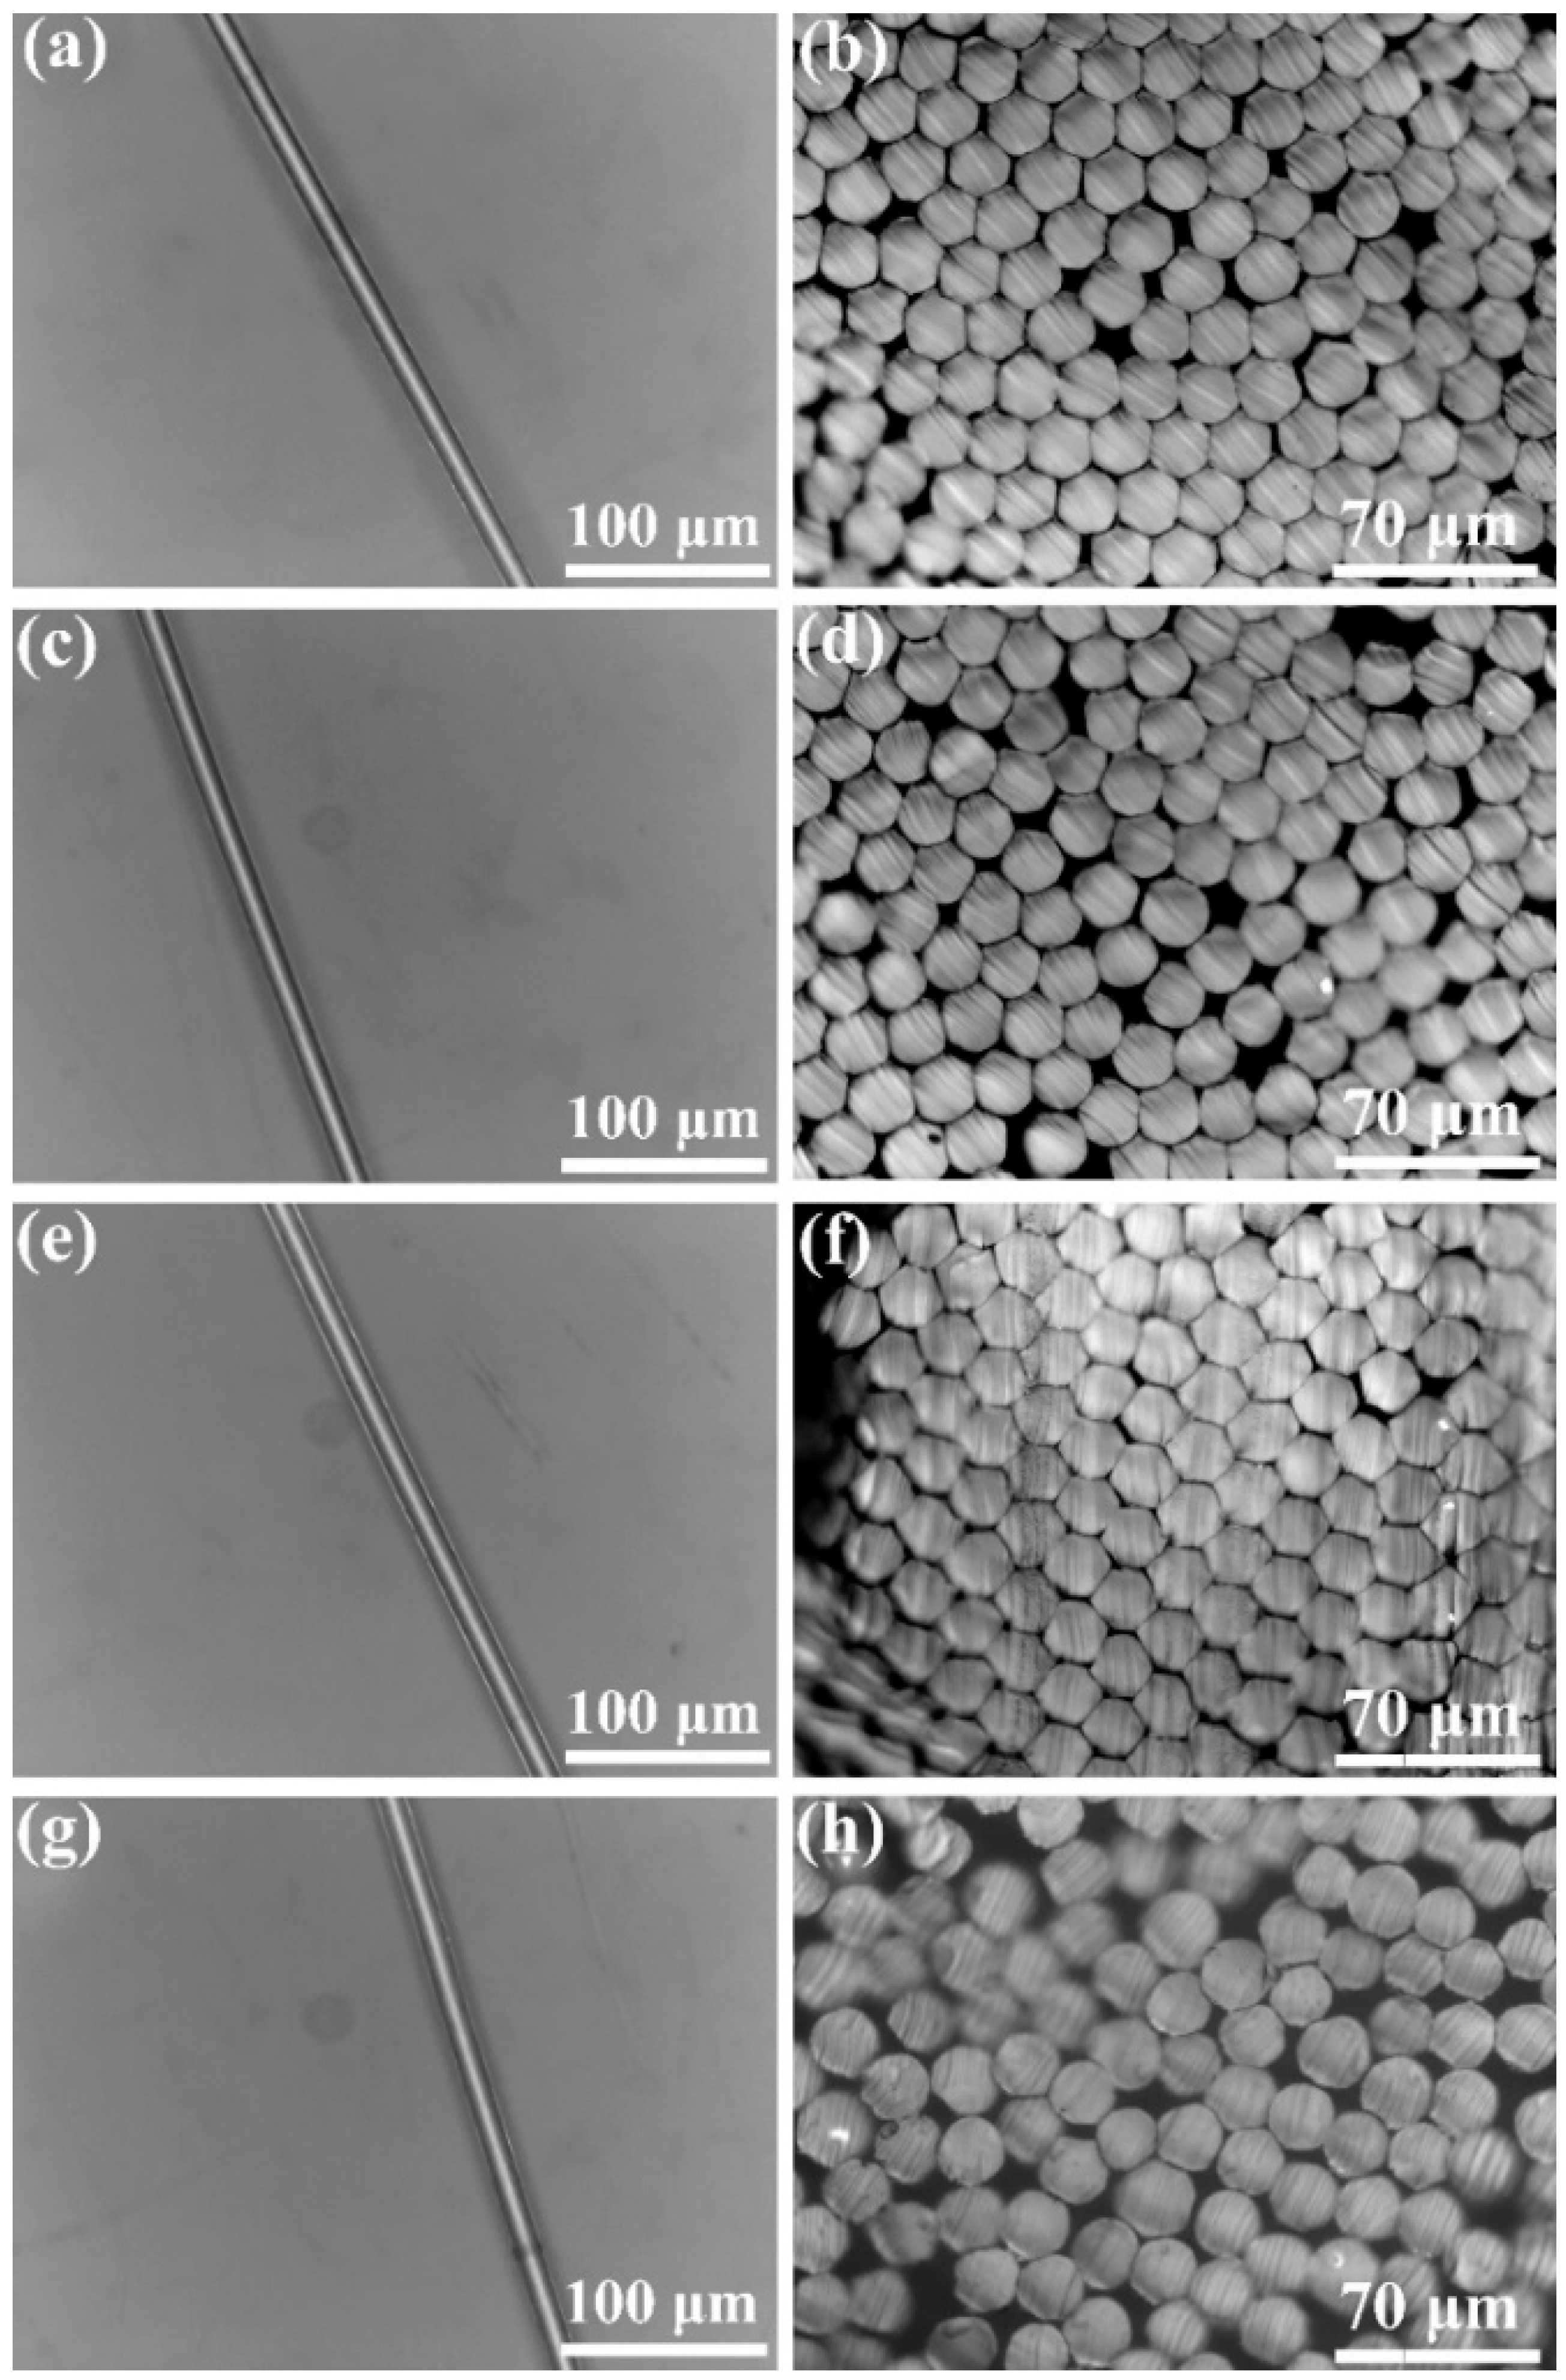
Figure 5 shows the optical microscopic images of single filament and transverse surfaces of the melt-spun fiber samples obtained at the ultimate draw ratios. Both pure POM fiber and POM/PLLA bicomponent fibers are found to exhibit a homogenous profile and a uniform diameter distribution. Moreover, there is also no sign of filament spitting observed from the bicomponent fibers. It is known that the POM resin used in this work has a good balance between the crystalline and amorphous phases to facilitate the melt spinning and subsequent post-spinning processing, thus leading to the formation of perfect filaments. The aforementioned melting behavior revealed that only the POM domain performed crystallization in the POM/PLLA blends, and the PLLA domain is partially miscible with the POM one in the amorphous phase. This might enhance the interfacial adhesion of the POM and PLLA phases and therefore made the as-spun bicomponent fibers undergo an ultimate tensile stress like as-spun pure POM fiber under the post-drawing process [
47]. In addition, the optical microscopic observation is also indicative of the fact that the incorporation of PLLA seems not to influence the diameter distribution and structure of filaments.
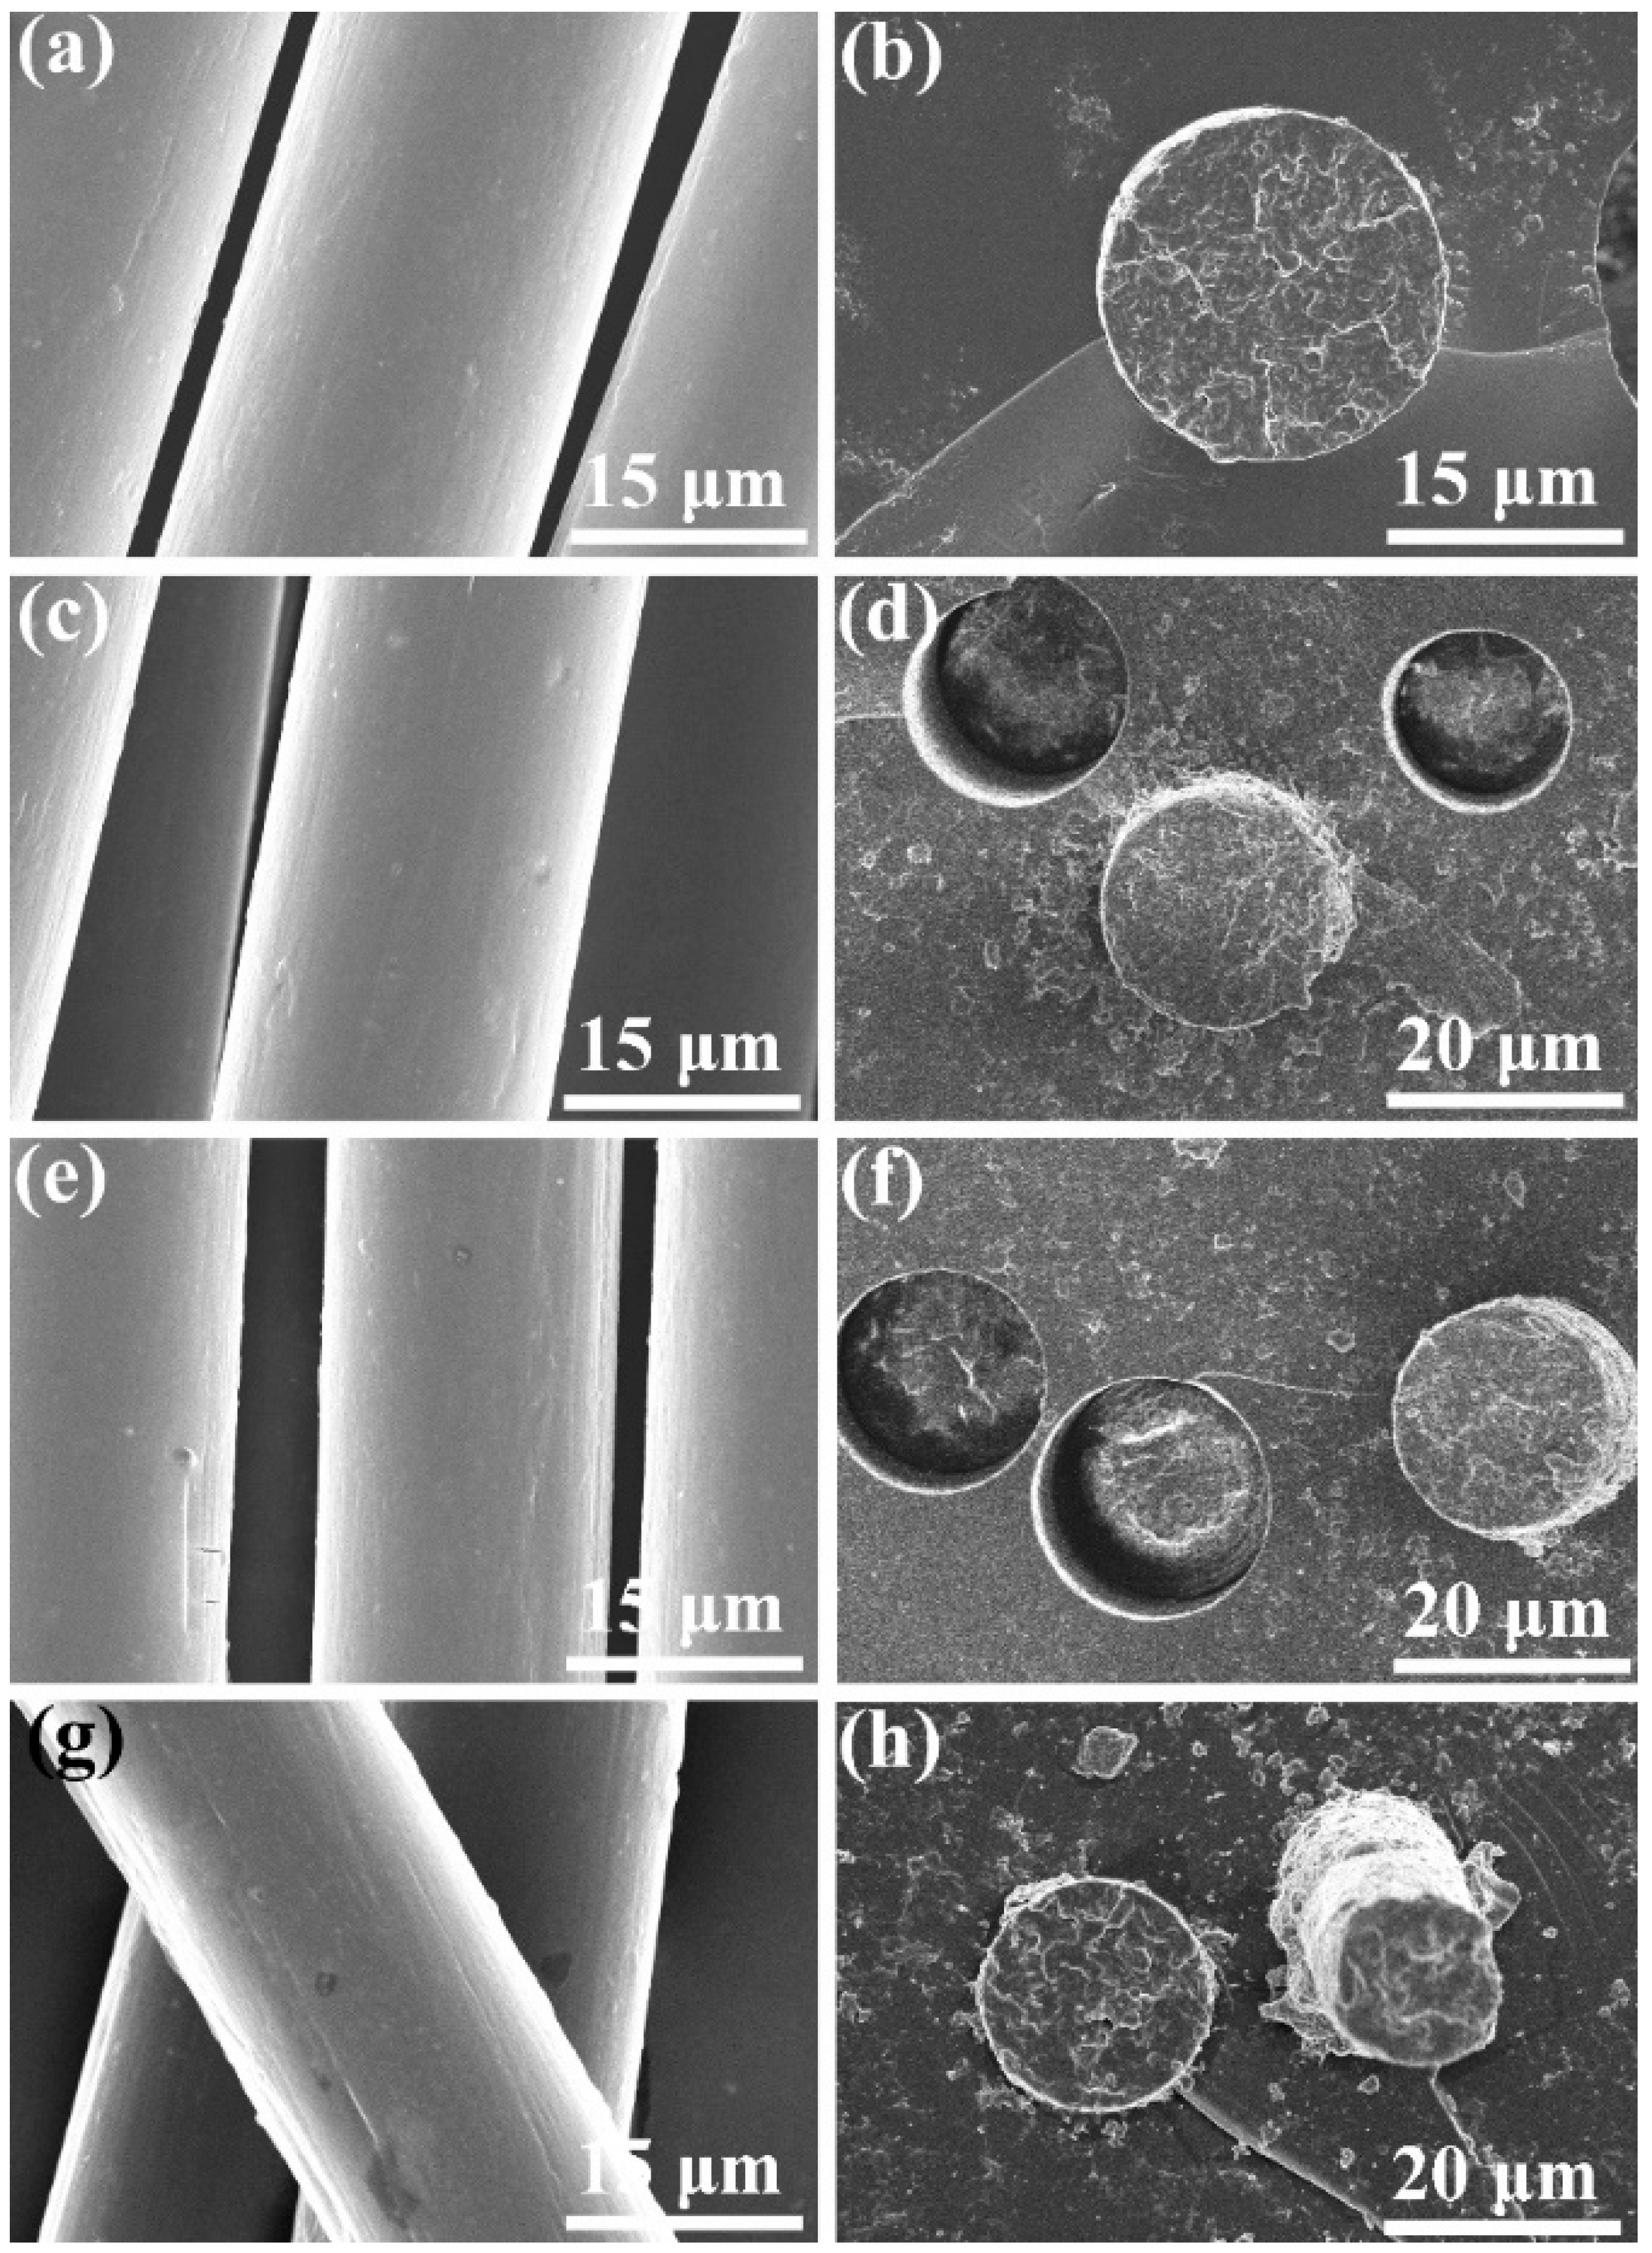
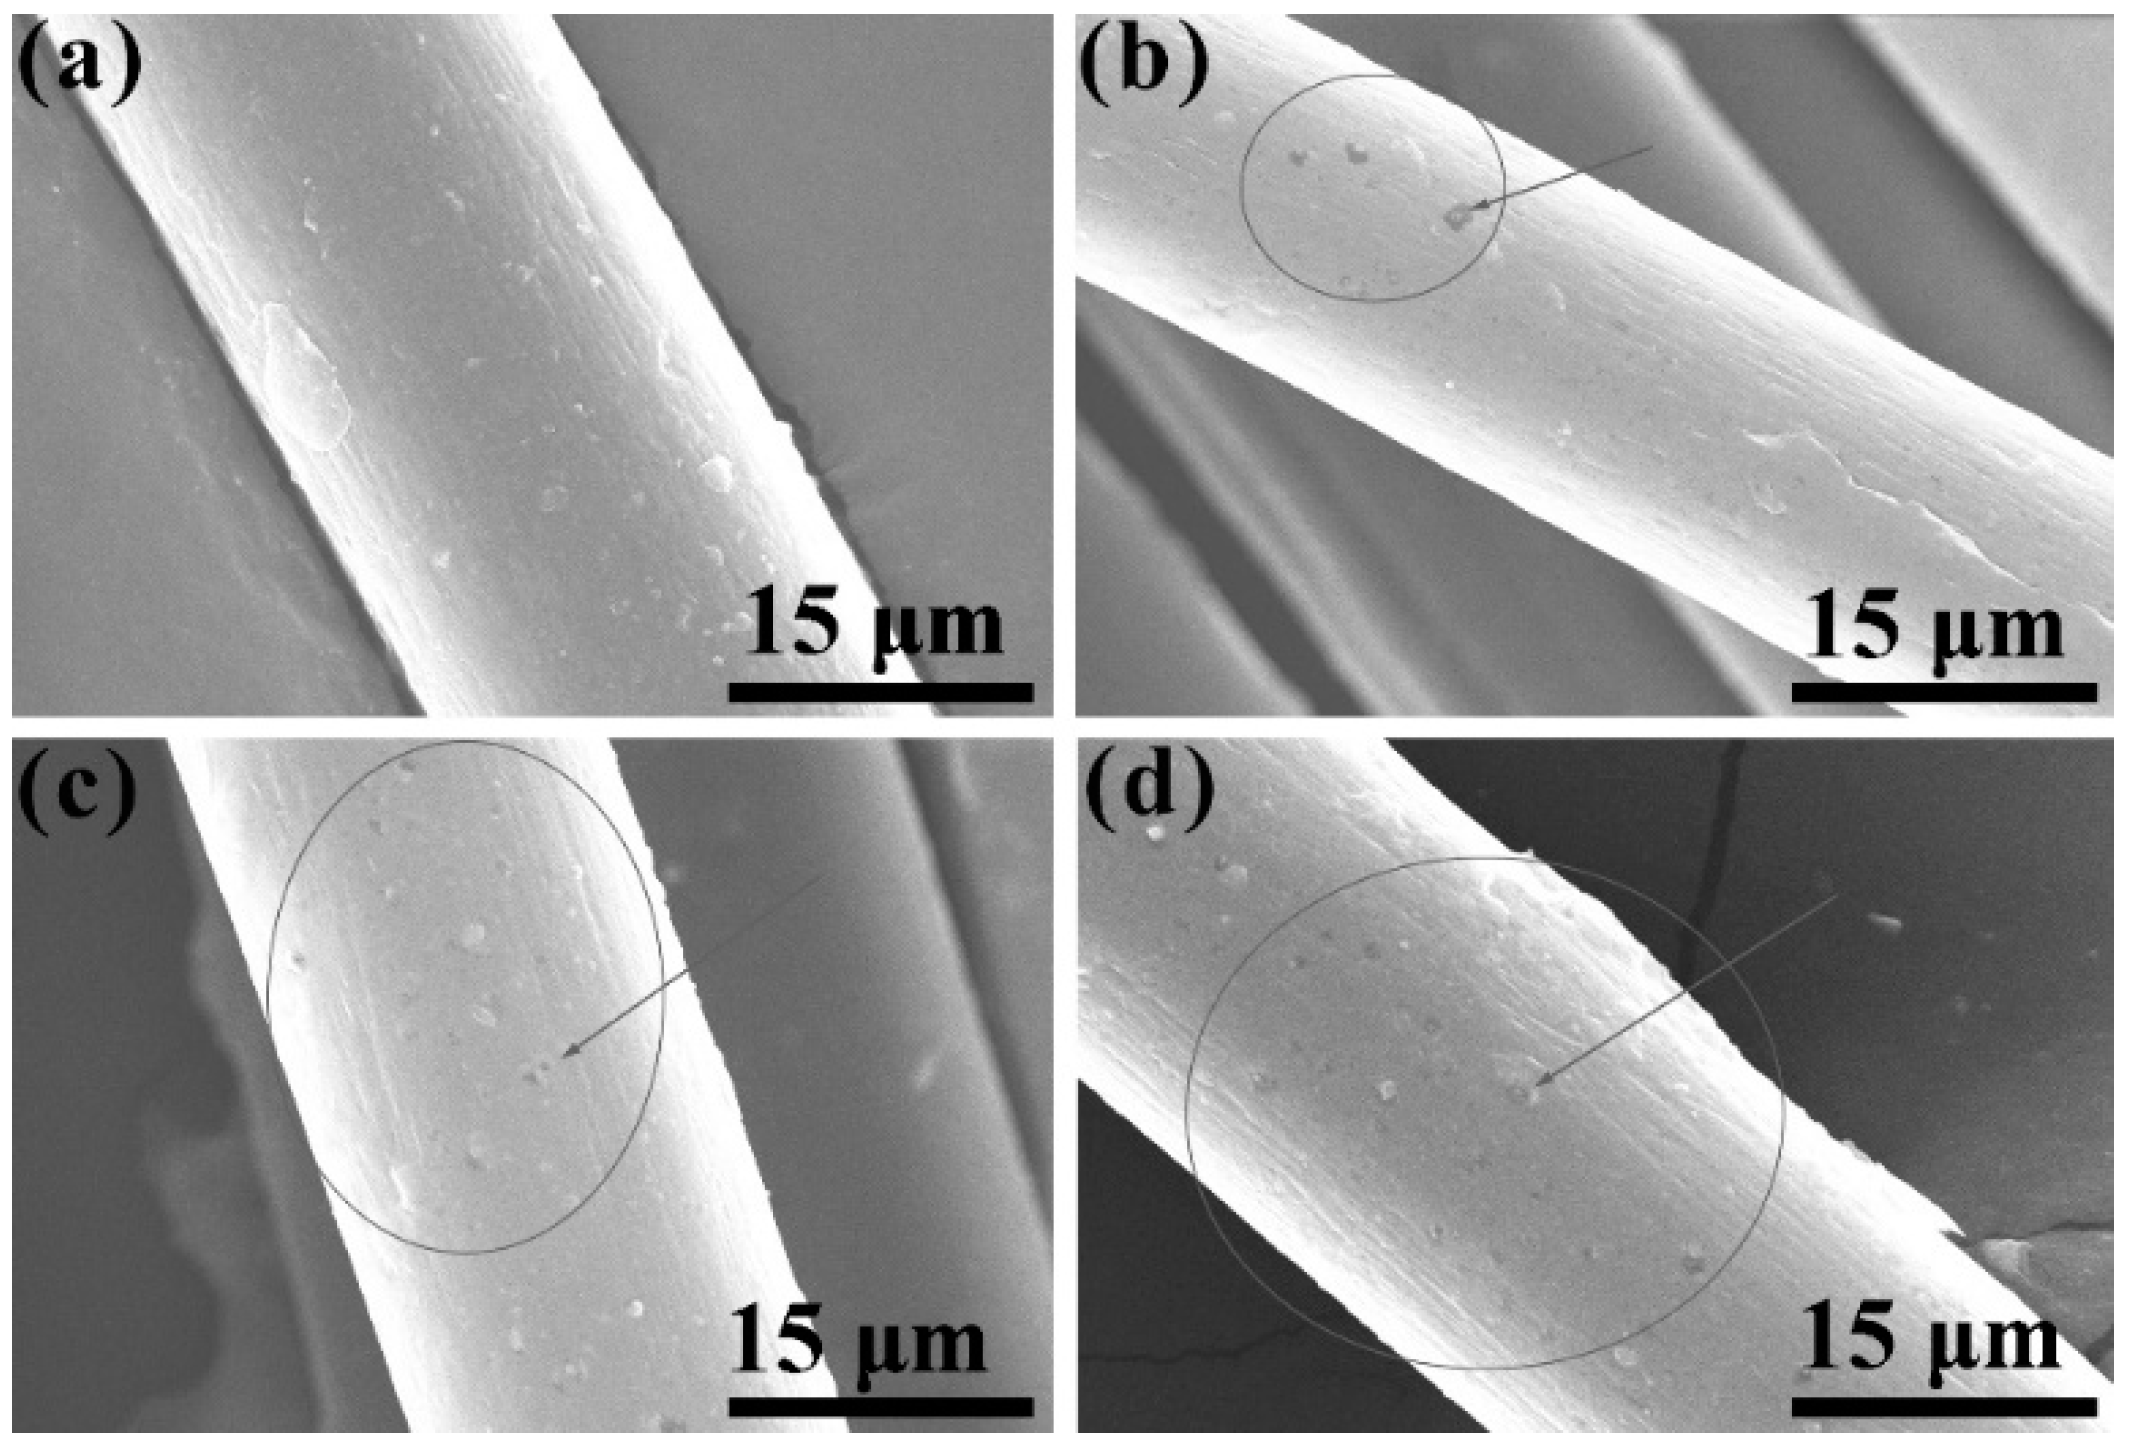
To further identify the morphology and microstructure of the bicomponent fibers, the profiles and transverse surfaces of fiber samples were observed by SEM, and the obtained micrographs are displayed in
Figure 6. As seen in
Figure 6a, POM fiber exhibits a smooth and clear surface almost with no collapse or grooves on the filament surface. Meanwhile, a compact texture can be observed on the transverse surfaces, and there are no microcracks and microvoids found, as seen in
Figure 7b, indicating the successful formation of POM fiber under the current melt-spinning and post-drawing technologies. The filament diameter of POM fiber is determined as approximately 18 μm according to the transverse morphology in
Figure 6b. On the other hand, the bicomponent fibers are also found to display a smooth surface morphology with few of defects; however, a small quantity of speckles can be noted on the surface of the bicomponent fibers obtained from the blends containing 20 wt % PLLA due to the coagulation of the PLLA phase on the filament skin caused by exclusion of POM crystallites during the annealing process of as-spun fibers [
48]. Nevertheless, the bicomponent fibers still present a compact and homogenous texture as observed from the SEM micrographs of transverse surfaces in
Figure 6d,f, and h, and there is no distinguishable defect or phase separation found on their transverse surfaces. Moreover, the filament diameters of three bicomponent fiber samples are found to be similar with each other, and can be determined as 18–20 μm. In summary, the morphological observations confirm that the bicomponent fibers have been successfully fabricated by melt spinning and post drawing due to the partial miscibility between POM and PLLA.
3.3. Crystallization Characteristics and Orientation Structure
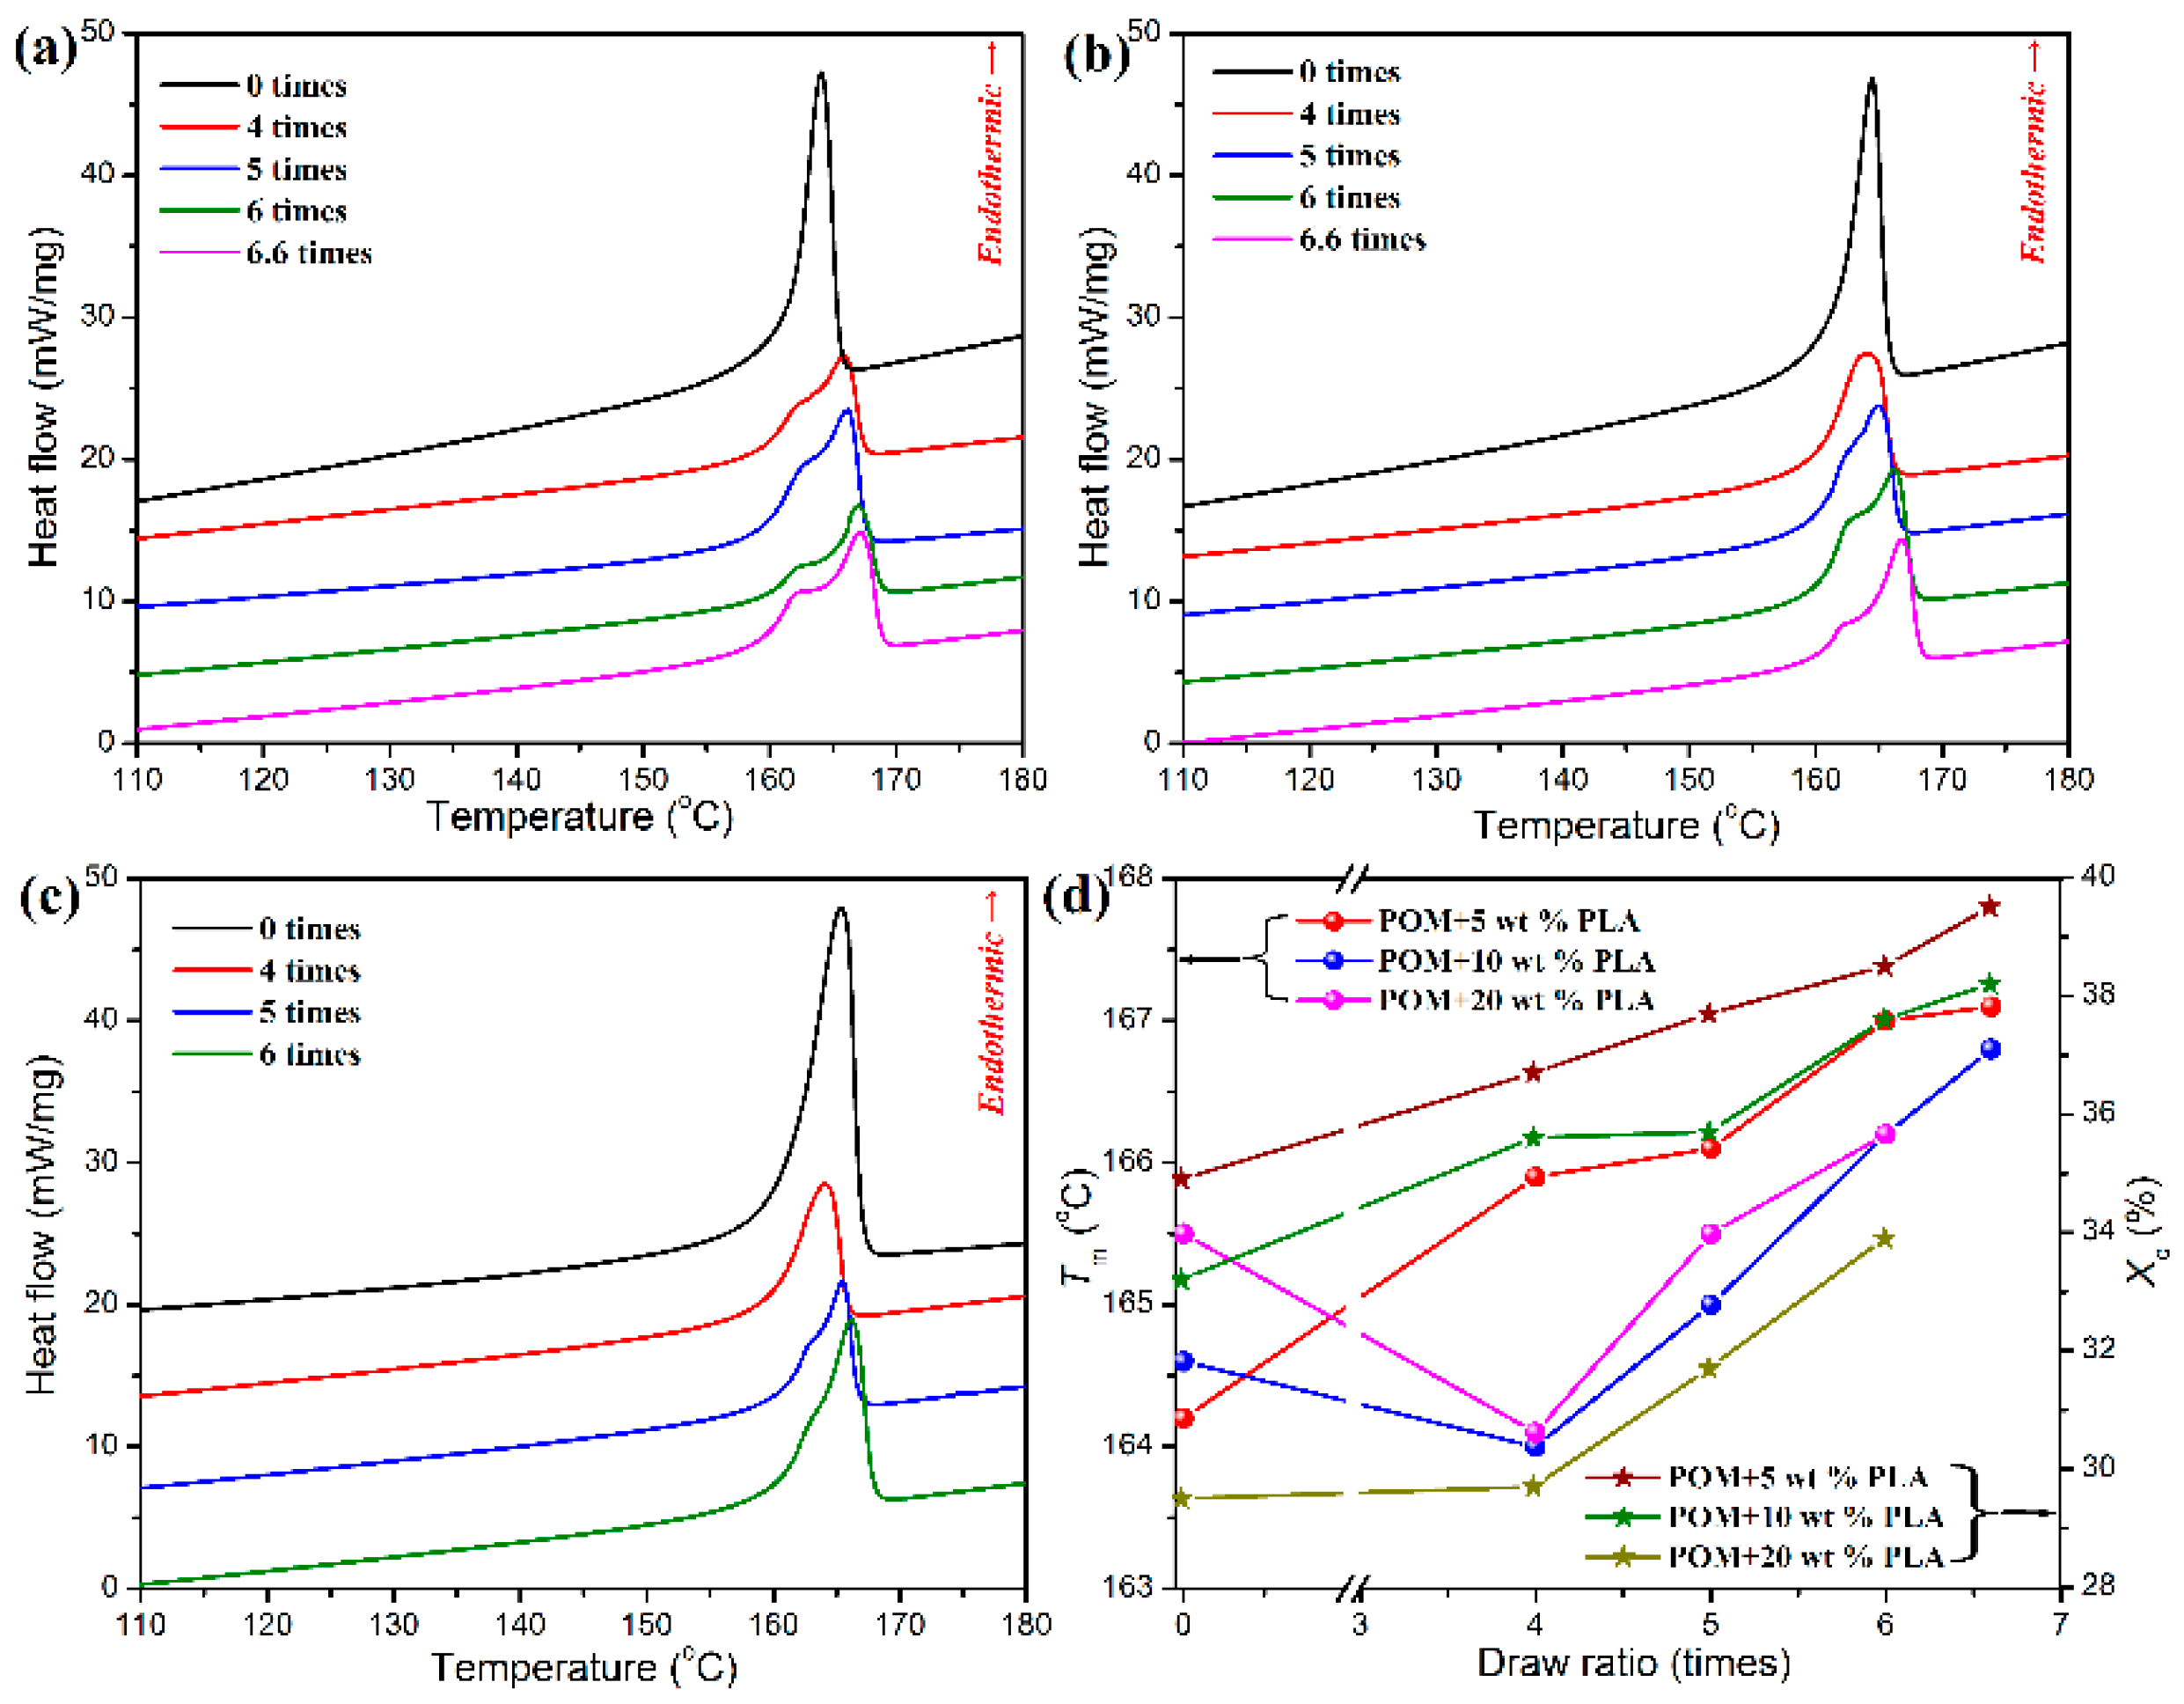
Although the bicomponent fibers could be well melt spun by using the POM/PLLA blends containing 5, 10, and 20 wt % PLLA, the three fiber samples are found to undertake different ultimate draw ratios during the post-drawing process. Actually, the bicomponent fibers containing 5 and 10 wt % PLLA can undergo an ultimate draw ratio of 6.6 times, whereas the bicomponent fiber containing 20 % PLLA can merely be drawn ultimately by 6.0 times. This phenomenon may be associated with the crystallization characteristics of bicomponent fibers. The crystallization histories of the bicomponent fibers at different draw ratios can be reflected by their melt behaviors recorded in the DSC heating thermograms as shown in
Figure 7a–c. It is important to note in these DSC thermograms that the post-drawn bicomponent fibers exhibit different melting behaviors from the as-spun ones. All of the as-spun bicomponent fibers only show a single endothermic peak in their DSC thermograms. As confirmed by the aforementioned melting behavior of POM/PLLA blends, only the POM matrix is able to perform crystallization due to the poor crystallinity of PLLA disperse phase in the matrix. Such a single endothermic peak is attributed to the melting process of the POM domain in the bicomponent fibers. It is well known that a large number of folded-chain crystallites as well as a few of extended-chain crystallites are bound to form during the cooling process of as-spun semi-crystalline polymeric fibers [
7], whereas the occurrence of single melting peak implies a similar crystal size for the folded-chain crystallites of POM domain in the as-spun bicomponent fibers. Although the bicomponent fibers containing 5 and 10 wt % PLLA show a single melting peak in the DSC thermograms after post-drawn at a draw ratio of four times, a bimodal melting behavior is observed for other post-drawn bicomponent fibers at any draw ratios. Such a bimodal melting behavior is ascribed to the presence of the doublet crystal state of POM domain. Considering the more stable structure of extended-chain crystallites than the folded-chain ones, it is believable that the low-temperature endothermic peak is related to the folded-chain crystallites with a smaller lamellar thickness as well as to the imperfect crystallites, and the high-temperature one is associated with the extended-chain ones [
49]. The bimodal DSC thermograms were further numerically deconvolved to determine the real contribution of both endothermic components, and the resulting deconvolved curves are presented in
Figure S2 (see
Supplementary Materials). It is noticeable that, in the most cases, the contribution from the low-temperature endothermic component is improved with an increase of draw ratio, indicating an increase of the quantity of imperfect crystallites and a decrease of the lamellar thickness of folded-chain crystallites caused by the increased draw ratio.
The melting temperatures (
Tm’s) of bicomponent fibers obtained from DSC analysis are given in
Figure 7d. The post-drawn bicomponent fibers containing 5 wt % PLLA are found to show a continual improvement in melting temperature (
Tm) with an increase of draw ratio, indicating that a large number of folded-chain crystallites have transformed into the extended-chain crystallites during the post-drawing process for the as-spun bicomponent fibers [
8]. Nevertheless, there is a significant decline in
Tm for the bicomponent fibers containing 10 and 20 wt % PLLA at a draw ratio of four times, and then the
Tm’s of the two fiber samples tend to increase with the increasing content of PLLA. This phenomenon may be due to the production of imperfect crystallites resulting from high PLLA loadings in the bicomponent fibers during the initiate drawing stage, followed by the presence of a quantity of extended-chain crystallites under a further hot-drawing condition.
Figure 8d shows the degrees of crystallinity of POM phase in the bicomponent fibers at different draw ratios. It is notable that all of the bicomponent fibers exhibit an upward trend in degrees of crystallinity with an increasing of draw ratio, which is attributed to the stress-induced crystallization. However, such a stress-induced crystallization effect seems to be not so significant for the bicomponent fibers containing 20 wt % PLLA at the draw ratio of four times because of the disturbance of PLLA phase. Only a higher draw ratio can compensate the stress-induced crystallization on the POM domain, thus leading to an improvement in degree of crystallinity for the bicomponent fibers at a higher content of PLLA.
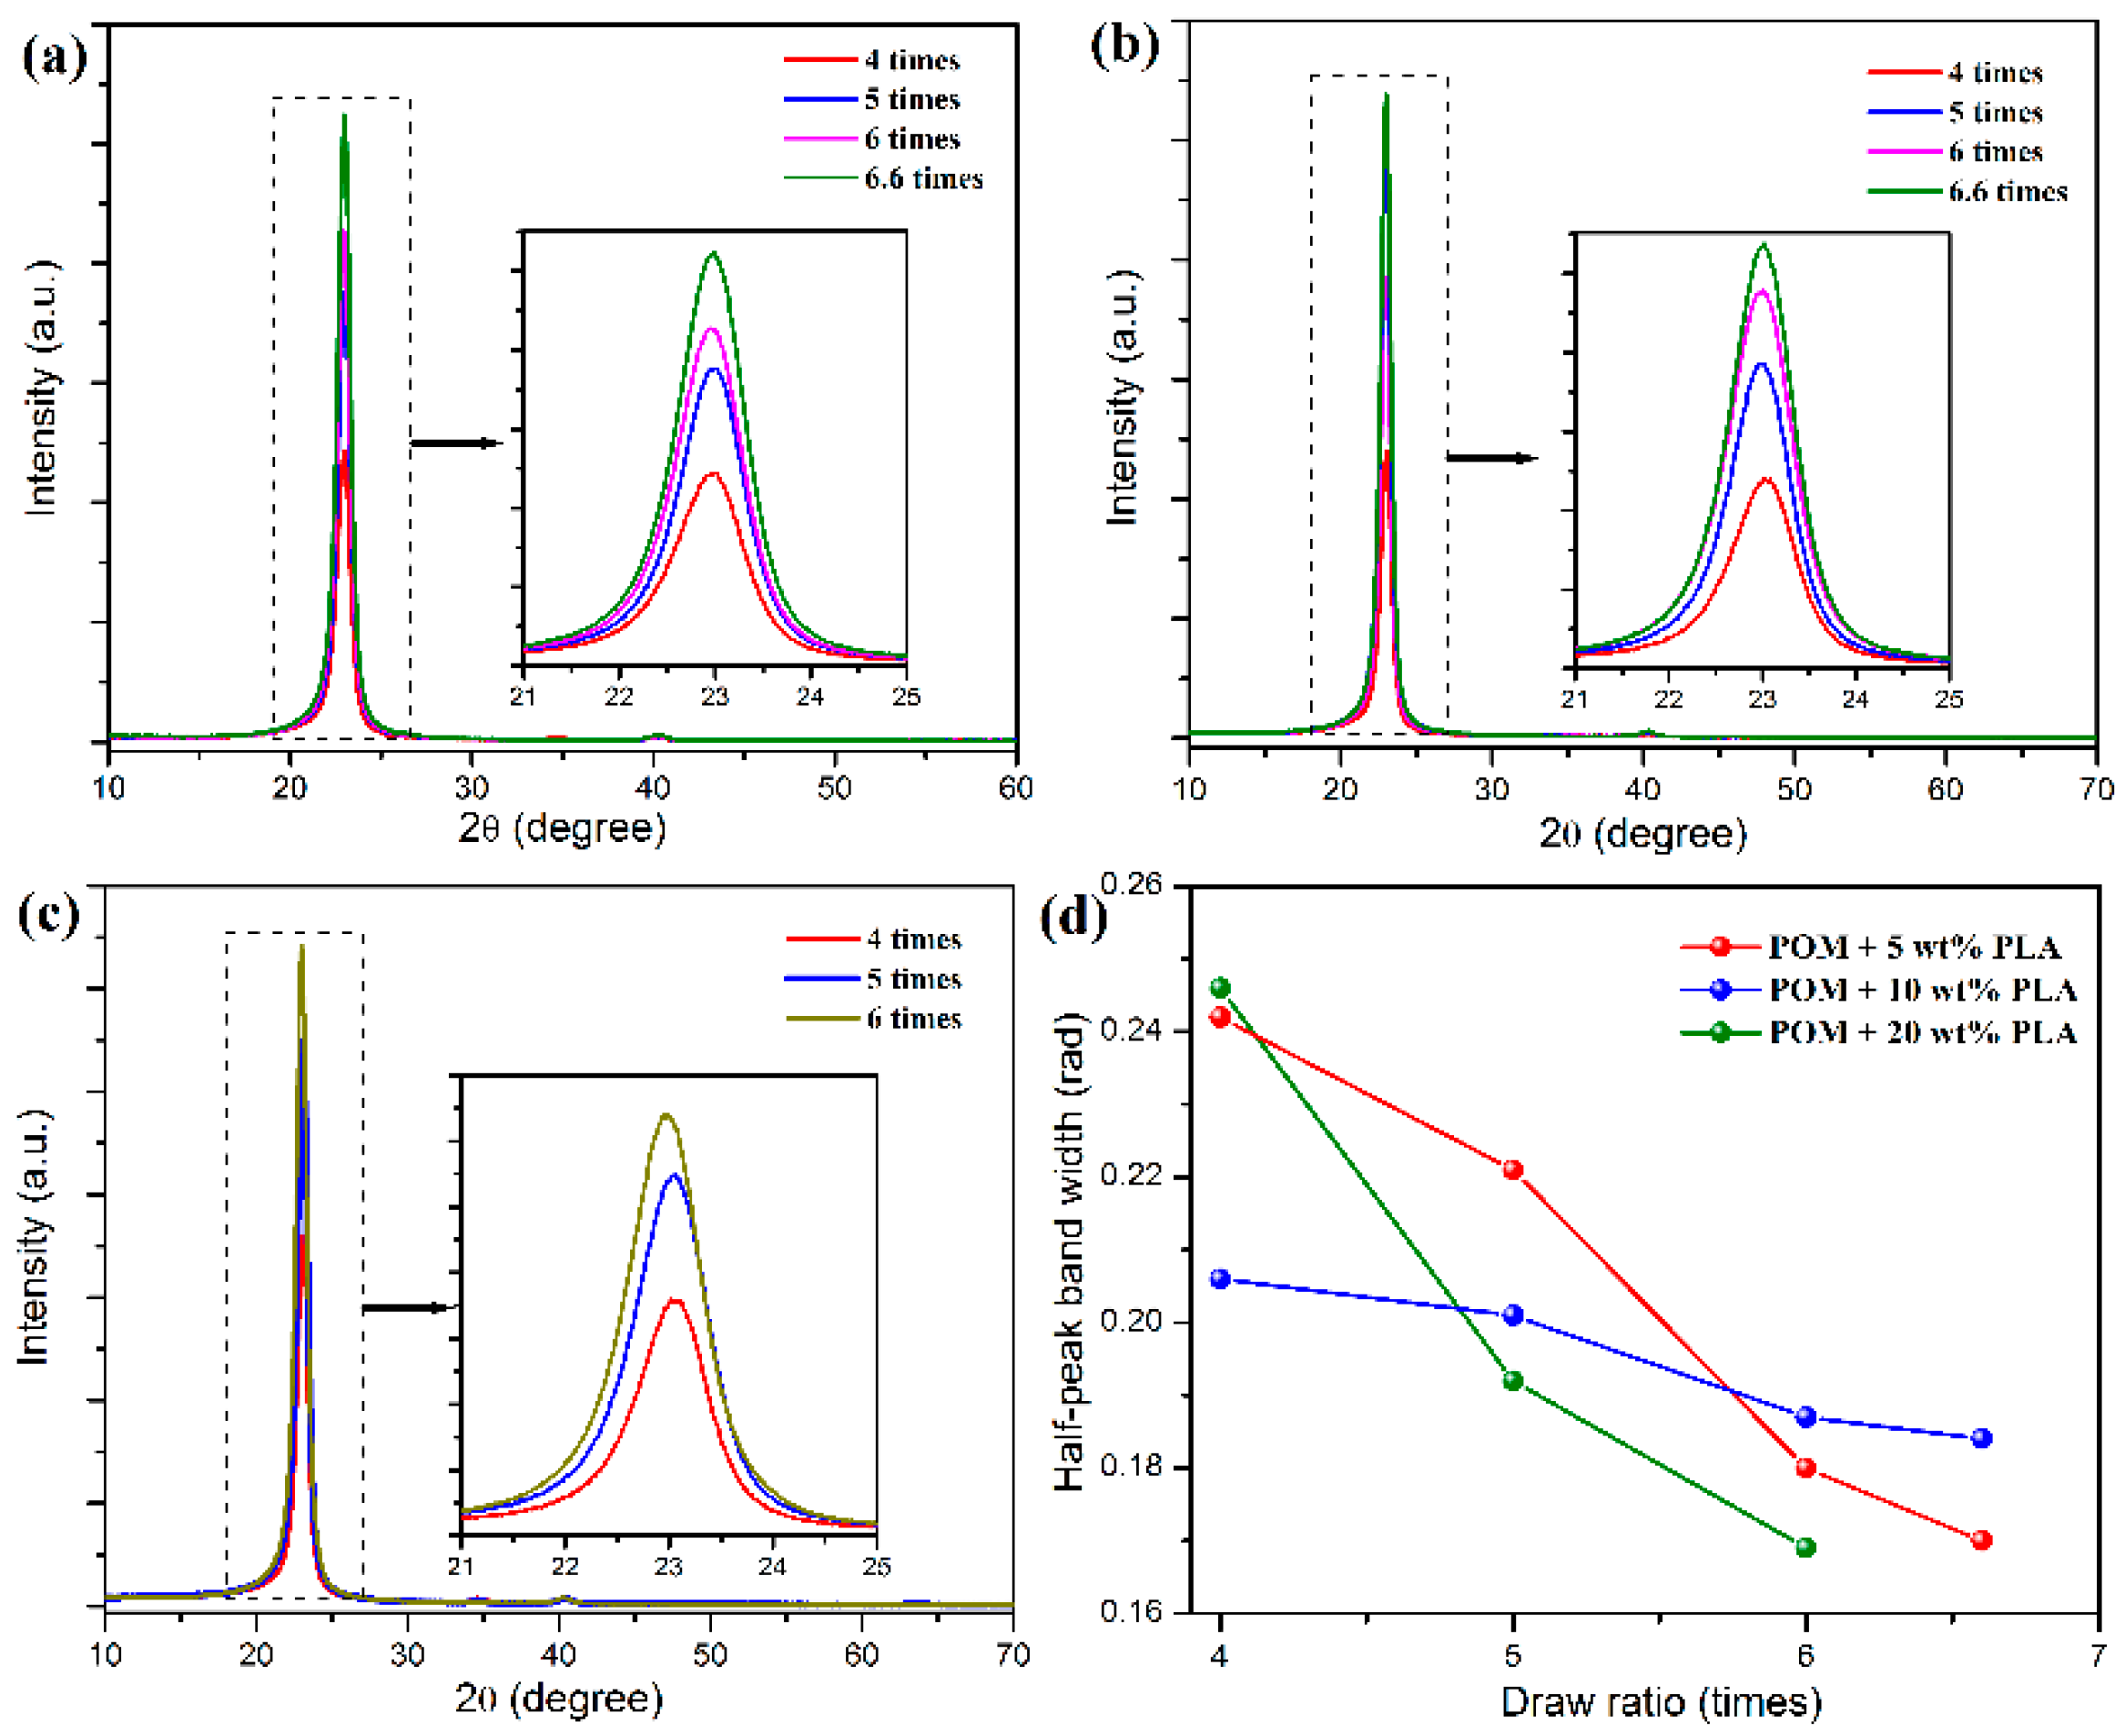
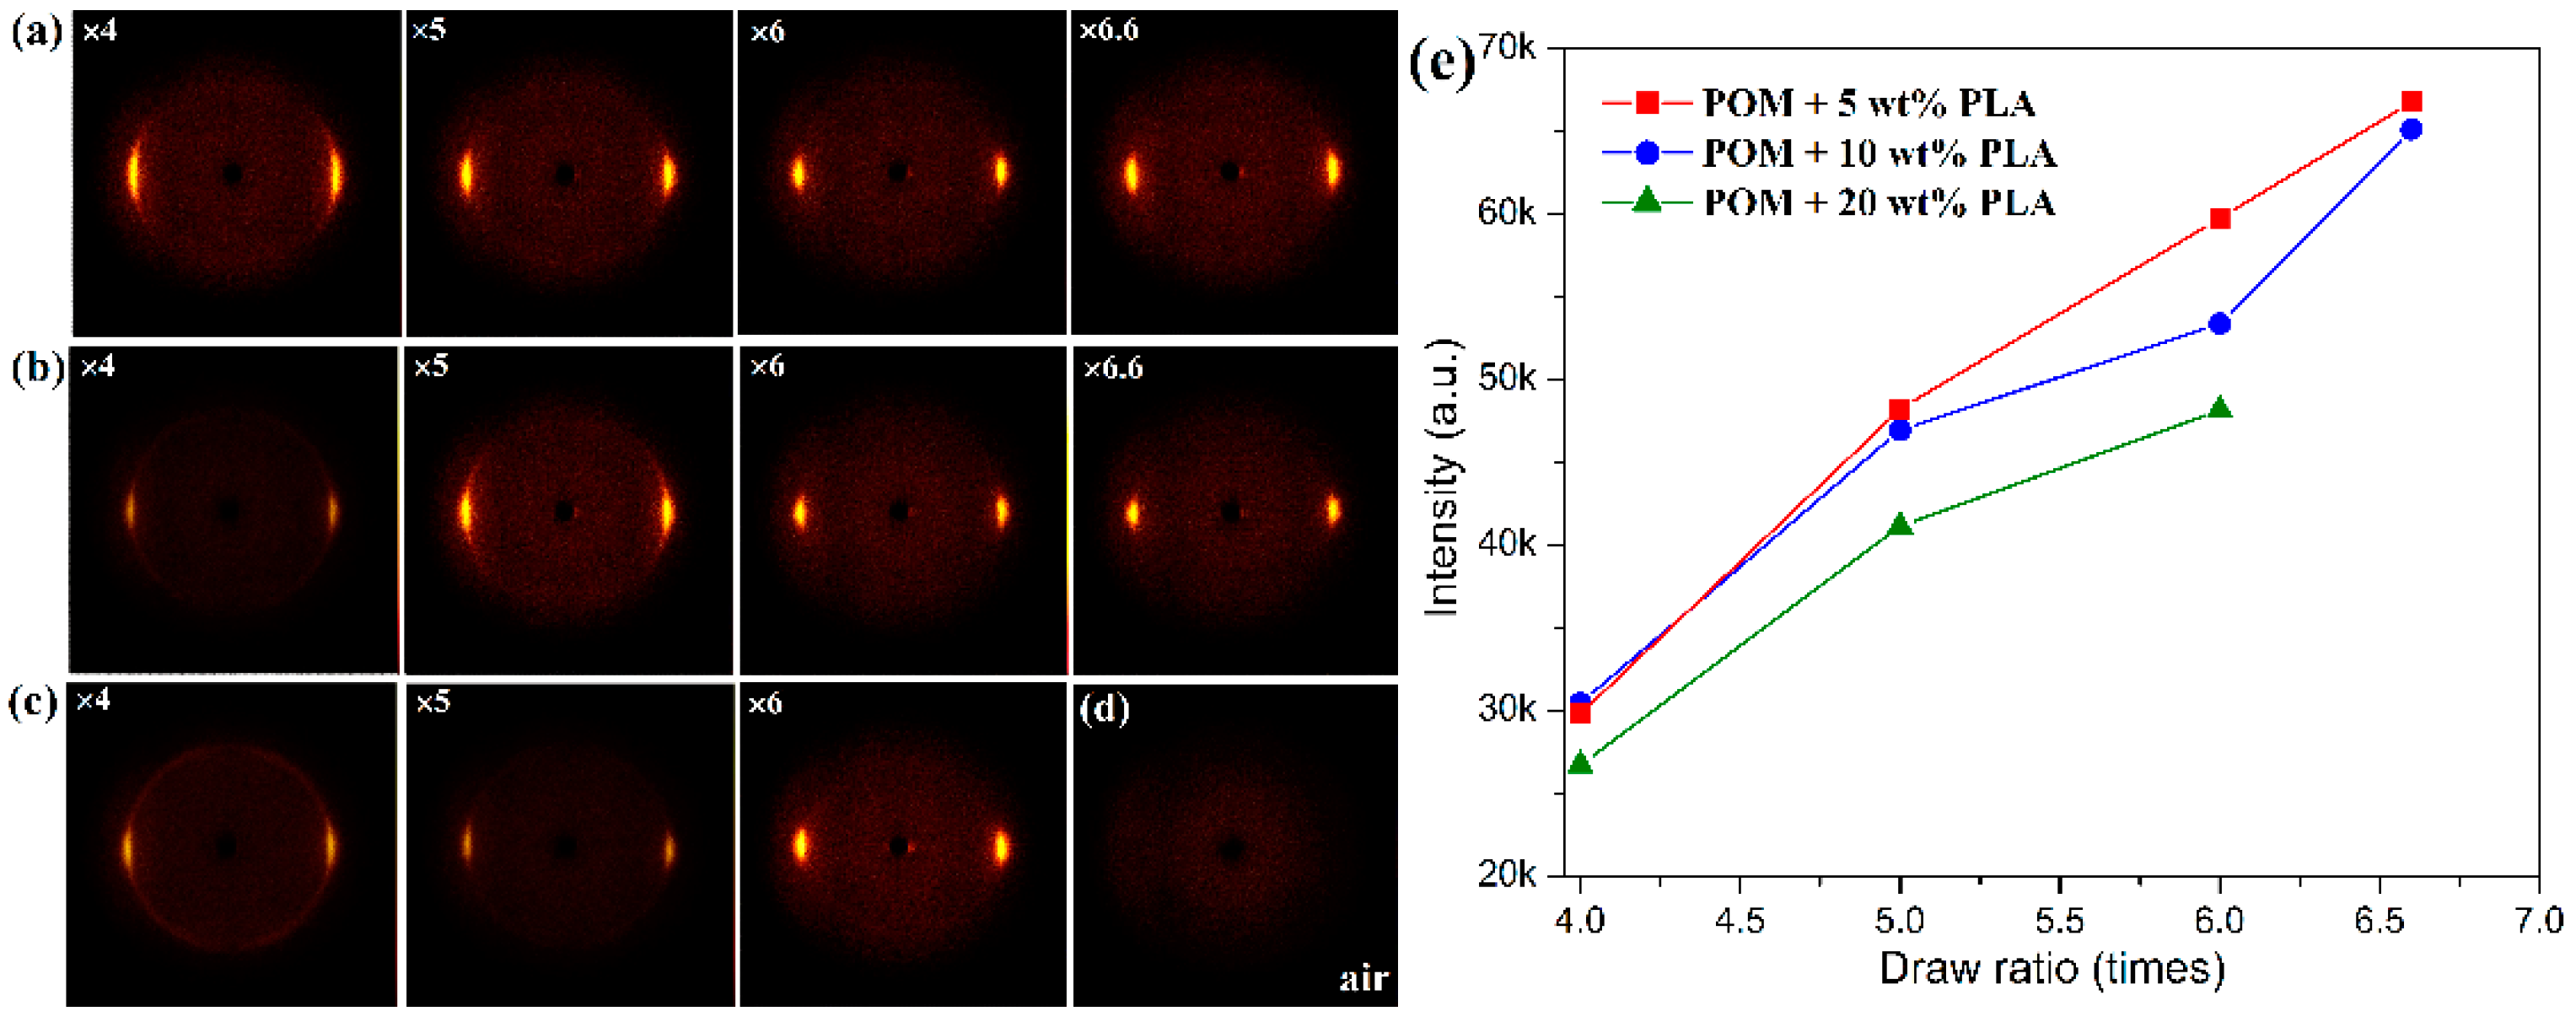
The characteristic crystallization structures of POM/PLLA bicomponent fibers at different draw ratios were identified by 2D X-ray diffraction, and the 2D WAXS patterns and the recorded azimuthal intensity distributions on the equator plane of registered images are illustrated in
Figure 8 and
Figure 9, respectively. It is clearly observed in
Figure 8a–c that the shape of the scattering in the 2D WAXS patterns varies significantly with an increase of draw ratio. The 2D WAXS patterns exhibit a combination of a strong maximum on the equator and a weak scattering ring, indicating the occurrence of orientation of POM crystals along the draw direction. Furthermore, the strong maximum is ascribed to the diffraction of the particular Bragg angle of 23.05° for the (100) reflection. The brightness of the scattering ring is found to decrease and disappear at the ultimate draw ratio due to the reduction of diffraction intensity at the other reflection. Finally, only two bright arcs or spots intersecting the equator and extending systematically above and below the equator are observed in the 2D WAXS patterns. It is also noted in
Figure 9a–c that an intensive diffraction peak could be observed at 2θ = 23.05° from the azimuthal intensity distributions on the equator plane, which is assigned to the (100) reflection of the crystals of the POM domain. The diffraction intensity of the (100) plane is directly associated with the uniaxial crystalline orientation level of the POM crystals. It is discernible from the inserts of this figure that the diffraction intensity on the (100) reflection tends to be enhanced continuously by improving the draw ratio for all of the bicomponent fibers. The diffraction peak width of three fiber samples is also found to become smaller with an increase of the draw ratio due to the improvement of the continuity level in the alignment of crystallites along the draw direction, as observed in
Figure 9d [
50]. Moreover,
Figure 8e shows the diffraction intensity at the (100) reflection for the bicomponent fibers at the different draw ratios. It is observed that the diffraction intensity at the (100) reflection tends to increase with an increase of the draw ratio, indicating an enhancement of orientation level along the draw direction. These results indicate that the lamellar crystallites of POM domain are preferentially oriented perpendicular to the draw direction with a small portion of isotropic macromolecules. Furthermore, the brightening arcs or spots implicates that the bicomponent fibers gain a high degree of orientation due to the strain-induced reorganization of lamellar crystallites in the POM domain caused by uniaxial drawing [
51]. Such a high orientation level may facilitate to endow the POM/PLLA bicomponent fibers with a high elastic modulus and high tensile strength.
According to the crystallographic study, the POM crystal normally has a hexagonal structure with the unit cell dimensions of
a =
b = 4.45 Å and
c = 17.3 Å, their molecular chains are arranged in a 9/5 helix, where the
a– and
b–axes of the crystal are located on the same plane and its
c–axis is perpendicular to that plane [
52]. Some important information about crystalline orientation can be provided by the 2D XRD characterization for the drawn bicomponent fibers. It was reported that the crystalline orientation factor (
fc) along the draw direction could be determined quantitatively by the Hermans orientation model as generalized to a set of three crystallographic axes, and it could be expressed by the following equation [
53]:
where <cos
2ϕ> is the mean-squared cosine of the angle between the reference crystallographic axis and the selected reference direction (fiber
c–axis) for a fiber sample. For a uniaxially oriented polymeric fiber, the value of <cos
2ϕ> can be calculated by the following equation [
7,
50]:
where
I(
ϕ) is the relative intensity scattered from the (
hkl) reflections which are normalized to the
c–axis through the Gaussian fitting. As for the drawn bicomponent fibers, the (100) reflection corresponding to the
c–axis can be used to calculate the
c–axis crystalline orientation factor (
fc) [
54]. Considering the hexagonal structure and uniaxial symmetry of the unit cell, the orientation factors of the
a- and the
b-crystallographic axes are identical to each other (
fa =
fb). Since
fa +
fb +
fc = 2
fa +
fc = 0, the uniaxial crystalline orientation factors of the bicomponent fibers can be determined by an azimuthal scan of the (100) reflection at 2θ = 23.05°.
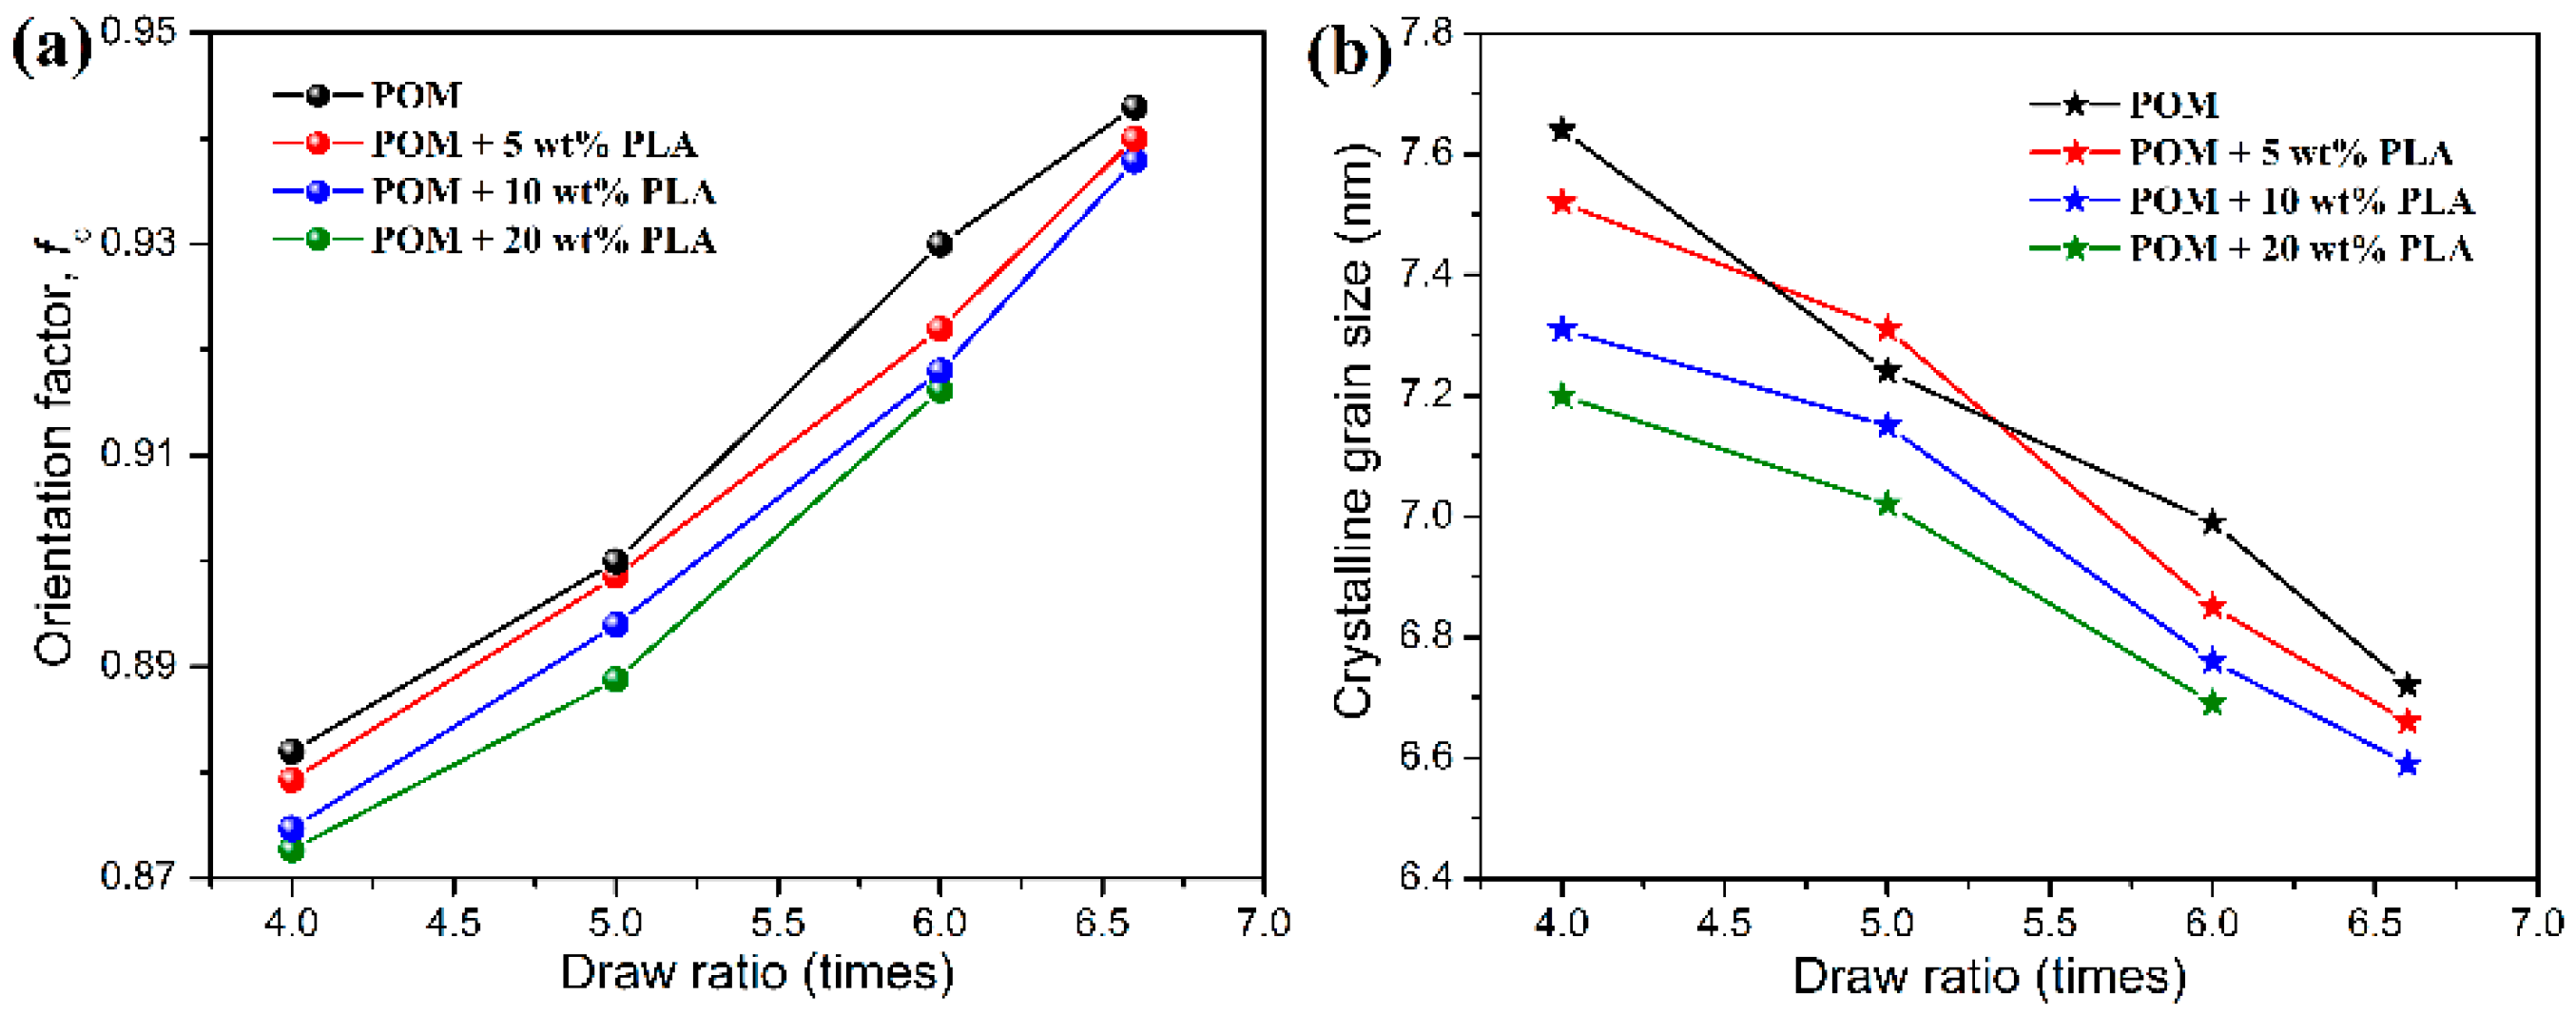
Figure 10a shows the uniaxial crystalline orientation factors of pure POM fiber and POM/PLLA bicomponent fibers at different draw ratios. As seen in
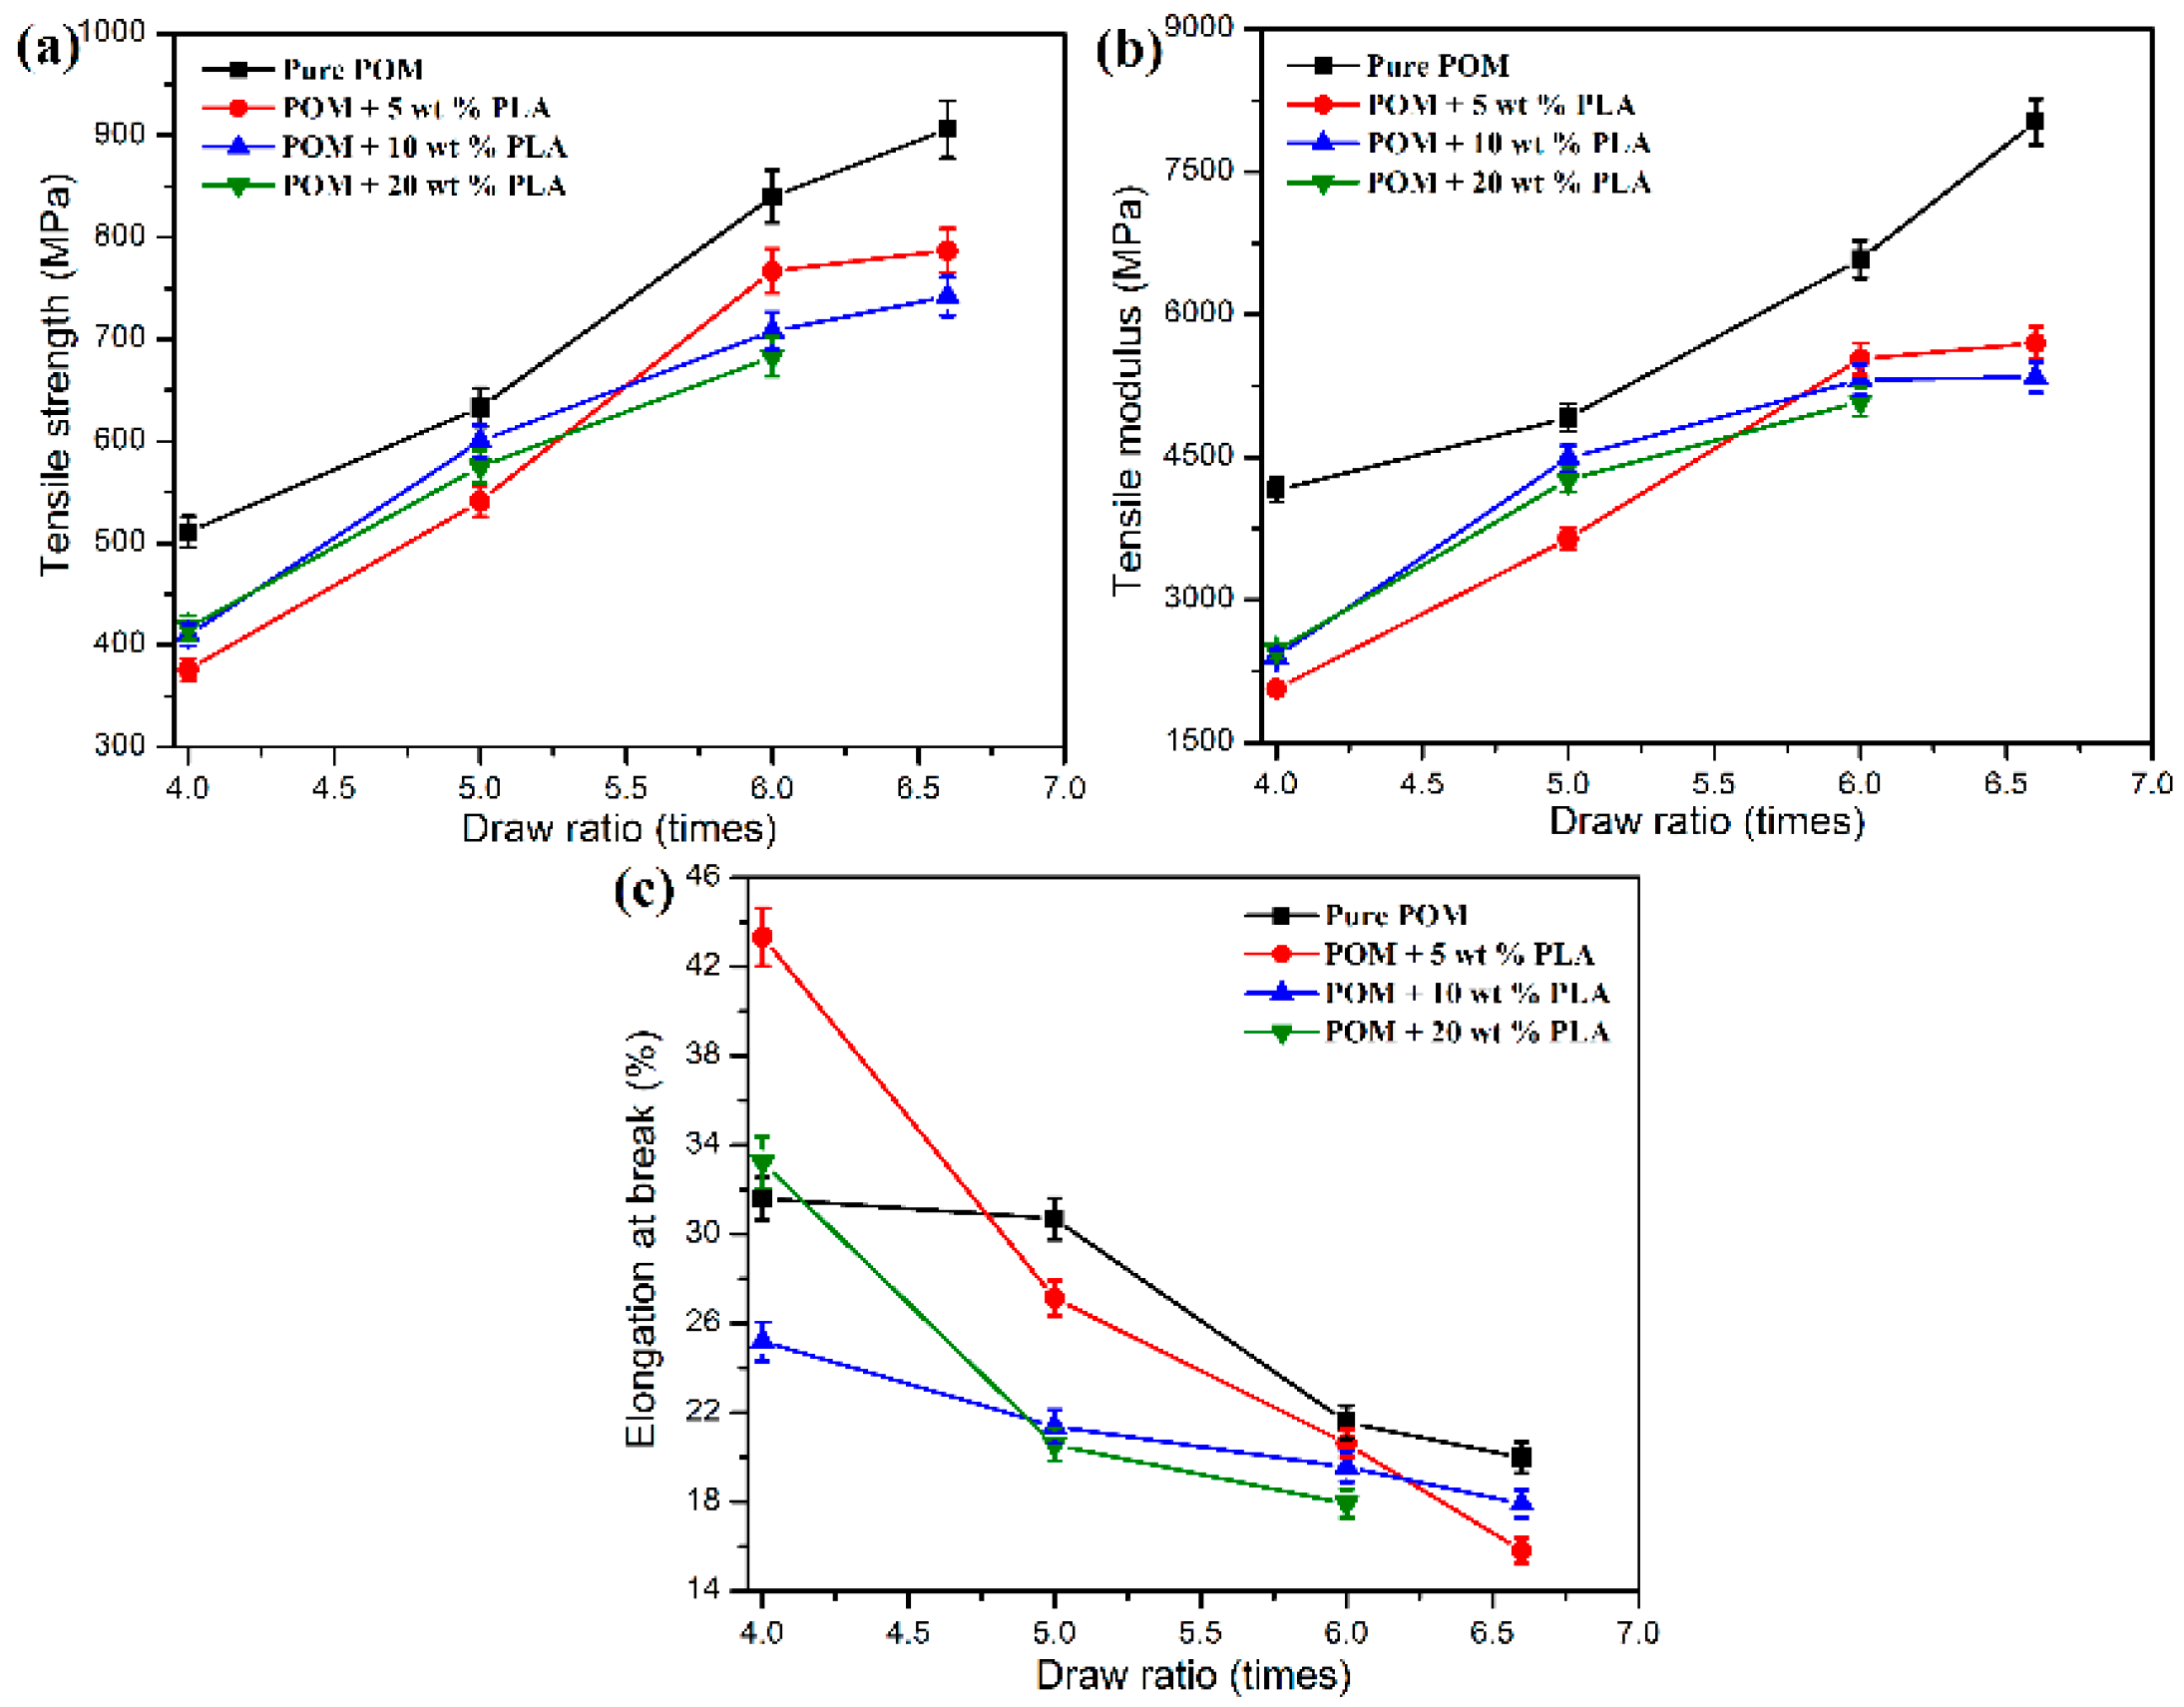
Figure 10a, both pure POM fiber and the bicomponent fibers are found to exhibit a continual increase of crystalline orientation factor with the increasing draw ratio, indicating that the crystalline orientation of lamellar folded-chain crystallites in the POM phase occurs under uniaxial stretching. The higher draw ratio can promote a greater level of crystalline orientation and therefore leads to a continual increase in crystalline orientation factor for pure POM fiber and the bicomponent fibers. It is interestingly observed that the bicomponent fibers have smaller orientation factors compared to pure POM fiber at the same draw ratio, and however the bicomponent fibers with a lower content of PLLA present a greater orientation factor. This result suggests that the higher PLLA content not only can suppress the crystalline packing of the POM phase, but also that it can hinder the stress-induced orientation of the lamellar folded-chain crystallites, thus restraining the increase of crystalline orientation level for the bicomponent fibers.
Besides the crystalline orientation factor, the crystalline grain size can also be calculated by the Scherrer’s equation according to the Bragg diffraction angle and full width at half maximum of diffraction peak obtained from WAXD patterns. The Scherrer’s equation is well known as a primary model to determine the lamellar thickness in polymeric crystallites and can be expressed as [
55,
56]:
where
Lhkl represents the mean size of the ordered crystalline domains almost equal to the crystalline grain size,
K the dimensionless shape factor generally taken as 0.89,
λ the applied
X-ray wavelength,
θ the Bragg angle, and
β is the full width at half maximum diffraction intensity.
Figure 10b shows the crystalline grain sizes corresponding to the (100) reflection of POM crystals in pure POM fiber and POM/PLLA bicomponent fibers at different draw ratios. As observed in
Figure 10b, the crystalline grain size is found to decrease gradually with an increase of draw ratio, indicating that the post-drawing process leads to the rupture of crystallites and then the slippage of the lamellar folded-chain crystallites in the crystallites [
56]. It is understandable that a higher draw ratio can promote the more significant slippage of crystallites, thus leading to a smaller crystalline grain size and higher orientation level. In addition, it is also found that the bicomponent fibers at a higher PLLA loading exhibit a smaller crystalline grain size at the same draw ratio. This can be explained by the fact that the high PLLA loading can depress the growth of crystallites in the bicomponent fibers during the post-drawing process, thus reducing the crystalline grain size accordingly.
3.5. Hydrolytic Degradation Behavior
The hydrolytic degradation measurement was conducted as an accelerated simulation experiment to evaluate the biodegradability of POM/PLLA bicomponent fibers. It has been reported that the degradation of PLLA is primarily due to the hydrolysis of the ester linkages, which occurs more or less randomly along its macromolecular backbone according to the following diffusion-reaction mechanism [
57]: the water penetrates the PLLA matrix and simultaneously converts the long molecular chain to low-molecular-weight water-soluble oligomers and finally the given monomers. The resultant degradation products have an increased density of polar groups (hydroxyl and carboxyl) compared to the initial polymer and induce an enhanced water affinity promoting the degradation reaction. Meanwhile, the ester bond hydrolysis can be auto-catalyzed by any carboxylic end groups initially formed during the hydrolysis process. As for the POM/PLLA bicomponent fibers, the hydrolysis of PLLA domain can produce the microvoids within the filaments, thus leading to the collapse and pulverization of filaments. As a result, the partial biodegradability is achieved for the bicomponent fibers.
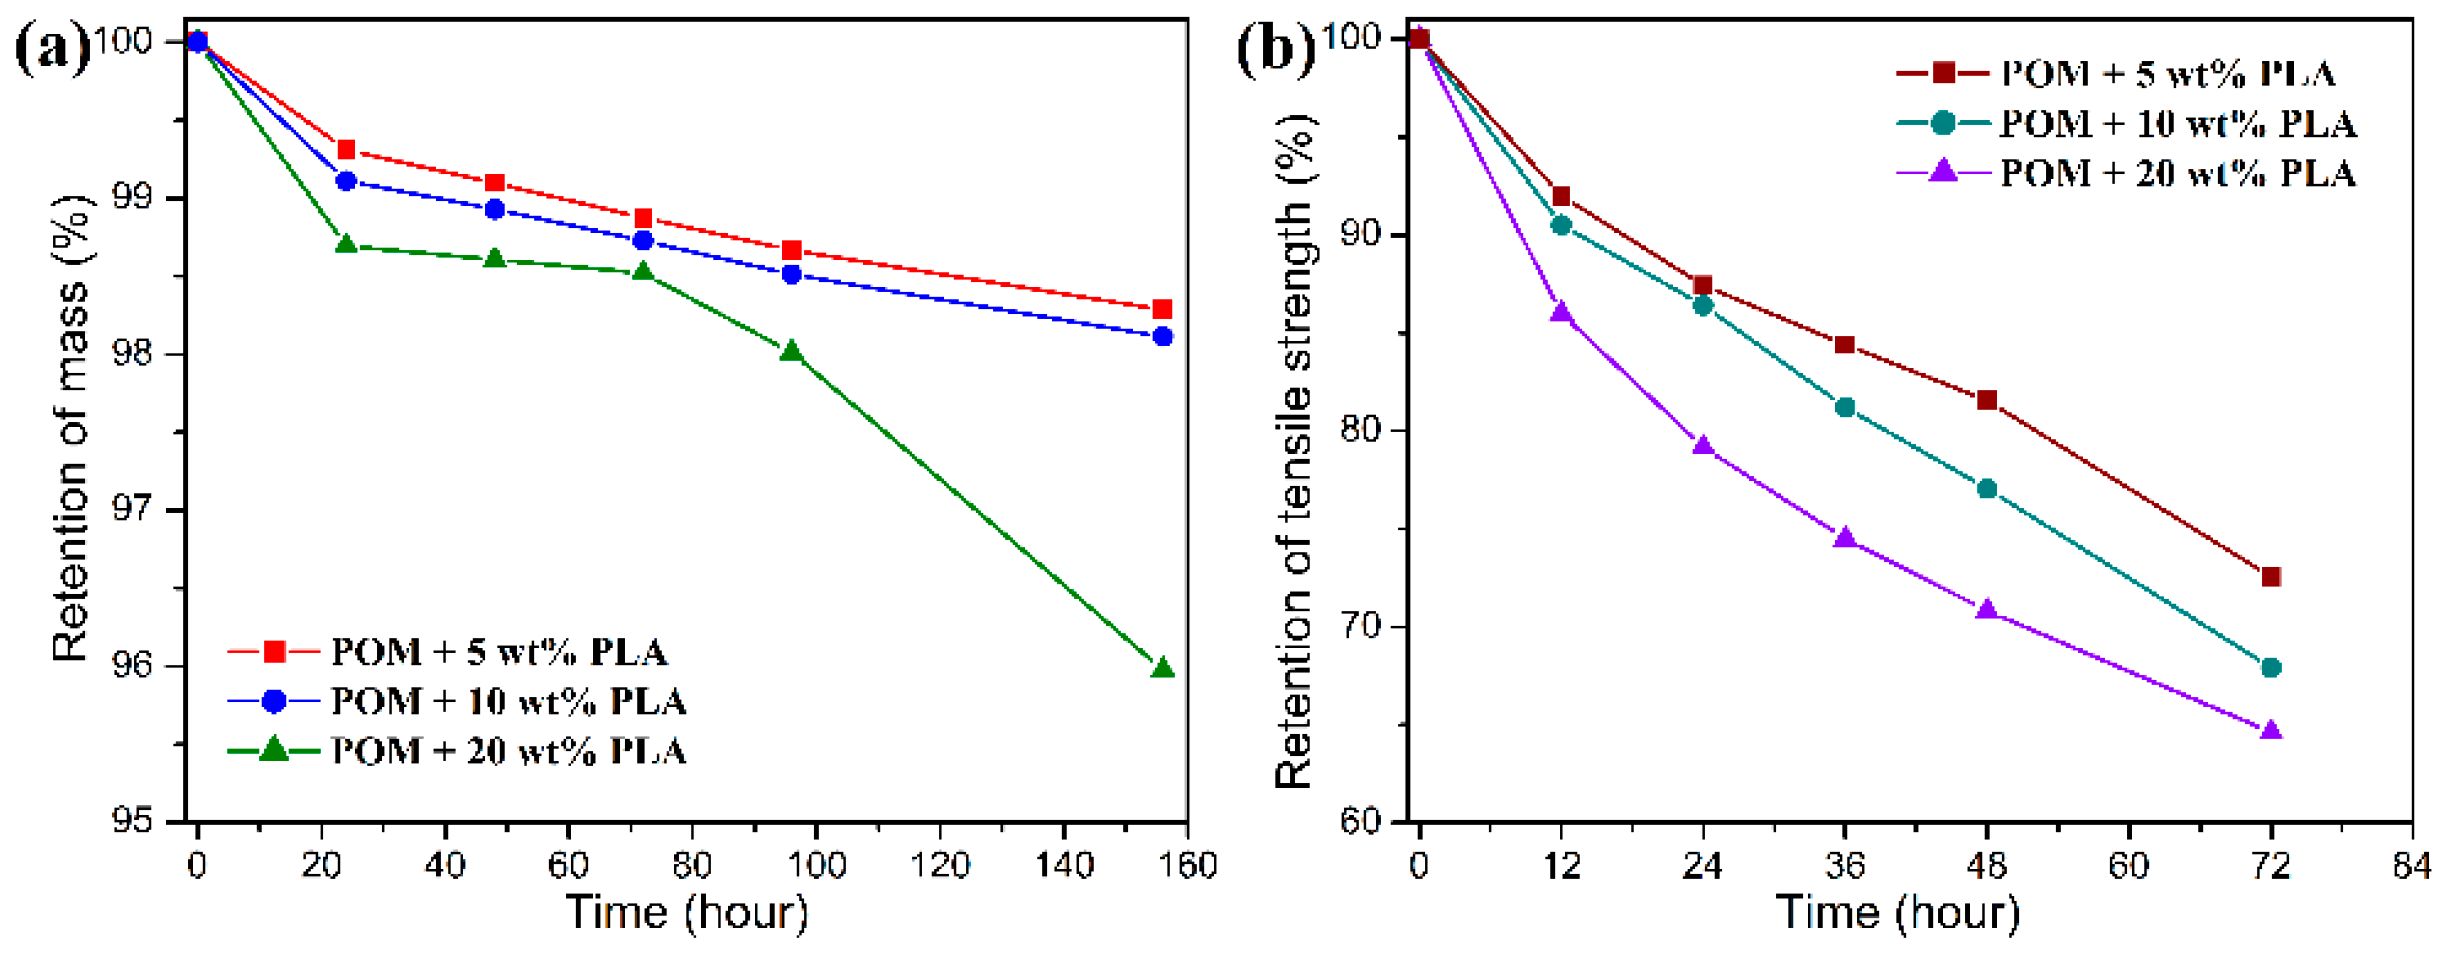
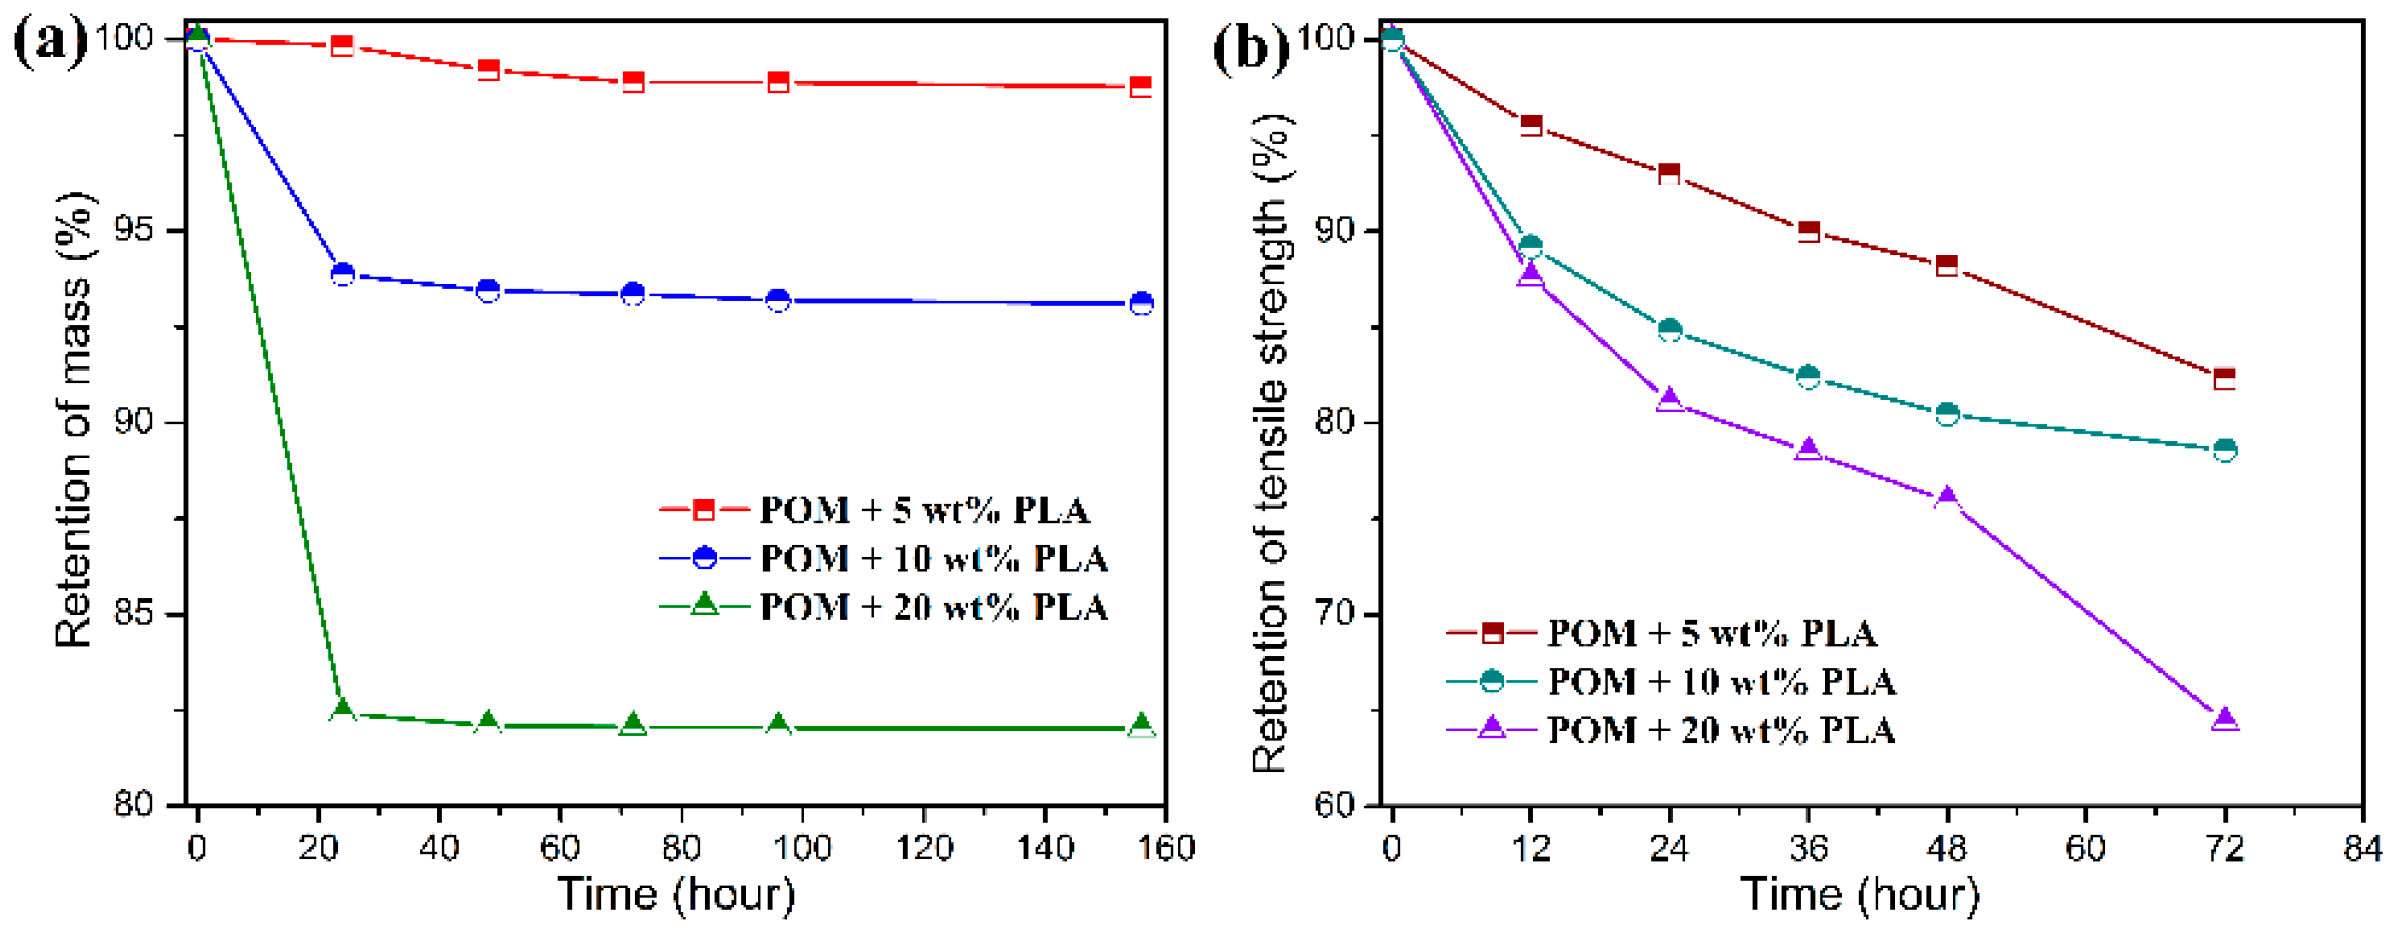
Figure 12 and
Figure 13 show the mass and tensile strength retention of POM/PLLA bicomponent fibers after being soaked in the acid and alkali media for certain periods, respectively. It is important to note in
Figure 12 that all of the bicomponent fibers show a great loss in tensile strength after soaked in the acid medium for 72 h, whereas a high mass retention over 98% is maintained for these fiber samples. With the extension of soaking time, the mass retention tends to decrease rapidly. This suggests that the initiate hydrolysis of PLLA domain only damages the structure of filaments and therefore deteriorates the tensile performance, and the follow-up hydrolytic degradation reaction leads to the mass loss of the bicomponent fibers. It seems that the retention of mass and tensile strength is lower for the bicomponent fibers with a higher content of PLLA over the same degradation period, indicating that there are more PLLA molecules involved in the hydrolysis under the acidic condition.
Although there is a significant decrease in the retention of tensile strength for the bicomponent fibers under the alkali medium, the degradation rate is found to be much faster than that in the acidic medium, resulting in a complete hydrolytic degradation of PLLA domain within 20 h as observed in
Figure 13. In this case, the mass retention presents a drastic decrease in accordance to the PLLA loading in the bicomponent fibers within 20 h and then tends to flat with the further extension of sacking time. Such a hydrolytic degradation disintegrates the filaments and thus results in the decrease of tensile strength. It is noteworthy that the bicomponent fibers seen to show a rapider degradation rate in the alkali media than in the acid one. This can be explained by the fact that the degradation rate of PLLA is more easily accelerated by the formation of dissociated form of lactic acid as well as the splitting of lactoyl lactate in the alkali media [
58]. Therefore, the ester characteristics of PLLA domain impact a hydrolytic degradability to the POM/PLLA bicomponent fibers, and the adjustment of hydrolytic degradation behavior can also be expected for the bicomponent fibers on the basis of the PLLA loading and pH value of medium.
3.6. Thermo-oxidative Aging Performance
Although the blending of POM and PLLA can well establish a type of partially biodegradable material for specific end uses, the biodegradable POM/PLLA bicomponent fibers exposed to heat may be subject to a series of physical and chemical changes. The short exposure times at elevated temperatures generally serve to shorten the induction period of the oxidatively degradable synthetic fibers. The physical properties including tensile strength and elongation at break may change during this induction period. Nevertheless, such the changes are usually not only caused by structural changes of molecular chains but also are due to a temperature-dependent response. In this case, the loss of tensile properties is ascribed to the embrittlement of the bicomponent fibers and can be evaluated at the different temperatures corresponding to the relevant time scales [
37]. The thermos-oxidative aging behavior of the bicomponent fibers can be characterized by means of the so-called thermo-oxidation coefficient (
KTO), which is calculated according to the tensile properties before and after the thermo-oxidation aging and expressed as:
where
v0 and
va are the values of tensile strength or elongation at break before and after the thermo-oxidation aging test, respectively.
Table S2 gives the data of
KTO according to the tensile strength and elongation at break for pure POM fiber and POM/PLLA bicomponent fibers at different draw ratios after an accelerated aging process in a hot air at 70°C for 72h. As seen in
Table S2, pure POM fiber keeps 98% of its tensile strength and 97% of elongation at the break at the ultimate draw ratio, indicating an excellent thermo-oxidative aging property due to the high degree of crystallinity of POM. However, there is a slight decrease in the data of
KTO according to the tensile strength and elongation at break with an increase of draw ratio. This may be due to the presence of amorphous regions on the surface of POM fiber after hot drawing. It is understandable that the amorphous POM can be thermally oxidated more easily than the crystalline one, because the atmospheric oxygen is easily diffused into the inside of fibers through the amorphous region of molecular chains [
59]. The higher draw ratio leads to more amorphous regions appearing on the fiber surface and results in more defects after thermo-oxidative aging accordingly. As a result, the tensile performance tends to deteriorate with the improvement of draw ratio. The bicomponent fibers are found to exhibit a relatively poorer thermo-oxidative aging property compared to pure POM fiber as observed in
Table S2, and the data of
KTO also tend to decrease with an increase of PLLA content. It is evident that the amorphous regions on the fiber surface fairly increase in the presence of amorphous PLLA phase. On the other hand, the amorphous regions can be further increased as the content of PLLA increases. These increased amorphous regions are obviously more disadvantageous to the thermo-oxidative aging property of the bicomponent fibers.
Figure 14 displays the SEM micrographs of the surfaces of pure POM fiber and POM/PLLA bicomponent fibers after the thermo-oxidative aging experiment. It is noticeable that there are more defects distinguished on the surface of the bicomponent fibers after the thermo-oxidative aging compared to pure POM fiber. The number of defects seems to increase with an increase of PLLA content as observed in
Figure 14b–d. The amorphous PLLA phase is more prone to deteriorate than the POM one when exposed to the thermo-oxidative environment, resulting in more defects on the fiber surface accordingly. The presence of these defects leads to the worse tensile performance of the bicomponent fibers. Nevertheless, the bicomponent fibers still maintain almost 90% of tensile strength after the thermo-oxidative aging, promising fairly good thermo-oxidative aging performance.
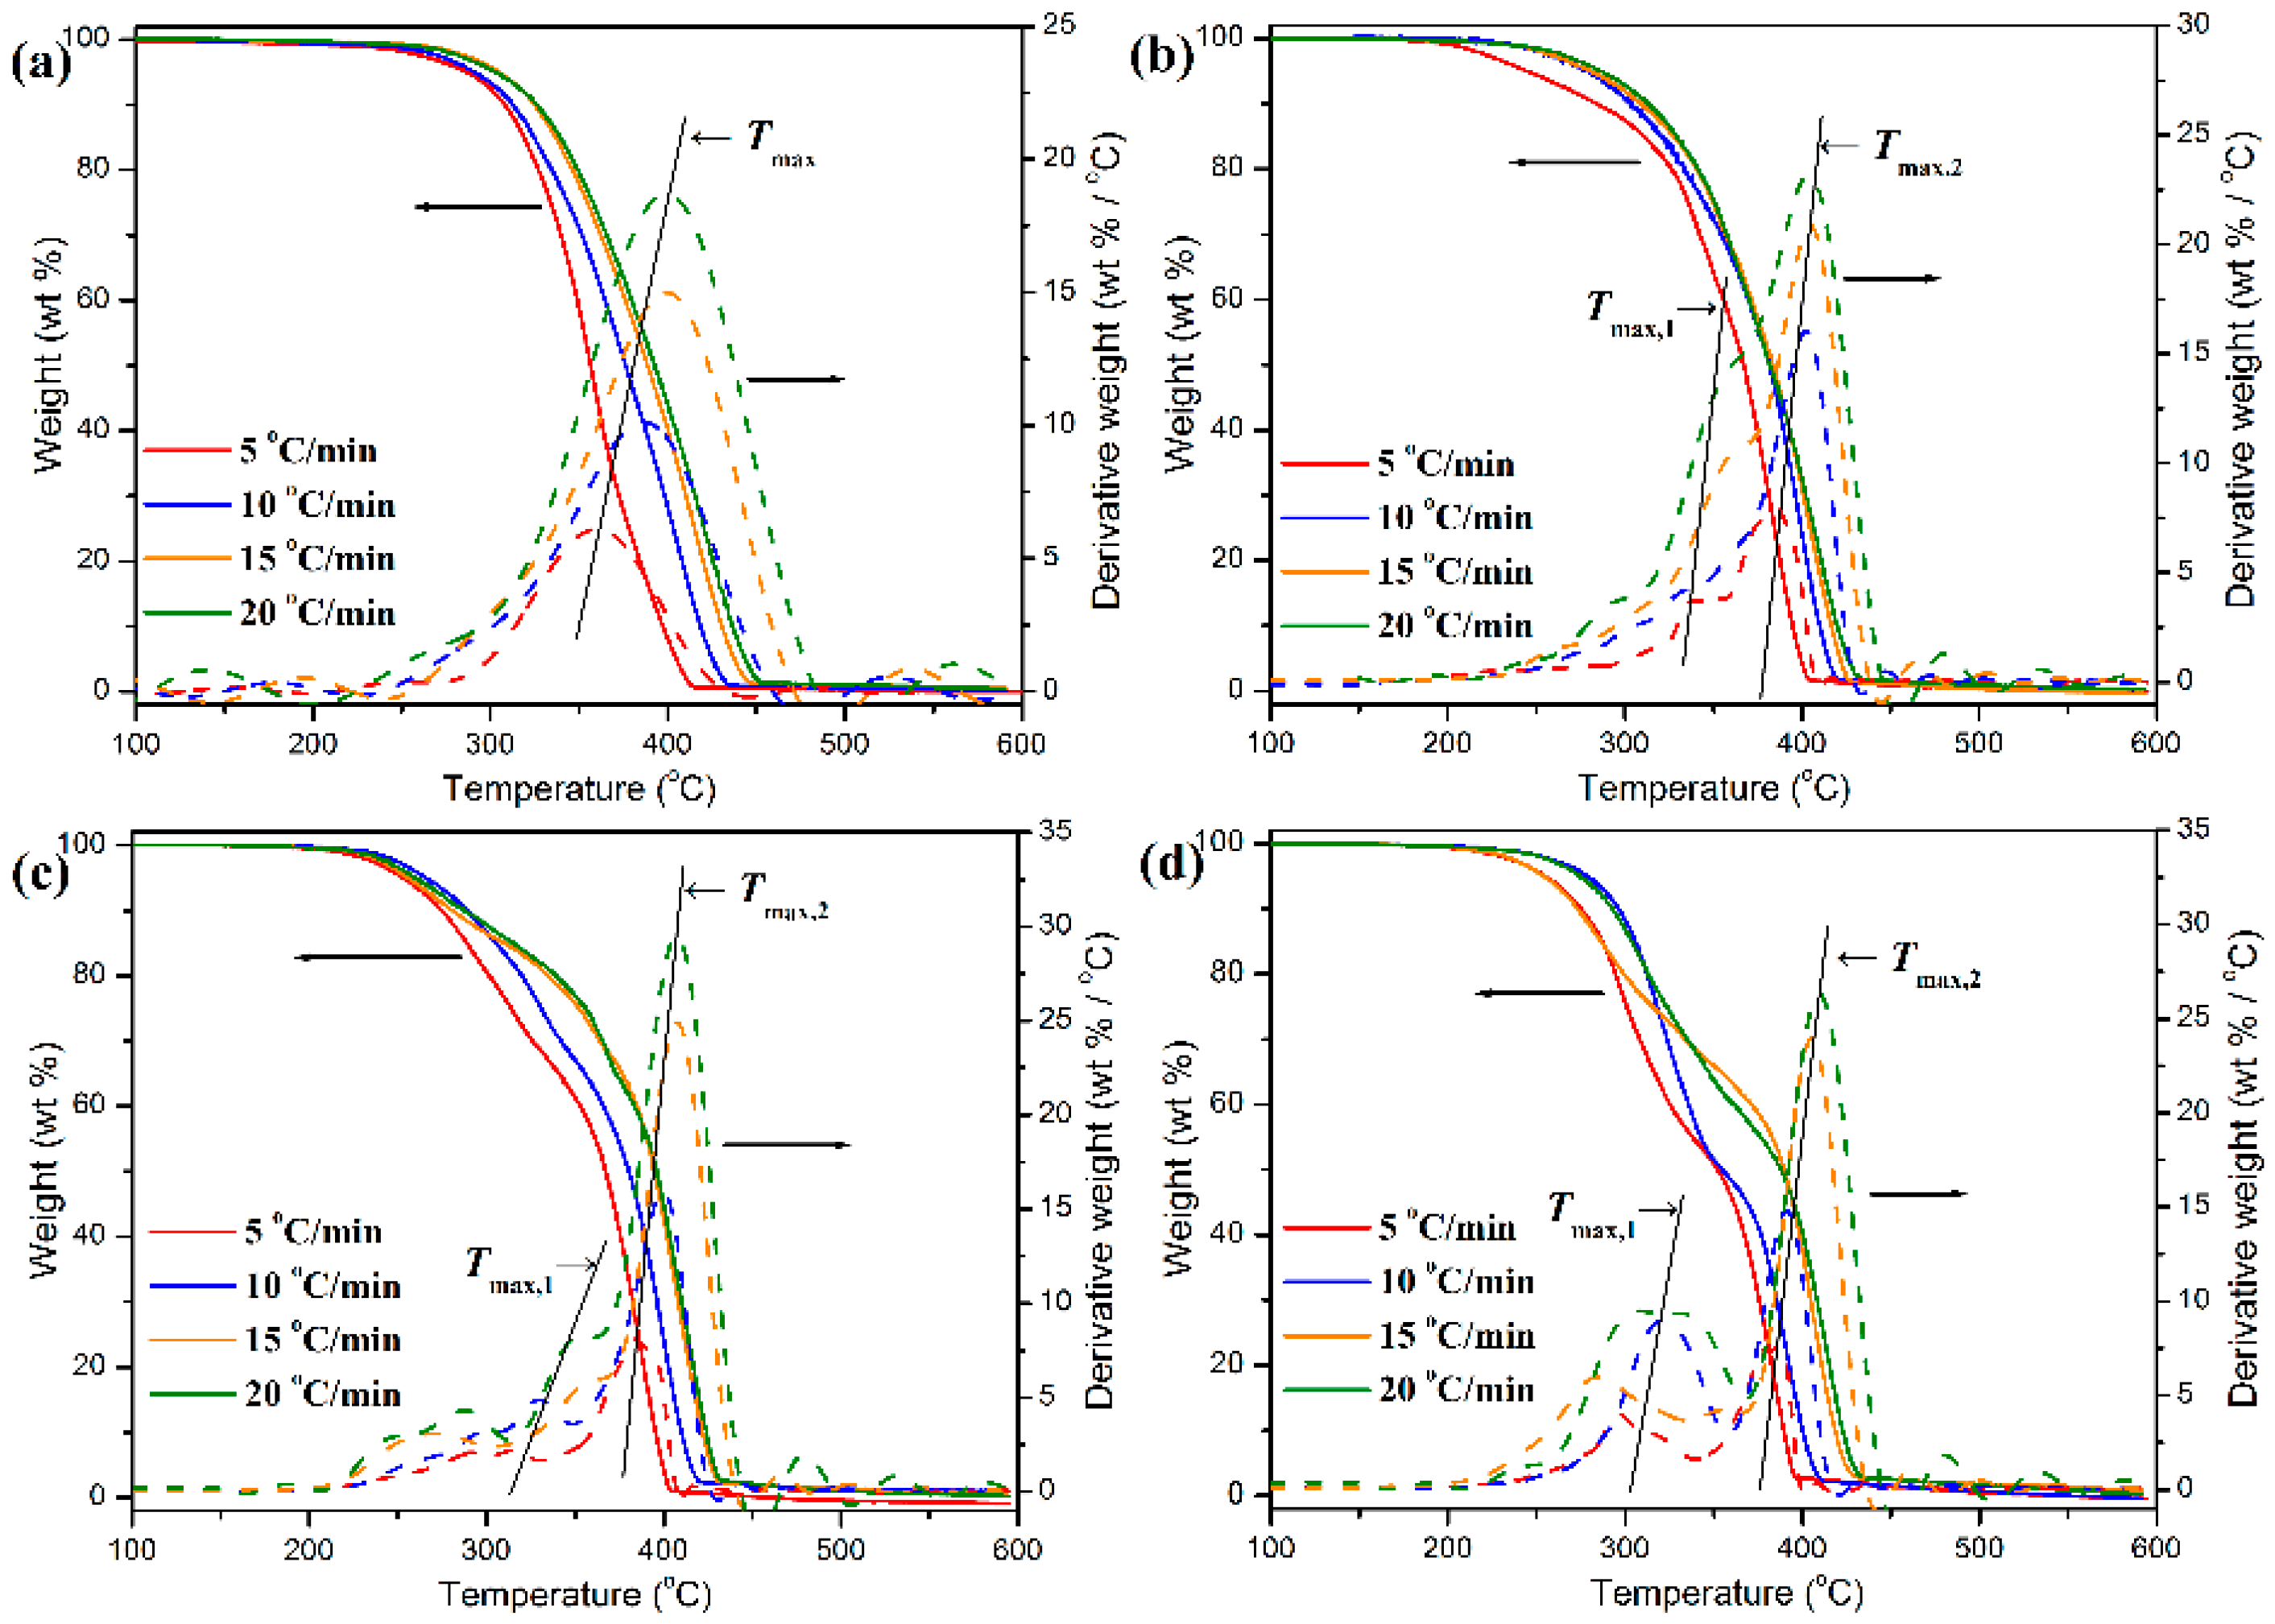
3.7. Thermal Degradation Behavior and Kinetics
The thermal degradation behaviors of pure POM fiber and POM/PLLA bicomponent fibers were studied by TGA at different heating rates, and the obtained TGA and DTG thermograms are illustrated in
Figure 15. To achieve a better insight into the thermal decomposition process, some important decomposition parameters derived from the TGA characterizations were summarized in
Table S3 (see
Supplementary Materials), which include the initial degradation temperature (
Ti) corresponding to 5 wt % weight loss, the final degradation temperature (
Tf) corresponding to 5 wt % residual char left, and the characteristic temperature (
Tmax) at the maximum weight-loss rate. As seen in
Figure 15, pure POM fiber presents a typical one-stage decomposition behavior in the temperature ranges of 285–450 °C at the given heating rates due to the pyrolysis of main chains of POM. It is noteworthy in
Table S3 that there is a shift to higher temperatures occurring in
Ti,
Tf, and
Tmax with an improvement of heating rate, indicating that pure POM fiber has to complete thermal degradation in a higher temperature region due to the slow heat diffusion in the faster heating process [
60]. On the contrary, the POM fiber must achieve an equilibrium in thermal degradation rapidly during the slower heating process at a low heating rate, and therefore it completes the thermal decomposition in a lower temperature region. However, a two-step thermal degradation behavior is observed from the TGA thermograms of the bicomponent fibers, in which the earlier weight loss corresponds to the decomposition of the PLLA domain and the later one is attributed to the degradation of the POM domain. The earlier weight loss is dependent on the PLLA loading in the bicomponent fibers, and the higher PLLA content actually leads to a greater weight loss at the earlier decomposition stage. Moreover, there are two
Tmax’s observed in the DTG thermograms of the bicomponent fibers, in which the lower peak temperature (
Tmax,1) is attributed to the PLLA domain, and the higher peak (
Tmax,2) is associated with the thermal degradation of the POM domain. It is well known that the thermal stability of a polymer is directly related to its crystallinity. The TGA results well identified that the crystalline POM phase had a much better thermal stability than the amorphous PLLA one in the bicomponent fibers. In is important to note that the
Tmax,2 seems to increase fairly with the content of PLLA at the same heating rate, which may be ascribed to the enhancement in both the crystallinity of POM domain and the envelopment effect of PLLA domain. It is understandable the high crystallinity can improve the heat resistance of the POM domain. On the other hand, the envelopment with PLLA domain can effectively retard the heat diffusion into the POM domain. Such a dual effect enhances the thermal stability of the POM domain in the bicomponent fibers. However, the
Tmax,1 is found to decrease slightly with an increase of PLLA content at the same heating rate, which may be due to the increased loading of the thermally unstable PLLA domain in the bicomponent fiber. In addition, it is noteworthy in
Figure 15 and
Table S3 that with a decrease of heating rate, a downward trend is observed in both
Tmax,1 and
Tmax,2 for all of the bicomponent fiber samples, suggesting a poorer thermal stability for these bicomponent fiber samples at a lower heating rate due to the longer heating period.
The decomposition kinetics of the pure POM fiber and POM/PLLA fibers was further studied by means of the Kissinger’s and Flynn-Wall’s methods in this work. According to the decomposition reaction of a polymer during the thermal degradation process, the conversion rate (
a) of decomposition reaction is defined as the ratio of mass loss at arbitrary time to total mass loss at the complete decomposition temperature from TGA analysis, and it is calculated by the following equation:
where
w0,
wt and
wf are the initial weight, actual weight at time
t, and final weight of the sample at the end of thermal decomposition, respectively. The decomposition kinetic equation can further be rewritten by Equation (10) in terms of the reaction rate for a basic solid-state chemical reaction [
61]:
where
T is the reaction temperature,
k the rate constant of thermal decomposition, and
n represents the apparent order of reaction. Moreover, the relationship between the rate constant and the apparent activation energy (Δ
Ea) can be established by the Arrhenius’s equation:
The combination of Equations (9) and (10) with the Arrhenius expression gives the following relationship:
This relationship is determined as the basis of numerous analytical approaches to the calculation of kinetic parameters from TGA results.
Table S4 summarizes the thermal decomposition temperatures of the pure POM fiber and POM/PLLA bicomponent fibers at different conversion rates (see
Supplementary Materials). It is noted in
Table S4 that the introduction of PLLA seems to promote the reaction evolution of the bicomponent fibers in the earlier decomposition stage due to the poorer thermal stability of PLLA domain compared to the POM domain. Meanwhile, the degradation temperatures of the bicomponent fibers decrease with an increase of PLLA content at the same conversion rate. However, the influence of the PLLA domain seems to weaken in the middle and later stages of decomposition reaction, indicating that the thermal degradation of the POM domain dominates the whole decomposition reaction. According to the Kissinger’ model [
62], the peak temperatures given by the maxima of the first derivative weight-loss thermogram can be used to calculate the apparent activation energy of thermal decomposition reaction using the following equation:
where
β is the heating rate,
T the absolute temperature corresponding to the conversion, Δ
Ea the apparent activation energy, and
R is the gas constant. On the other hand, a new equation can be developed by Flynn and Wall to calculate the decomposition kinetic parameters of fiber samples and is expressed as [
63]:
Based on the Flynn–Wall’s model, the apparent activation energy of thermal decomposition reaction for the pure POM fiber and POM/PLLA bicomponent fibers can be determined by the slope of the linear plot of ln
β versus 1/
T at a fixed conversion (normally taken as 5% conversion) [
63].
Figure S3 shows the Flynn–Wall plots of ln
β versus 1/
T at the conversion rate of 5% for all of fiber samples, and the obtained data of Δ
Ea are given in
Table S3. Pure POM fiber is found to have a high Δ
Ea value of 384.6 kJ/mol for the thermal degradation reaction at a conversion rate of 5%. It is important to note that the Δ
Ea value of the bicomponent fibers tends to decrease with the addition of PLLA into POM, and the higher content of PLLA brings about lower apparent activation energy. It is well known that the apparent activation energy is associated with the initial decomposition stage [
64]. According to our previous study, pure PLLA has a much lower Δ
Ea value of 309.2 kJ/mol compared to pure POM [
35], implicating that there is a lower energy barrier for PLLA to perform the thermal decomposition reaction and therefore the PLLA domain degrades earlier than the POM one. These decomposition kinetic results clearly demonstrated that the incorporation of PLLA could initiate the thermal decomposition reaction more easily due to the reduction of energy barrier.
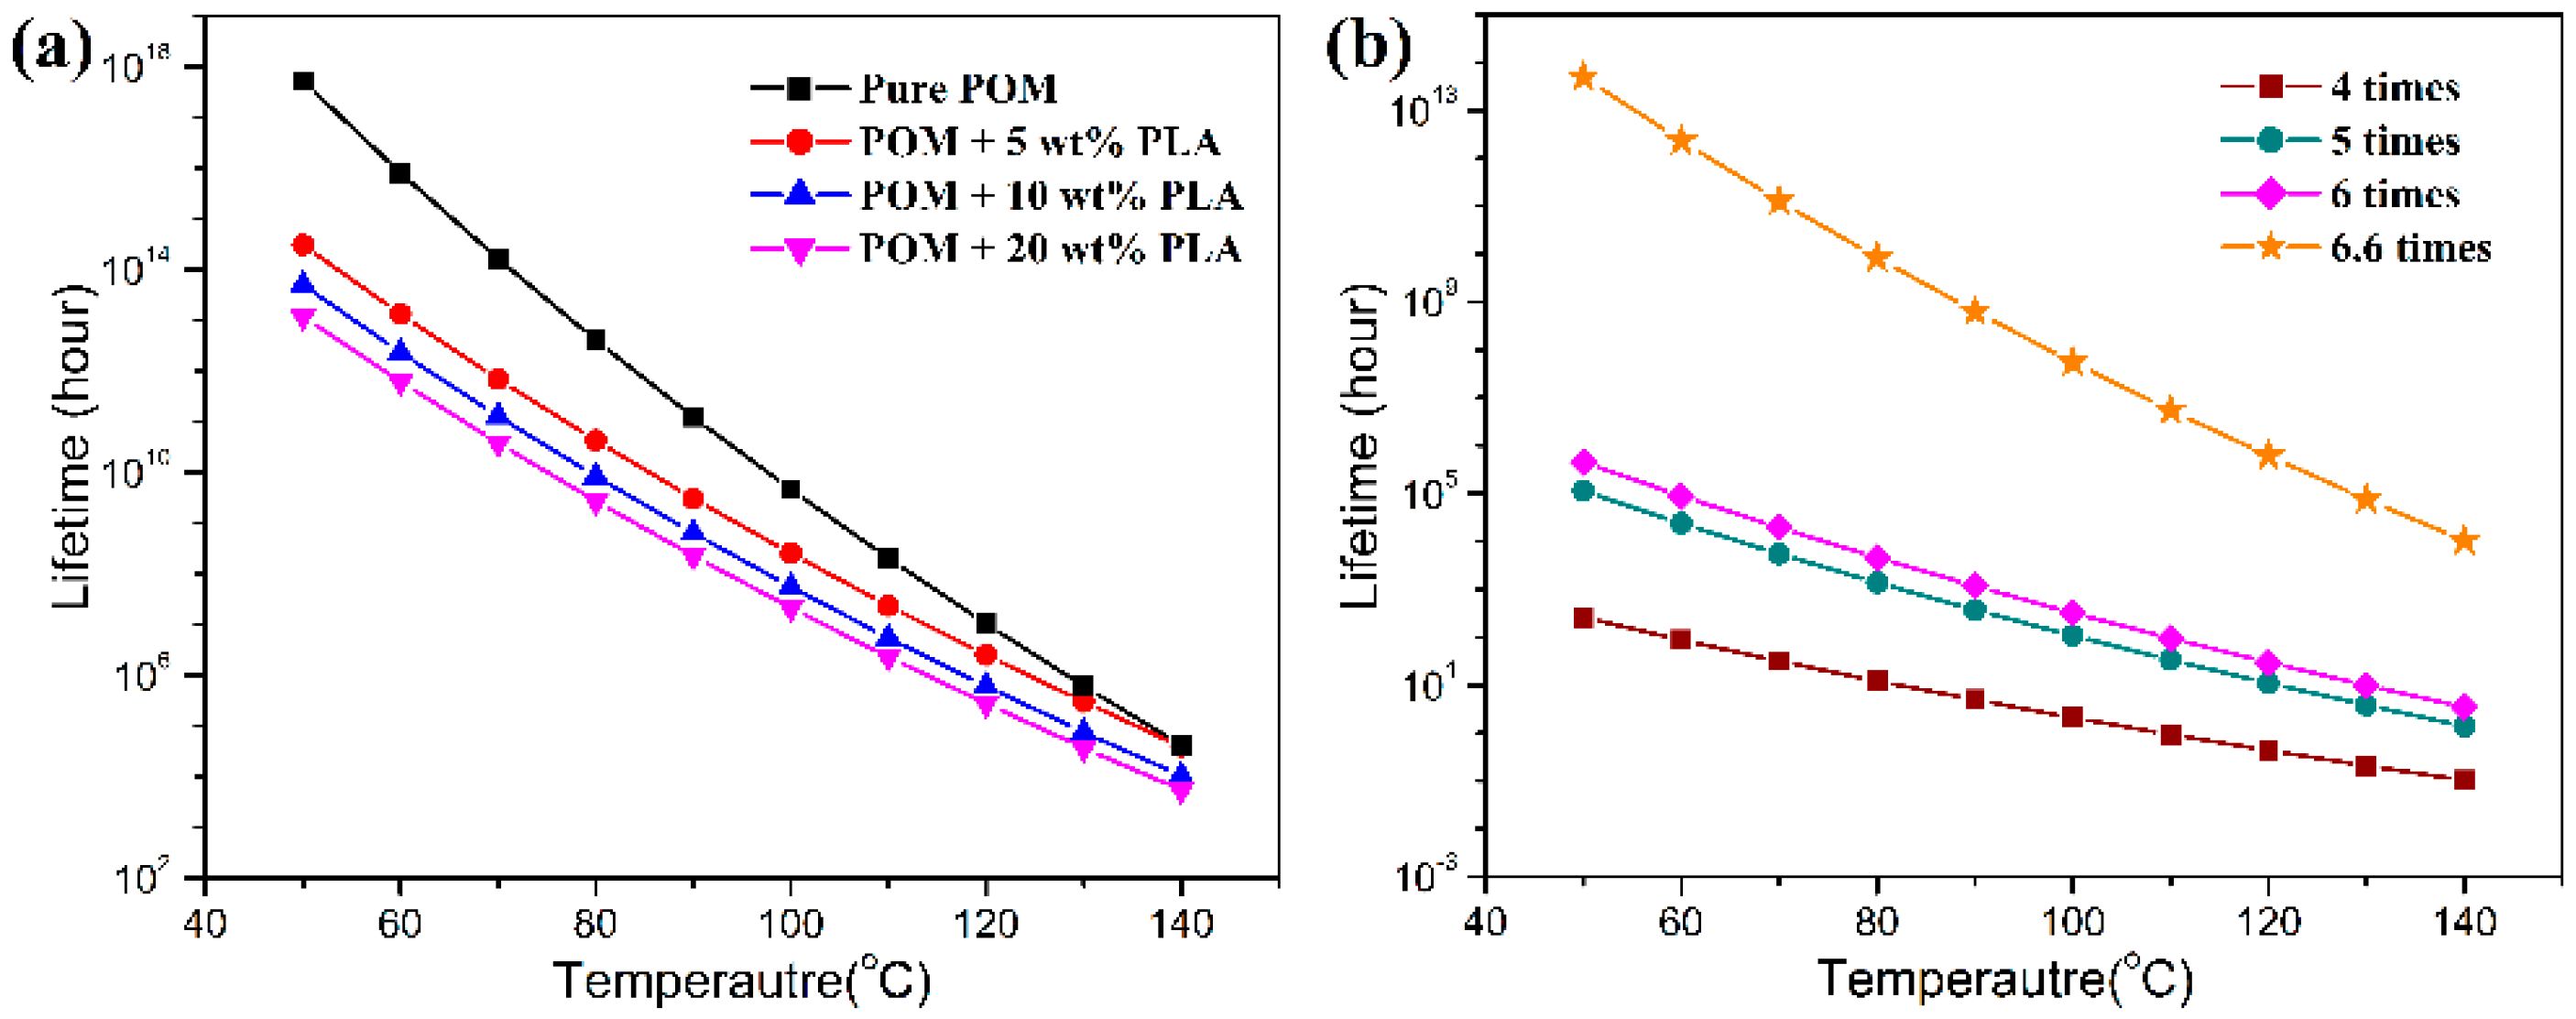
3.8. Lifetime Predication
The determination of the serve lifetime of POM/PLLA bicomponent fibers is very important for their successful applications for engineering and consumer-goods areas. It is well known that the serve lifetimes of synthetic fibers are controlled by the chemical reactions resulting in chain scission as well as the mediating environmental factors. Therefore, through understanding the physical or chemical changes in the structure of synthetic fibers when exposed to aggressive environments, one can achieved a framework for controlling their ultimate service lifetimes by either stabilizing the polymer or chemically accelerating the degradation reactions [
64]. To evaluation the lifetime of high-temperature polymers, D.J. Toop proposed a theory of thermal lifetime prediction by means of the TGA technique and established a connection between the TGA and long-term life testing. According to Toop’s model, a continuous kinetic function was first established in terms of single decomposition or rearrangement reaction for the thermal degradation of polymers, and then the temperature dependence of chemical reaction rate was given by the Arrhenius equation. In this case, the lifetime test can be conducted on the basis of the apparent activity energy obtained from the thermal decomposition kinetics by means of the Arrhenius equation using the following three simple equations:
where
xf is the variable set as Δ
Ea/
RT5%,
T5% the absolute temperature at 5% weight loss,
Tf the failure temperature,
tf the approximate time of failure, and log[p(
xf)] is the linear function of
xf. In this work, the thermal lifetimes of the pure POM fiber and POM/PLLA bicomponent fibers in the temperature range of 50–140 °C were predicted according to the values of apparent activity energy obtained from the Flynn-Wall’s model by used of Equations (14)–(16) [
61,
62].
Figure 16 shows the thermal lifetimes of all the fiber samples at different temperatures and draw ratios on the basis of the decomposition kinetic data obtained from TGA measurements. It is expected that pure POM fiber presents a much longer lifetime than the bicomponent fibers in the temperature range between 50 and 140 °C due to its high degree of crystallinity and good structural stability. Moreover, there is a significant effect of temperature on the lifetime of the POM fiber, and it is evidently understandable that the higher ambient temperature results in a shorter lifetime due to the effect of thermal stability. As seen in
Figure 16a, the bicomponent fibers are observed to exhibit a downward trend in lifetime in the presence of PLLA at all ambient temperatures. The bicomponent fibers are predicted to have the lifetimes of approximately 3.0 × 10
14, 5.0 × 10
13, and 1.2 × 10
13 hours at the PLLA contents of 5, 10, and 20 wt %, respectively. These data are obviously lower than the lifespan of 5.15 × 10
17 hours for pure POM fibers. Furthermore, the lifetime tends to decrease with an increase of PLLA content, which may be ascribed to the poorer thermal stability of the PLLA phase in the bicomponent fibers. It is noteworthy that the lifetimes of the bicomponent fiber samples tend to be close to each other with an increase of ambient temperatures, indicating that the POM domain dominates the thermal lifetime at high temperatures. In addition, this work also conducted an investigation on the effect of the draw ratio on the lifetime of the bicomponent fibers containing 10 wt % PLLA as a representative sample, and the obtained results are presented in
Figure 16b. It is interesting to note that the lifetime of the bicomponent fibers is greatly influenced by draw ratio, and the higher the draw ratio, the longer the lifetime. This phenomenon can be explained by the fact that the higher draw ratio leads to a higher degree of crystallinity and more stable crystallites at a higher orientation level. As a result, the thermal stability of the bicomponent fibers is improved at the high draw ratio. There is no doubt that the introduction of the appropriate percentage of PLLA not only facilitates the natural degradation of POM/PLLA bicomponent fibers but also reserve satisfactory mechanical performance for the bicomponent fibers within their serve lifetimes.


