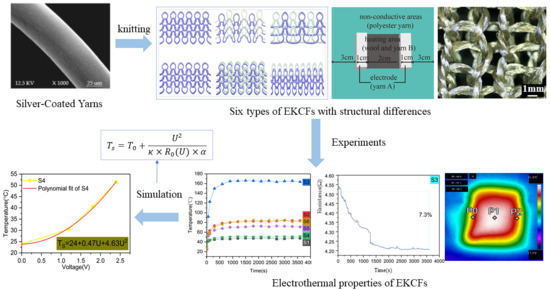
Structural Parameters Affecting Electrothermal Properties of Woolen Knitted Fabrics Integrated with Silver-Coated Yarns


Abstract
1. Introduction
2. Theoretical Analysis
2.1. Input Power
2.2. Heat Loss
2.3. Equilibrium Temperature
3. Experimental Procedures
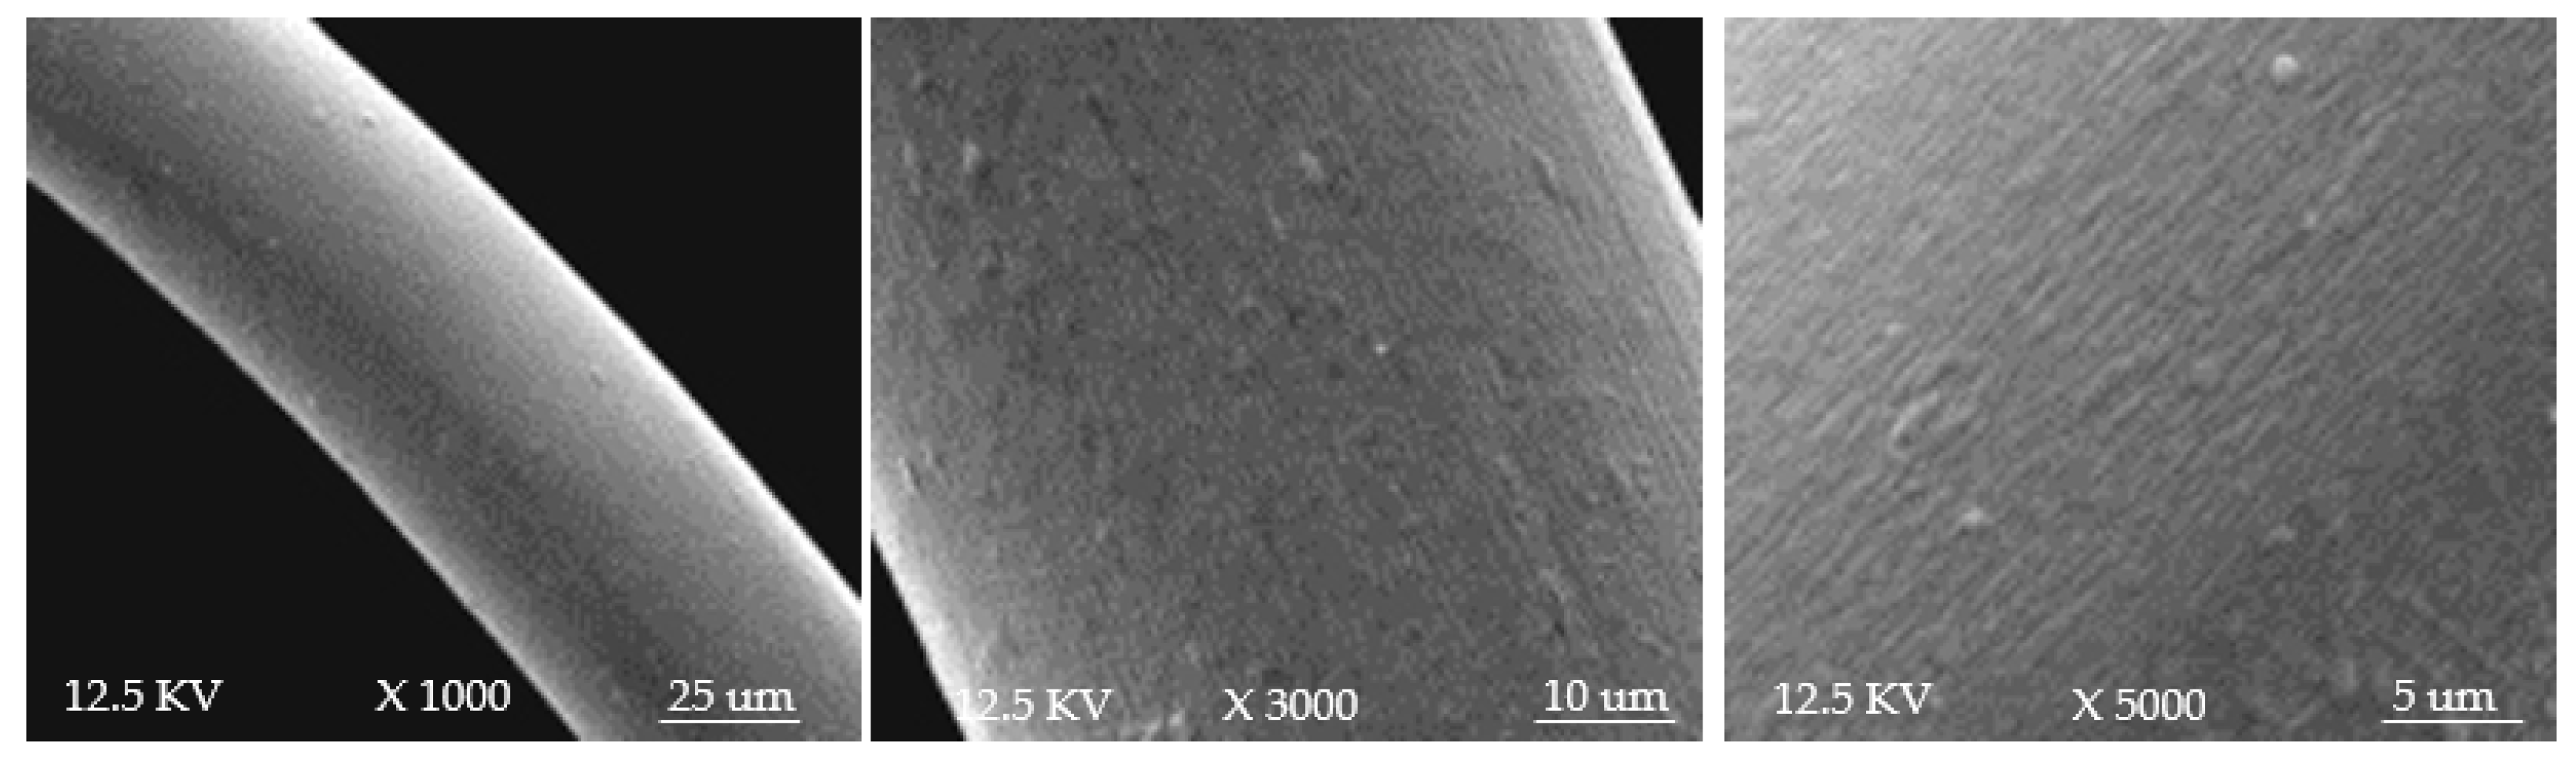
3.1. Materials
3.2. Sample Preparation
3.3. Method
3.4. Experiment 1: Resistance Measurements of Samples
3.5. Experiment 2: Simultaneous Testing of the Resistance and Temperature of Samples
4. Results and Discussion
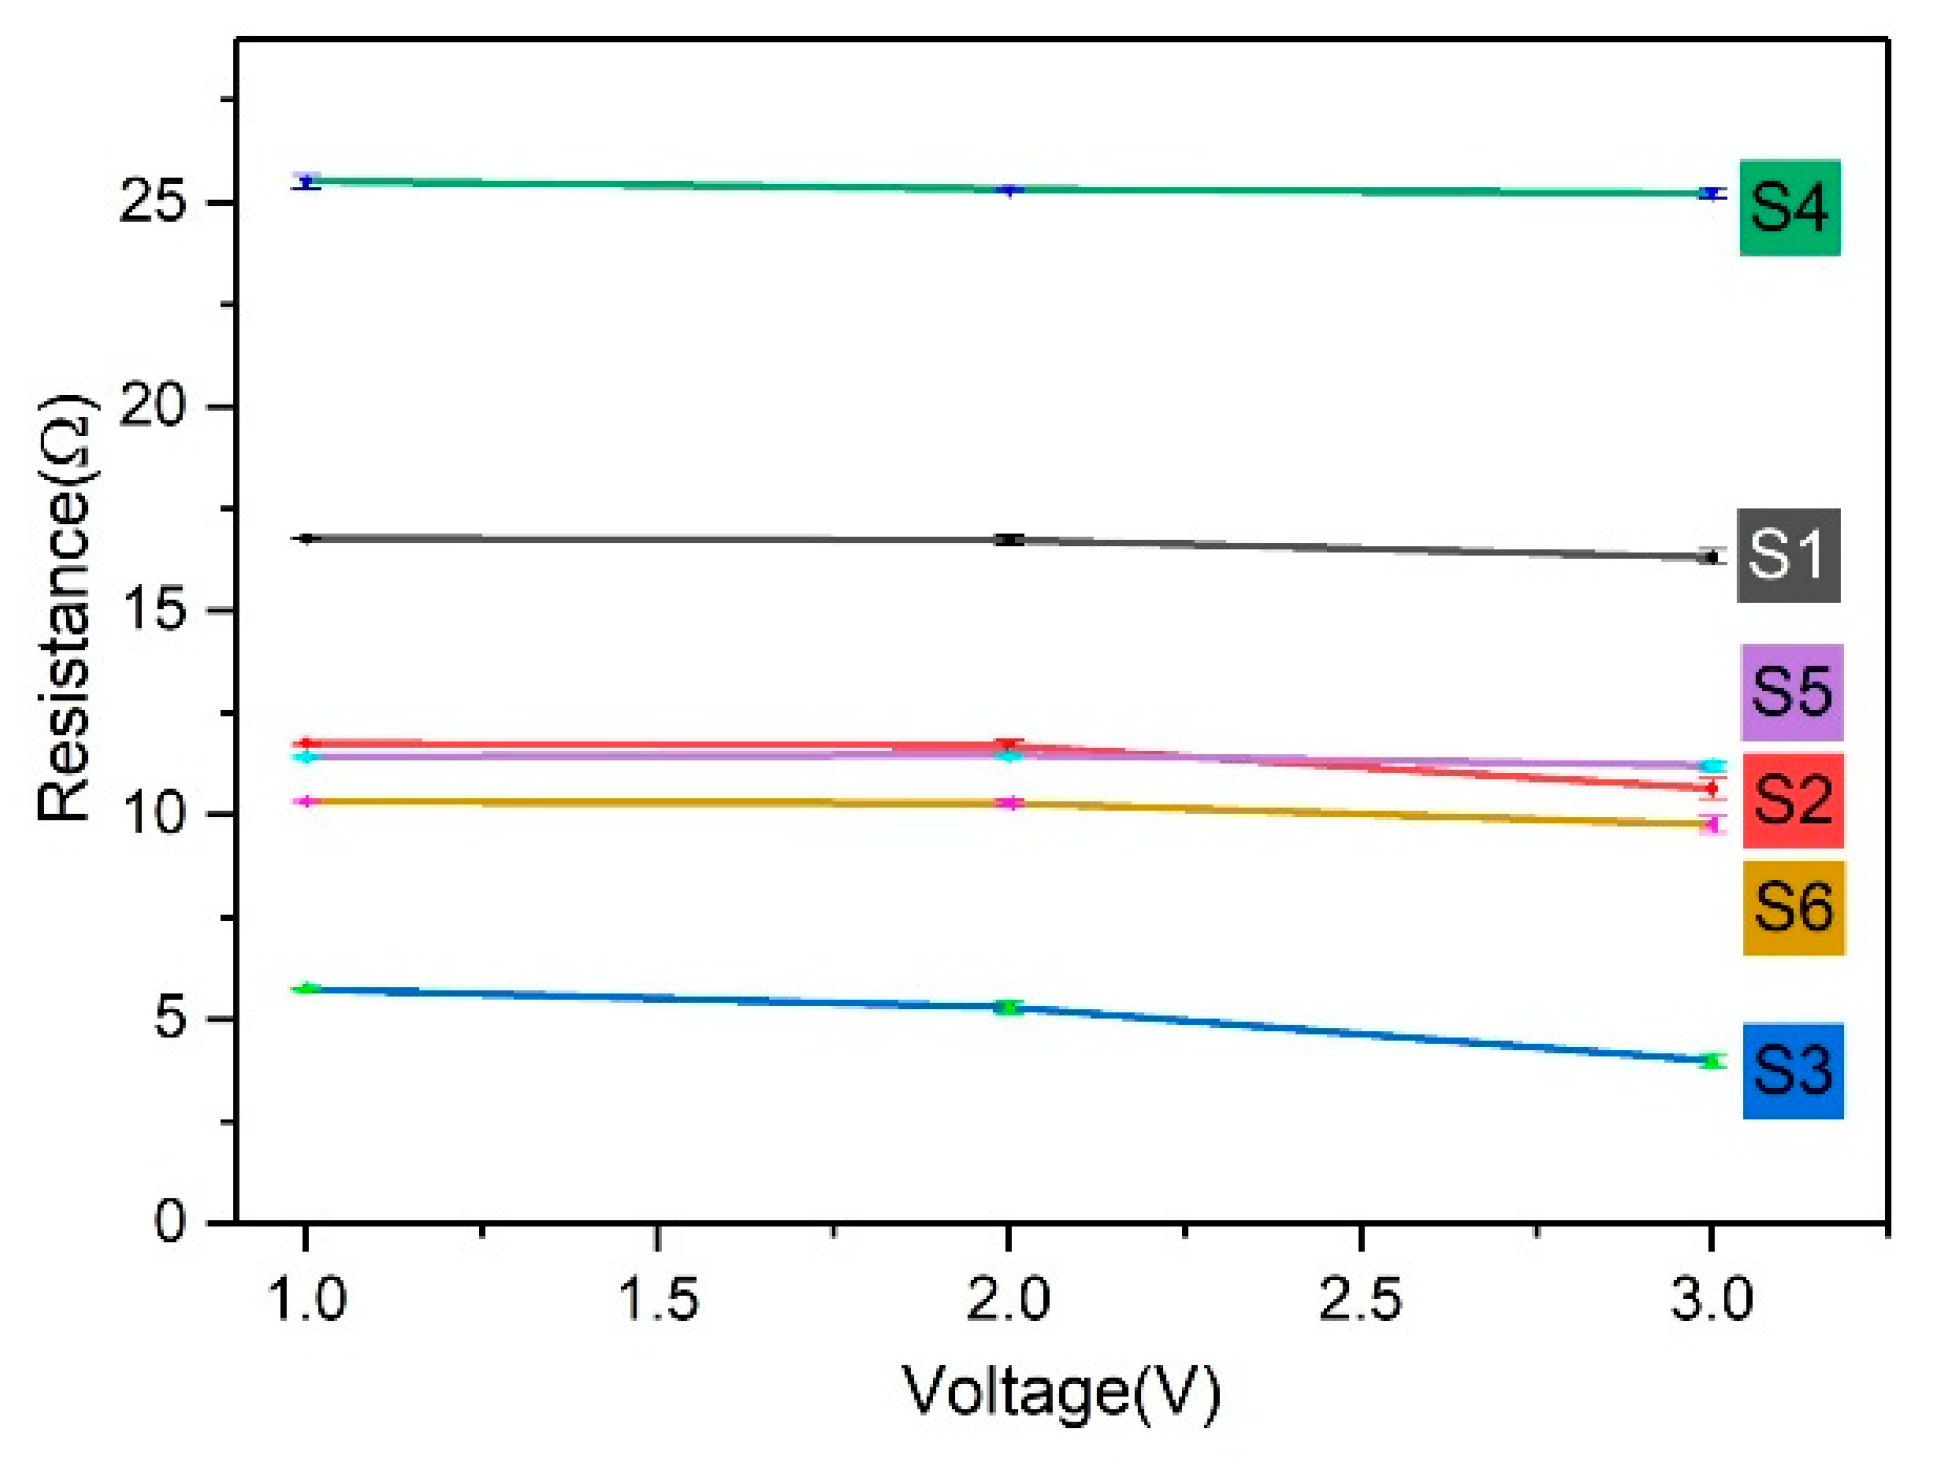
4.1. Experiment 1
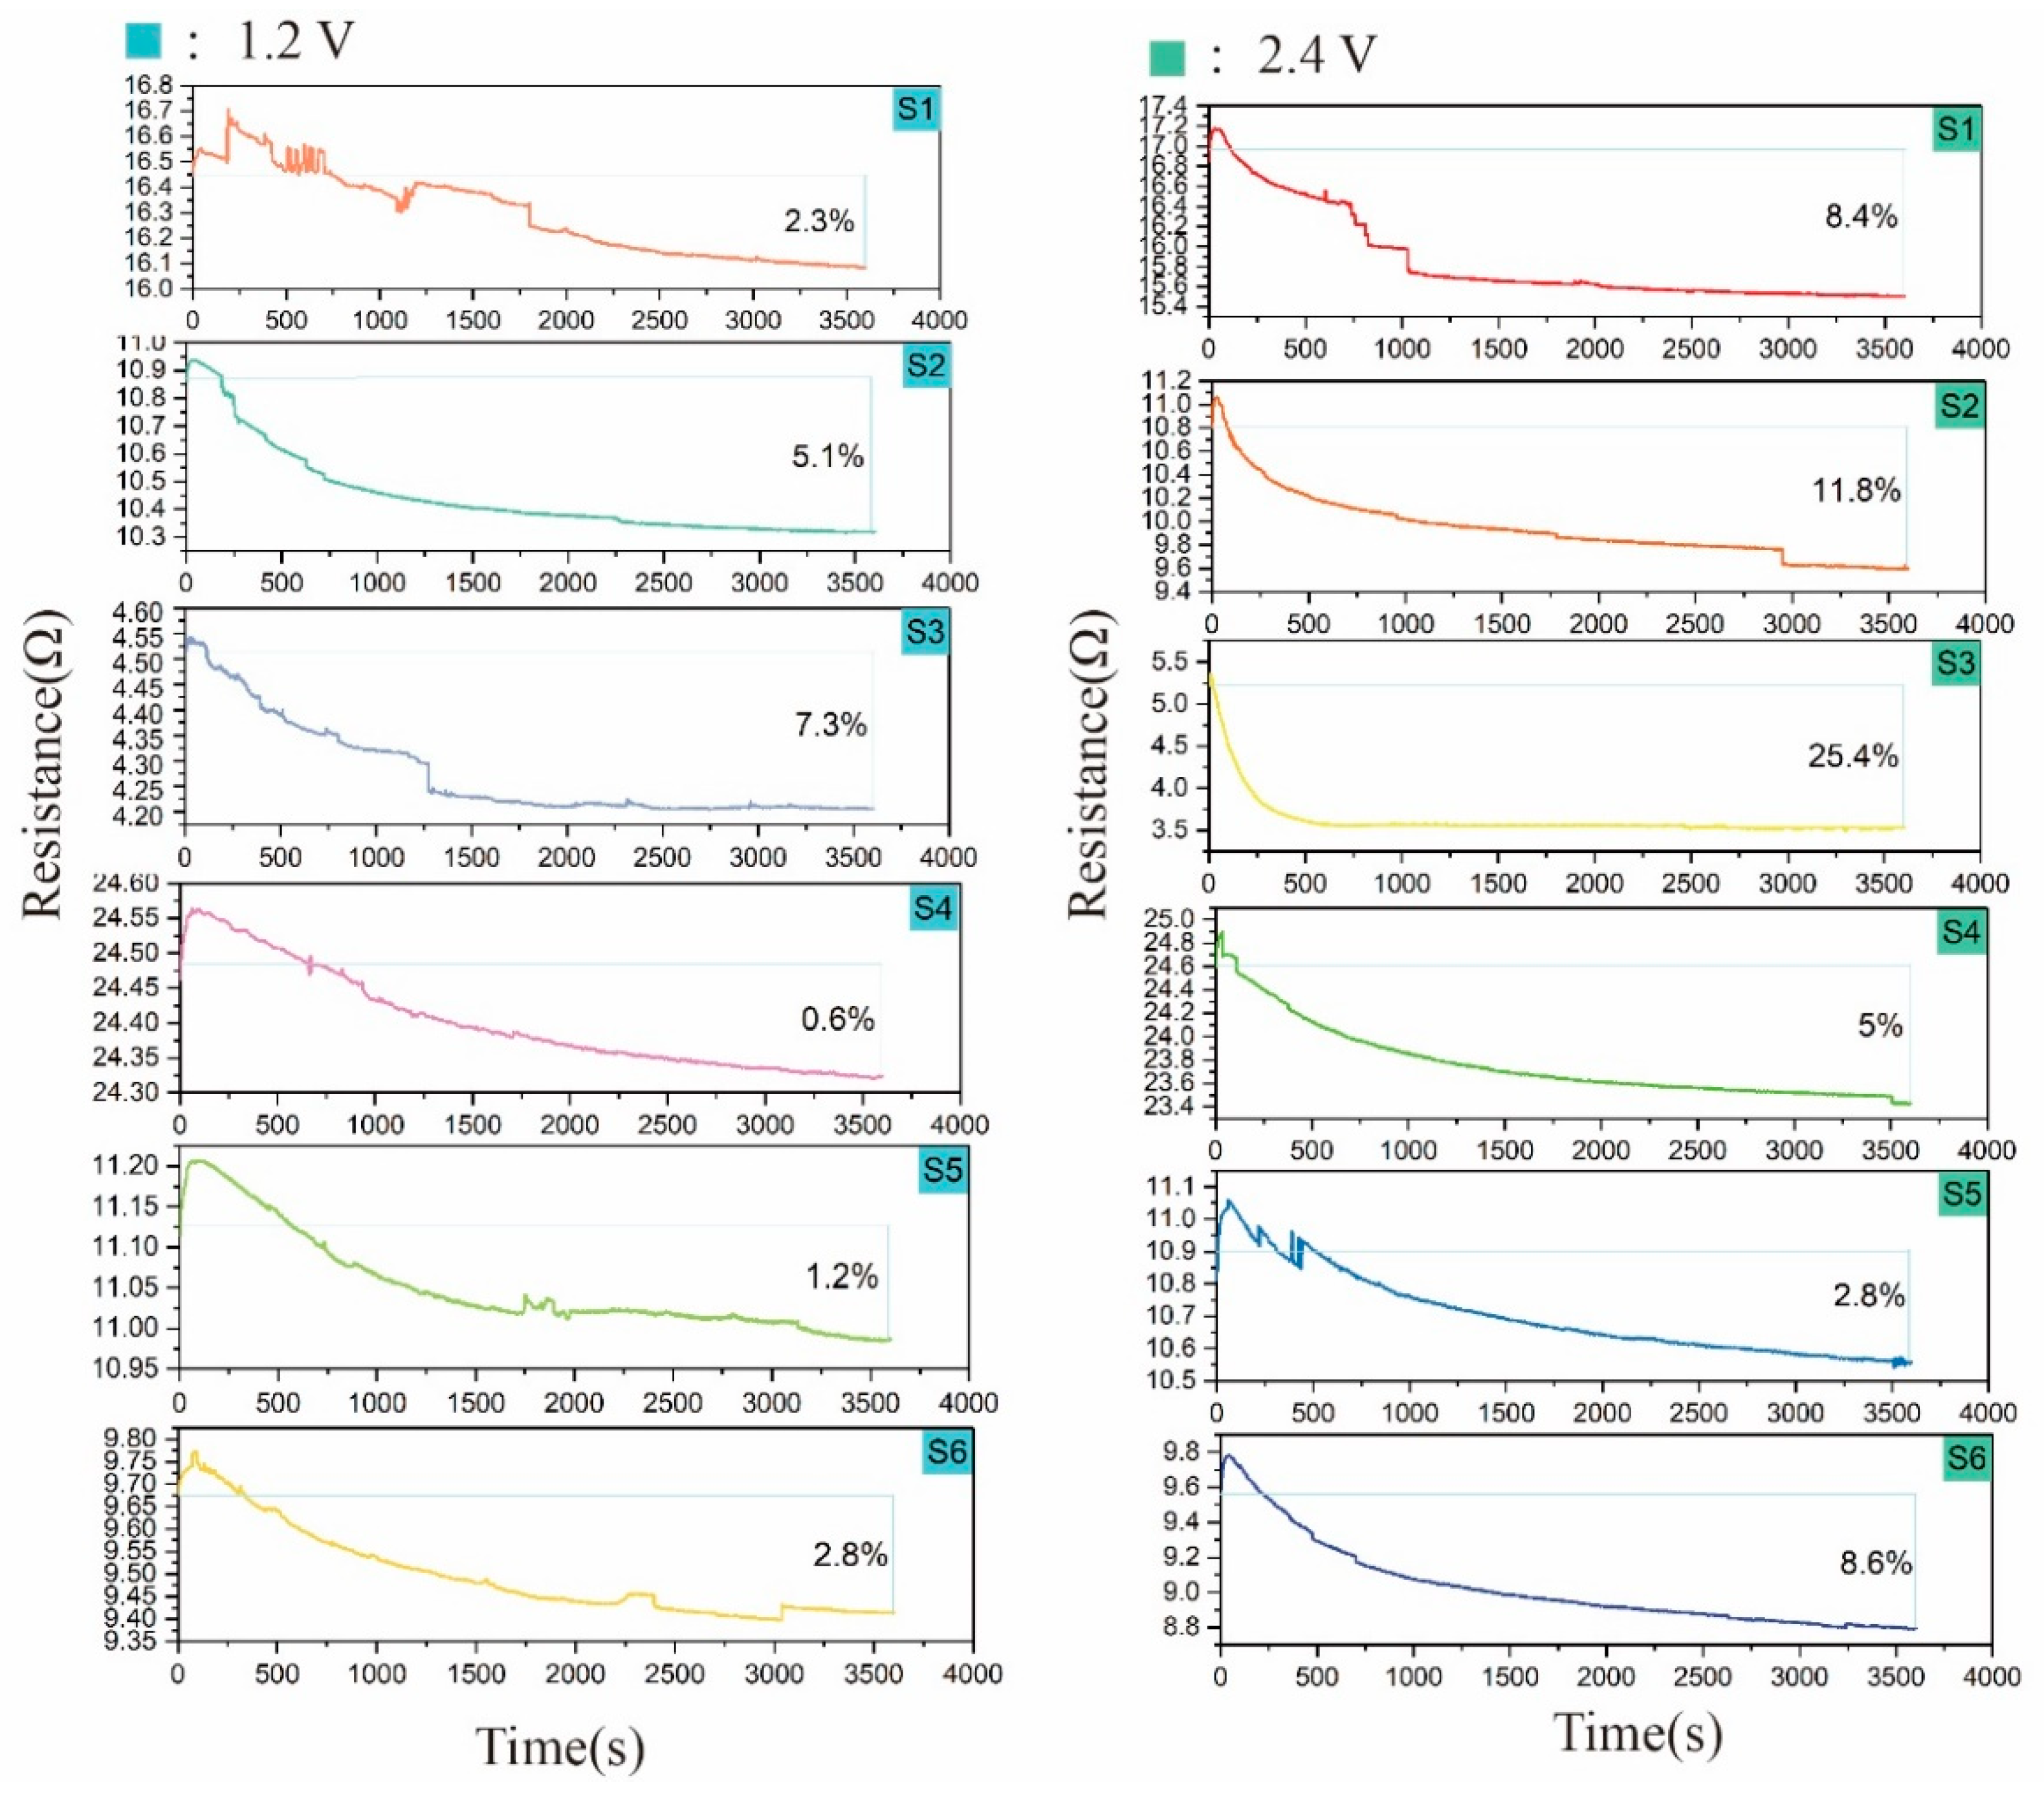
4.2. Experiment 2
5. Conclusions
Author Contributions
Funding
Acknowledgments
Conflicts of Interest
References
- Stoppa, M.; Chiolerio, A. Wearable Electronics and Smart Textiles: A Critical Review. Sensors 2014, 14, 11957–11992. [Google Scholar] [CrossRef]
- Lee, J.; Kwon, H.; Seo, J.; Shin, S.; Koo, J.H.; Pang, C.; Son, S.; Kim, J.H.; Jang, Y.H.; Kim, D.E.; et al. Conductive Fiber-Based Ultrasensitive Textile Pressure Sensor for Wearable Electronics. Adv. Mater. 2015, 27, 2433–2439. [Google Scholar] [CrossRef] [PubMed]
- Yi, W. Flexible Fabric Strain Sensors; Springer: Singapore, 2015. [Google Scholar]
- Atalay, O.; Kennon, W. Knitted Strain Sensors: Impact of Design Parameters on Sensing Properties. Sensors 2014, 14, 4712–4730. [Google Scholar] [CrossRef]
- Seyedin, S.; Razal, J.M.; Innis, P.C.; Jeiranikhameneh, A.; Beirne, S.; Wallace, G.G. Knitted Strain Sensor Textiles of Highly Conductive All Polymeric Fibers. Acs Appl. Mater. Interfaces 2015, 7, 21150–21158. [Google Scholar] [CrossRef] [PubMed]
- Castano, L.M.; Flatau, A.B. Smart Fabric Sensors and E-textile Technologies: A Review. Smart Mater. Struct. 2014, 23, 053001. [Google Scholar] [CrossRef]
- Qureshi, W. Integrating Conductive Threads into Different Knitting Construction by Flat Knitting Machine to Create Stretch Sensitive Fabrics for Breathing Monitoring. Ph.D. Thesis, University of Borås/swedish School of Textiles, Borås, Sweden, 2011. [Google Scholar]
- King, R.R.; Miao, X.H.; Zhang, S.; Li, Y.T.; Wan, A. Influence of Rib Structure and Elastic Yarn Type Variations on Textile Piezoresistive Strain Sensor Characteristics. Fibers Text. East. Eur. 2018, 26, 24–31. [Google Scholar]
- Yang, M.Y.; Pan, J.J.; Xu, A.C.; Luo, L.; Cheng, D.S.; Cai, G.M.; Wang, J.F.; Tang, B.; Wang, X. Conductive Cotton Fabrics for Motion Sensing and Heating Applications. Polymers 2018, 10, 568. [Google Scholar] [CrossRef] [PubMed]
- Bhat, N.V.; Seshadri, D.T.; Nate, M.M.; Gore, A.V. Development of Conductive Cotton Fabrics for Heating Devices. J. Appl. Polym. Sci. 2006, 102, 4690–4695. [Google Scholar] [CrossRef]
- Bahadir, S.K.; Atalay, O.; Kalaoglu, F.; Vassiliadis, S.; Potirakis, S. Performance Evaluation of Welded Knitted E-Fabrics for Electrical Resistance Heating. In Proceedings of Second International Conference on Electrical Systems, Technology and Information 2015 (ICESTI 2015); Springer: Singapore, 2016. [Google Scholar]
- Ehrmann, A.; Blachowicz, T. Examination of Textiles with Mathematical and Physical Methods; Springer International Publishing: Berlin, Germany, 2017. [Google Scholar]
- Hao, D.; Xu, B.; Cai, Z. Polypyrrole Coated Knitted Fabric for Robust Wearable Sensor and Heater. J. Mater. Sci. 2018, 29, 9218–9226. [Google Scholar] [CrossRef]
- Ceken, F.; Kayacan, Ö.; Özkurt, A.; Uğurlu, Ş.S. The Electromagnetic Shielding Properties of Some Conductive Knitted Fabrics Produced on Single or Double Needle Bed of a Flat Knitting Machine. J. Text. Inst. 2012, 103, 968–979. [Google Scholar] [CrossRef]
- Tong, J.H.; Liu, S.; Yang, C.X.; Li, L. Modeling of Package-free Flexible Conductive Fabric with Thermal Regulation where Temperature can be Customized. Text. Res. J. 2015, 85, 590–600. [Google Scholar] [CrossRef]
- Liu, S.; Tong, J.H.; Yang, C.X.; Li, L. Smart E-textile: Resistance Properties of Conductive Knitted Fabric—Single Pique. Text. Res. J. 2017, 87, 1669–1684. [Google Scholar] [CrossRef]
- Liu, S.; Yang, C.X.; Zhao, Y.F.; Tao, X.M.; Tong, J.H.; Li, L. The Impact of Float Stitches on the Resistance of Conductive Knitted Structures. Text. Res. J. 2016, 86, 1455–1473. [Google Scholar] [CrossRef]
- Li, L.; Liu, S.; Ding, F.; Hua, T.; Au, W.M.; Wong, K.S. Electromechanical Analysis of Length-related Resistance and Contact Resistance of Conductive Knitted Fabrics. Text. Res. J. 2012, 82, 2062–2070. [Google Scholar] [CrossRef]
- Li, L.; Wai-man, A.; Ding, F.; Hua, T.; Wong, K.S. Wearable Electronic Design: Electrothermal Properties of Conductive Knitted Fabrics. Text. Res. J. 2014, 84, 477. [Google Scholar] [CrossRef]
- Tong, J.; Ding, F.; Tao, X.M.; Au, W.M.; Li, L. Temperature Effect on the Conductivity of Knitted Fabrics Embedded with Conducting Yarns. Text. Res. J. 2014, 84, 1849–1857. [Google Scholar]
- Hamdani, S.T.A.; Fernando, A.; Hussain, M.D.; Potluri, P. Study of Electro-thermal Properties of Pyrrole Polymerised Knitted Fabrics. J. Ind. Text. 2016, 46, 771–786. [Google Scholar] [CrossRef]


| Material | Yarn Count | Composition | Linear Resistance | Supplier |
|---|---|---|---|---|
| Silver-coated yarn A | 47 tex | Nylon 66 coated with silver | 1 Ω/cm | Germany Statex Produktions and Vertriebs GmbH |
| Silver-coated yarn B | 2 tex | Nylon 6 coated with silver | 69 Ω/cm | |
| Wool | 77 tex | 100% merino wool | Nonconductive | HongTai Cashmere Production Company |
| Polyester yarn | 22 tex | Polyester fiber | Nonconductive | Tongxiang Tonglun Textile Co., Ltd. |
| Sample No. | Number of Transverse Knitting Stitches (pcs) | Number of Longitudinal Knitting Stitches (pcs) | Total Number of Stitches | NP Value (Related to Tension) | Pulling Value |
|---|---|---|---|---|---|
| S1 | 6 | 9 | 54 | 90 | 10 |
| S2 | 5 | 15 | 75 | 82 | 10 |
| S3 | 8 | 20 | 160 | 80 | 10 |
| S4 | 10 | 10 | 100 | 70 | 10 |
| S5 | 6 | 17 | 102 | 85 | 10 |
| S6 | 6 | 20 | 120 | 85 | 10 |
| Voltage | 1 V | 2 V | 3 V | |||||||
|---|---|---|---|---|---|---|---|---|---|---|
| Sample No. | 1 | 2 | 3 | 1 | 2 | 3 | 1 | 2 | 3 | |
| S1 | RV | 16.78 | 16.77 | 16.75 | 16.89 | 16.72 | 16.58 | 16.57 | 16.29 | 16.09 |
| X ± SD | 16.77 ± 0.01 | 16.73 ± 0.13 | 16.32 ± 0.20 | |||||||
| S2 | RV | 11.79 | 11.79 | 11.7 | 11.85 | 11.73 | 11.48 | 10.97 | 10.6 | 10.38 |
| X ± SD | 11.76 ± 0.04 | 11.69 ± 0.15 | 10.65 ± 0.24 | |||||||
| S3 | RV | 5.76 | 5.75 | 5.71 | 5.47 | 5.27 | 5.14 | 3.81 | 4.1 | 4.03 |
| X ± SD | 5.74 ± 0.02 | 5.29 ± 0.14 | 3.98 ± 0.12 | |||||||
| S4 | RV | 25.71 | 25.54 | 25.3 | 25.38 | 25.3 | 25.27 | 25.4 | 25.23 | 25.07 |
| X ± SD | 25.52 ± 0.17 | 25.32 ± 0.05 | 25.23 ± 0.13 | |||||||
| S5 | RV | 11.44 | 11.43 | 11.41 | 11.51 | 11.47 | 11.42 | 11.35 | 11.19 | 11.08 |
| X ± SD | 11.43 ± 0.01 | 11.47 ± 0.04 | 11.21 ± 0.11 | |||||||
| S6 | RV | 10.36 | 10.34 | 10.32 | 10.39 | 10.29 | 10.20 | 10.02 | 9.75 | 9.55 |
| X ± SD | 10.34 ± 0.02 | 10.29 ± 0.08 | 9.77 ± 0.19 | |||||||
| Length (cm) | Resistance Before Heating (Ω) | Resistance After Heating (Ω) | Rate of Resistance Change (%) |
|---|---|---|---|
| 4.5 | 290.45 | 241.83 | −16.7 |
| 3.5 | 225.97 | 179.39 | −20.6 |
| 3.2 | 210.45 | 154.86 | −26.4 |
| Sample No. | Equation |
|---|---|
| S1 | R0 = 16.69 − 0.49U |
| S2 | R = 11.06 − 0.60U |
| S3 | R = 5.12 − 0.76U |
| S4 | R = 25.20 − 0.76U |
| S5 | R = 11.36 − 0.36U |
| S6 | R = 10.02 − 0.52U |
© 2019 by the authors. Licensee MDPI, Basel, Switzerland. This article is an open access article distributed under the terms and conditions of the Creative Commons Attribution (CC BY) license (http://creativecommons.org/licenses/by/4.0/).
Share and Cite
Sun, K.; Liu, S.; Long, H. Structural Parameters Affecting Electrothermal Properties of Woolen Knitted Fabrics Integrated with Silver-Coated Yarns. Polymers 2019, 11, 1709. https://doi.org/10.3390/polym11101709
Sun K, Liu S, Long H. Structural Parameters Affecting Electrothermal Properties of Woolen Knitted Fabrics Integrated with Silver-Coated Yarns. Polymers. 2019; 11(10):1709. https://doi.org/10.3390/polym11101709
Chicago/Turabian StyleSun, Kexia, Su Liu, and Hairu Long. 2019. "Structural Parameters Affecting Electrothermal Properties of Woolen Knitted Fabrics Integrated with Silver-Coated Yarns" Polymers 11, no. 10: 1709. https://doi.org/10.3390/polym11101709
APA StyleSun, K., Liu, S., & Long, H. (2019). Structural Parameters Affecting Electrothermal Properties of Woolen Knitted Fabrics Integrated with Silver-Coated Yarns. Polymers, 11(10), 1709. https://doi.org/10.3390/polym11101709