The Impact of Plasticizer and Degree of Hydrolysis on Free Volume of Poly(vinyl alcohol) Films


Abstract
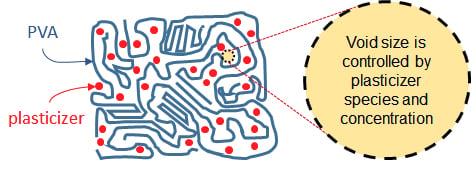
1. Introduction
2. Materials and Methods
2.1. Materials
2.2. Film Preparation
2.3. Positron Annihilation Lifetime Spectroscopy
2.4. Thermogravimetric Analysis
2.5. Dynamic Mechanical Analysis and X-ray Diffraction
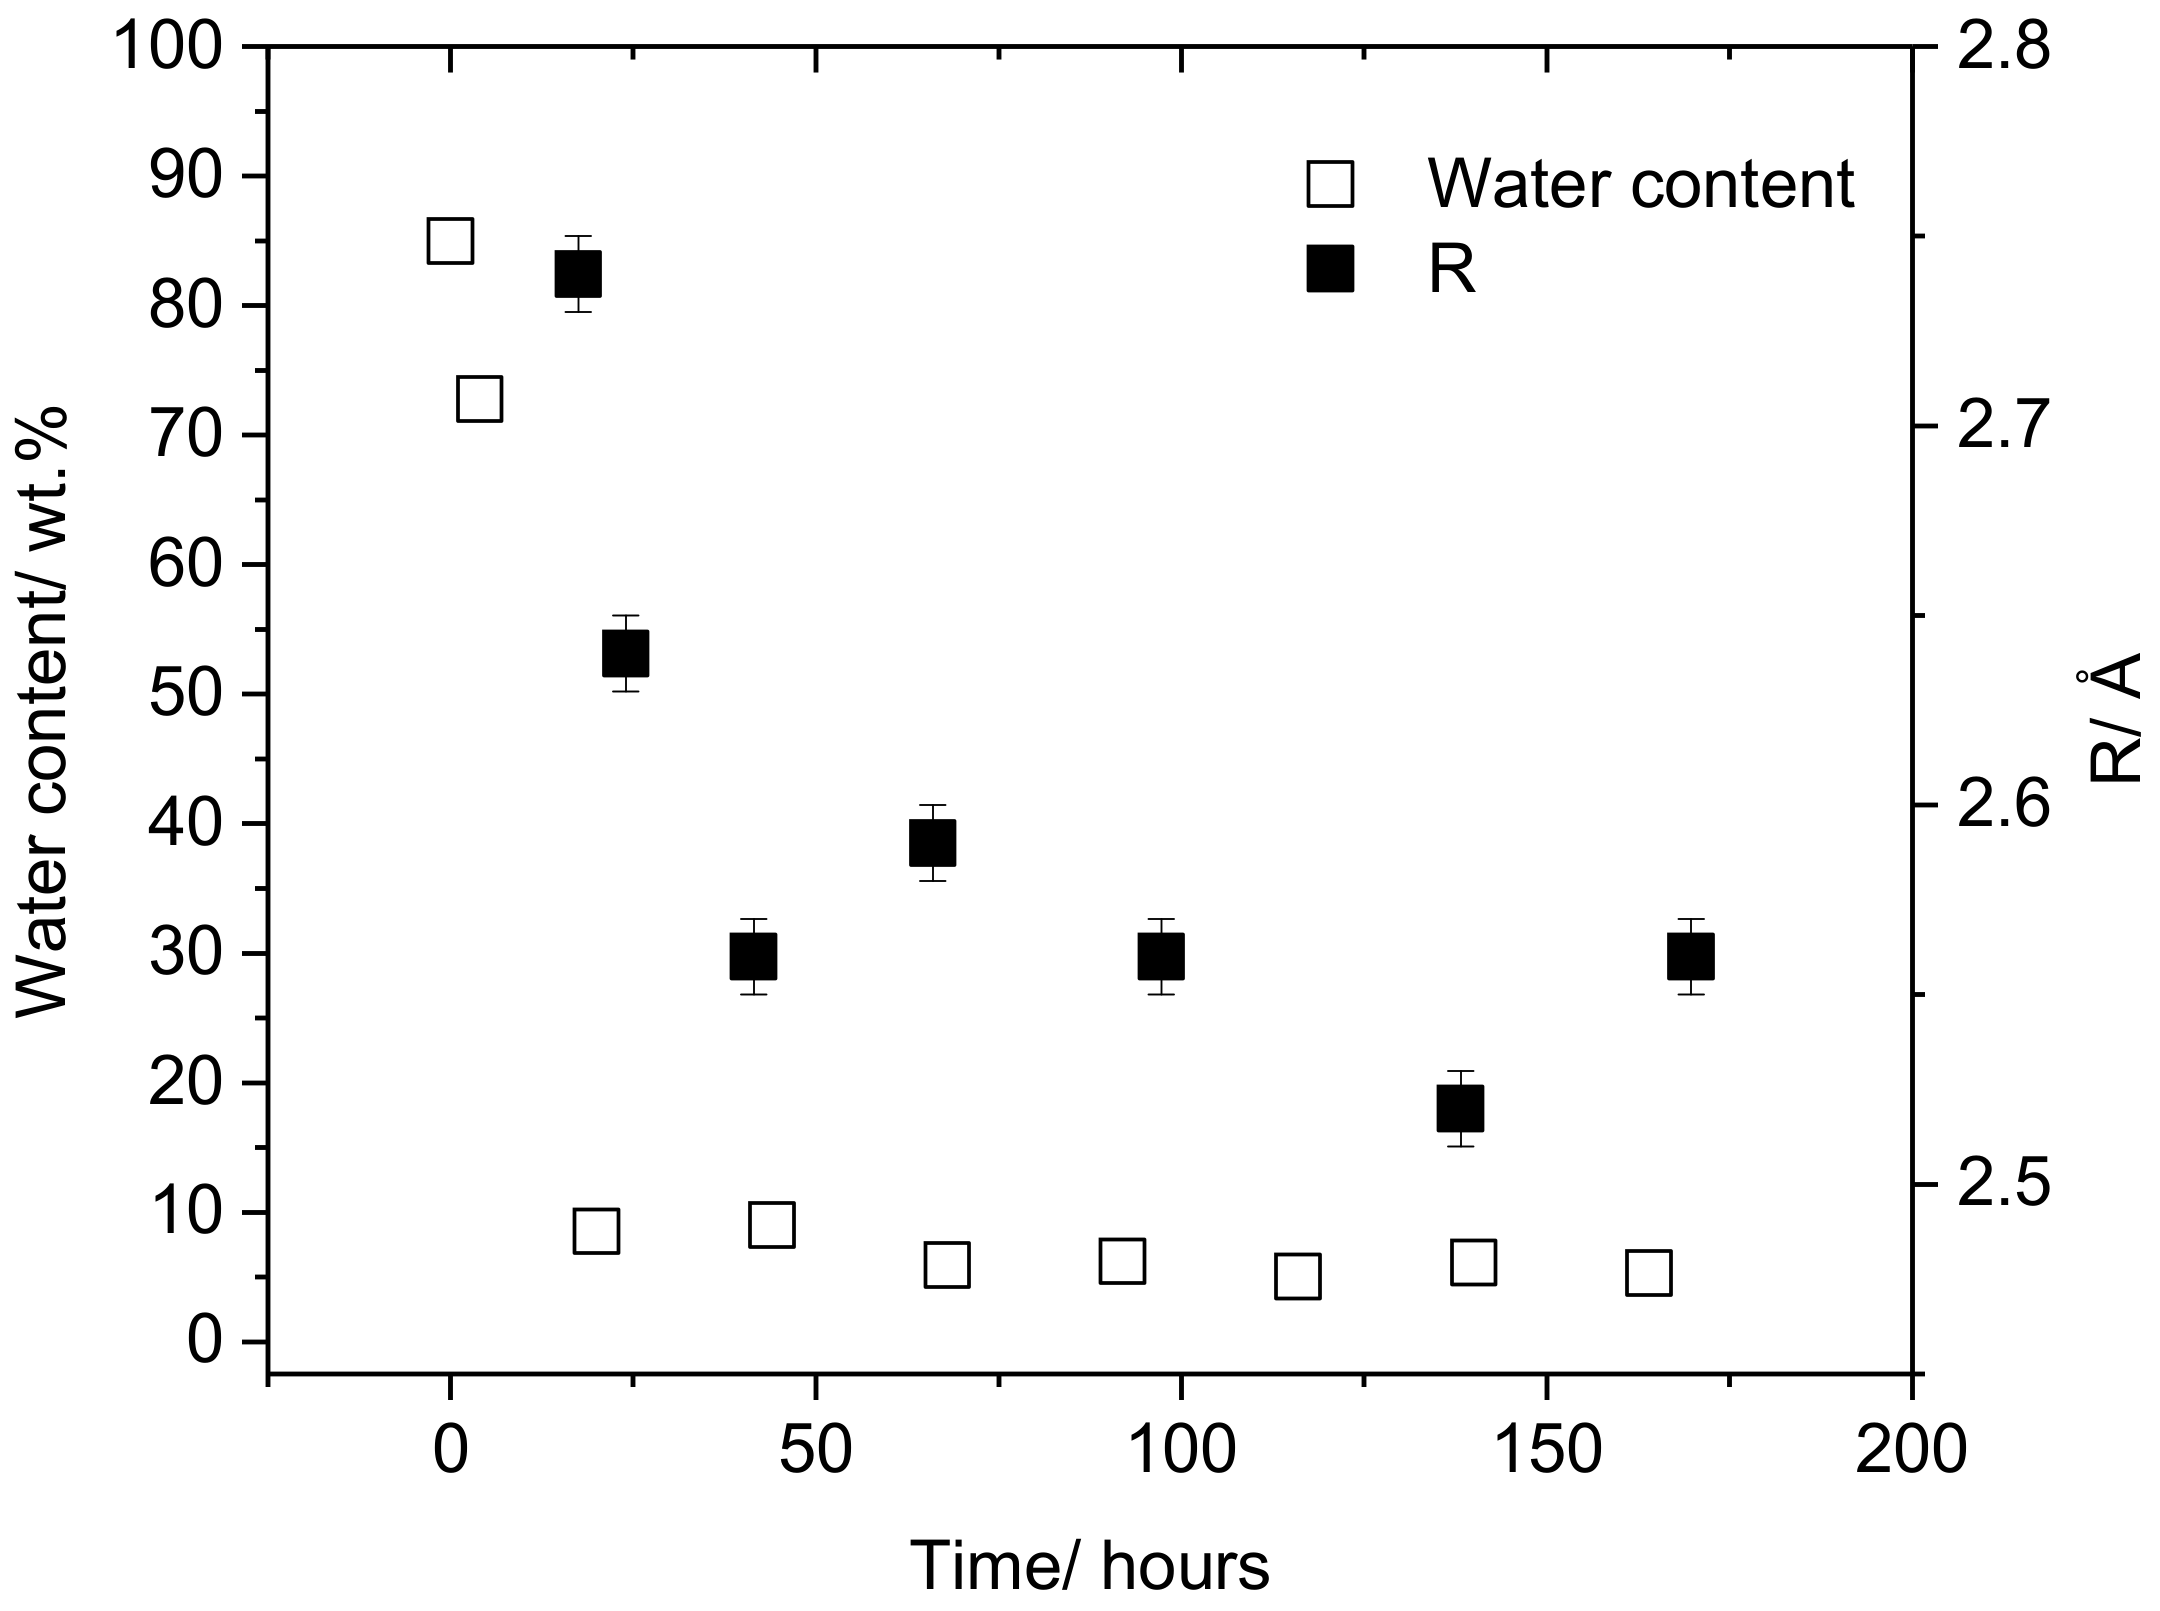
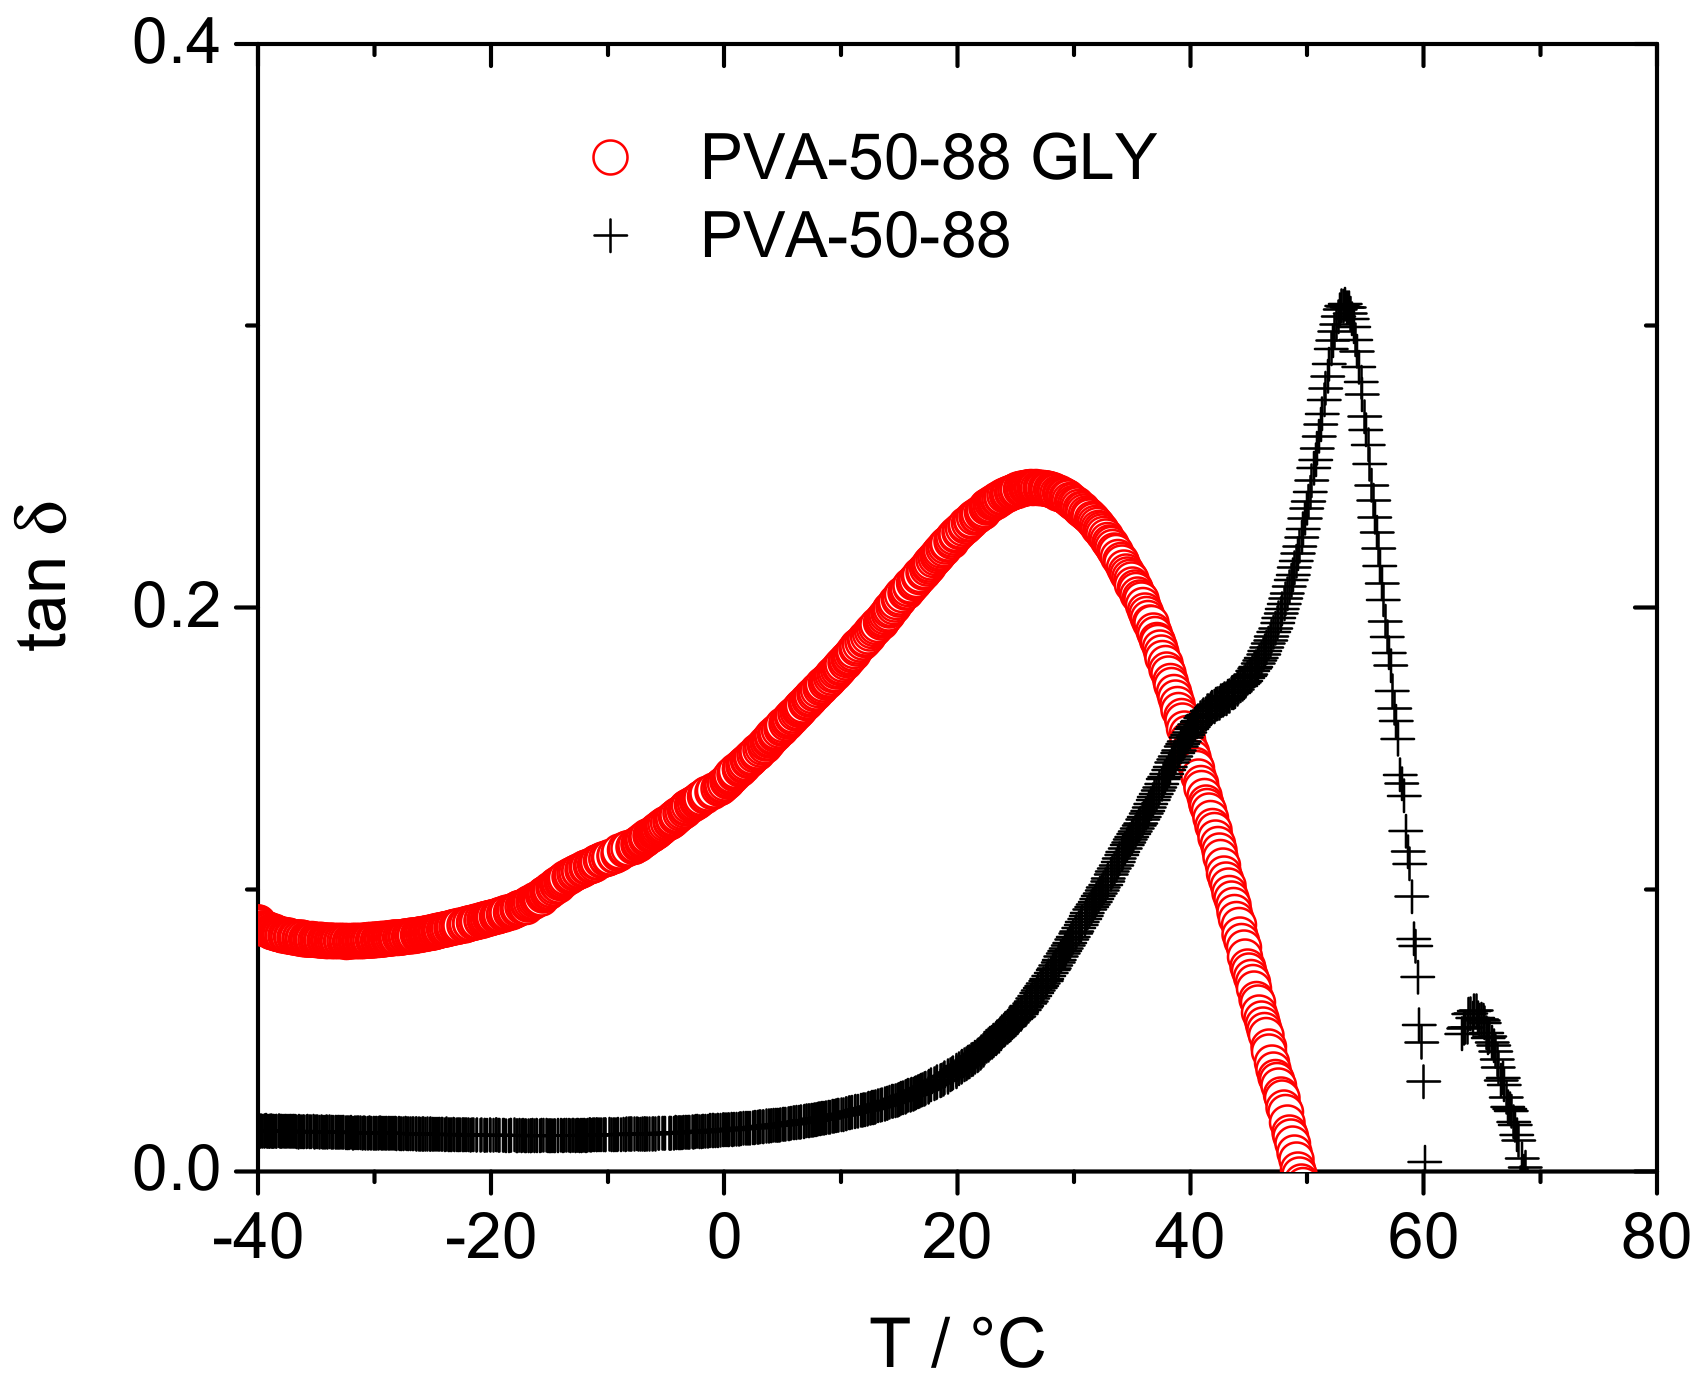
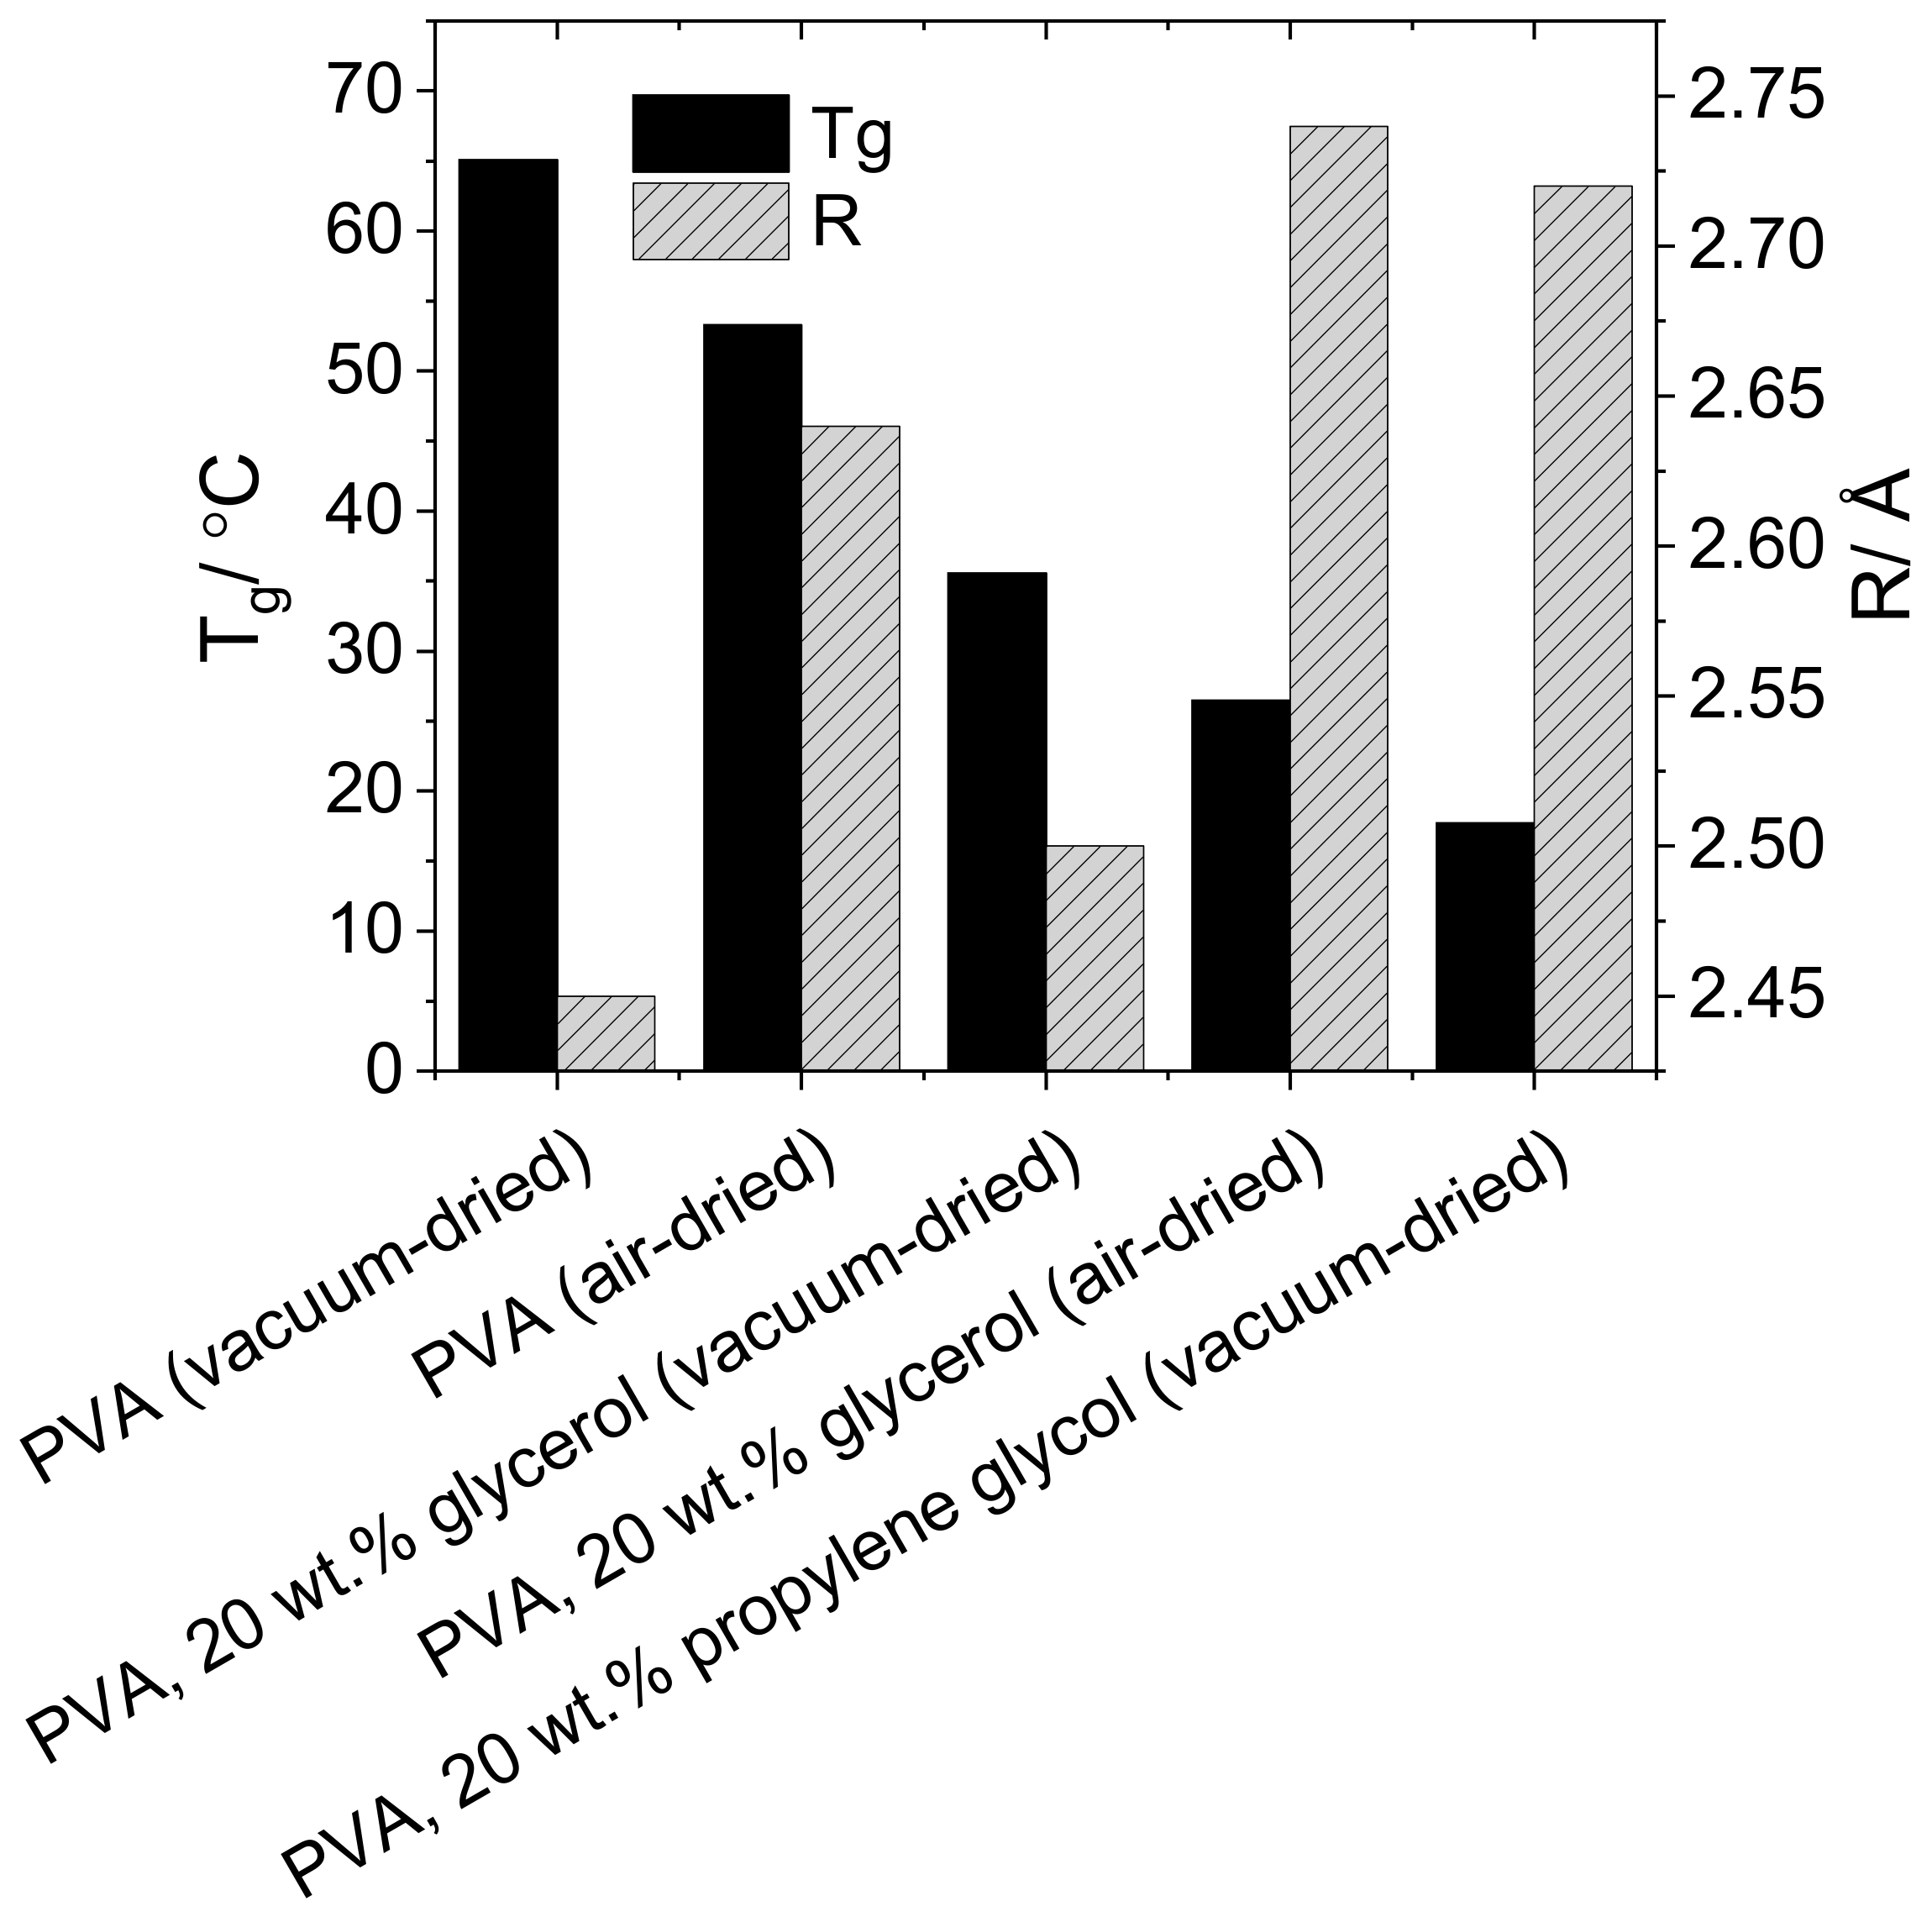
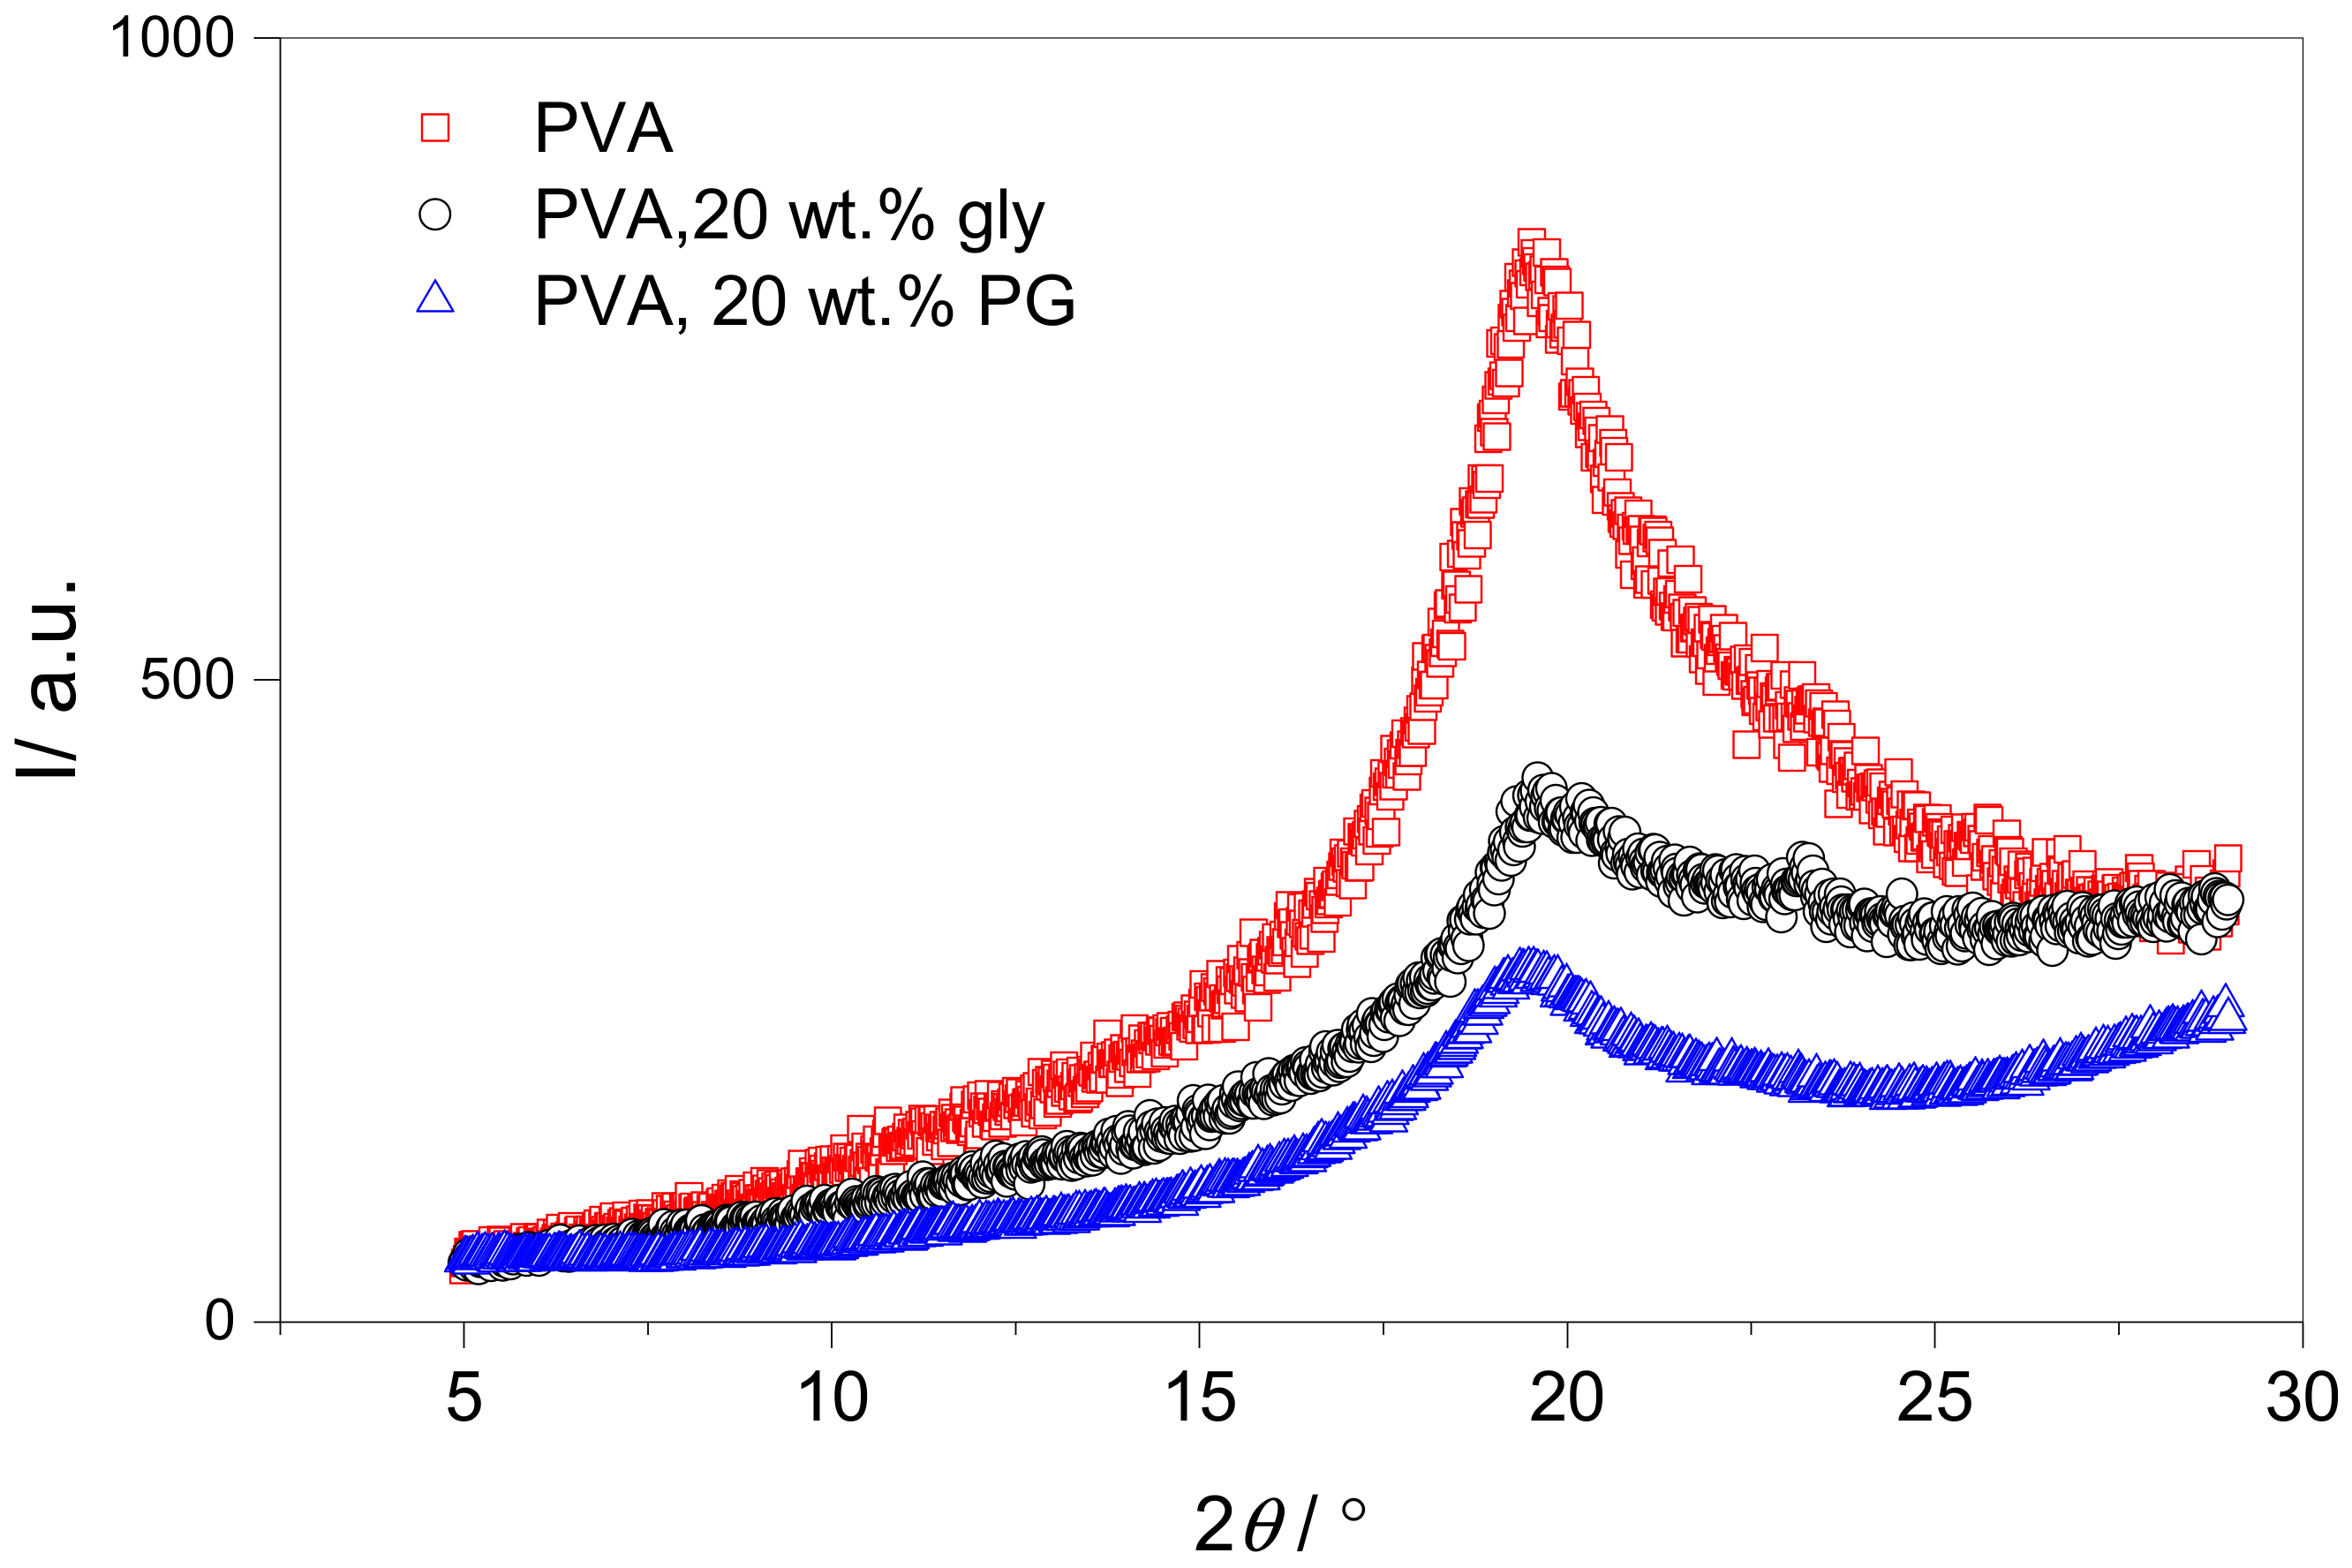
3. Results
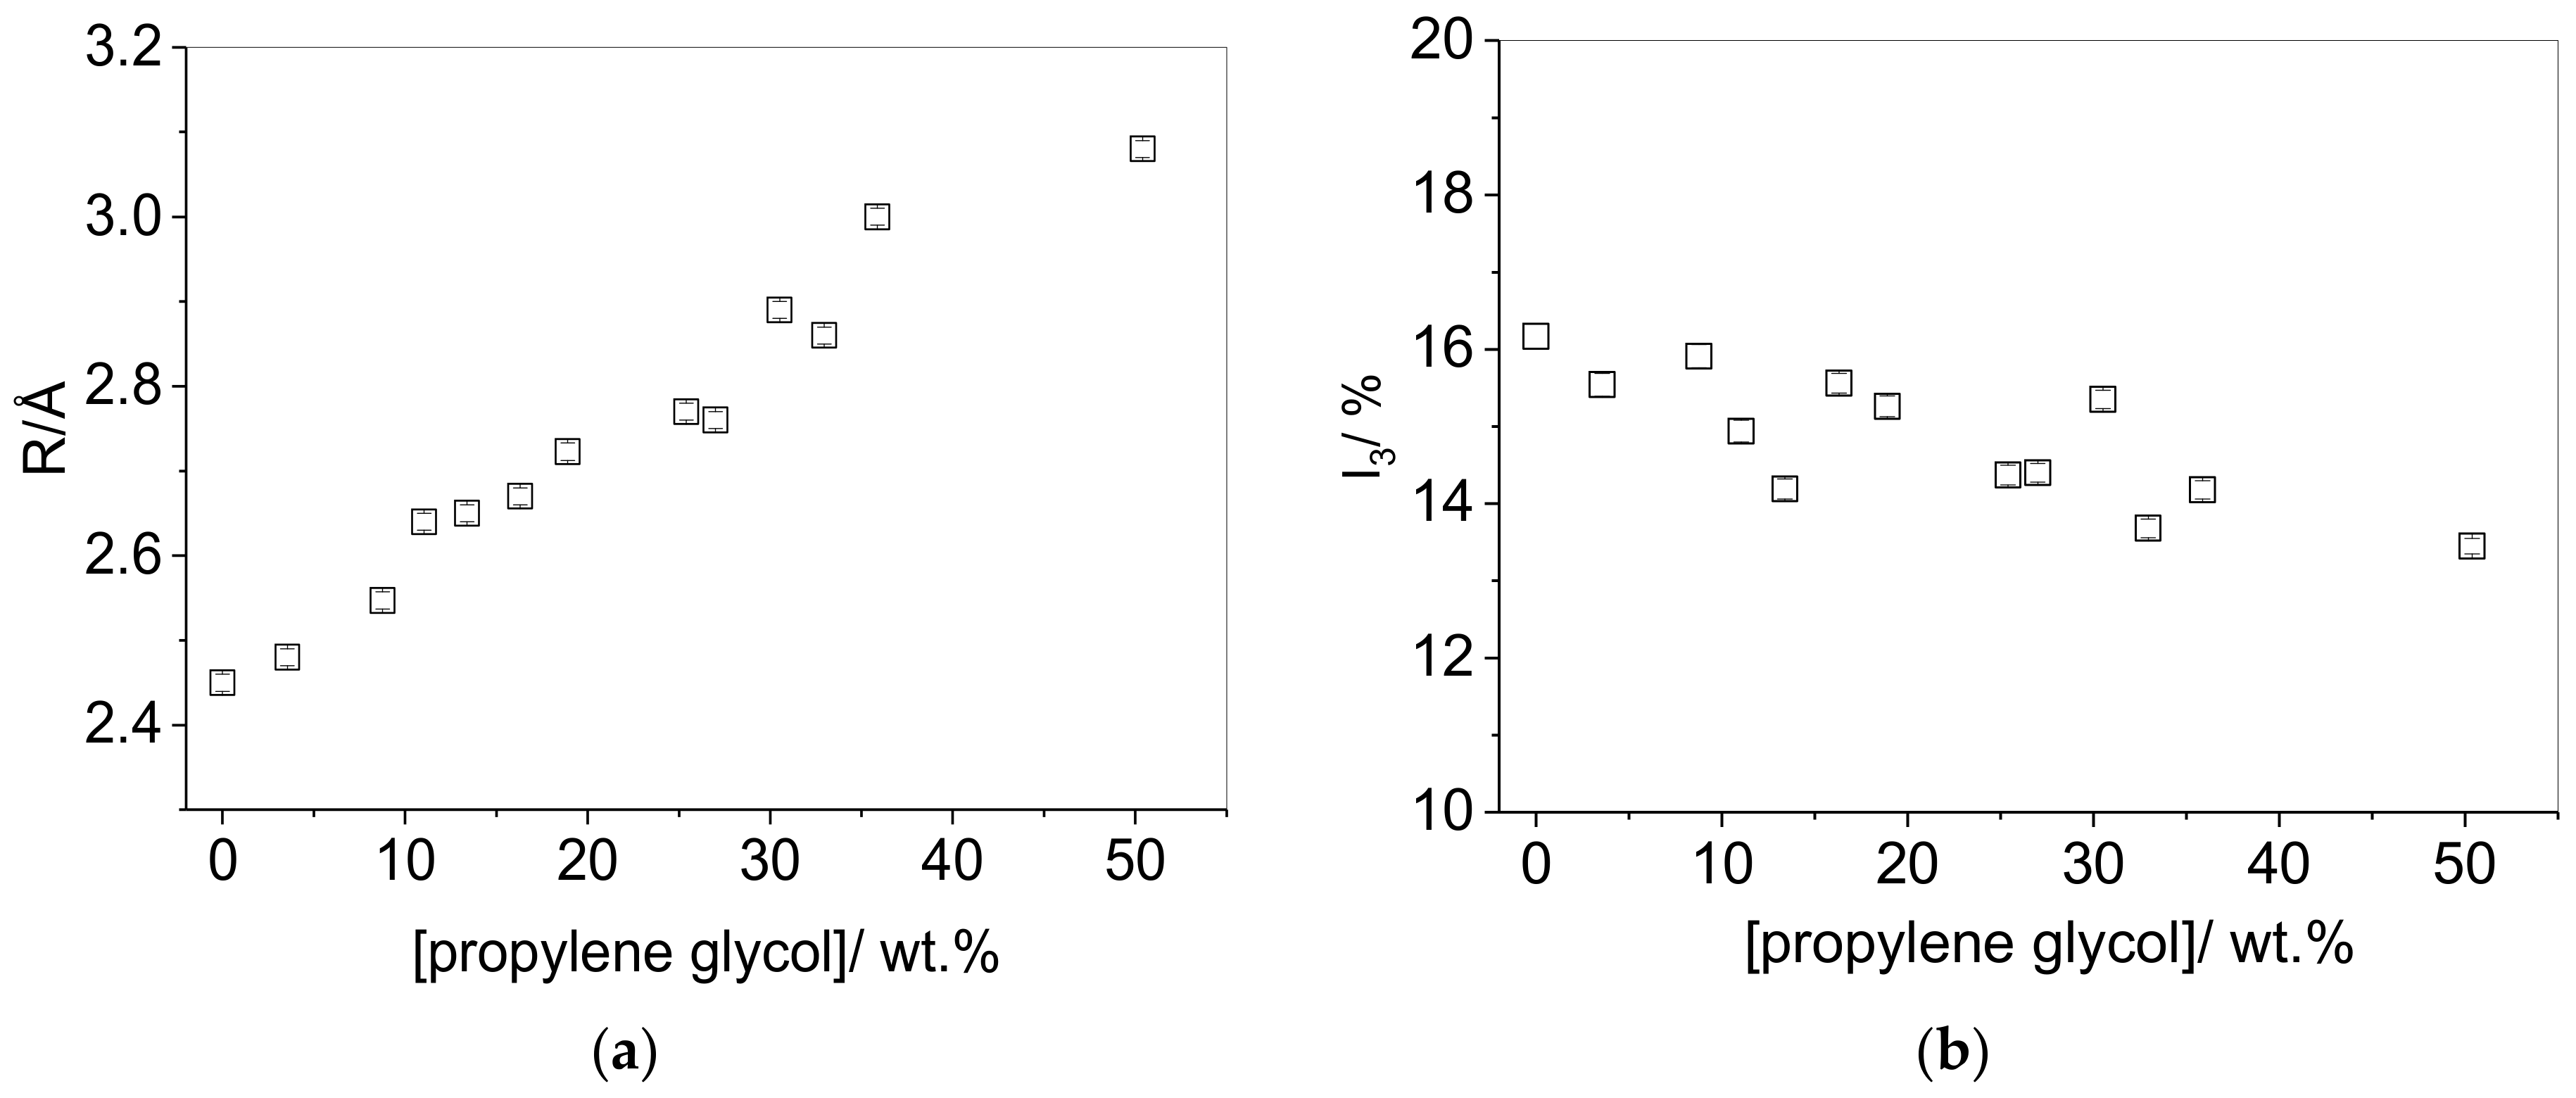
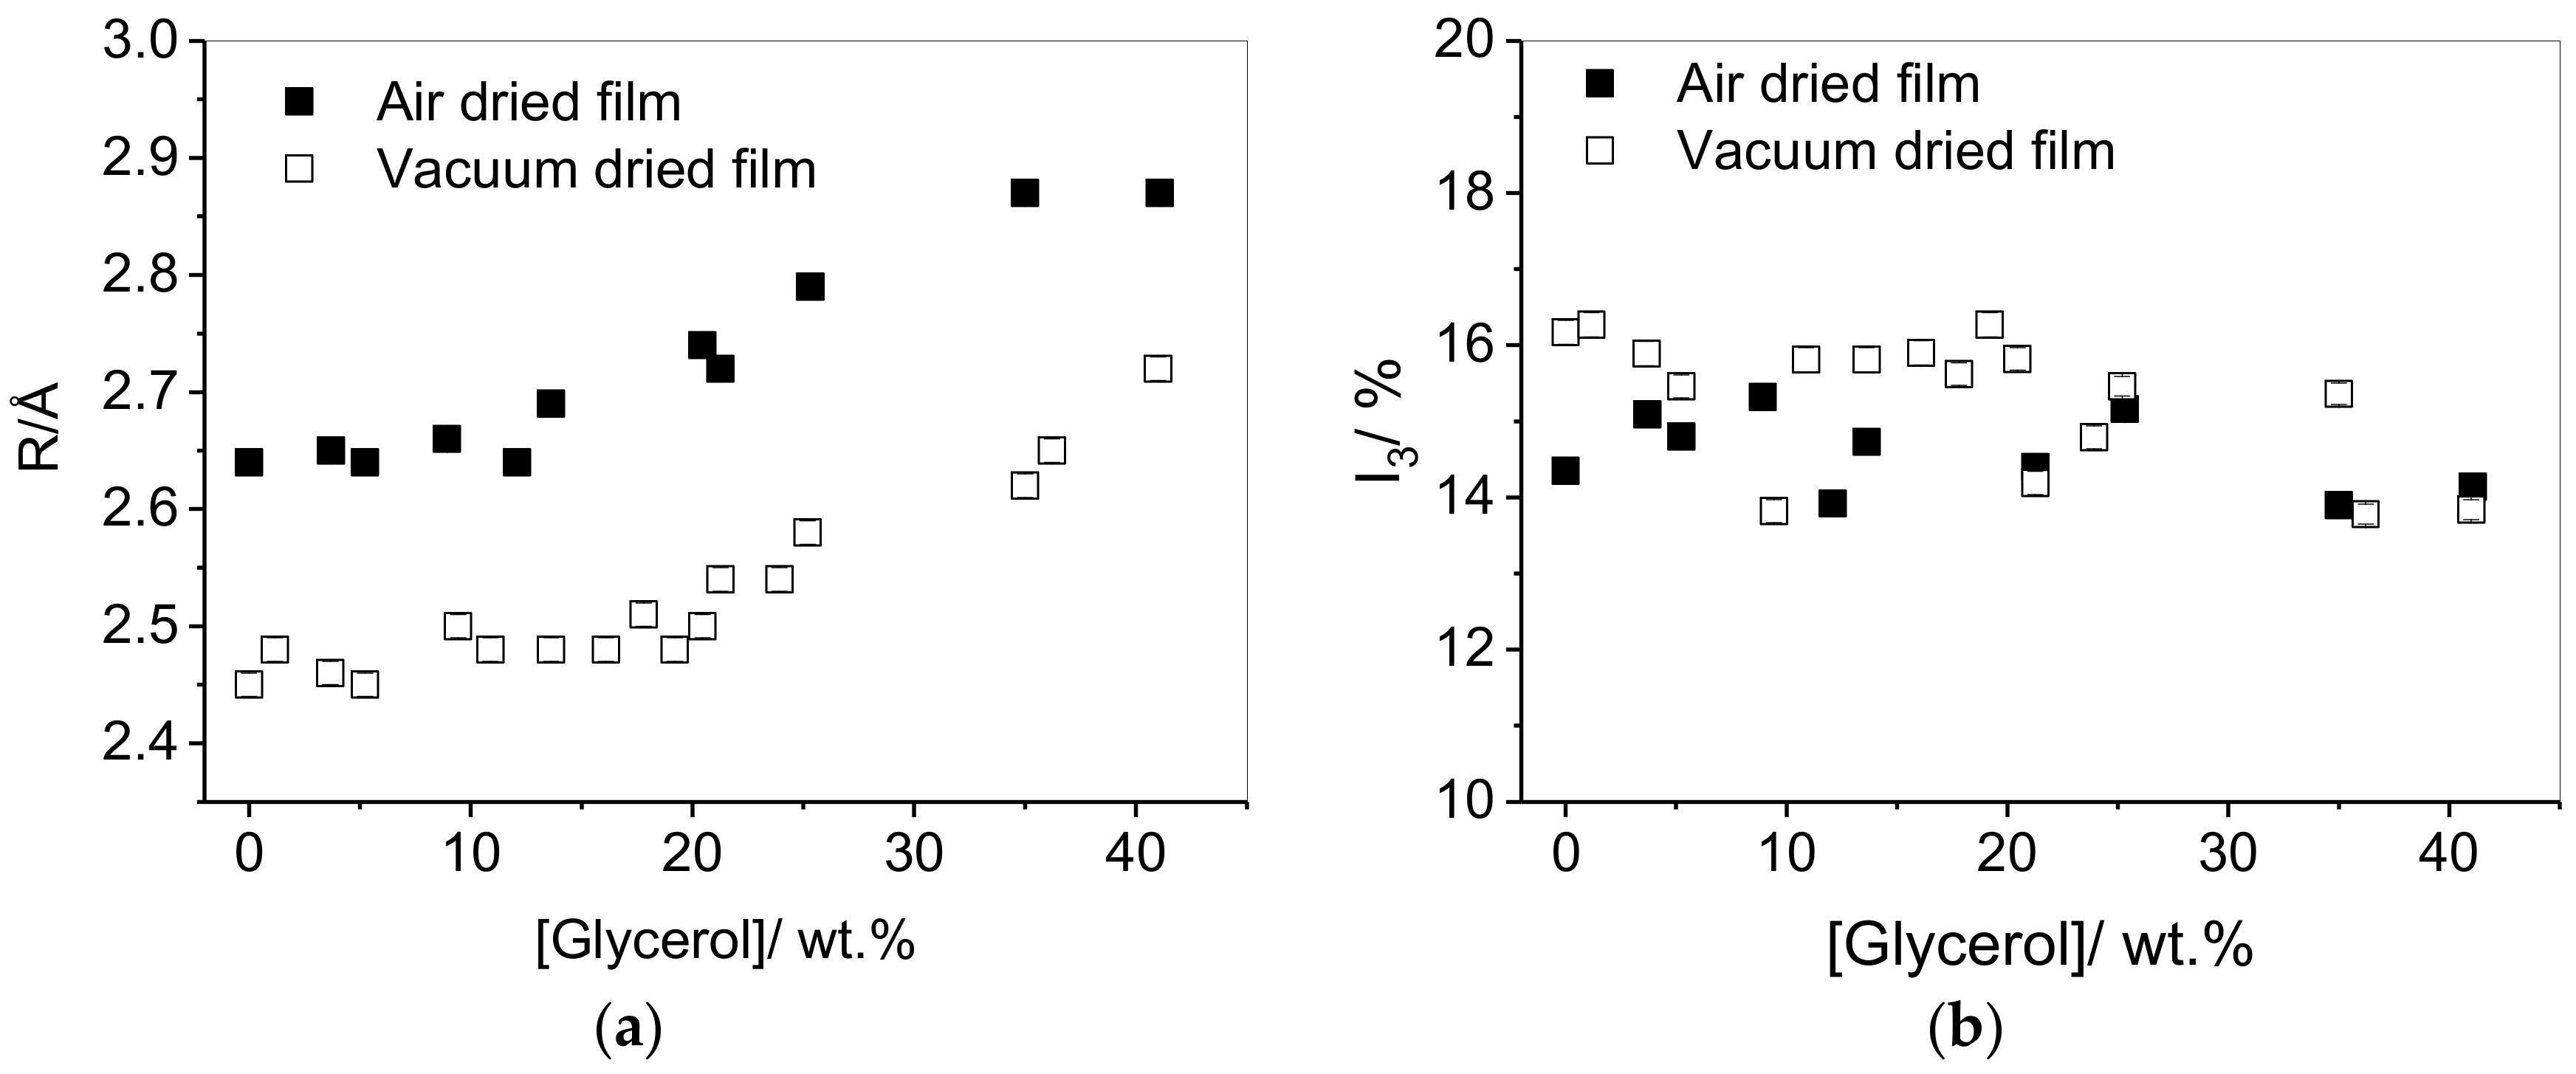
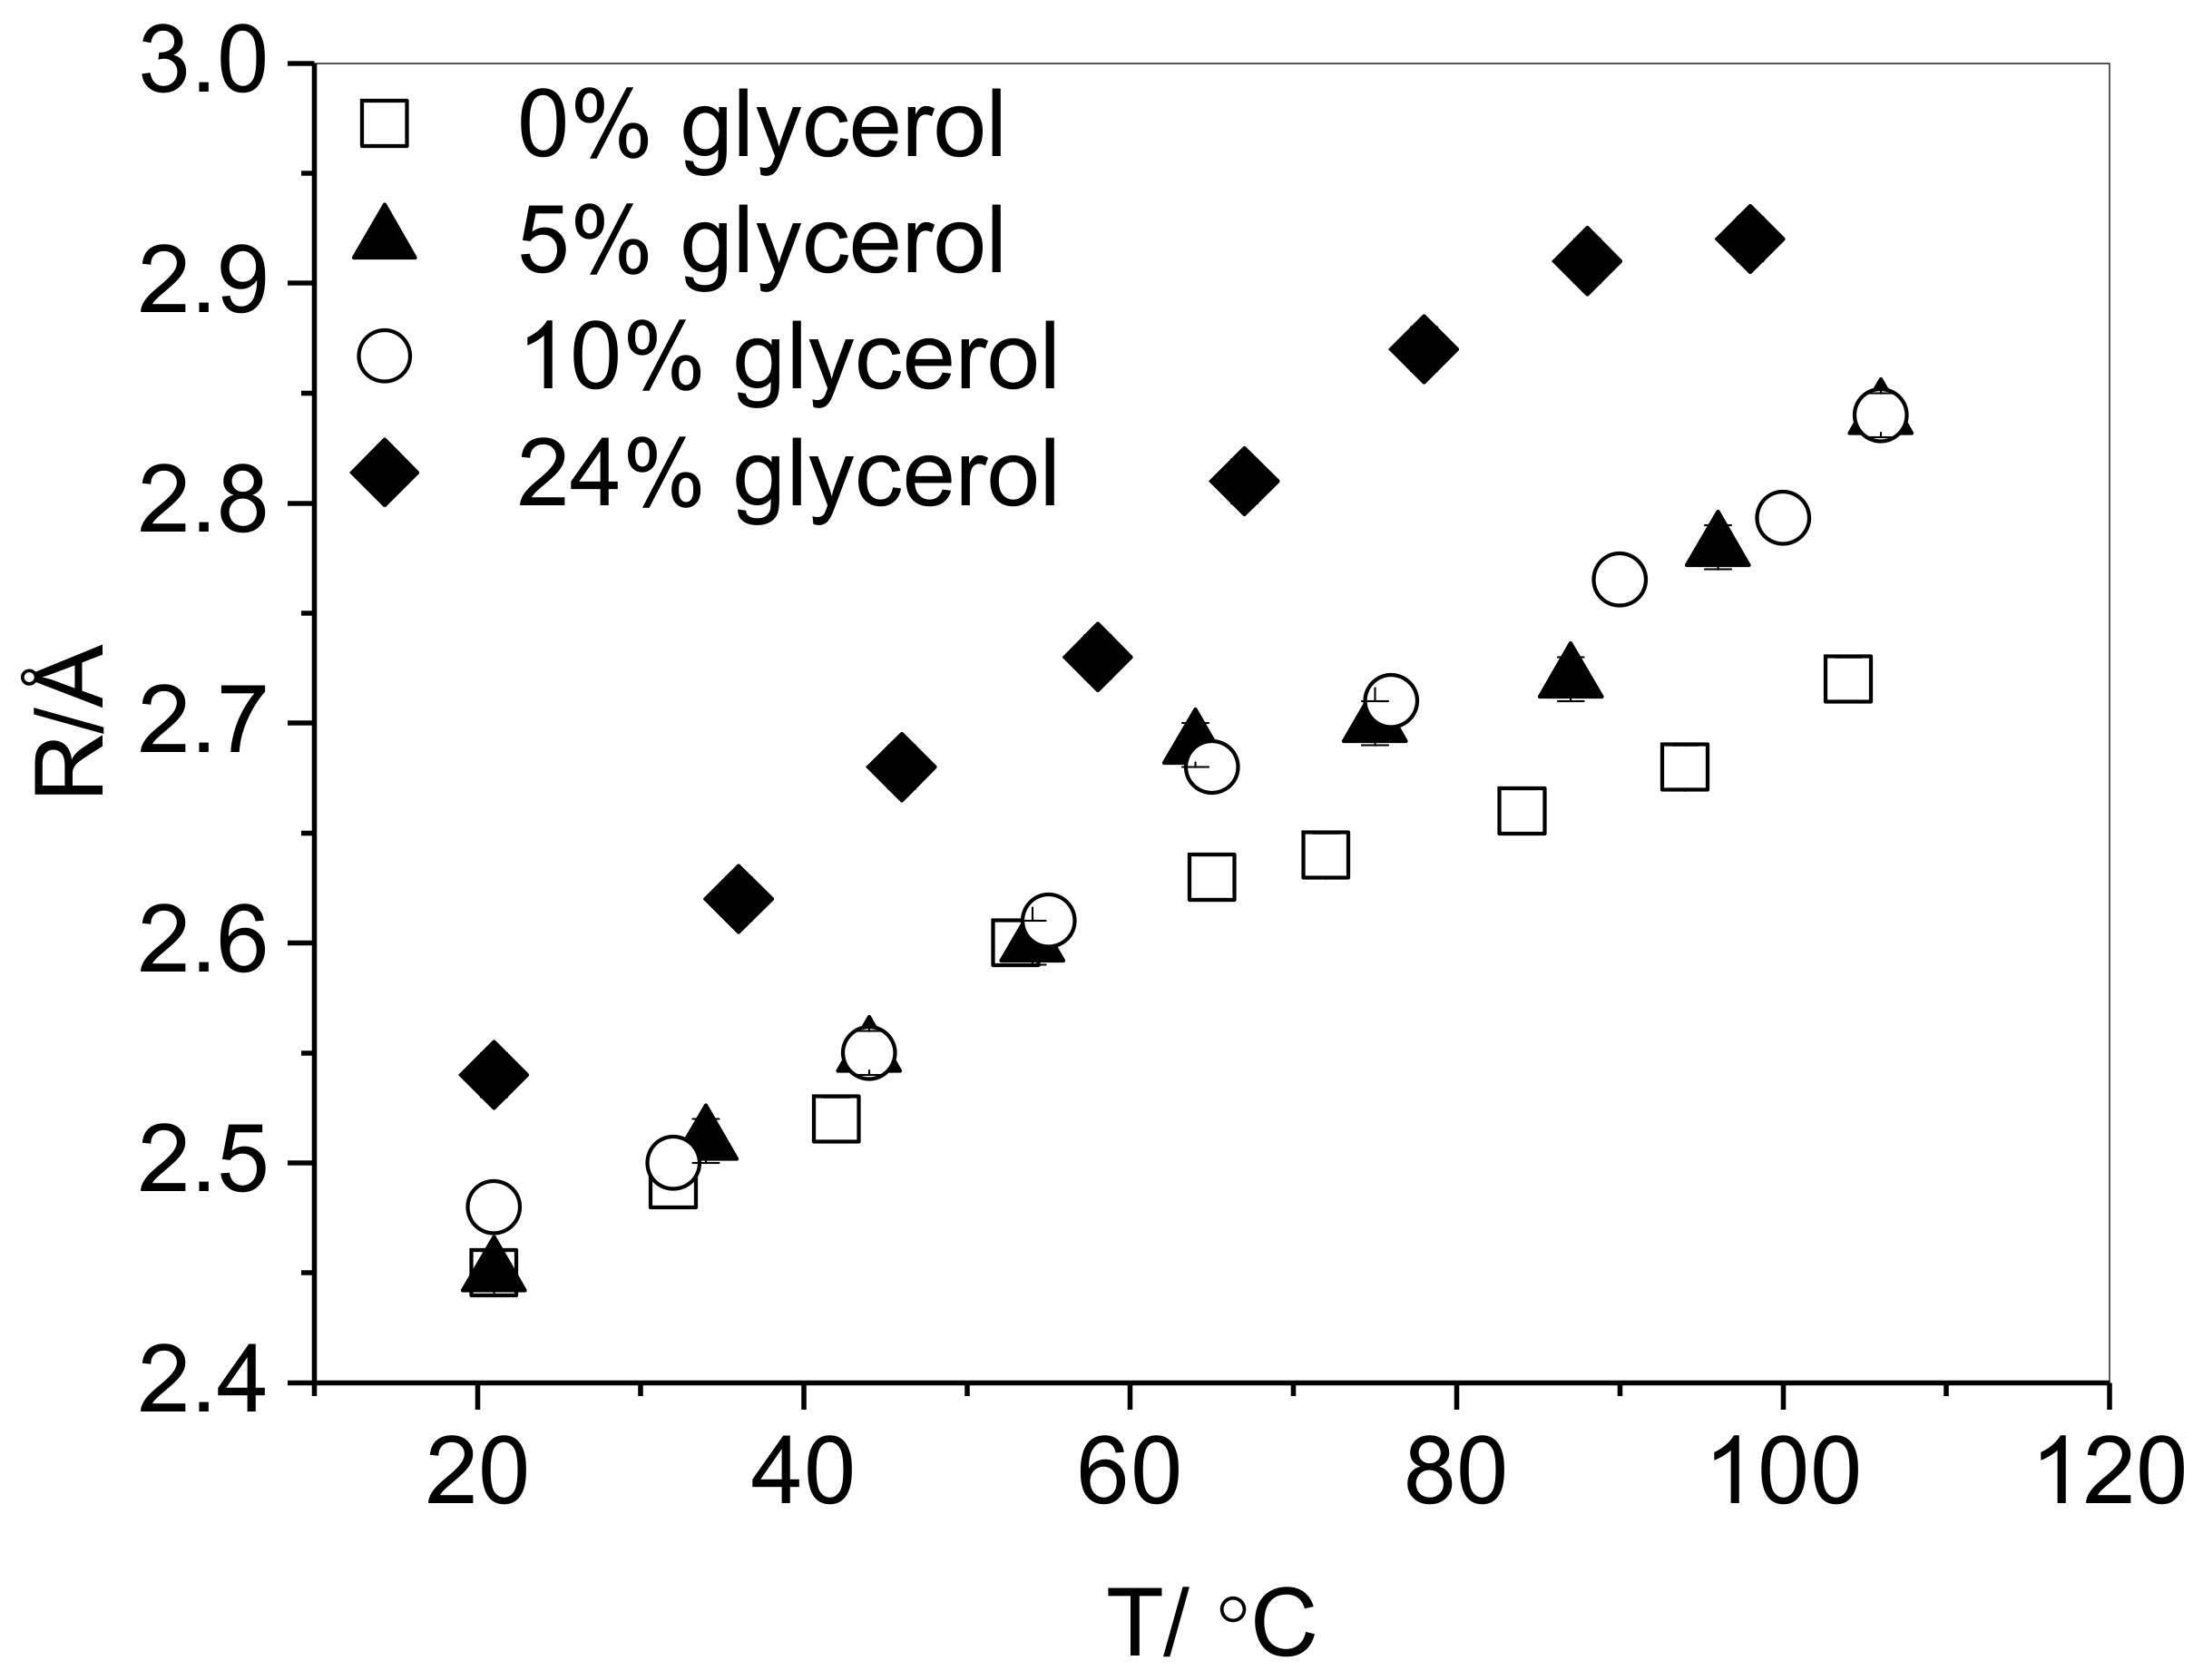
3.1. Effect of Plasticizer Inclusion of PVA Free Volume Properties
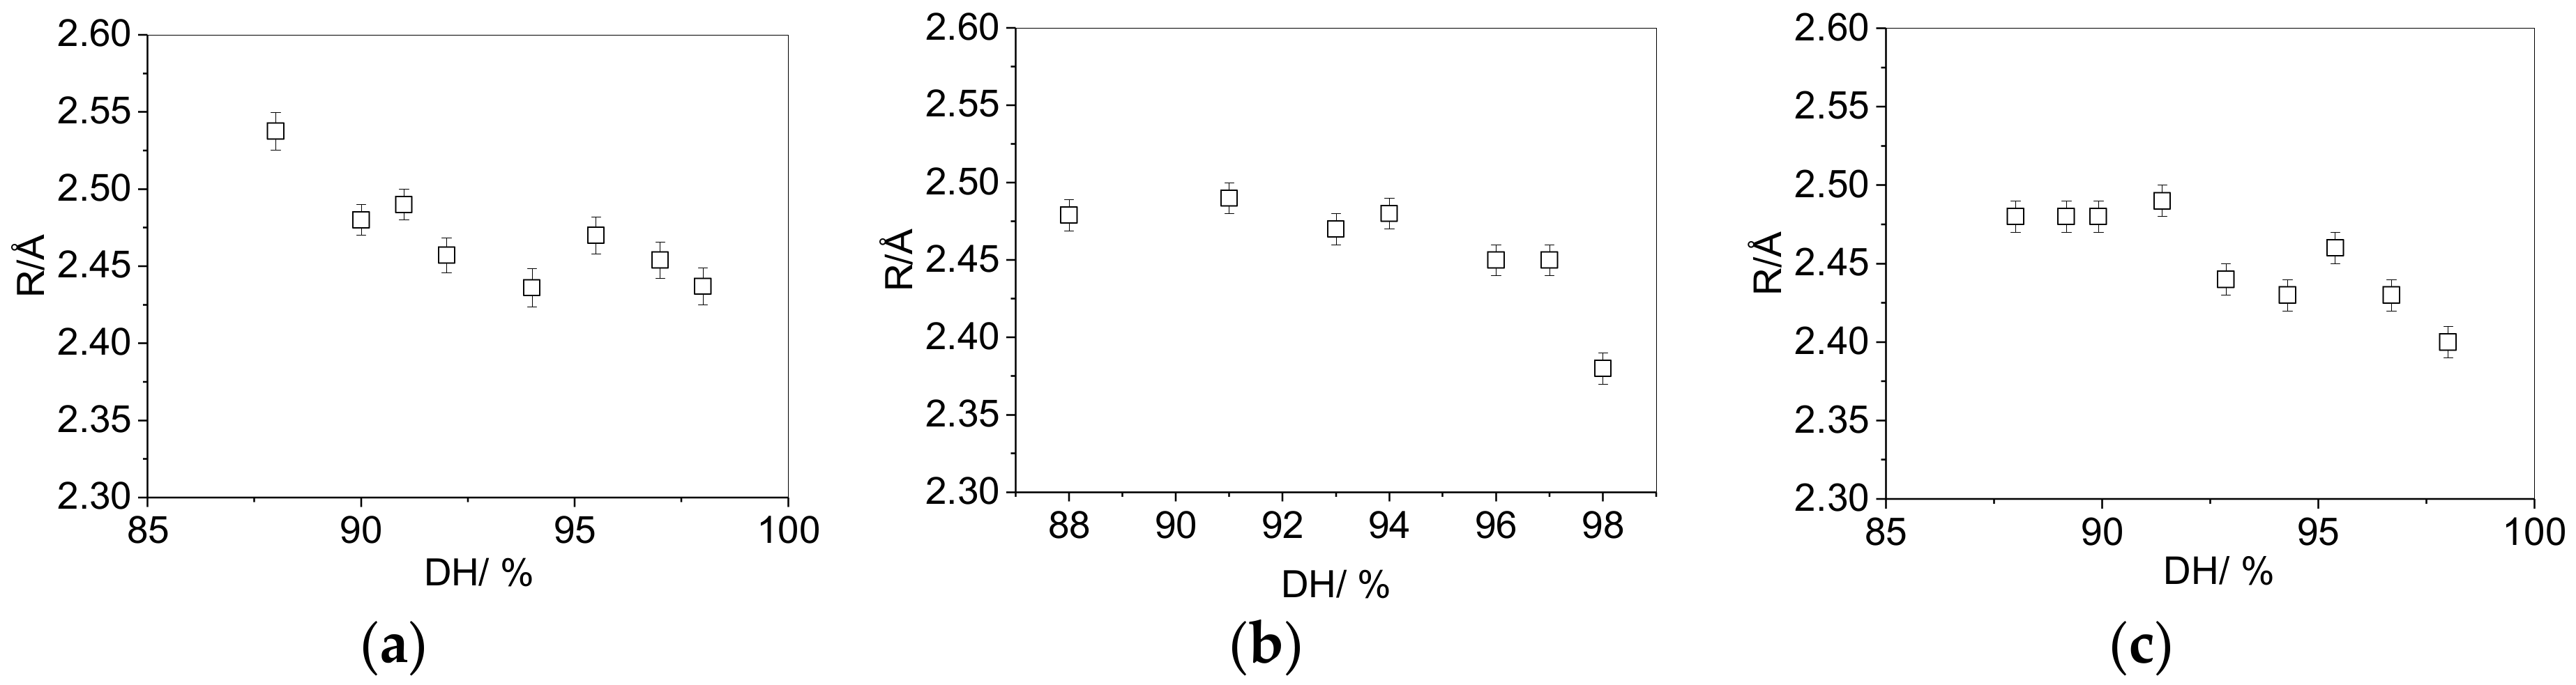
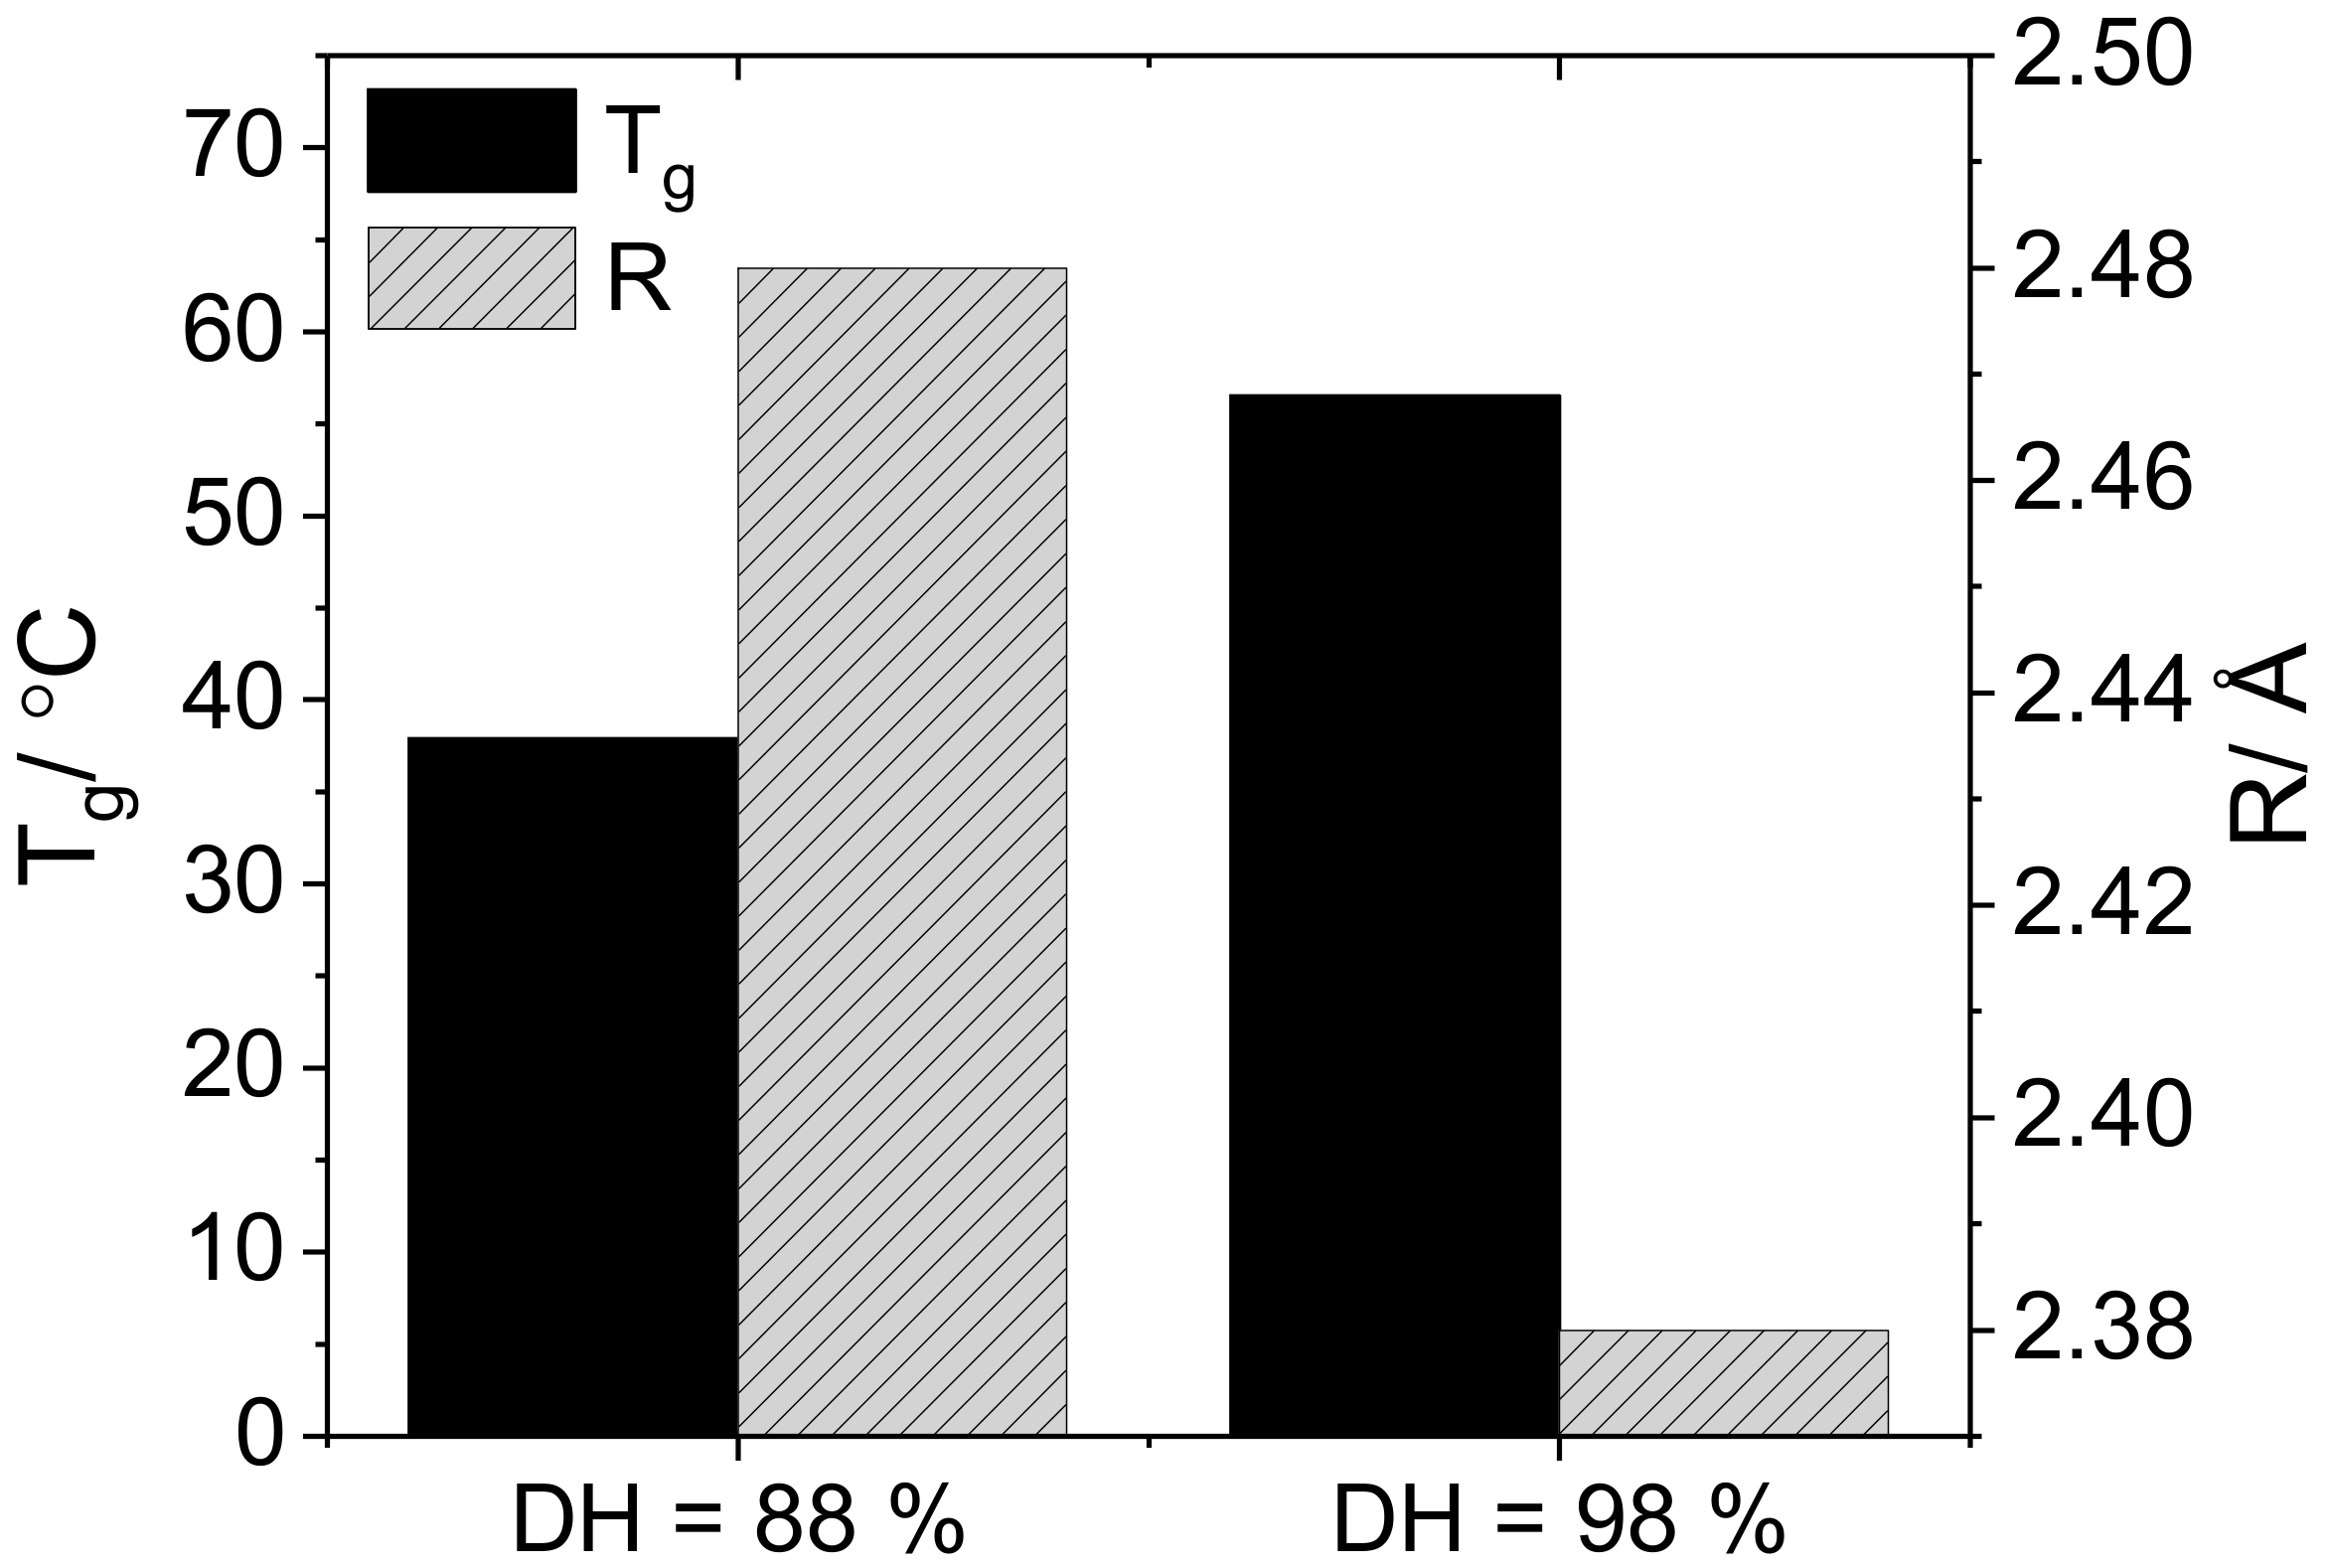
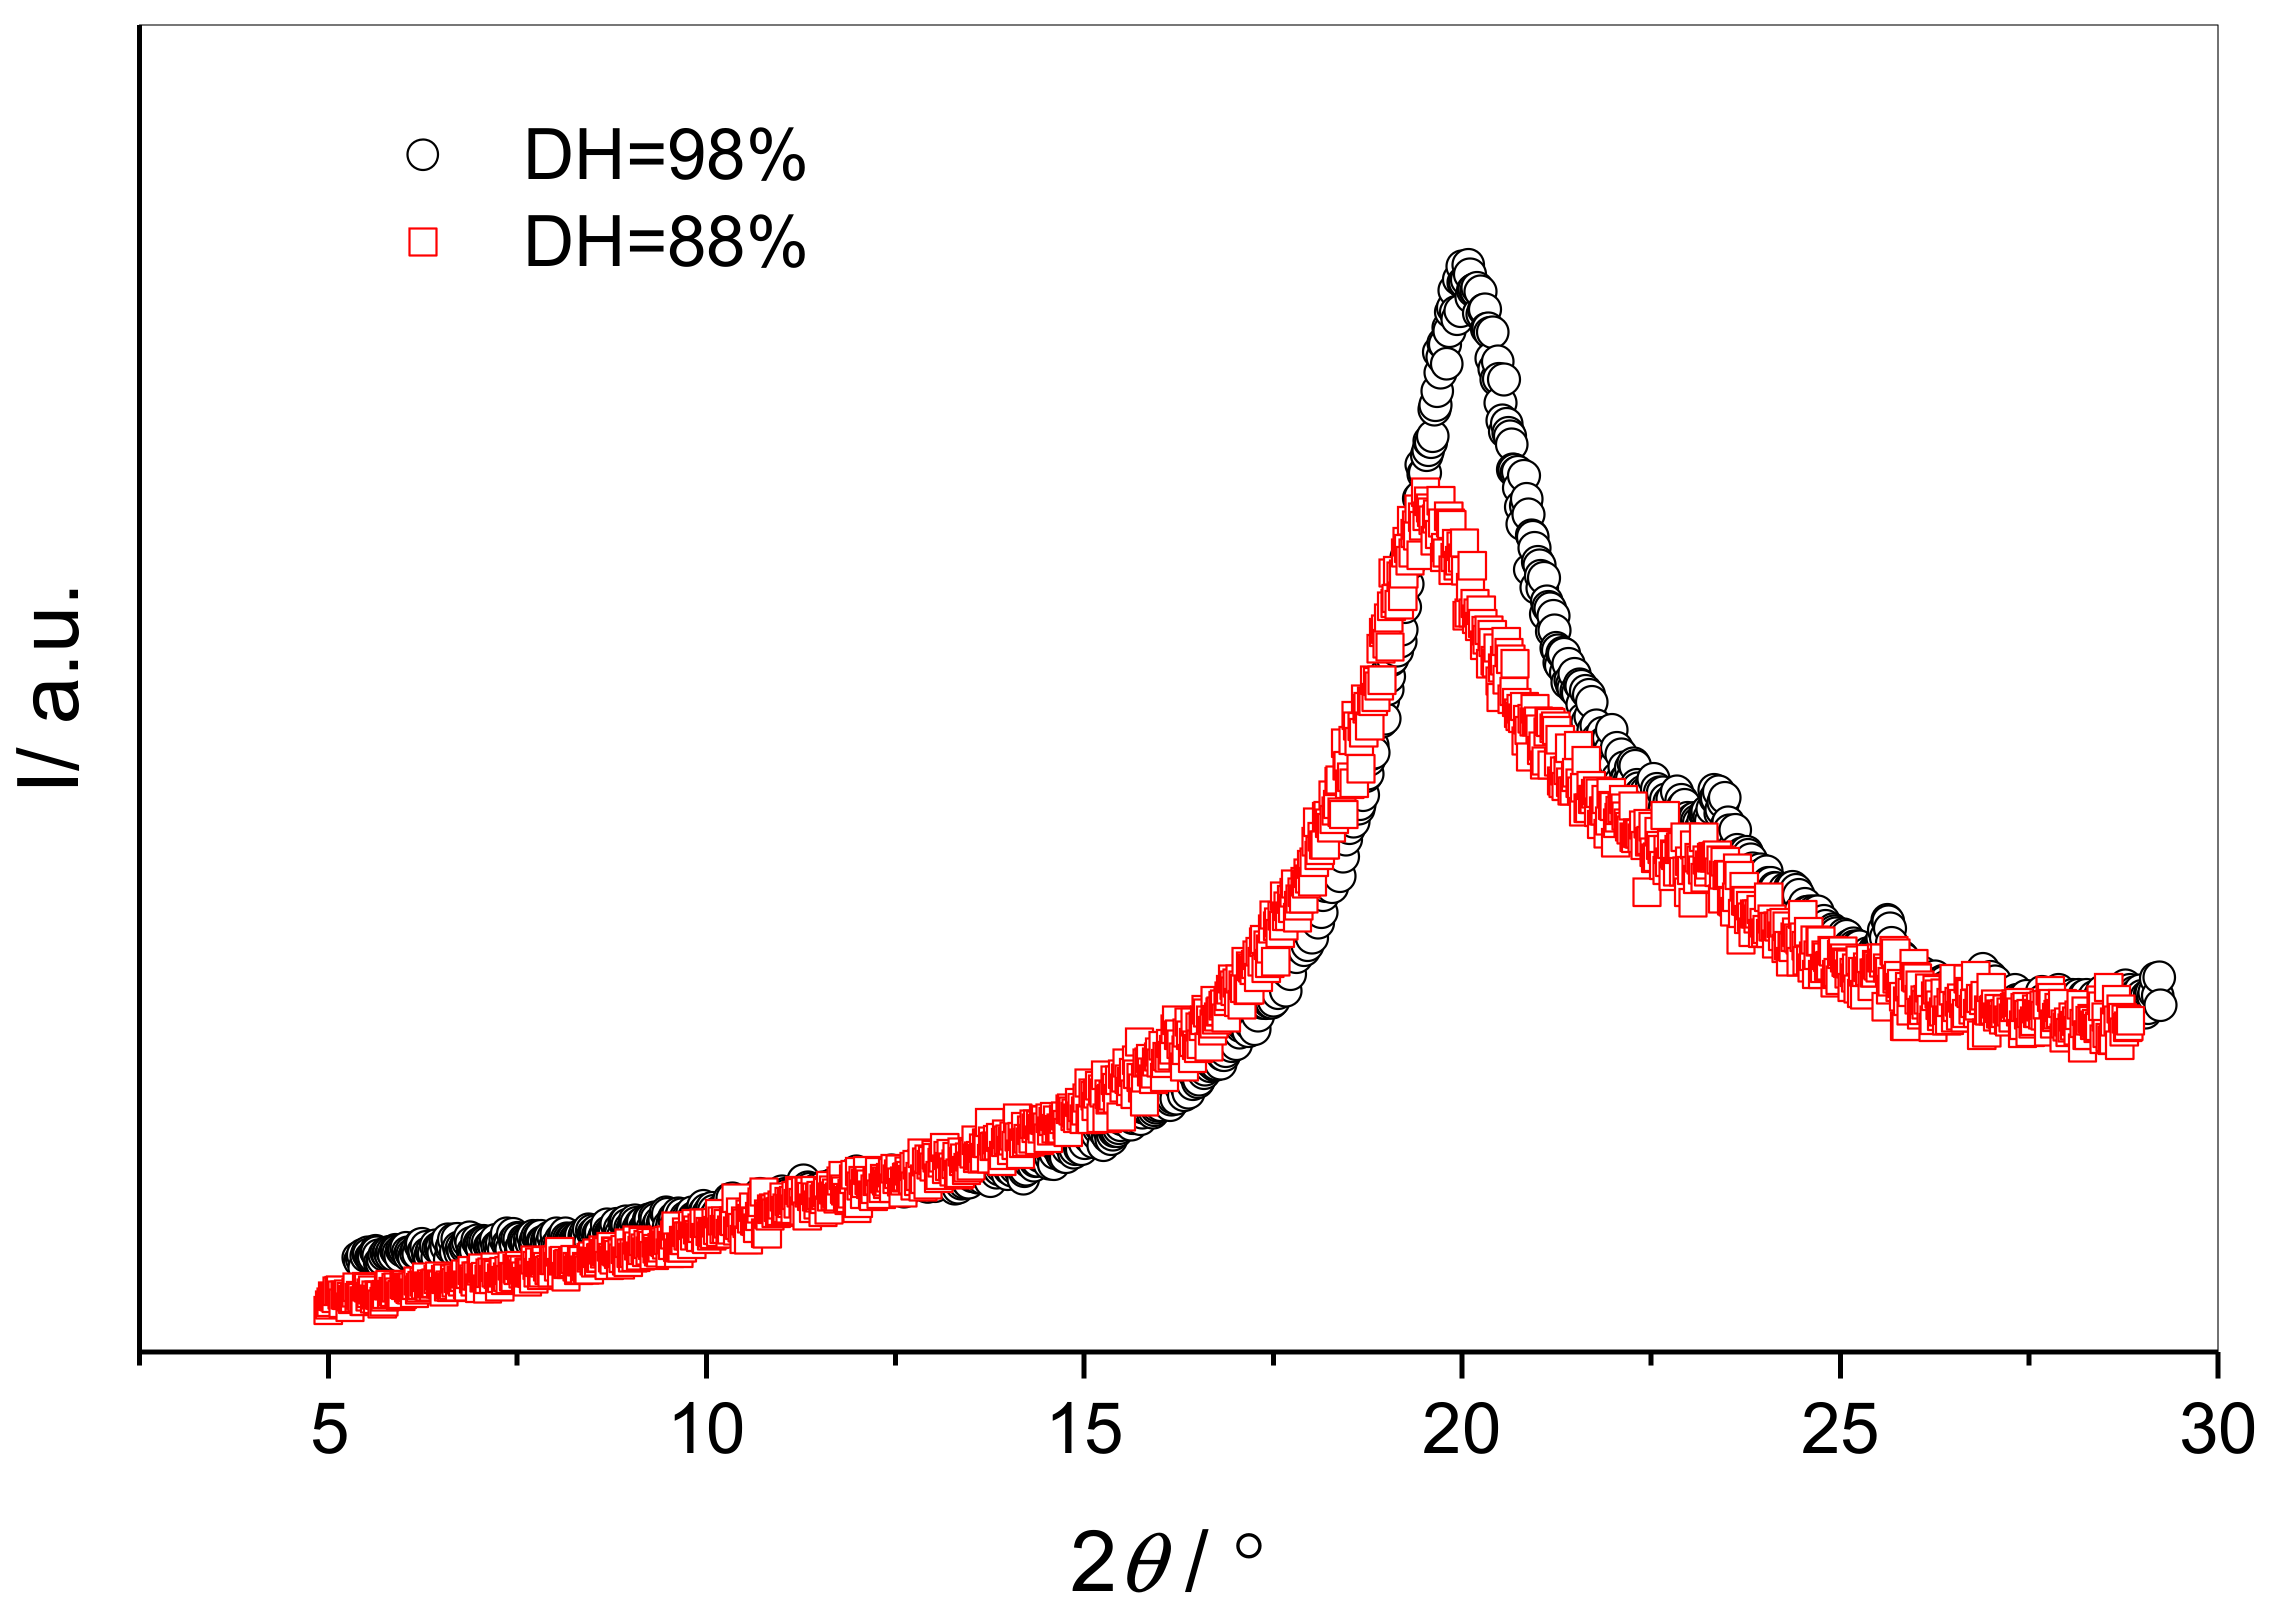
3.2. Influence of the Degree of Hydrolysis on PVA Free Volume Properties
4. Discussion
4.1. Effect of Plasticization on the Free Volume Properties of PVA
4.2. Influence of the Degree of Hydrolysis on PVA Free Volume Properties
5. Conclusions
Author Contributions
Funding
Acknowledgments
Conflicts of Interest
References
- Ben Halima, N. Poly(vinyl alcohol): Review of its promising applications and insights into biodegradation. RSC Adv. 2016, 6, 39823–39832. [Google Scholar] [CrossRef]
- Lim, M.; Kim, D.; Seo, J. Enhanced oxygen-barrier and water-resistance properties of poly(vinyl alcohol) blended with poly(acrylic acid) for packaging applications. Polym. Int. 2016, 65, 400–406. [Google Scholar] [CrossRef]
- Matsumura, S.; Shimura, Y.; Terayama, K.; Kiyohara, T. Effects of molecular weight and stereoregularity on biodegradation of poly(vinyl alcohol) byAlcaligenes faecalis. Biotechnol. Lett. 1994, 16, 1205–1210. [Google Scholar] [CrossRef]
- Matsumura, S.; Kurita, H.; Shimokobe, H. Anaerobic biodegradability of polyvinyl alcohol. Biotechnol. Lett. 1993, 15, 749–754. [Google Scholar] [CrossRef]
- Lee, C.H.; Hong, W.H. Influence of different degrees of hydrolysis of poly(vinyl alcohol) membrane on transport properties in pervaporation of IPA/water mixture. J. Membr. Sci. 1997, 135, 187–193. [Google Scholar] [CrossRef]
- Mohsin, M.; Hossin, A.; Haik, Y. Thermal and mechanical properties of poly(vinyl alcohol) plasticized with glycerol. J. Appl. Polym. Sci. 2011, 122, 3102–3109. [Google Scholar] [CrossRef]
- Han Cho, Y.; Chul Kim, B.; Sik Dan, K. Effects of Propylene Glycol on the Physical Properties of Poly(vinyl alcohol) Solutions and Films. Macromol. Res. 2009, 17, 591–596. [Google Scholar]
- Briddick, A.; Li, P.X.; Hughes, A.; Courchay, F.; Martinez, A.; Thompson, R.L. Surfactant and Plasticizer Segregation in Thin Poly(vinyl alcohol) Films. Langmuir 2016, 32, 864–872. [Google Scholar] [CrossRef] [PubMed]
- Briddick, A.; Fong, R.J.; Sabattié, E.F.D.; Li, P.; Skoda, M.W.A.; Courchay, F.; Thompson, R.L. Blooming of Smectic Surfactant/Plasticizer Layers on Spin-Cast Poly(vinyl alcohol) Films. Langmuir 2018, 34, 1410–1418. [Google Scholar] [CrossRef] [PubMed]
- Anderson, S.L.; Grulke, E.A.; DeLassus, P.T.; Smith, P.B.; Kocher, C.W.; Landes, B.G. A Model for Antiplasticization in Polystyrene. Macromolecules 1995, 28, 2944–2954. [Google Scholar] [CrossRef]
- Elwell, R.J.; Pethrick, R.A. Positron annihilation studies of poly(methyl methacrylate) plasticized with dicyclohexyl phthalate. Eur. Polym. J. 1990, 26, 853–856. [Google Scholar] [CrossRef]
- Porto, A.O.; Silva, G.G.; Magalhaes, W.F. Free volume-size dependence on temperature and average molecular-weight in poly(ethylene oxide) determined by positron annihilation lifetime spectroscopy. J. Polym. Sci. Part B Polym. Phys. 1999, 37, 219–226. [Google Scholar] [CrossRef]
- Queiroz, S.M.; Machado, J.C.; Porto, A.O.; Silva, G.G. Positron annihilation and differential scanning calorimetry studies of plasticized poly(ethylene oxide). Polymer 2001, 42, 3095–3101. [Google Scholar] [CrossRef]
- Borek, J.; Osoba, W. Free volume in plasticized polyvinyl chloride. J. Polym. Sci. Part B Polym. Phys. 1996, 34, 1903–1906. [Google Scholar] [CrossRef]
- Borek, J.; Osoba, W. Influence of the plasticization on free volume in polyvinyl chloride. J. Polym. Sci. Part B Polym. Phys. 1998, 36, 1839–1845. [Google Scholar] [CrossRef]
- Jang, J.; Lee, D.K. Plasticizer effect on the melting and crystallization behavior of polyvinyl alcohol. Polymer 2003, 44, 8139–8146. [Google Scholar] [CrossRef]
- Lin, F.; Wu, W.; Sun, H.; Xiang, A. Plasticization and Crystallization Behaviors of Polyvinyl Alcohol Plasticized with Various Polyol Systems. J. Polym. Mater 2011, 28, 577–586. [Google Scholar] [CrossRef]
- Mohsin, M.; Hossin, A.; Haik, Y. Thermomechanical properties of poly(vinyl alcohol) plasticized with varying ratios of sorbitol. Mater. Sci. Eng. A 2010, 528, 925–930. [Google Scholar] [CrossRef]
- Cowie, J.M.G.; McEwan, I.; McEwen, I.J.; Pethrick, R.A. Investigation of Hydrogen-Bonding Structure in Blends of Poly(N-vinylpyrrolidone) with Poly(vinyl acetate-co-vinyl alcohol) Using Positron Annihilation. Macromolecules 2001, 34, 7071–7075. [Google Scholar] [CrossRef]
- Cao, H.; Zhang, R.; Yuan, J.-P.; Huang, C.-M.; Jean, Y.C.; Suzuki, R.; Ohdaira, T.; Nielsen, B. Free-volume hole model for positronium formation in polymers: Surface studies. J. Phys. Condens. Matter 1998, 10, 10429–10442. [Google Scholar] [CrossRef]
- Mohamed, H.F.M.; El-Sayed, A.M.A.; Abdel-Hady, E.E. Study of sorption in poly(vinyl alcohol) using the positron annihilation technique. J. Phys. Condens. Matter 1999, 11, 4461–4467. [Google Scholar] [CrossRef]
- Hodge, R.M.; Edward, G.H.; Simon, G.P. Water absorption and states of water in semicrystalline poly(vinyl alcohol) films. Polymer 1996, 37, 1371–1376. [Google Scholar] [CrossRef]
- Lue, S.J.; Lee, D.-T.; Chen, J.-Y.; Chiu, C.-H.; Hu, C.-C.; Jean, Y.C.; Lai, J.-Y. Diffusivity enhancement of water vapor in poly(vinyl alcohol)-fumed silica nano-composite membranes: Correlation with polymer crystallinity and free-volume properties. J. Membr. Sci. 2008, 325, 831–839. [Google Scholar] [CrossRef]
- Sharma, S.K.; Prakash, J.; Pujari, P.K. Effects of the molecular level dispersion of graphene oxide on the free volume characteristics of poly(vinyl alcohol) and its impact on the thermal and mechanical properties of their nanocomposites. Phys. Chem. Chem. Phys. 2015, 17, 29201–29209. [Google Scholar] [CrossRef] [PubMed]
- Fan, J.; Zhou, W.; Wang, Q.; Chu, Z.; Yang, L.; Yang, L.; Sun, J.; Zhao, L.; Xu, J.; Liang, Y.; Chen, Z. Structure dependence of water vapor permeation in polymer nanocomposite membranes investigated by positron annihilation lifetime spectroscopy. J. Membr. Sci. 2018, 549, 581–587. [Google Scholar] [CrossRef]
- Peresin, M.S.; Habibi, Y.; Vesterinen, A.-H.; Rojas, O.J.; Pawlak, J.J.; Seppälä, J.V. Effect of Moisture on Electrospun Nanofiber Composites of Poly(vinyl alcohol) and Cellulose Nanocrystals. Biomacromolecules 2010, 11, 2471–2477. [Google Scholar] [CrossRef] [PubMed]
- Mohamed, H.F.M.; Ito, Y.; El-Sayed, A.M.A.; Abdel-Hady, E.E. Positron annihilation in polyvinylalcohol doped with CuCl2. Polymer 1996, 210, 469–477. [Google Scholar] [CrossRef]
- El-Samahy, A.E.; Abdel-Rehim, N.; El-Sayed, A.M.A. Temperature dependence of free-volume holes in poly(vinyl alcohol) studied by positron annihilation technique. Polymer 1996, 37, 4413–4415. [Google Scholar] [CrossRef]
- El-Sayed, A.M.A.; Abdel-Hady, E.E.; Mohsen, M.; Sawaby, A. Effect of temperature on γ-irradiated poly(vinyl alcohol) studied by positron annihilation. Polym. Degrad. Stab. 1995, 47, 339–341. [Google Scholar] [CrossRef]
- Kirkegaard, P.; Pedersen, N.J.; Eldrup, M.M. PATFIT-88: A Data-Processing System for Positron Annihilation Spectra on Mainframe and Personal Computers; Risø National Laboratory: Roskilde, Denmark, 1989. [Google Scholar]
- Eldrup, M.; Lightbody, D.; Sherwood, J.N. The temperature dependence of positron lifetimes in solid pivalic acid. Chem. Phys. 1981, 63, 51–58. [Google Scholar] [CrossRef]
- Jean, Y.C.; Mallon, P.E.; Schrader, D.M. Principles and applications of positron and positronium chemistry. In Principles and Applications of Positron and Positronium Chemistry; World Scientific: Singapore, 2003; pp. 253–307. ISBN 9789812381446. [Google Scholar]
- Okada, T.; Nishijima, S.; Honda, Y.; Kobayashi, Y. Physical properties of epoxy and free volume evaluated by positron annihilation spectroscopy. J. Phys. IV 1993, 3, C4291–C4294. [Google Scholar] [CrossRef]
- Konidari, M.V.; Papadokostaki, K.G.; Sanopoulou, M. Moisture-Induced Effects on the Tensile Mechanical Properties and Glass-Transition Temperature of Poly(vinyl alcohol) Films. J. Appl. Polym. Sci. 2011, 120, 3381–3386. [Google Scholar] [CrossRef]
- Tian, H.; Liu, D.; Yao, Y.; Ma, S.; Zhang, X.; Xiang, A. Effect of Sorbitol Plasticizer on the Structure and Properties of Melt Processed Polyvinyl Alcohol Films. J. Food Sci. 2017, 82, 2926–2932. [Google Scholar] [CrossRef] [PubMed]
- Hodge, R.M.; Bastow, T.J.; Edward, G.H.; Simon, G.P.; Hill, A.J. Free Volume and the Mechanism of Plasticization in Water-Swollen Poly(vinyl alcohol). Macromolecules 1996, 29, 8137–8143. [Google Scholar] [CrossRef]
- Thimmegowda, M.C.; Ravi Kumar, H.B.; Ranganathaiah, C. Water diffusion in a soft contact lens polymer and its tolerance to UV radiation studied by positron lifetime technique. J. Appl. Polym. Sci. 2004, 92, 1355–1366. [Google Scholar] [CrossRef]


| Material Reference | Mw/kg · mol−1 | DH/% |
|---|---|---|
| PVA-70-88 | 30–70 | 87–90 |
| PVA-23-98 | 13–23 | 98 |
| PVA-23-88 | 13–23 | 87–89 |
| PVA-50-98 | 31–50 | 98–99 |
| PVA-50-88 | 31–50 | 87–89 |
| PVA-125-98 | 125 | 98 |
| PVA-130-88 | 130 | 88 |
| Plasticiser | Drying Method | R/Å | Tg/°C |
|---|---|---|---|
| None | Air | 2.64 | 53.3 |
| None | Vacuum | 2.45 | 65.1 |
| Glycerol | Air | 2.74 | 26.8 |
| Glycerol | Vacuum | 2.50 | 35.5 |
| Propylene glycol | Vacuum | 2.72 | 17.7 |
| Sample | Ipeak/Ipeak + Ibaseline | FWHM/° | tcrys/nm |
|---|---|---|---|
| PVA | 0.42 | 3.8 | 2.4 |
| PVA/glycerol | 0.12 | 4.0 | 2.2 |
| PVA/propylene glycol | 0.10 | 2.9 | 3.1 |
| DH/% | R/Å | Tg/°C |
|---|---|---|
| 88 | 2.64 | 53.3 |
| 98 | 2.45 | 65.1 |
© 2018 by the authors. Licensee MDPI, Basel, Switzerland. This article is an open access article distributed under the terms and conditions of the Creative Commons Attribution (CC BY) license (http://creativecommons.org/licenses/by/4.0/).
Share and Cite
Fong, R.J.; Robertson, A.; Mallon, P.E.; Thompson, R.L. The Impact of Plasticizer and Degree of Hydrolysis on Free Volume of Poly(vinyl alcohol) Films. Polymers 2018, 10, 1036. https://doi.org/10.3390/polym10091036
Fong RJ, Robertson A, Mallon PE, Thompson RL. The Impact of Plasticizer and Degree of Hydrolysis on Free Volume of Poly(vinyl alcohol) Films. Polymers. 2018; 10(9):1036. https://doi.org/10.3390/polym10091036
Chicago/Turabian StyleFong, Rebecca J., Alexander Robertson, Peter E. Mallon, and Richard L. Thompson. 2018. "The Impact of Plasticizer and Degree of Hydrolysis on Free Volume of Poly(vinyl alcohol) Films" Polymers 10, no. 9: 1036. https://doi.org/10.3390/polym10091036
APA StyleFong, R. J., Robertson, A., Mallon, P. E., & Thompson, R. L. (2018). The Impact of Plasticizer and Degree of Hydrolysis on Free Volume of Poly(vinyl alcohol) Films. Polymers, 10(9), 1036. https://doi.org/10.3390/polym10091036