Phase Morphology of NR/SBR Blends: Effect of Curing Temperature and Curing Time

Abstract
:
1. Introduction
2. Materials and Methods
2.1. Materials
2.2. Compounding and Curing
2.3. Characterization
2.3.1. AFM
2.3.2. TEM
2.3.3. Surface Free Energy
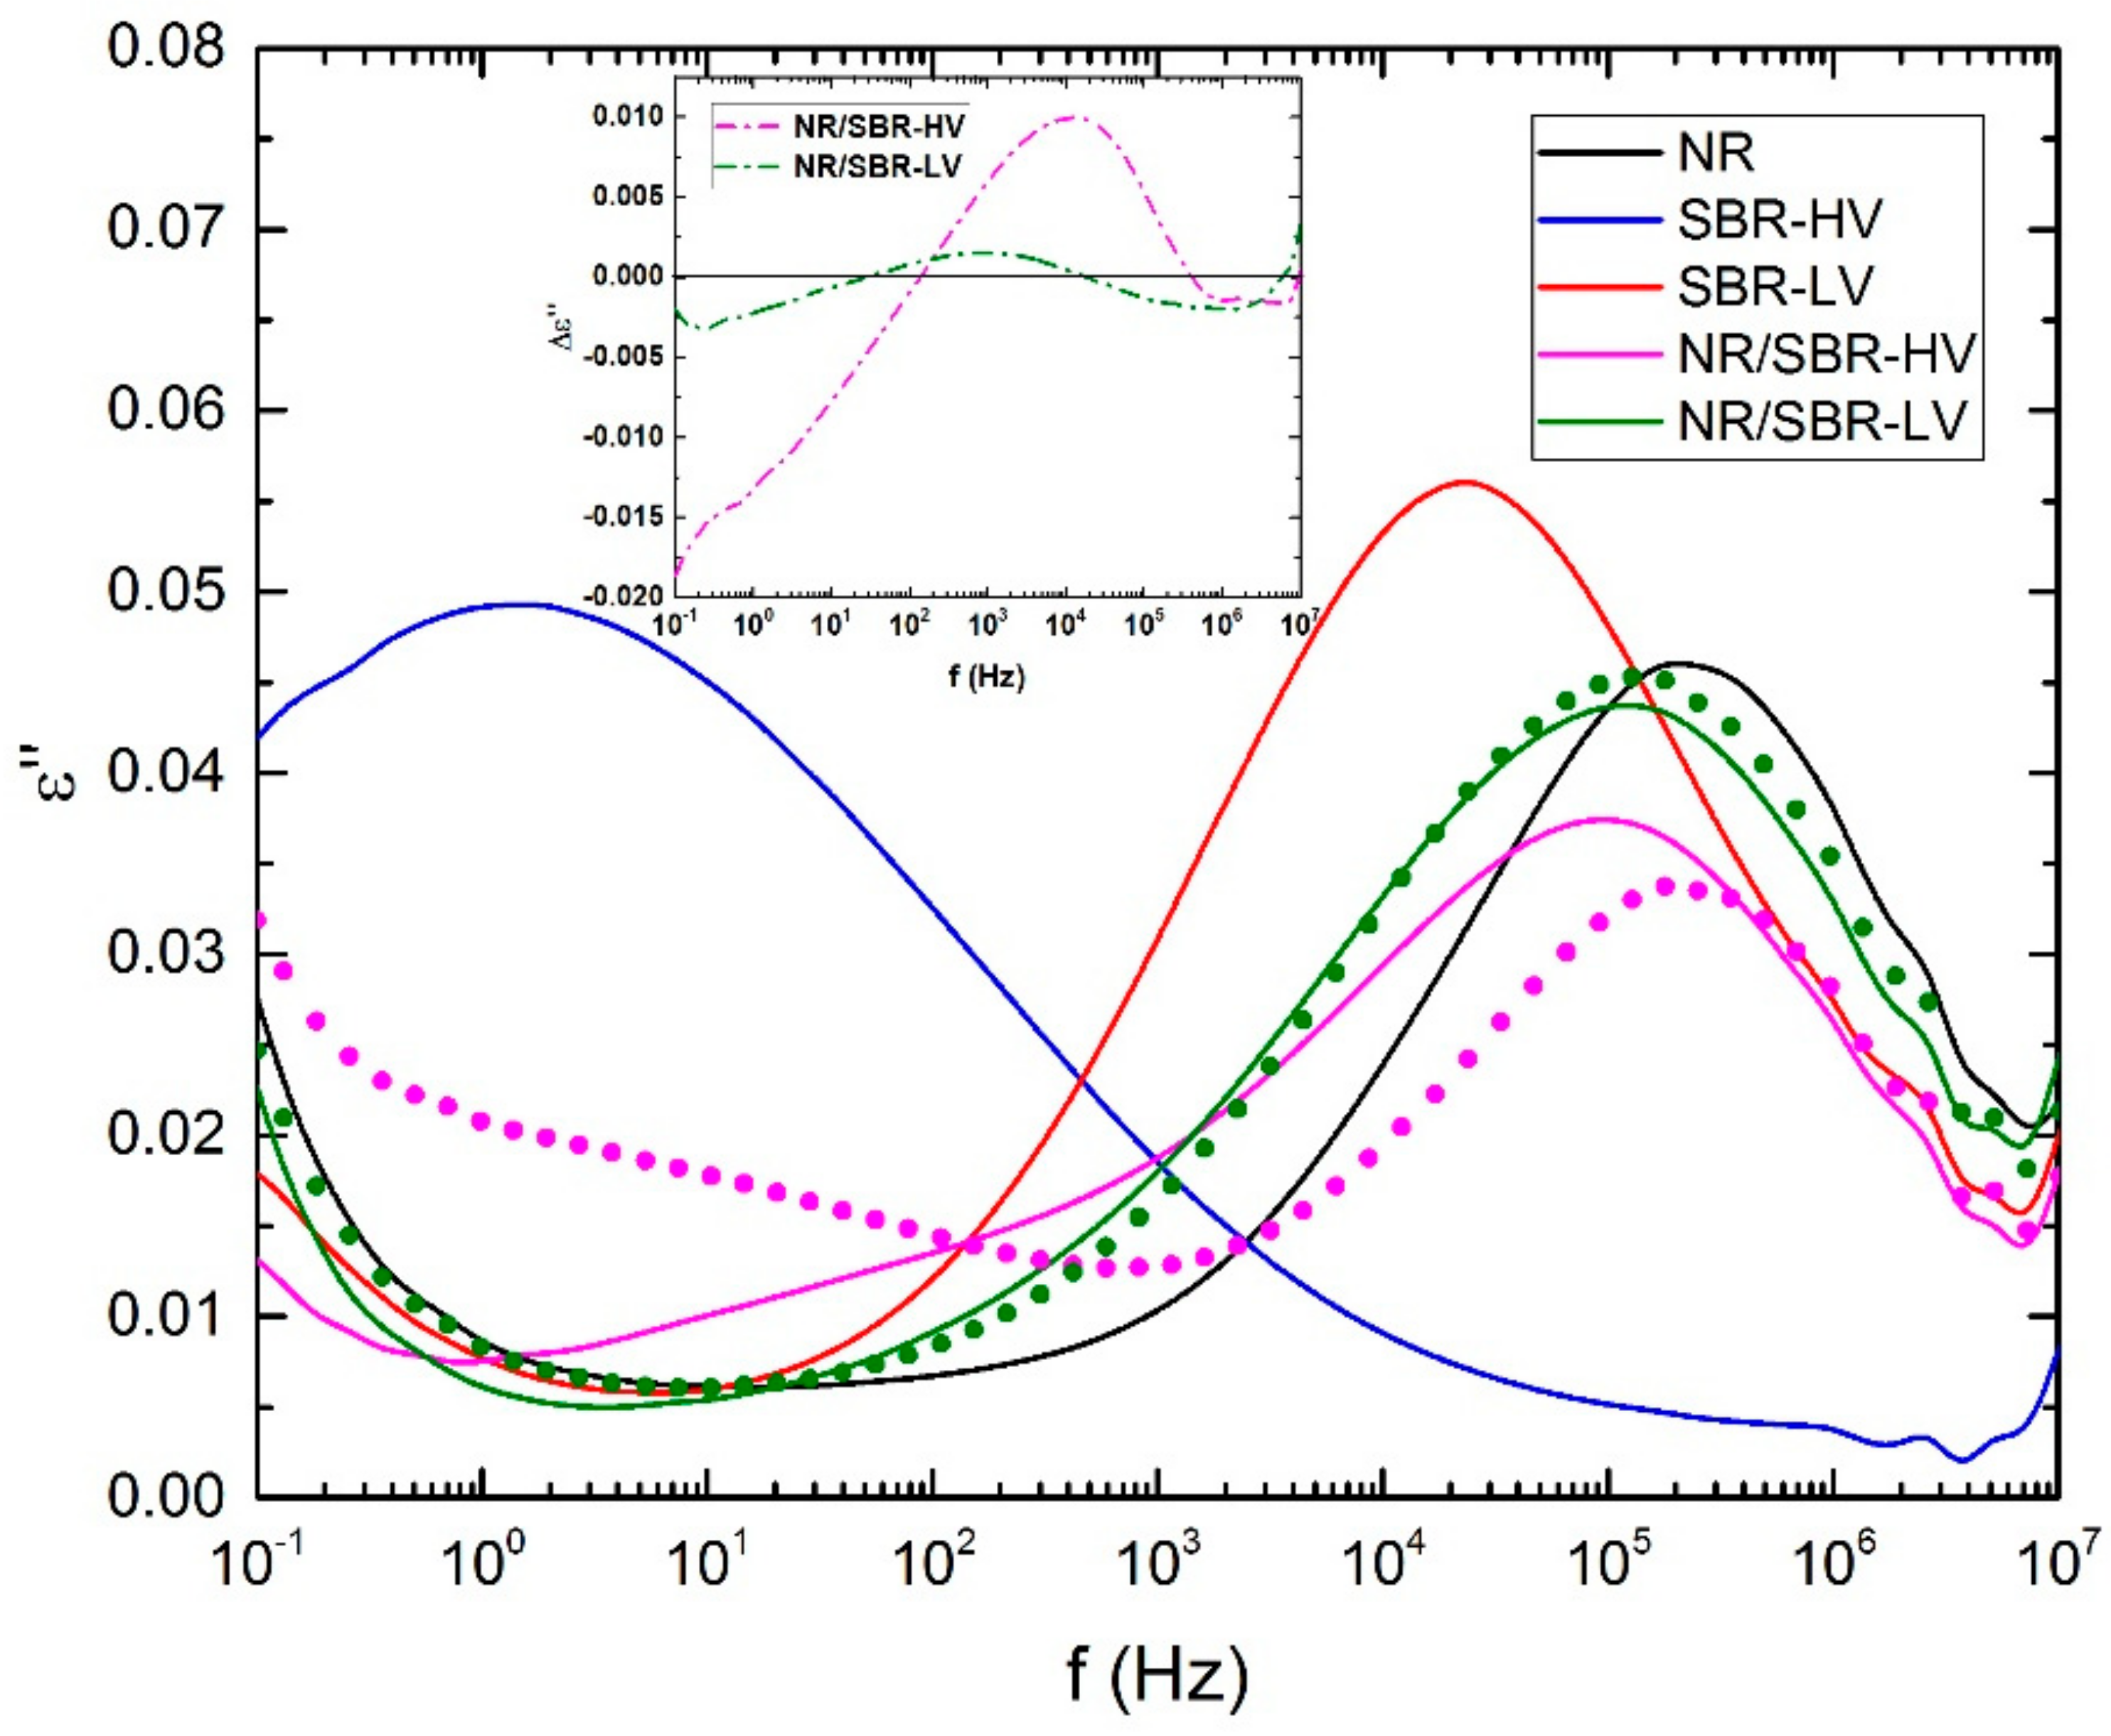
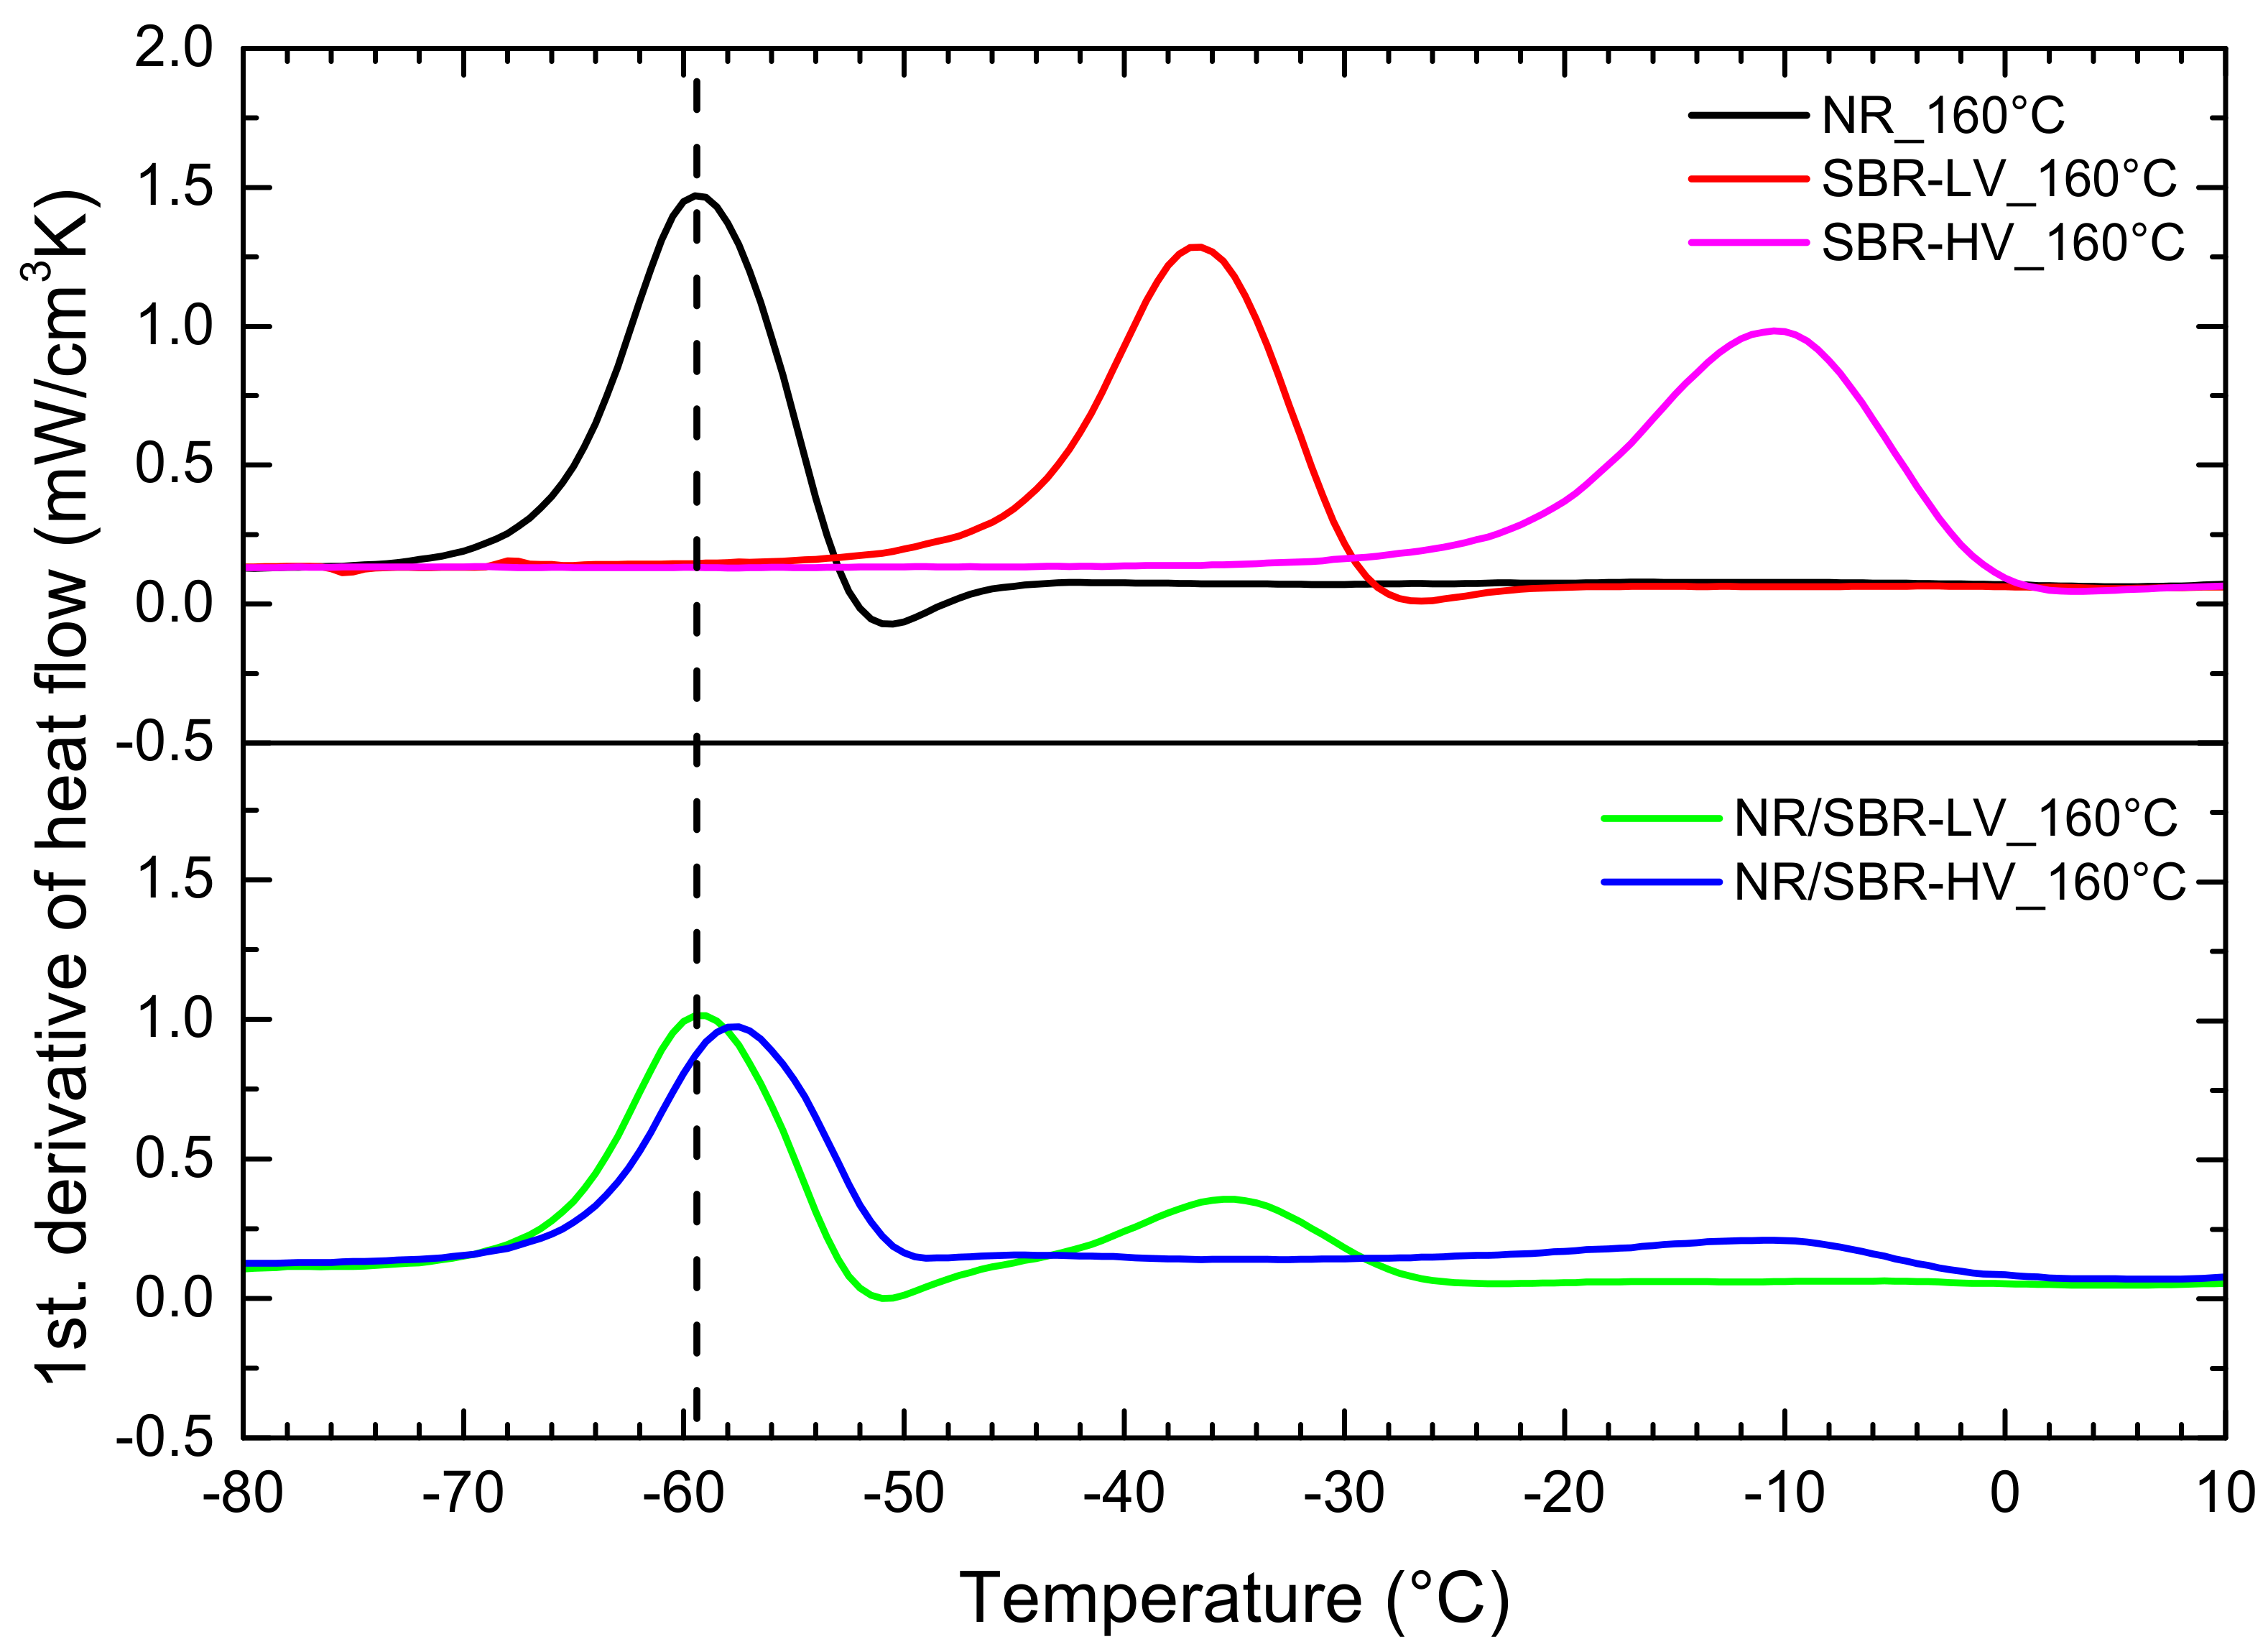
2.3.4. Broadband Dielectrically Spectroscopy (BDS)
3. Results and Discussion
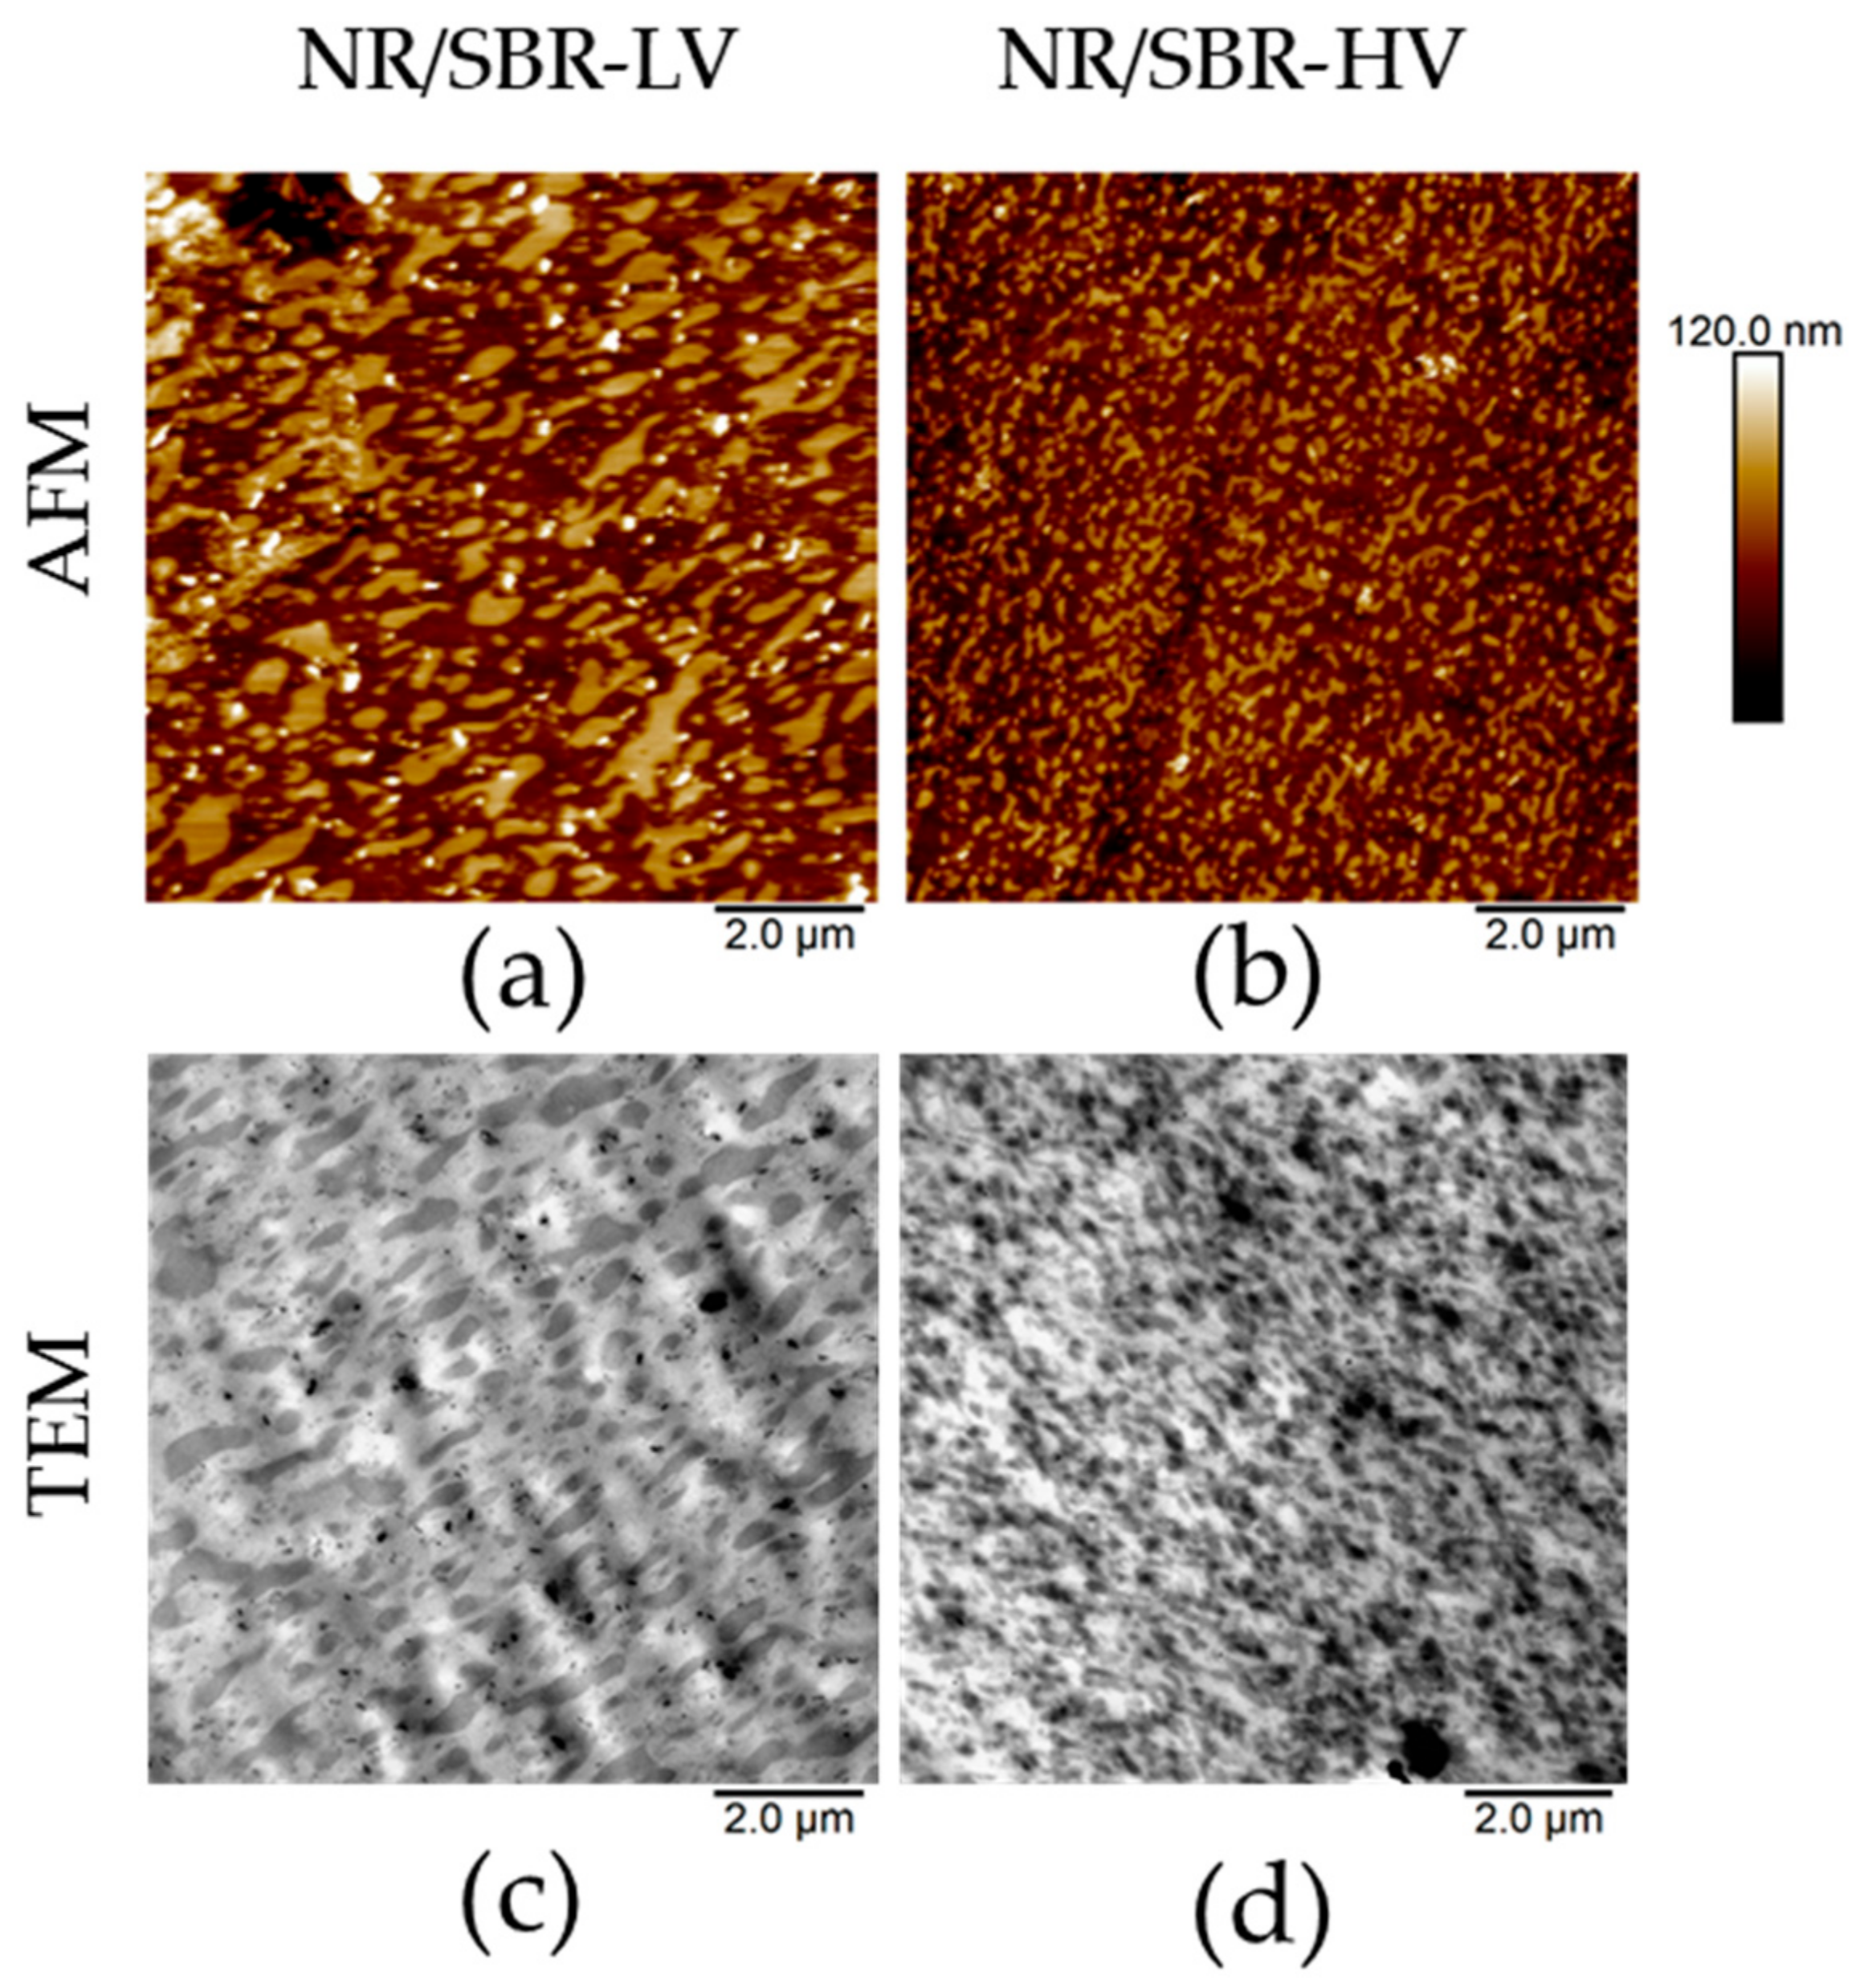
3.1. AFM Visualization of NR/SBR Blend Morphology
3.2. State of Domain Morphology after Mixing
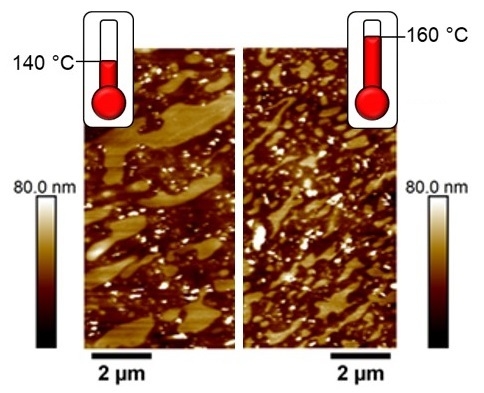
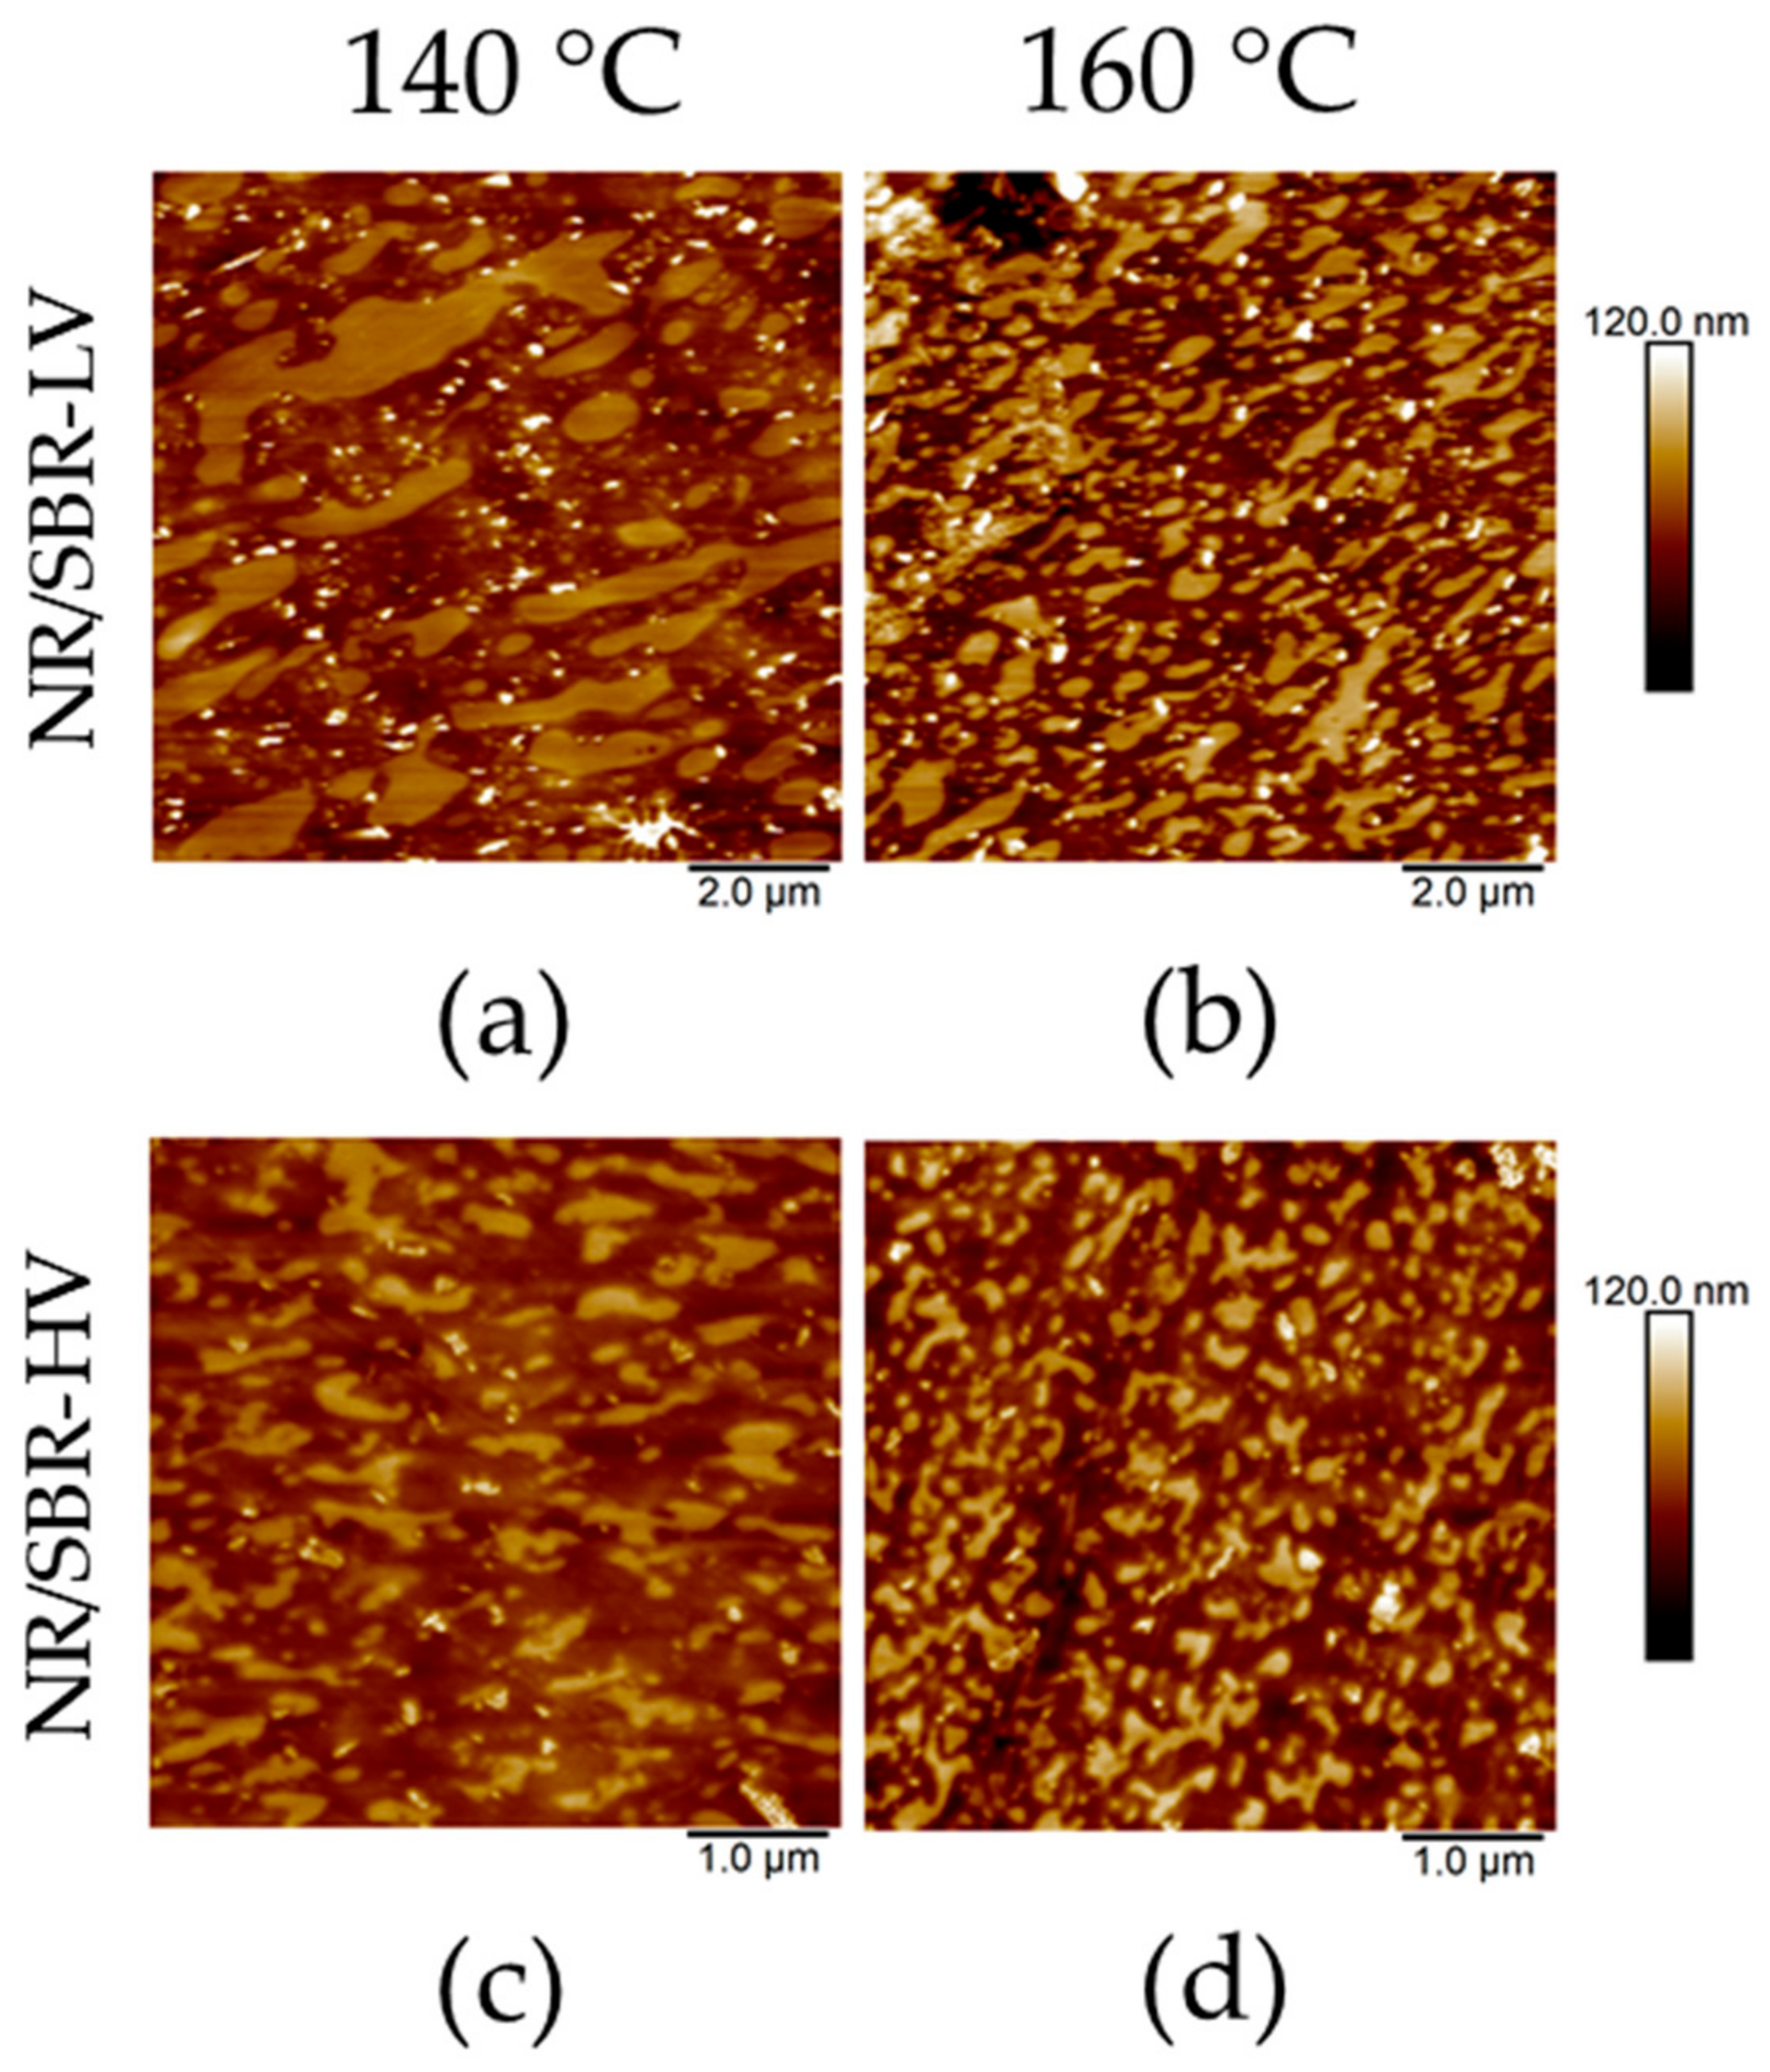
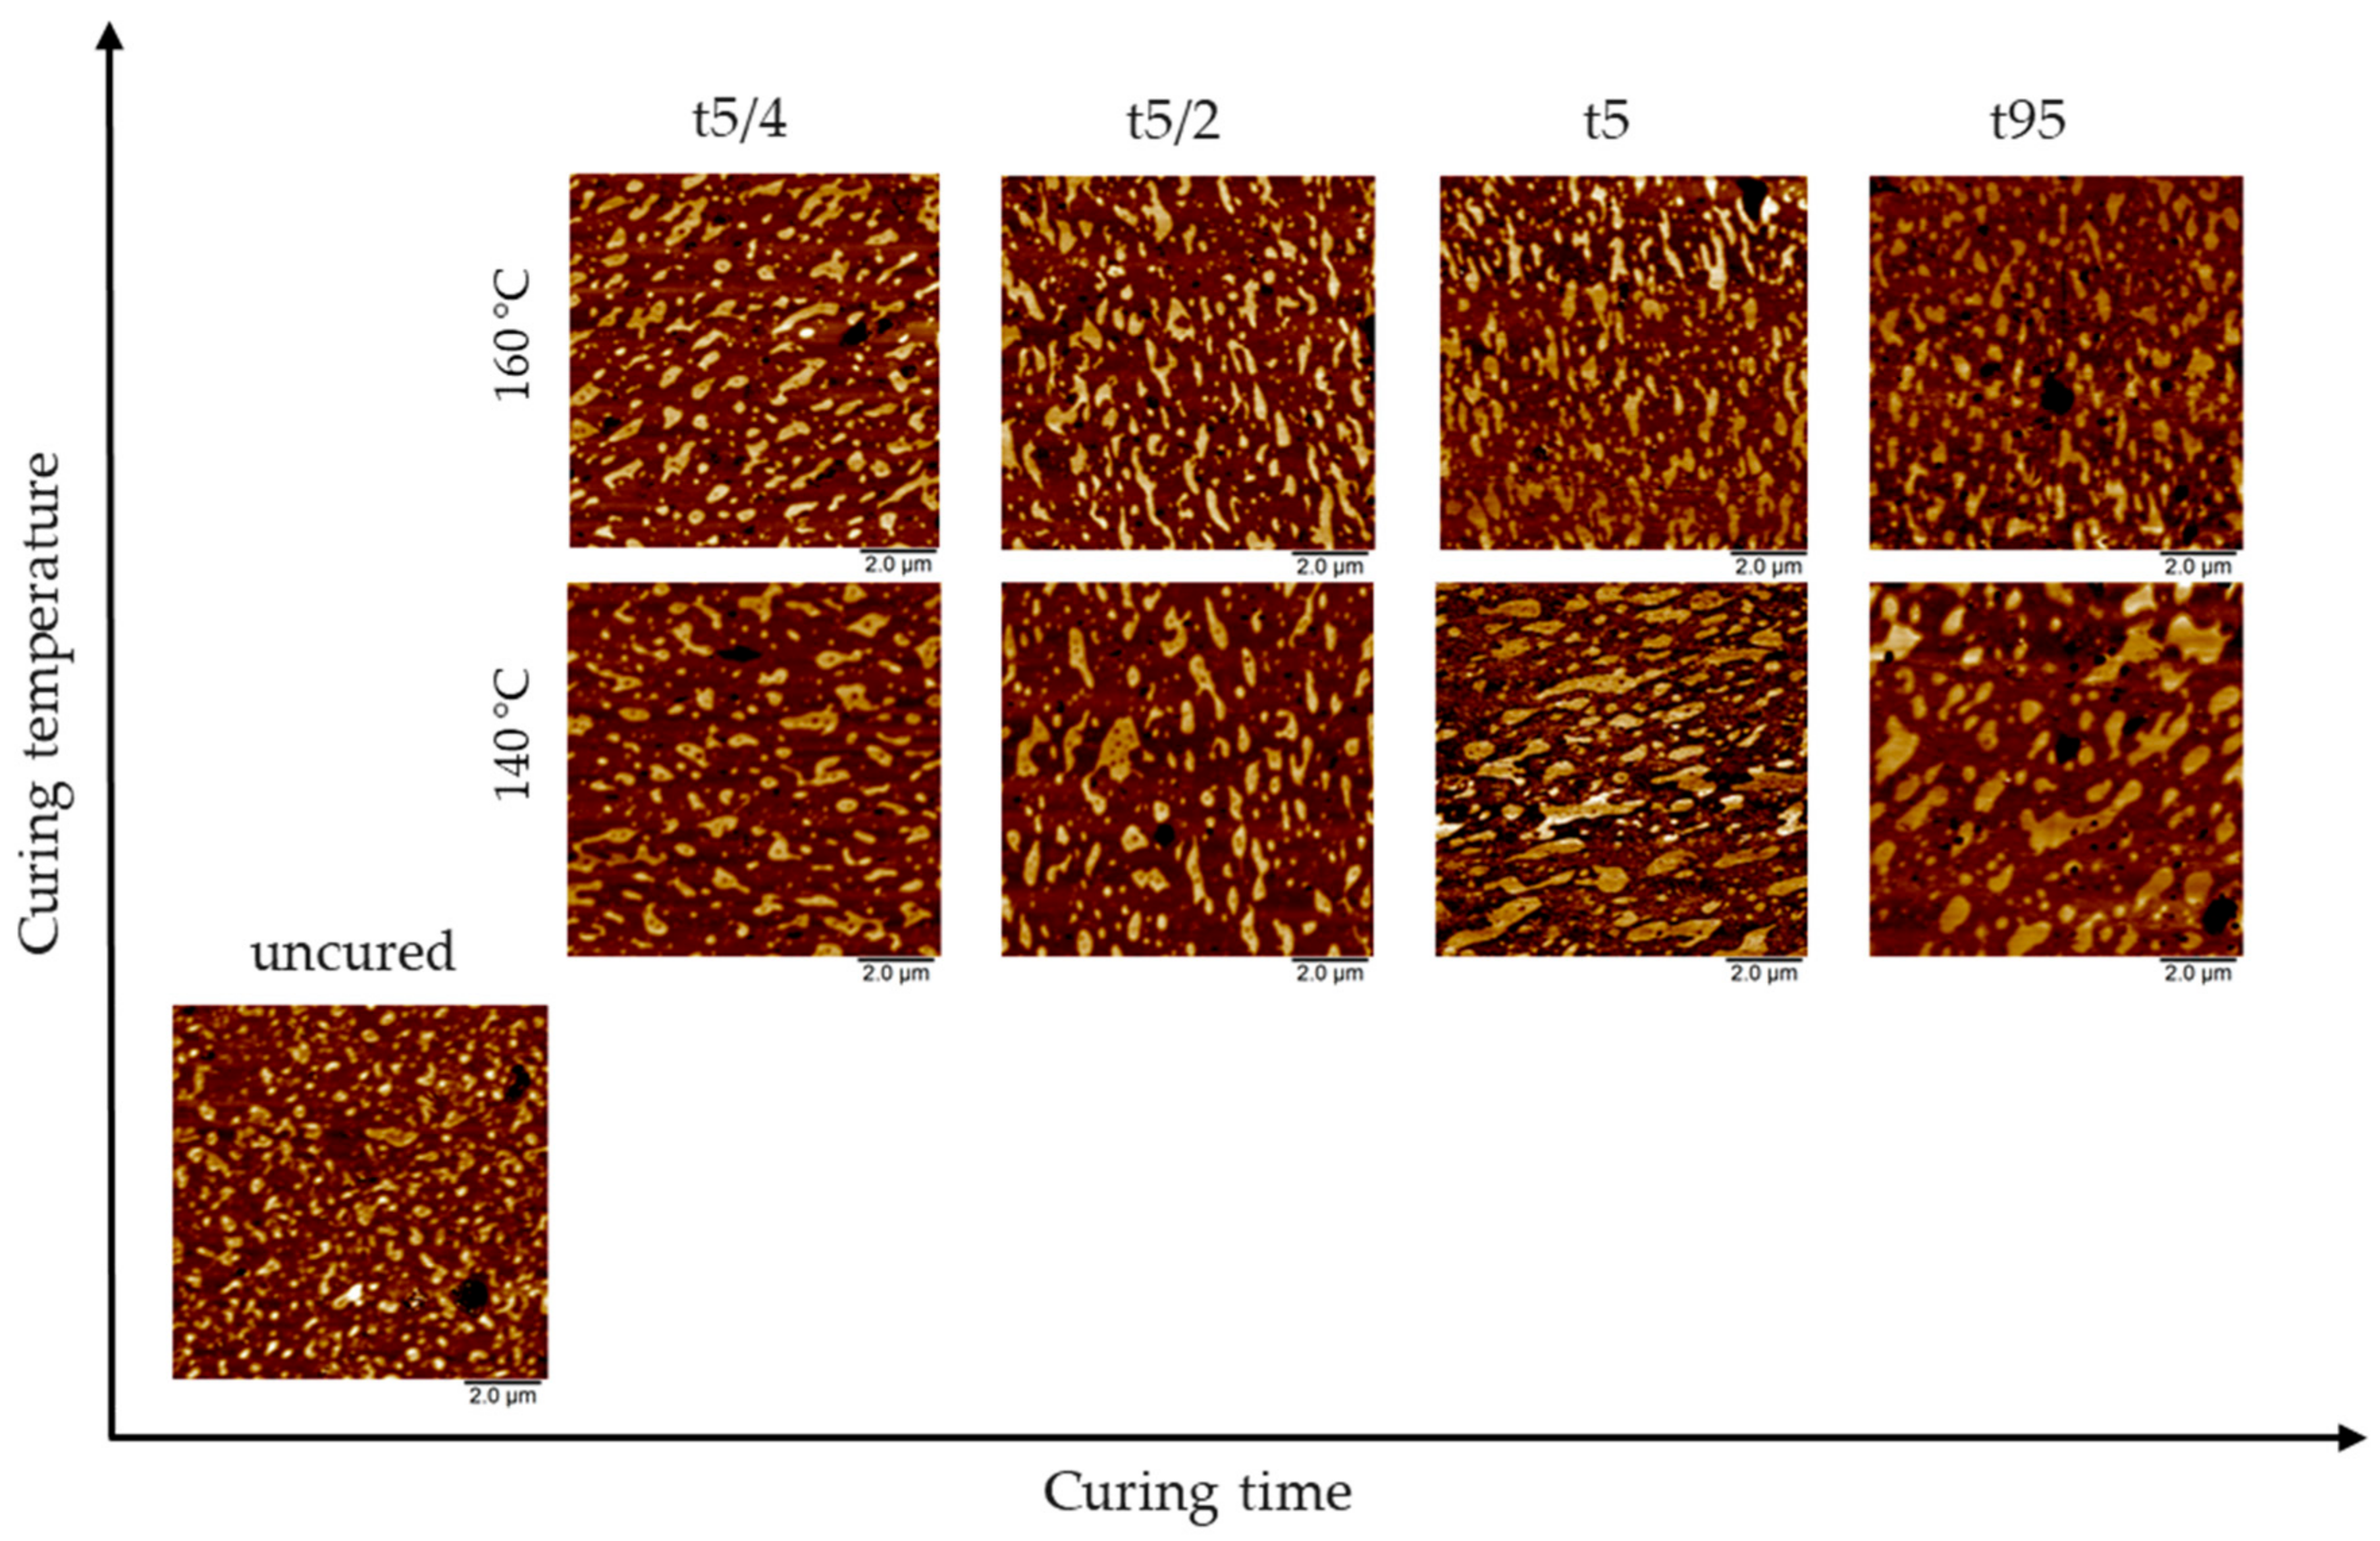
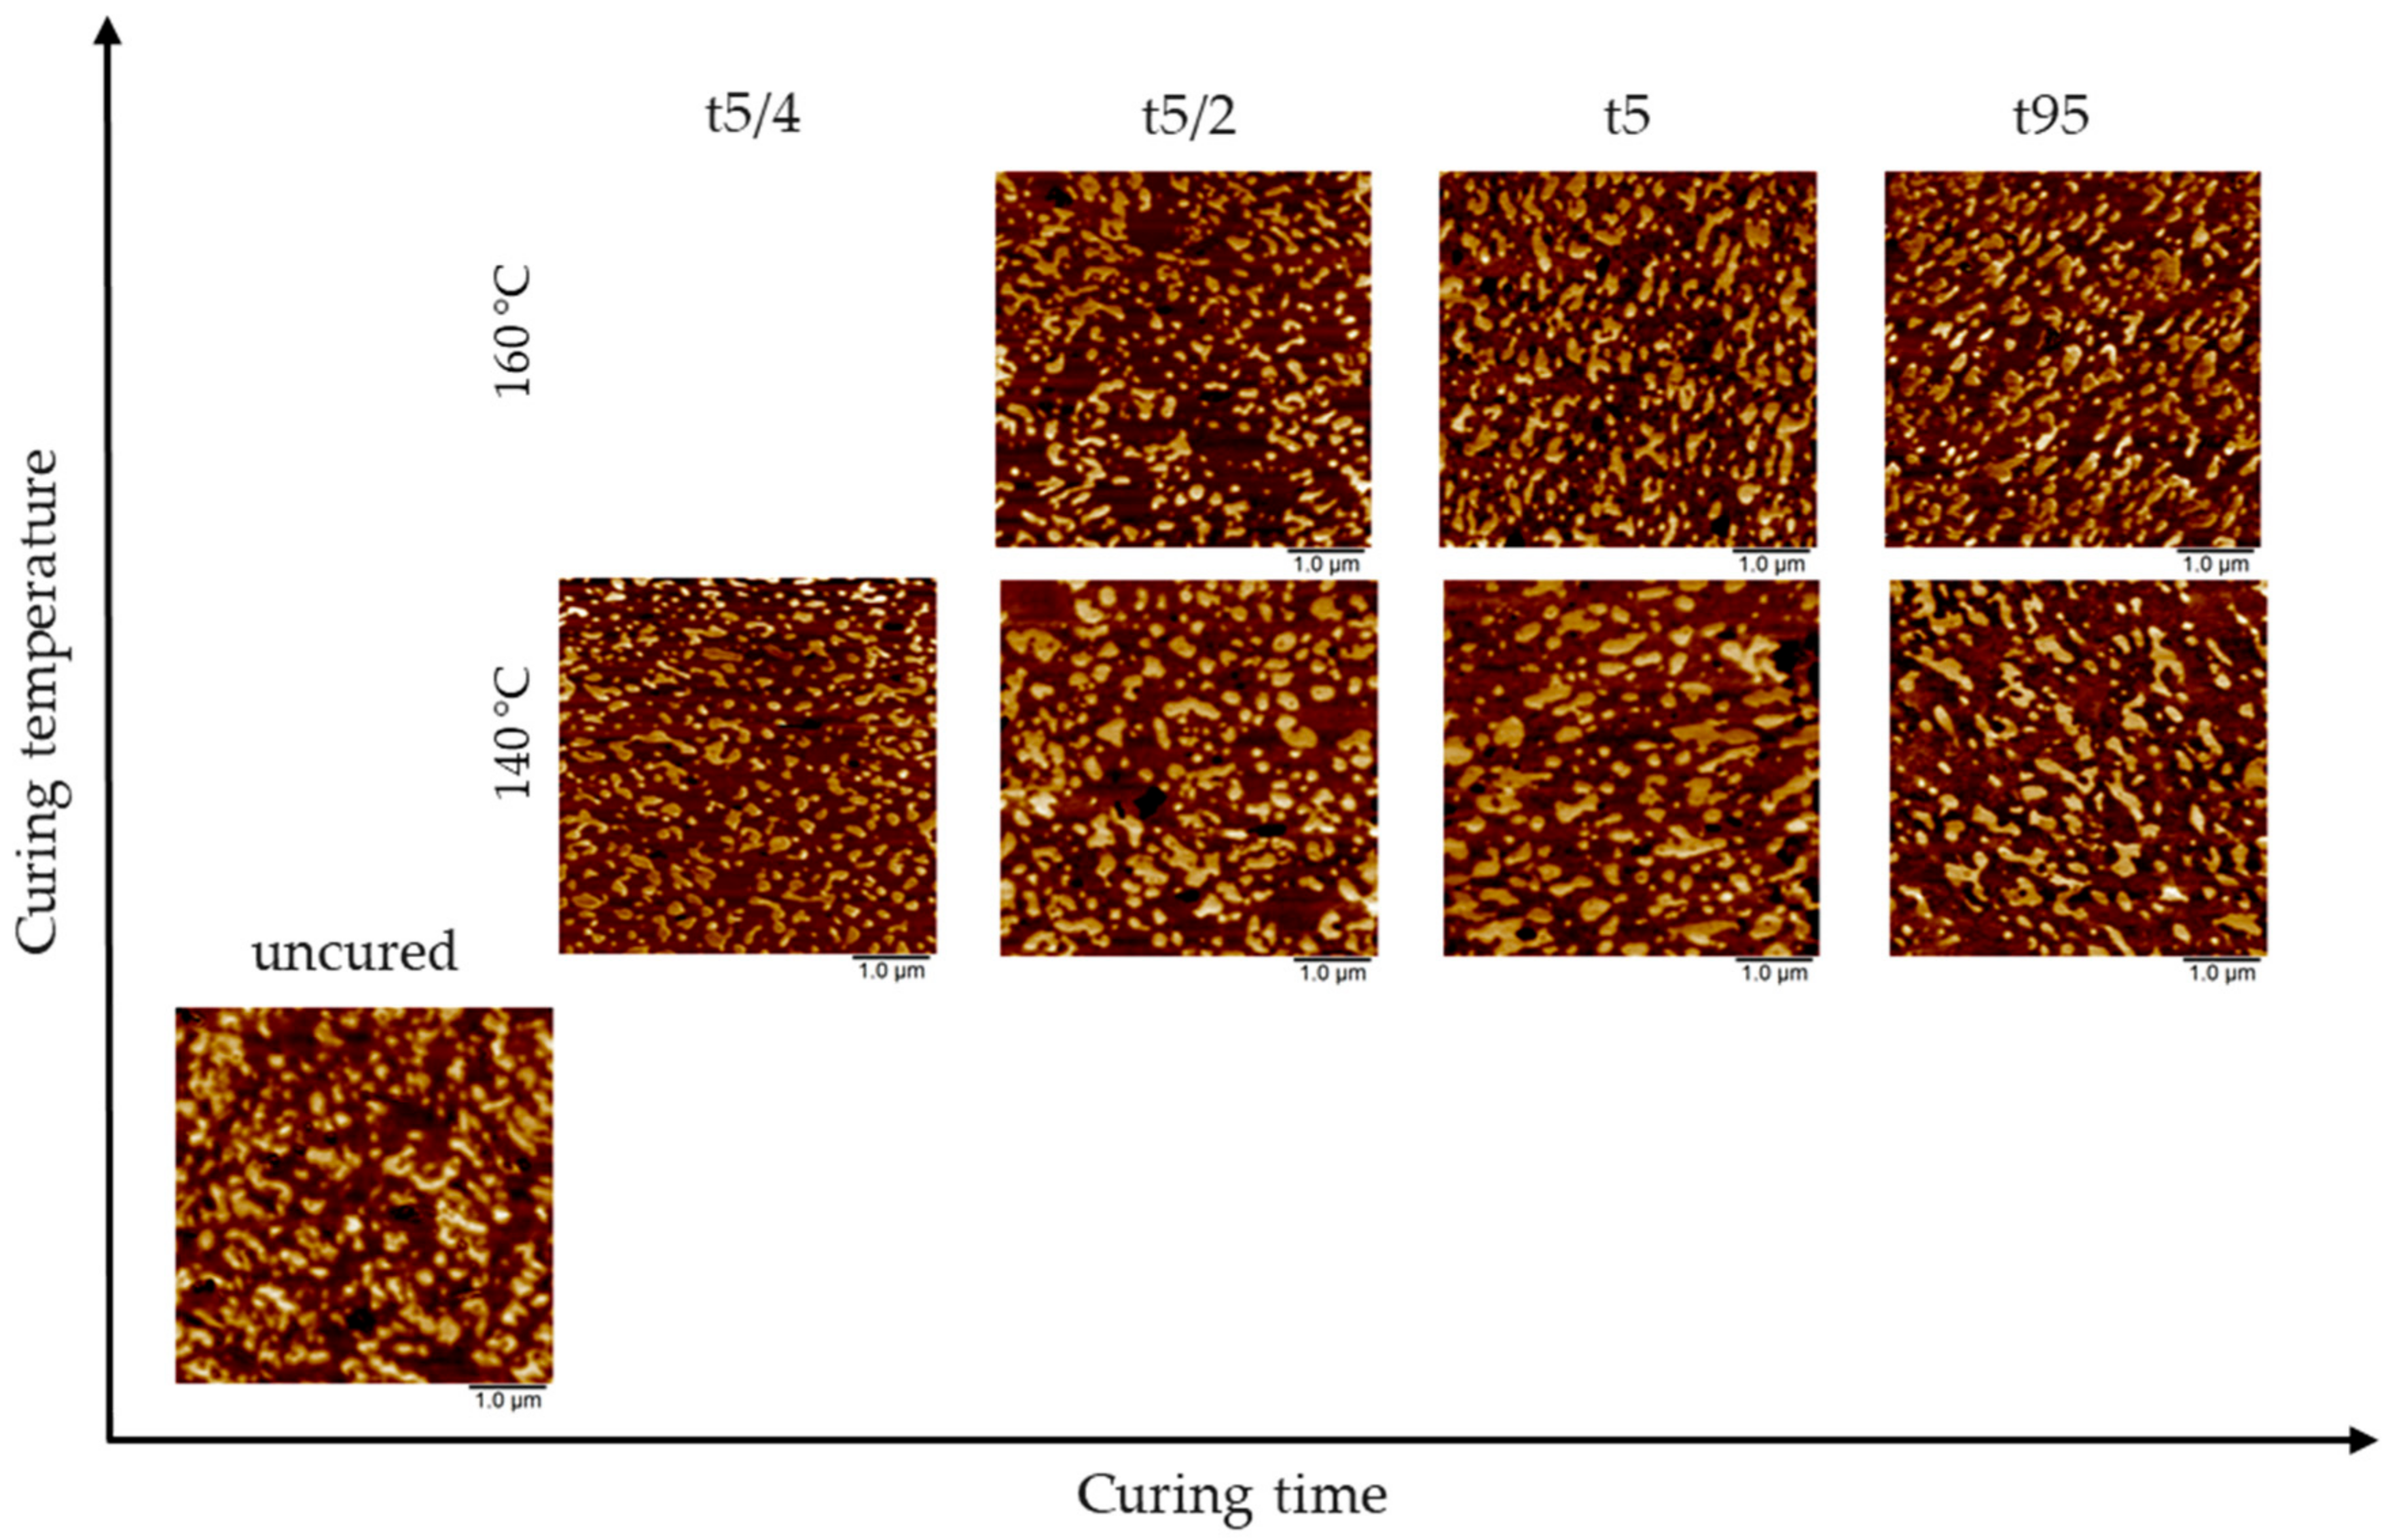
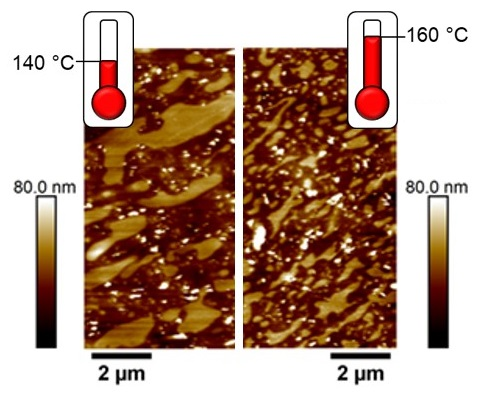
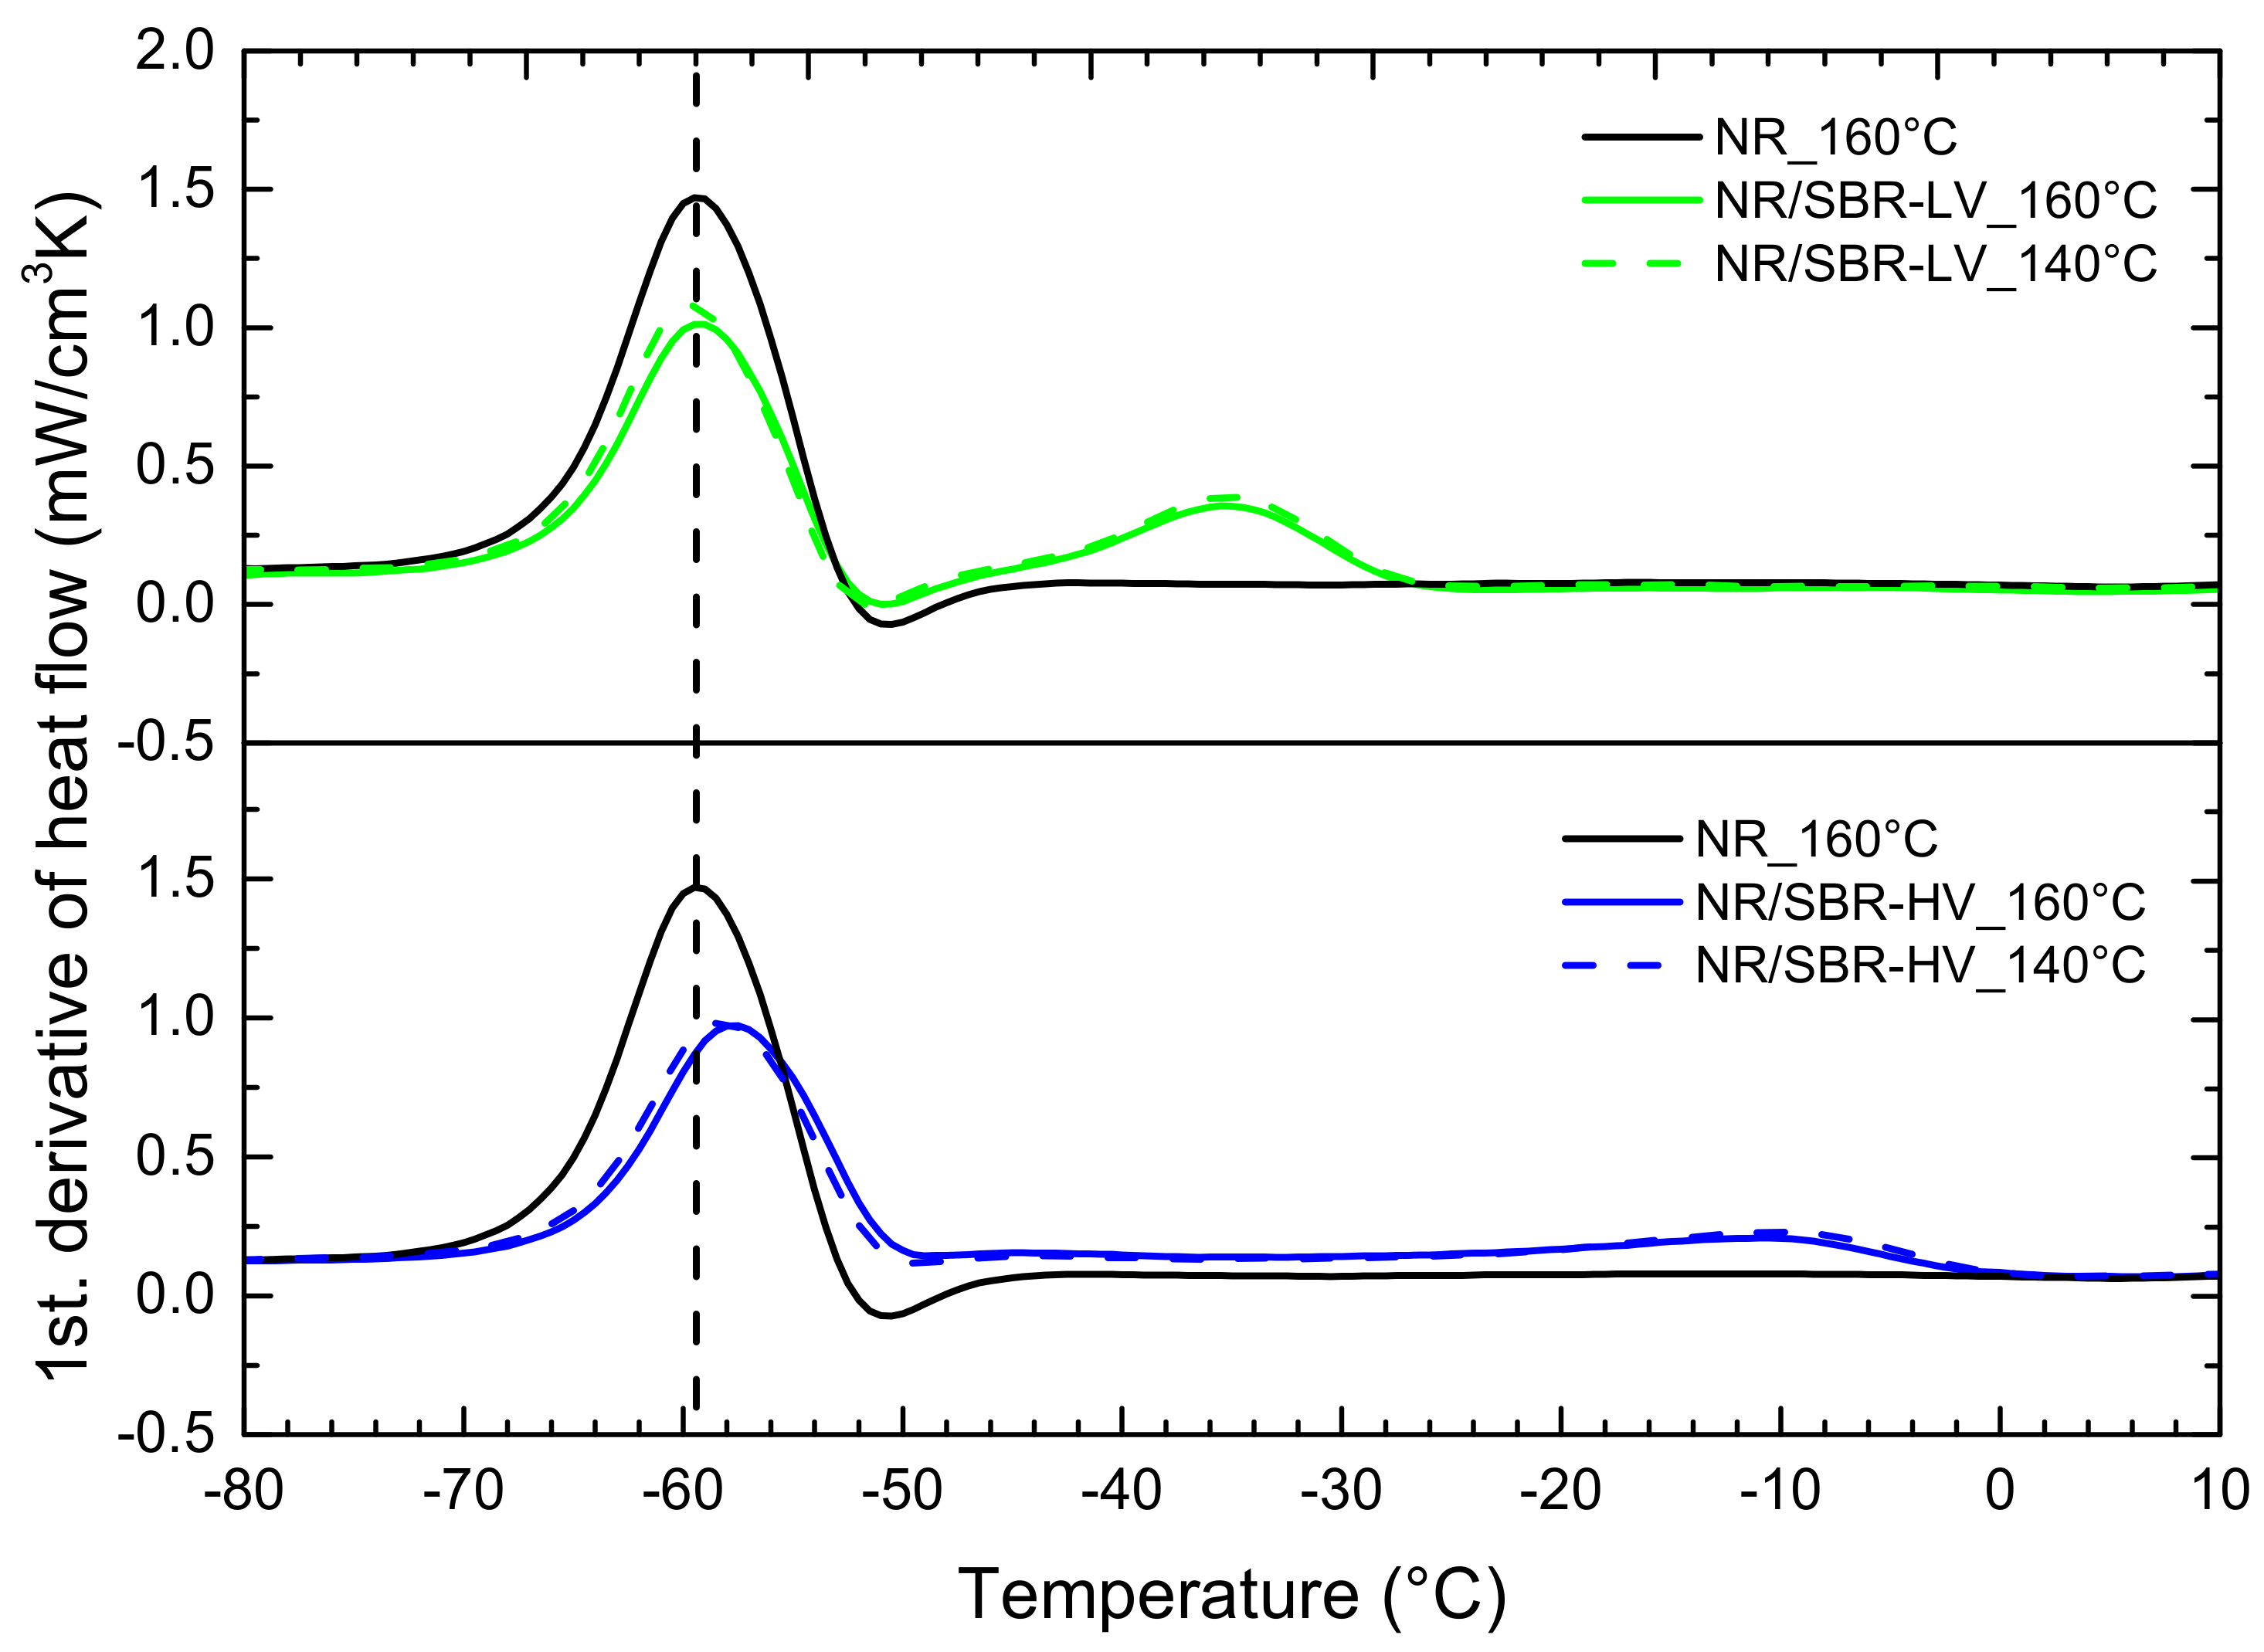
3.3. Effect of Curing Temperature on Morphology
3.4. Effect of Curing Time on Morphology
4. Conclusions
Author Contributions
Funding
Acknowledgments
Conflicts of Interest
References
- Hourston, D.J.; Song, M. Quantitative characterization of interfaces in rubber–rubber blends by means of modulated-temperature DSC. J. Appl. Polym. Sci. 2000, 76, 1791–1798. [Google Scholar] [CrossRef]
- Mansilla, M.A.; Silva, L.; Salgueiro, W.; Marzocca, A.J.; Somoza, A. A study about the structure of vulcanized natural rubber/styrene butadiene rubber blends and the glass transition behavior. J. Appl. Polym. Sci. 2012, 125, 992–999. [Google Scholar] [CrossRef]
- Šebenik, U.; Zupančič-Valant, A.; Krajnc, M. Investigation of rubber–rubber blends miscibility. Polym. Eng. Sci. 2006, 46, 1649–1659. [Google Scholar] [CrossRef]
- Klat, D.; Kępas-Suwara, A.; Lacayo-Pineda, J.; Cook, S. Morphology and nanomechanical characteristics of NR/SBR blends. Rubber Chem. Technol. 2018. [Google Scholar] [CrossRef]
- Callan, J.E.; Hess, W.M.; Scott, C.E. Elastomer Blends. Compatibility and Relative Response to Fillers. Rubber Chem. Technol. 1971, 44, 814–837. [Google Scholar] [CrossRef]
- Tokita, N. Analysis of Morphology Formation in Elastomer Blends. Rubber Chem. Technol. 1977, 50, 292–300. [Google Scholar] [CrossRef]
- Hess, W.M.; Scott, C.E.; Callan, J.E. Carbon Black Distribution in Elastomer Blends. Rubber Chem. Technol. 1967, 40, 371–384. [Google Scholar] [CrossRef]
- Walters, M.H.; Keyte, D.N. Heterogeneous Structure in Blends of Rubber Polymers. Rubber Chem. Technol. 1965, 38, 62–75. [Google Scholar] [CrossRef]
- Berger, W.; Kammer, H.W.; Kummerlőwe, C. Melt rheology and morphology of polymer blends. Makromol. Chem. 1984, 8, 101–108. [Google Scholar] [CrossRef]
- Avgeropoulos, G.N.; Weissert, F.C.; Biddison, P.H.; Böhm, G.G.A. Heterogeneous Blends of Polymers. Rheology and Morphology. Rubber Chem. Technol. 1976, 49, 93–104. [Google Scholar] [CrossRef]
- Nelson, C.J.; Avgeropoulos, G.N.; Weissert, F.C.; Böhm, G.G.A. The relationship between rheology, morphology and physical properties in heterogeneous blends. Angew. Makromol. Chem. 1977, 60, 49–86. [Google Scholar] [CrossRef]
- Schuster, R.H.; Issel, H.M.; Peterseim, V. Selective Interactions in Elastomers, a Base for Compatibility and Polymer-Filler Interactions. Rubber Chem. Technol. 1996, 69, 769–780. [Google Scholar] [CrossRef]
- Rocha, T.L.A.C.; Rosca, C.; Schuster, R.H.; Jacobi, M.M. Study on rubber blends: Influence of epoxidation on phase morphology and interphase. J. Appl. Polym. Sci. 2007, 104, 2377–2384. [Google Scholar] [CrossRef]
- Cook, S. Improving the Low Temperature Resistance of Natural Rubber. J. Rubber Res. 2001, 4, 69–81. [Google Scholar]
- Yamada, K.; Funayama, Y. FTIR Spectroscopic Studies of Miscible Polymer Blends. Rubber Chem. Technol. 1990, 63, 669–682. [Google Scholar] [CrossRef]
- Roovers, J.; Toporowski, P.M. Microheterogeneity in miscible blends of 1,2-polybutadiene and 1,4-polyisoprene. Macromolecules 1992, 25, 3454–3461. [Google Scholar] [CrossRef]
- Inouea, Y.; Iwasa, M.; Yoshida, H. Variable Temperature AFM Observation of Phase Separation in NR/BR Blend. Netsu Sokutei 2012, 39, 41–46. [Google Scholar]
- Galuska, A.A.; Poulter, R.R.; McElrath, O.K. Force Modulation AFM of Elastomer Blends: Morphology, Fillers and Cross-linking. Surf. Interface Anal. 1998, 25, 418–429. [Google Scholar] [CrossRef]
- Jeon, I.H.; Kim, H.; Kim, S.G. Characterization of Rubber Micro-Morphology by Atomic Force Microscopy(AFM). Rubber Chem. Technol. 2003, 76, 1–11. [Google Scholar] [CrossRef]
- Achalla, P.; McCormick, J.; Hodge, T.; Moreland, C.; Esnault, P.; Karim, A.; Raghavan, D. Characterization of elastomeric blends by atomic force microscopy. J. Polym. Sci. B Polym. Phys. 2006, 44, 492–503. [Google Scholar] [CrossRef]
- Fan, R.L.; Zhang, Y.; Li, F.; Zhang, Y.X.; Sun, K.; Fan, Y.Z. Effect of high-temperature curing on the crosslink structures and dynamic mechanical properties of gum and N330-filled natural rubber vulcanizates. Polym. Test. 2001, 20, 925–936. [Google Scholar] [CrossRef]
- Berquand, A. Quantitative Imaging of Living Biological Samples by PeakForce QNM Atomic Force Microscopy. In Bruker Corporation Application Note, AN135 Rev. A0; Bruker: Billerica, MA, USA, 2011. [Google Scholar]
- Pittenger, B.; Erina, N.; Su, C. Quantitative Mechanical Property Mapping at the Nanoscale with PeakForce QNM. In Bruker Corporation Application Note, AN128 Rev. A; Bruker: Billerica, MA, USA, 2010. [Google Scholar]
- Derjaguin, B.; Muller, V.; Toporov, Y. Effect of contact deformations on the adhesion of particles. J. Colloid Interface Sci. 1975, 53, 314–326. [Google Scholar] [CrossRef]
- Ho, C.C.; Khew, M.C. Surface Free Energy Analysis of Natural and Modified Natural Rubber Latex Films by Contact Angle Method. Langmuir 2000, 16, 1407–1414. [Google Scholar] [CrossRef]
- Owens, D.K.; Wendt, R.C. Estimation of the surface free energy of polymers. J. Appl. Polym. Sci. 1969, 13, 1741–1747. [Google Scholar] [CrossRef]
- Fowkes, F.M. Attractive forces at interfaces. Ind. Eng. Chem. 1964, 56, 40–52. [Google Scholar] [CrossRef]
- Matsko, N.B.; Mittal, V. Thermotropic dynamic processes in multiphase polymer systems by (cryo-)AFM. Soft Matter 2014, 10, 5478–5488. [Google Scholar] [CrossRef] [PubMed]
- Michler, G.H. Electron Microscopy of Polymers, 1st ed.; Springer: Berlin/Heidelberg, Germany, 2008. [Google Scholar]
- Liu, Y.; Bhandari, B.; Zhou, W. Glass transition and enthalpy relaxation of amorphous food saccharides: A review. J. Agric. Food Chem. 2006, 54, 5701–5717. [Google Scholar] [CrossRef] [PubMed]
- Andreozzi, L.; Faetti, M.; Giordano, M.; Palazzuoli, D.; Zulli, F. Enthalpy Relaxation in Polymers: A Comparison among Different Multiparameter Approaches Extending the TNM/AGV Model. Macromolecules 2003, 36, 7379–7387. [Google Scholar] [CrossRef]
- Yin, H.; Schönhals, A. Broadband Dielectric Spectroscopy on Polymer Blends. In Polymer Blends Handbook, 1st ed.; Utracki, L.A., Wilkie, C.A., Eds.; Springer: Dordrecht, The Netherlands, 2014; pp. 1299–1356. [Google Scholar]
- Schönhals, A. Molecular Dynamics in Polymer Model Systems. In Broadband Dielectric Spectroscopy, 1st ed.; Kremer, F., Schönhals, A., Eds.; Springer: Berlin/Heidelberg, Germany, 2003; pp. 225–293. [Google Scholar]
- Starý, Z. Thermodynamics and Morphology and Compatibilization of Polymer Blends. In Characterization of Polymer Blends, 1st ed.; Thomas, S., Grohens, Y., Jyotishkumar, P., Eds.; Wiley: Weinheim, Germany, 2014; pp. 93–132. [Google Scholar]
- Bristow, G.M.; Watson, W.F. Cohesive energy densities of polymers. Part 1.-Cohesive energy densities of rubbers by swelling measurements. Trans. Faraday Soc. 1958, 54, 1731–1741. [Google Scholar] [CrossRef]
- Rocha, T.L.A.C.; Rosca, C.; Ziegler, J.; Schuster, R.H. Influence of Polymer Polarity on Phase Morphology of NR Blends. KGK 2005, 58, 22–29. [Google Scholar]
- Rodgers, B.; Halasa, A. Compounding and Processing of Rubber/Rubber Blends. In Encyclopedia of Polymer Blends; Isayev, A.I., Ed.; Wiley: Weinheim, Germany, 2011; pp. 163–206. [Google Scholar]
- Hasegawa, H.; Sakurai, S.; Takenaka, M.; Hashimoto, T.; Han, C.C. Small-angle neutron scattering and light scattering studies on the miscibility of protonated polyisoprene/deuterated polybutadiene blends. Macromolecules 1991, 24, 1813–1819. [Google Scholar] [CrossRef]
- Kawahara, S. Natural Rubber Based Non-Polar Synthetic Rubber Blends. In Natural Rubber Materials: Volume 1: Blends and IPNs; Thomas, S., Chan, C.H., Pothen, L., Rajisha, K.R., Maria, H., Eds.; The Royal Society of Chemistry: London, UK, 2014; pp. 195–212. [Google Scholar]
- Kawahara, S.; Akiyama, S.; Ueda, A. Miscibility and LCST Behavior of Polyisoprene/Poly(cis-butadiene-co-1,2-vinylbutadiene) Blends. Polym. J. 1989, 21, 221–229. [Google Scholar] [CrossRef]
- Manias, E.; Utracki, L.A. Thermodynamics of Polymer Blends. In Polymer Blends Handbook; Utracki, L.A., Wilkie, C.A., Eds.; Springer: Dordrecht, The Netherlands, 2014; pp. 171–289. [Google Scholar]
- Yamanaka, K.; Inoue, T. Phase separation mechanism of rubber-modified epoxy. J. Mater. Sci. 1990, 25, 241–245. [Google Scholar] [CrossRef]


| Properties | NR | SBR–LV | SBR–HV |
|---|---|---|---|
| Styrene/vinyl content (%) | - | 24/34.2 | 24.3/67.2 |
| Tg (DSC) a (°C) | −60 | −37 | −12 |
| Mooney viscosity b [ML1 + 4 (100 °C)] | 96.2 | 55.8 | 68.0 |
| Ingredients | NR/SBR–LV | NR/SBR–HV |
|---|---|---|
| NR | 70 | 70 |
| SBR–LV | 30 | - |
| SBR–HV | - | 30 |
| 6PPD 1 | 1 | 1 |
| Zinc oxide | 2 | 2 |
| Steric acid | 1 | 1 |
| TBBS 2 | 2 | 2 |
| Sulfur | 2 | 2 |
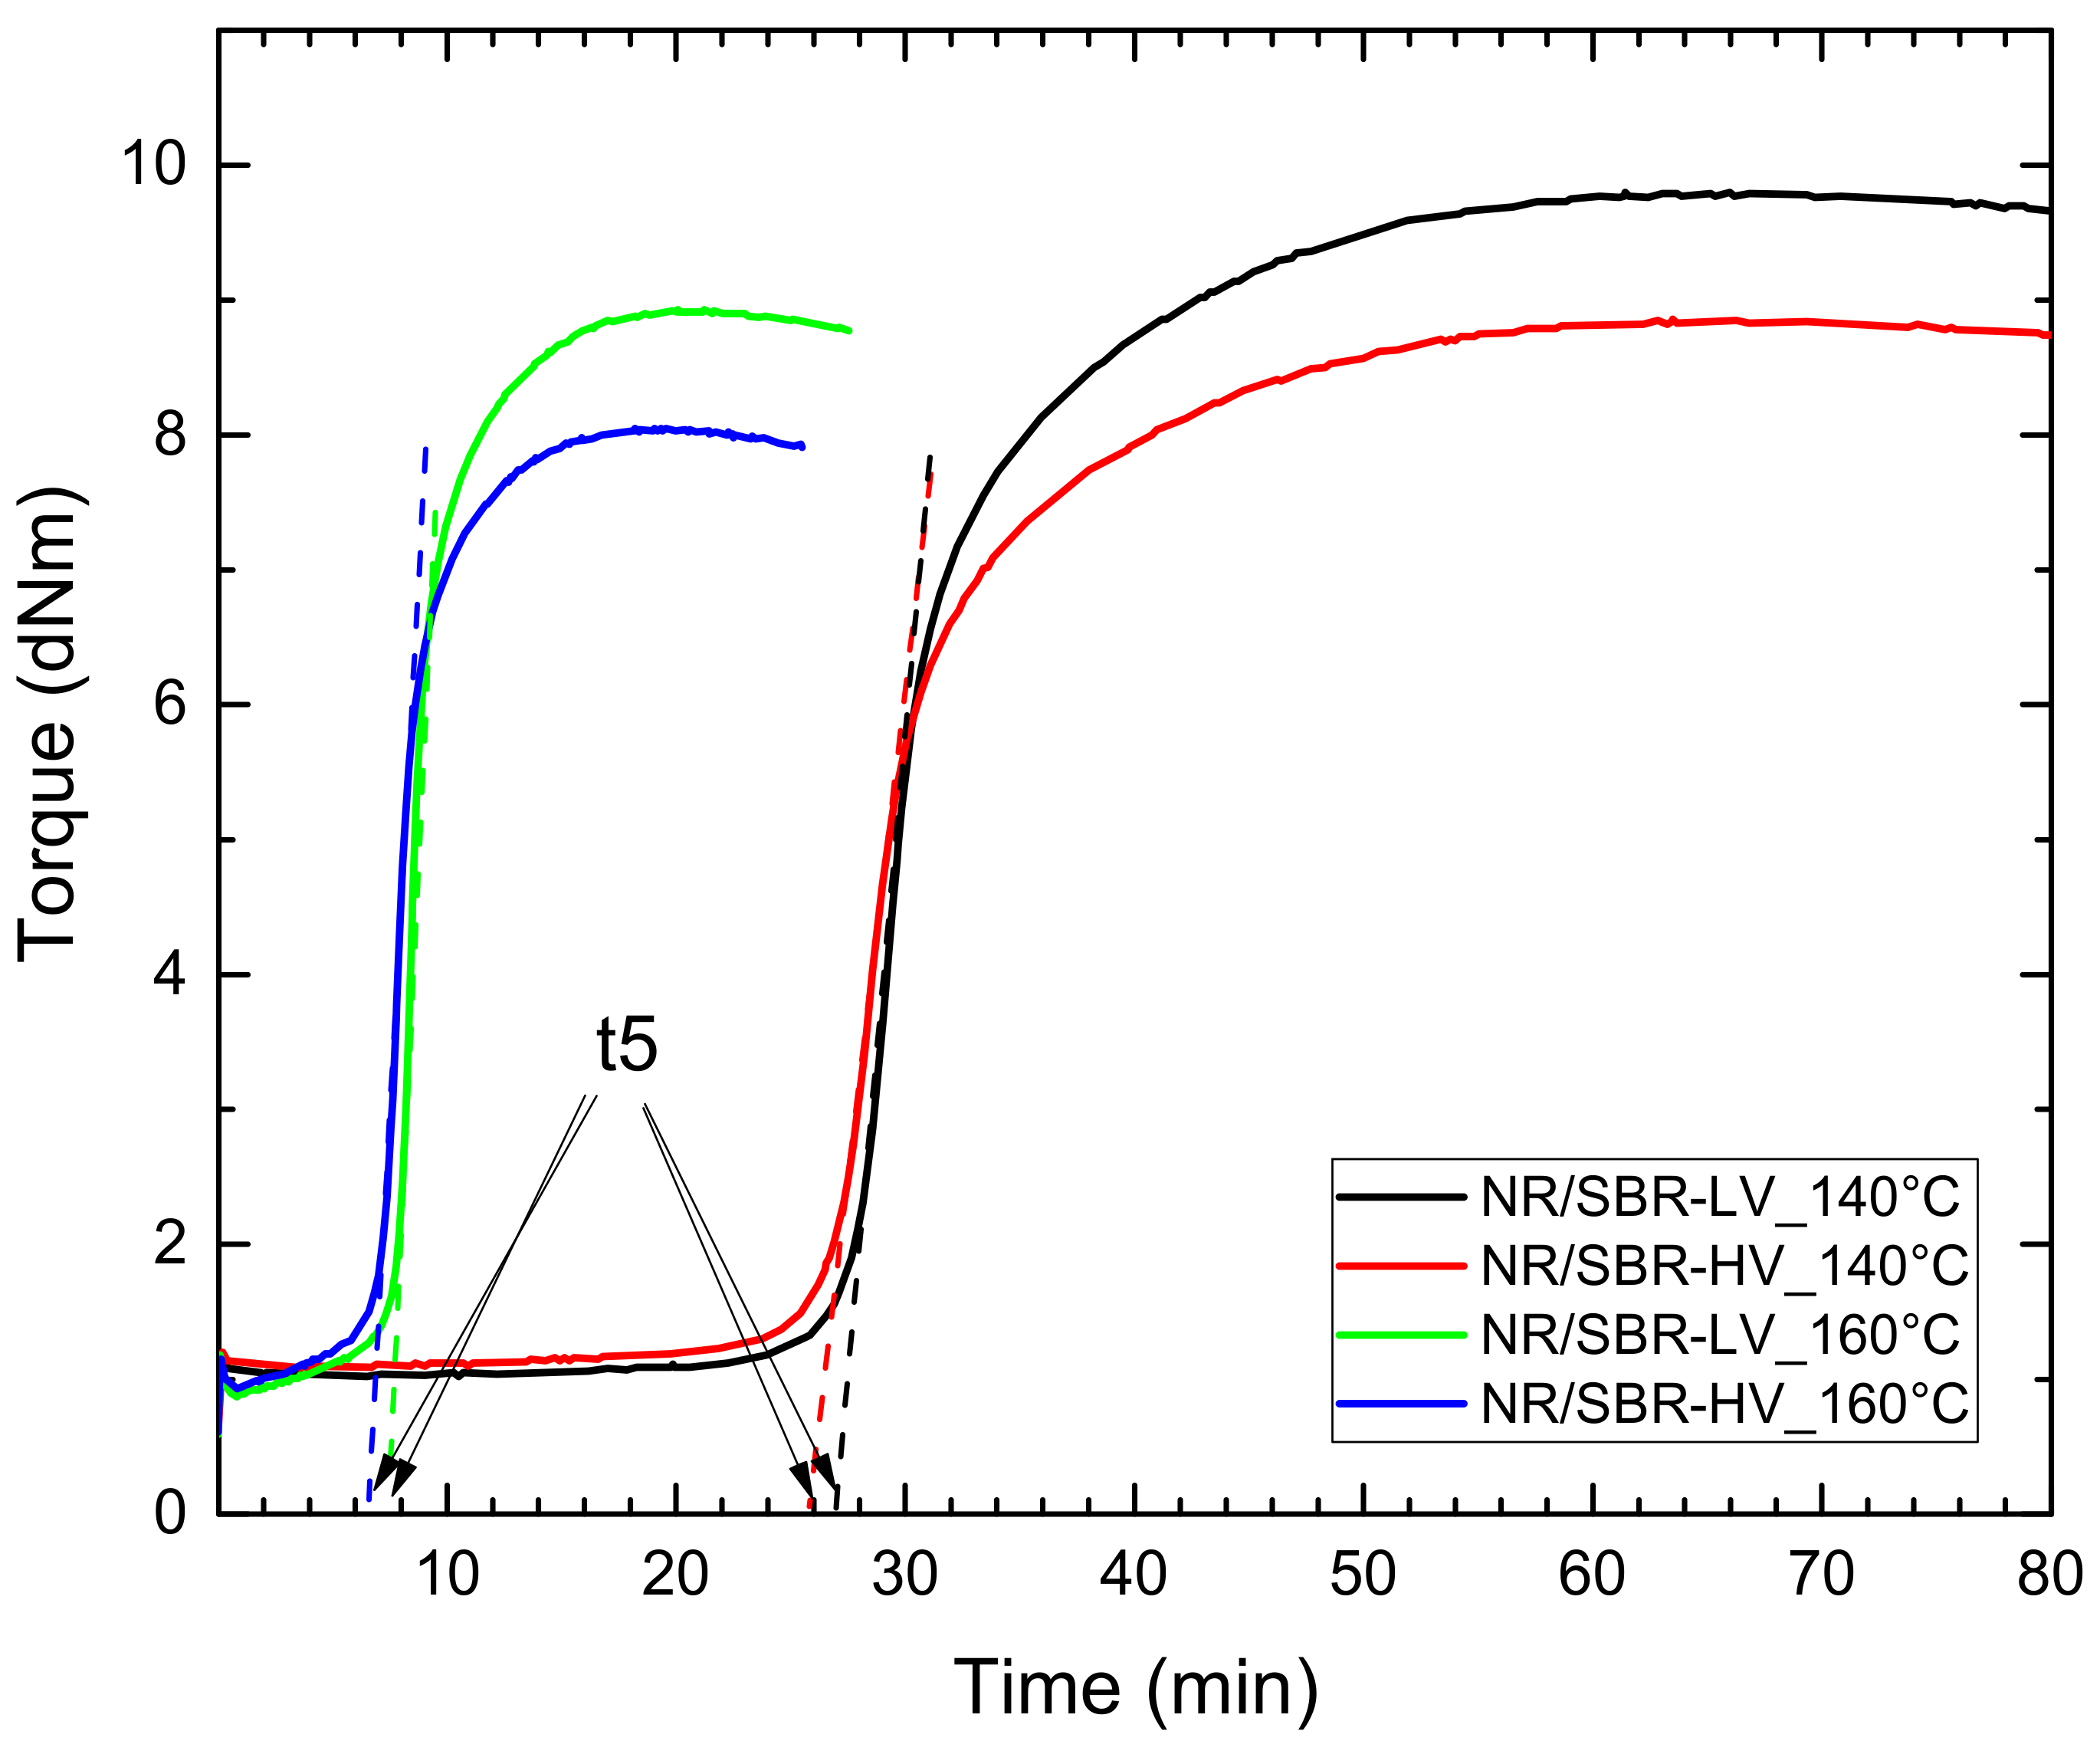
| Curing Time (min) | ||||
|---|---|---|---|---|
| Conversion Time | NR/SBR–LV 140 °C | NR/SBR–LV 160 °C | NR/SBR–HV 140 °C | NR/SBR–HV 160 °C |
| Uncured | 0 | 0 | 0 | 0 |
| t95 | 47 | 13.8 | 47 | 12.8 |
| t5 | 27 | 7.7 | 26 | 6.7 |
| t5/2 | 13.5 | 3.9 | 13 | 3.4 |
| t5/4 | 6.8 | 1.9 | 6.5 | - |
| Surface Free Energy (mN/m) | NR | SBR–HV | SBR–LV |
|---|---|---|---|
| Dispersive part | 20.2 | 30.8 | 29.9 |
| Polar part | 5.5 | 4.0 | 1.6 |
© 2018 by the authors. Licensee MDPI, Basel, Switzerland. This article is an open access article distributed under the terms and conditions of the Creative Commons Attribution (CC BY) license (http://creativecommons.org/licenses/by/4.0/).
Share and Cite
Klat, D.; Karimi-Varzaneh, H.A.; Lacayo-Pineda, J. Phase Morphology of NR/SBR Blends: Effect of Curing Temperature and Curing Time. Polymers 2018, 10, 510. https://doi.org/10.3390/polym10050510
Klat D, Karimi-Varzaneh HA, Lacayo-Pineda J. Phase Morphology of NR/SBR Blends: Effect of Curing Temperature and Curing Time. Polymers. 2018; 10(5):510. https://doi.org/10.3390/polym10050510
Chicago/Turabian StyleKlat, Darja, Hossein Ali Karimi-Varzaneh, and Jorge Lacayo-Pineda. 2018. "Phase Morphology of NR/SBR Blends: Effect of Curing Temperature and Curing Time" Polymers 10, no. 5: 510. https://doi.org/10.3390/polym10050510
APA StyleKlat, D., Karimi-Varzaneh, H. A., & Lacayo-Pineda, J. (2018). Phase Morphology of NR/SBR Blends: Effect of Curing Temperature and Curing Time. Polymers, 10(5), 510. https://doi.org/10.3390/polym10050510