3.1. Characterization of PCL and UHMWPE Sheets
The thermal properties of the PCL and UHMWPE sheets were studied by DSC, TGA, and Vicat test. From the Vicat test, the corresponding analysis determined that the Vicat softening temperature (VST) for PCL and UHMWPE is around 44 and 90 °C, respectively. The VST is considered as the temperature at which a specimen is penetrated to a depth of 1 mm by a flat-ended needle with a 1 mm
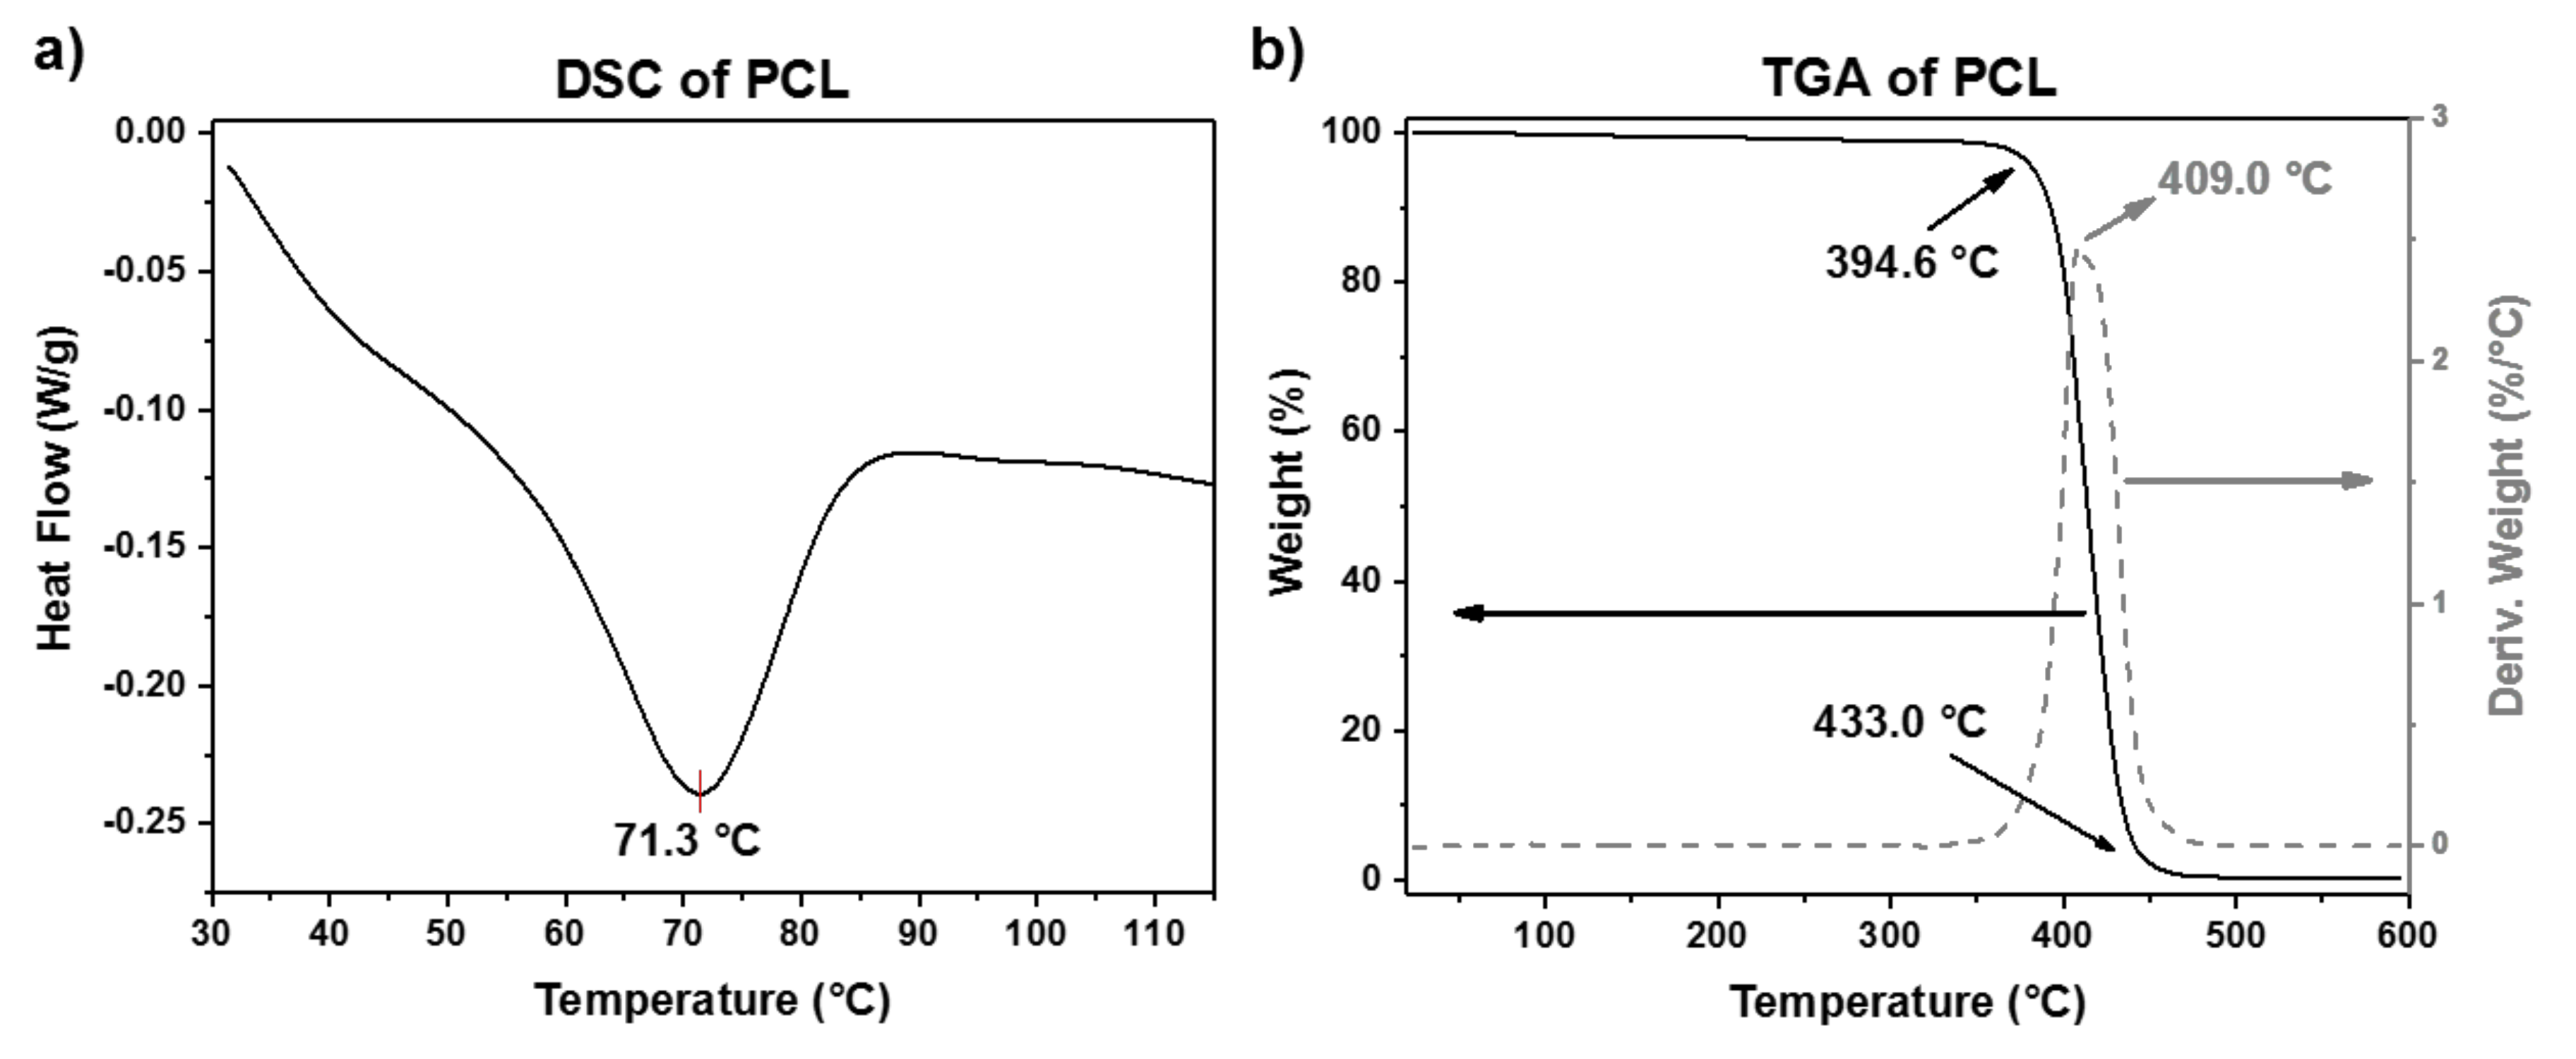
2 circular or square cross-section. Is worth mentioning that the VST is a specific temperature value, while the melt point of thermoplastic polymers is usually taken within a whole range of temperature. So, for applications in SPIF, it will be more useful to consider the VST to analyze the formability of polymers once the sheet reaches the VST due to the friction caused by the contact between the sheet surface and the forming tool. The DSC and TGA curves for PCL are shown in
Figure 3. The melting behavior of PCL displayed in
Figure 3a shows a melting peak around 71 °C. From the TGA curve (
Figure 3b), it can be observed that PCL shows a degradation step in the range from 394 to 433 °C, with a temperature of maximum decomposition rate of 409 °C. These results agree with the values reported in the literature [
19,
20].
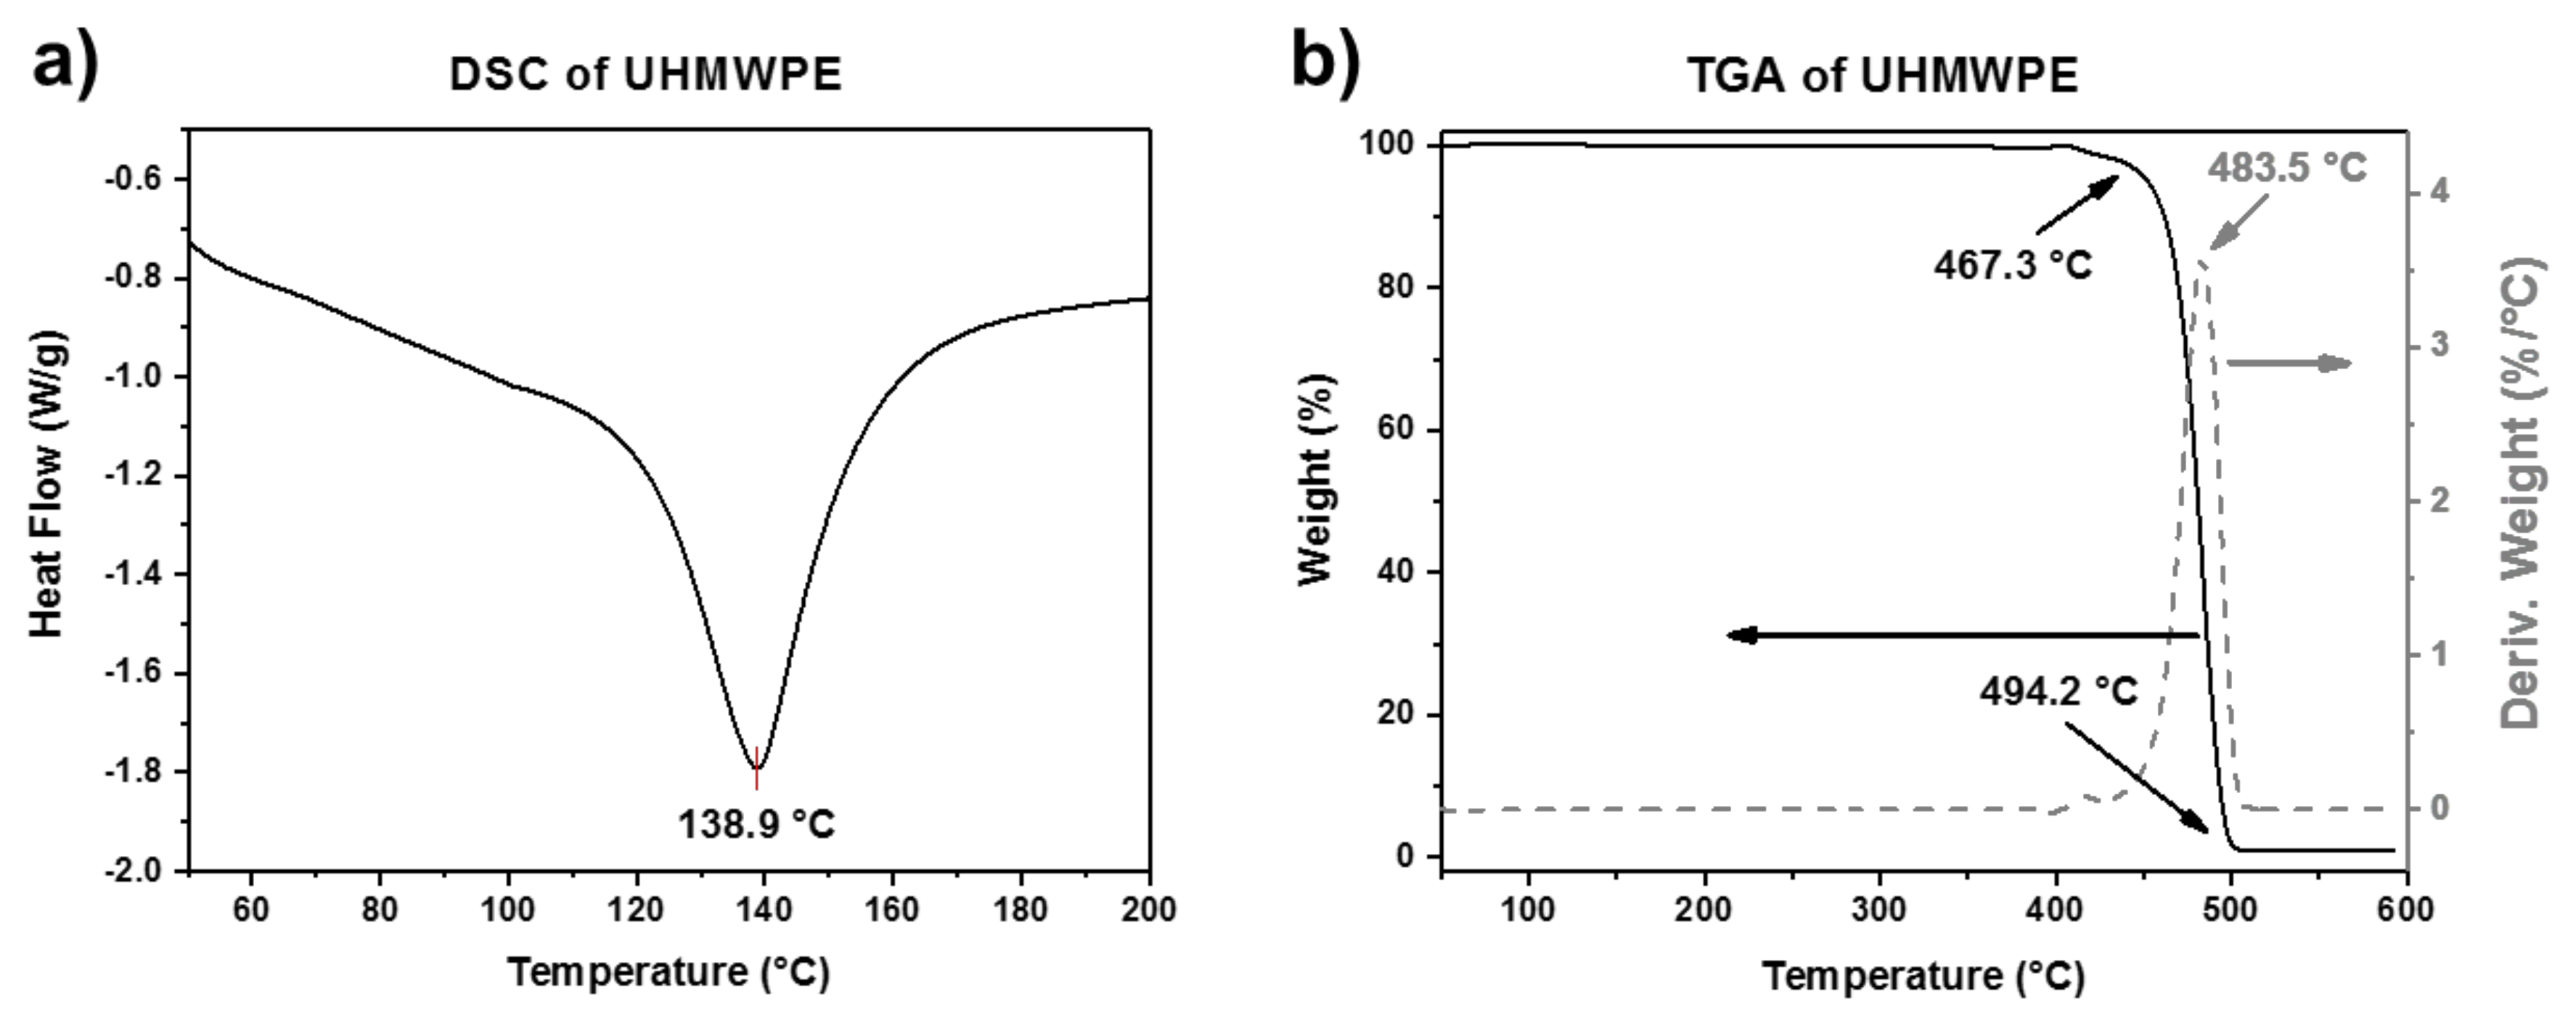
The DSC and TGA curves of UHMWPE are shown in
Figure 4a,b, respectively. The DSC curve shows a melting peak at around 139 °C. On the other hand, the TGA curve also shows a single-step degradation behavior in the range from 467 to 494 °C, with a temperature of maximum decomposition rate around 484 °C. The higher thermal stability of UHMWPE compared to PCL is attributed to its longer polymer chains. The thermal properties of the two polymers are summarized in
Table 3.
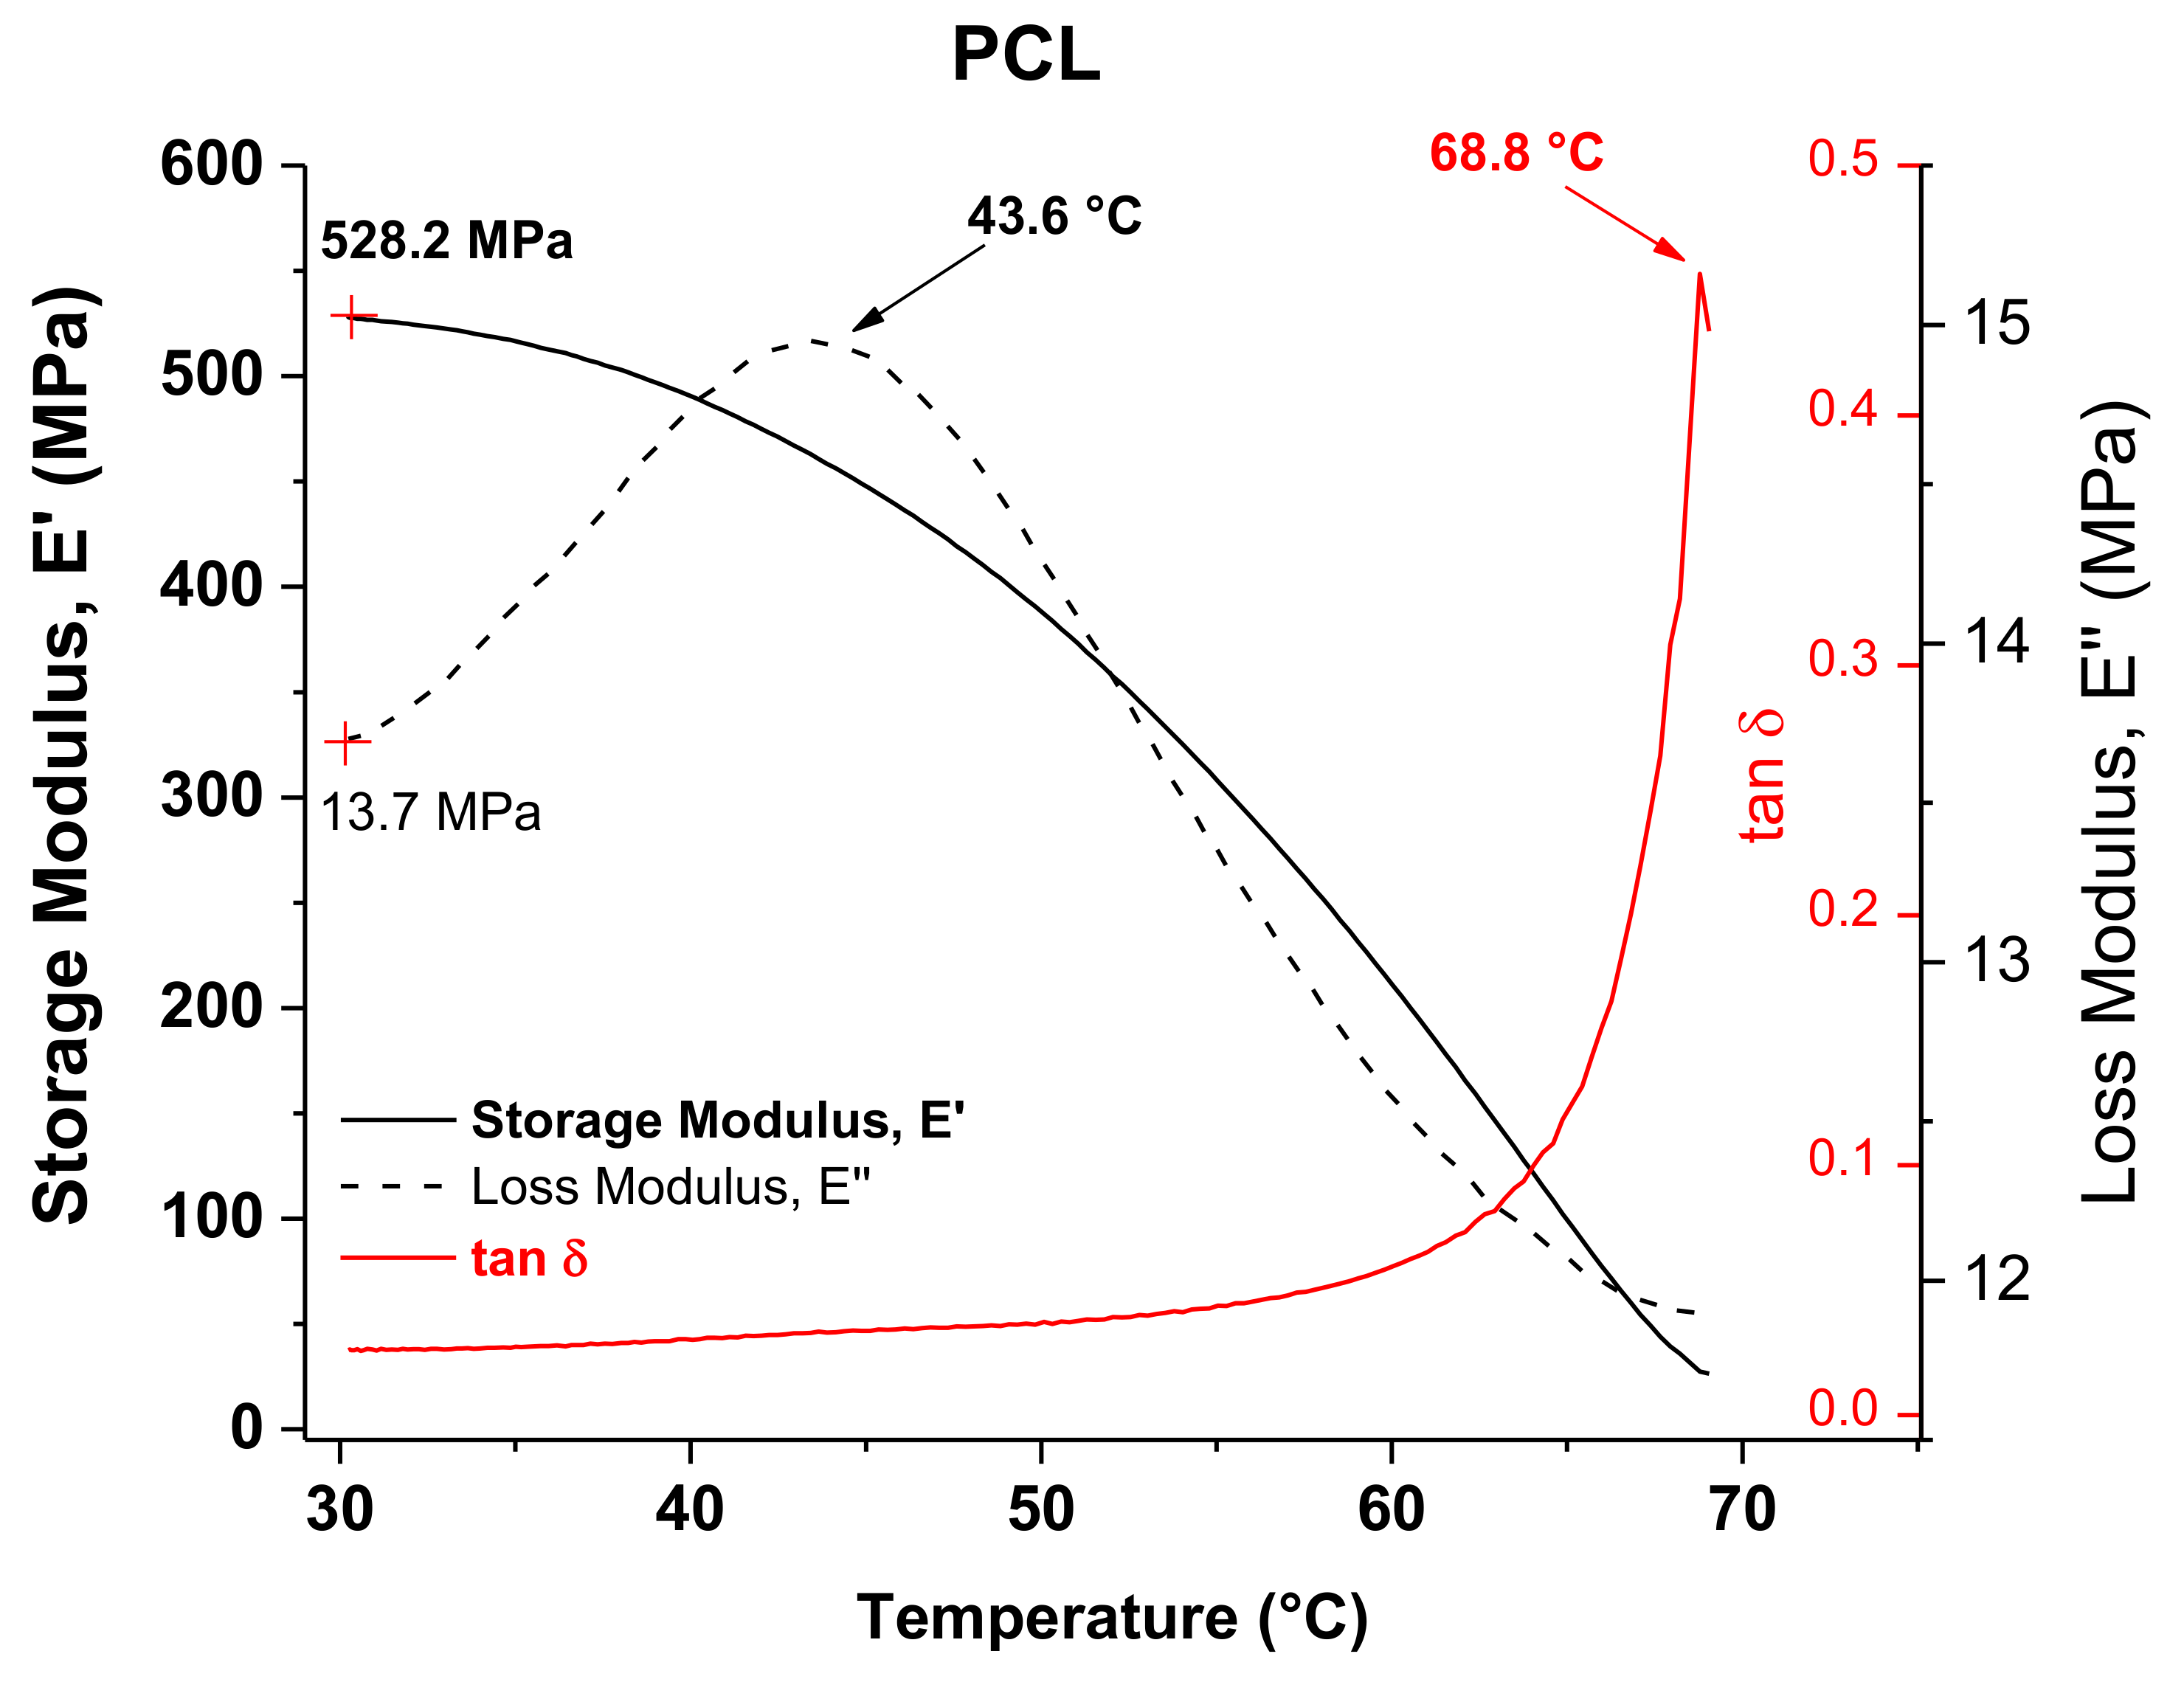
DMA results of PCL in the temperature range of 30–70 °C are shown in
Figure 5 for the temperature dependence of the storage (
E’) and loss (
E”) moduli and the loss factor (tan δ). Observed at the initial temperature of the analysis were values of
E’ and
E” equal to 528 and 113.7 MPa, respectively. The curve of
E” shows a peak that has been attributed to a transition occurring in the polymer associated with the slippage between crystallites. This type of transition has often been identified as an alpha star transition (
Tα*) and detected in semicrystalline polymers [
27]. This peak has a maximum value at 43.6 °C, which is close to the VST previously determined for PCL. The alpha star transition was not detected by DSC because DMA is much more sensitive and can easily measure transitions not apparent in other thermal methods. This
Tα* can be correlated with the VST if it is considered that at a temperature around 44 °C there is a crystal–crystal slippage within the PCL, which facilitates the penetration of the needle in the VST test. The curve of tan δ shows a peak at 68.8 °C, which corresponds to the melting temperature (
Tm) and is similar to that previously measured by DSC.
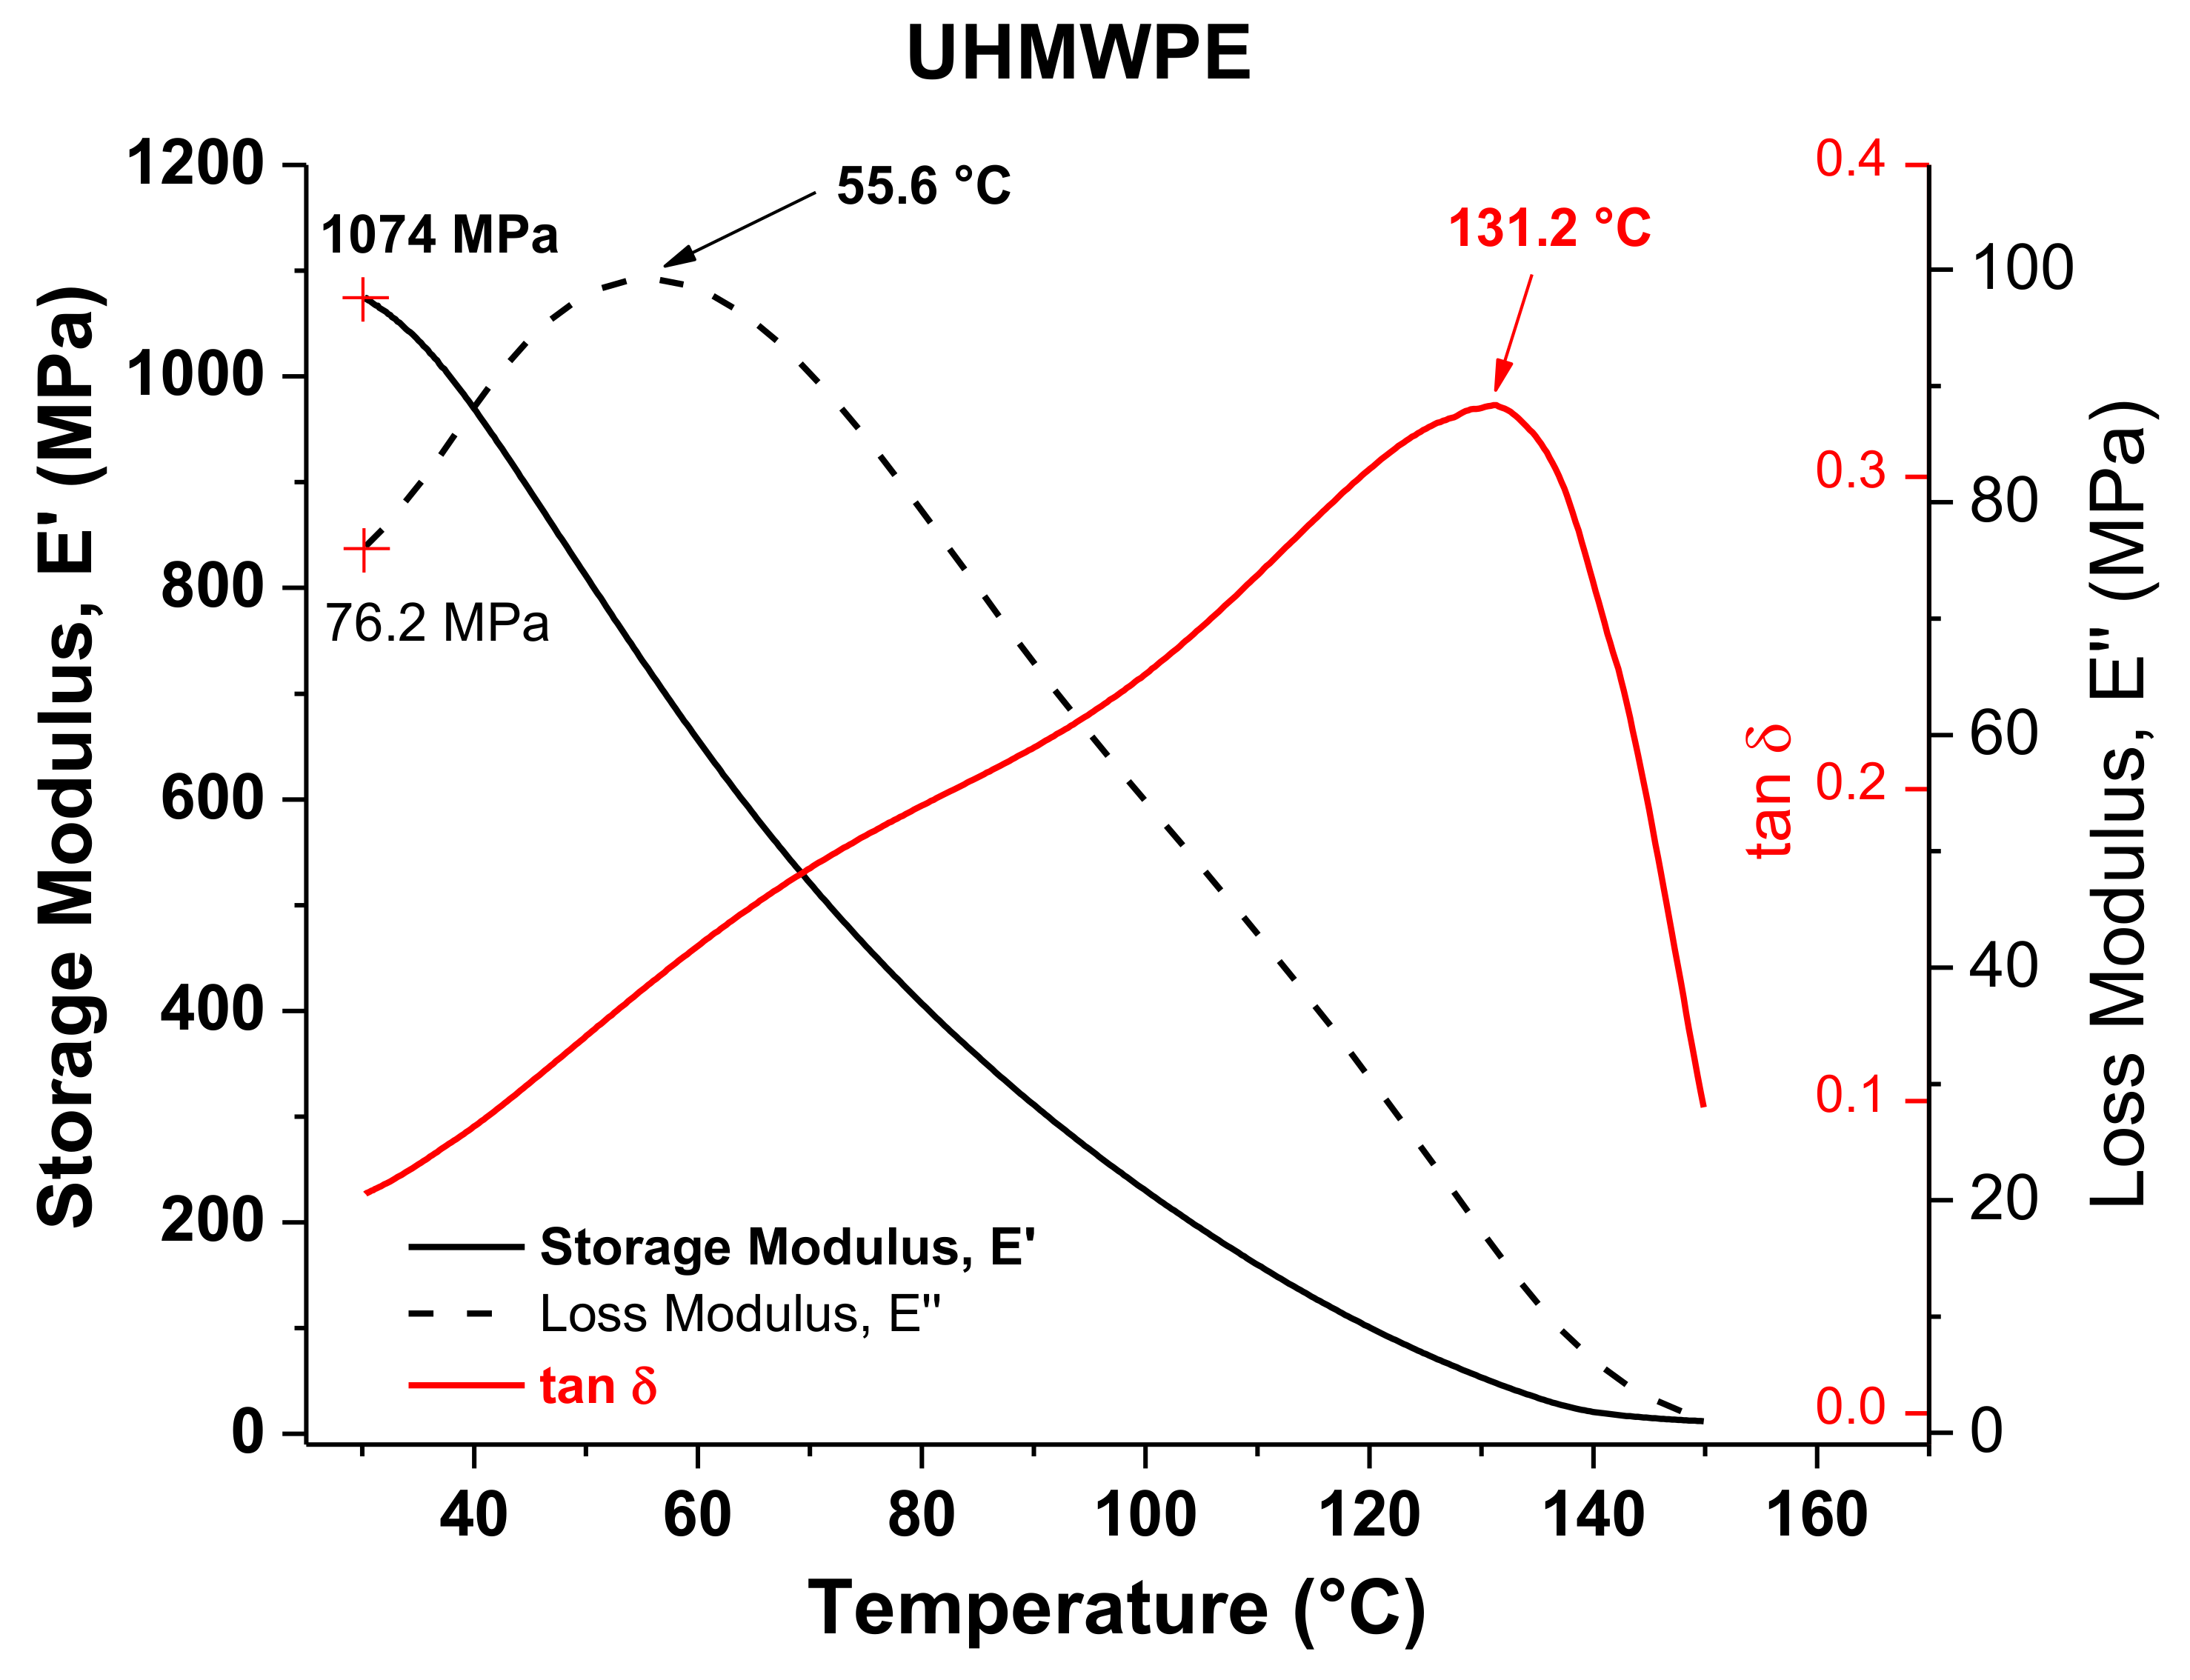
Figure 6 shows the DMA results of UHMWPE. Similar to what occurs with PCL, the
E” curve of UHMWPE exhibits a peak at 55.6 °C, which can also be identified as an alpha star transition associated with the slippage between crystallites, considering that it is a semicrystalline polymer as well. Unlike PCL, the values of VST and
Tα* of UHMWPE differ considerably from each other. This can be attributed to the presence of long molecular chains in UHMWPE, so that even when there is a crystal–crystal slippage at around 55 °C, it becomes more complicated to move or pass through a polymer composed of long chains that must also be highly entangled as occurs in UHMWPE. Therefore, it is necessary to continue heating to allow for sufficient movement of the long chains so that the VST test needle penetrates in the UHMWPE structure. The
Tm obtained by DMA, taken as the peak of the tan δ curve (i.e., 131.2 °C), is similar to that obtained by DSC.
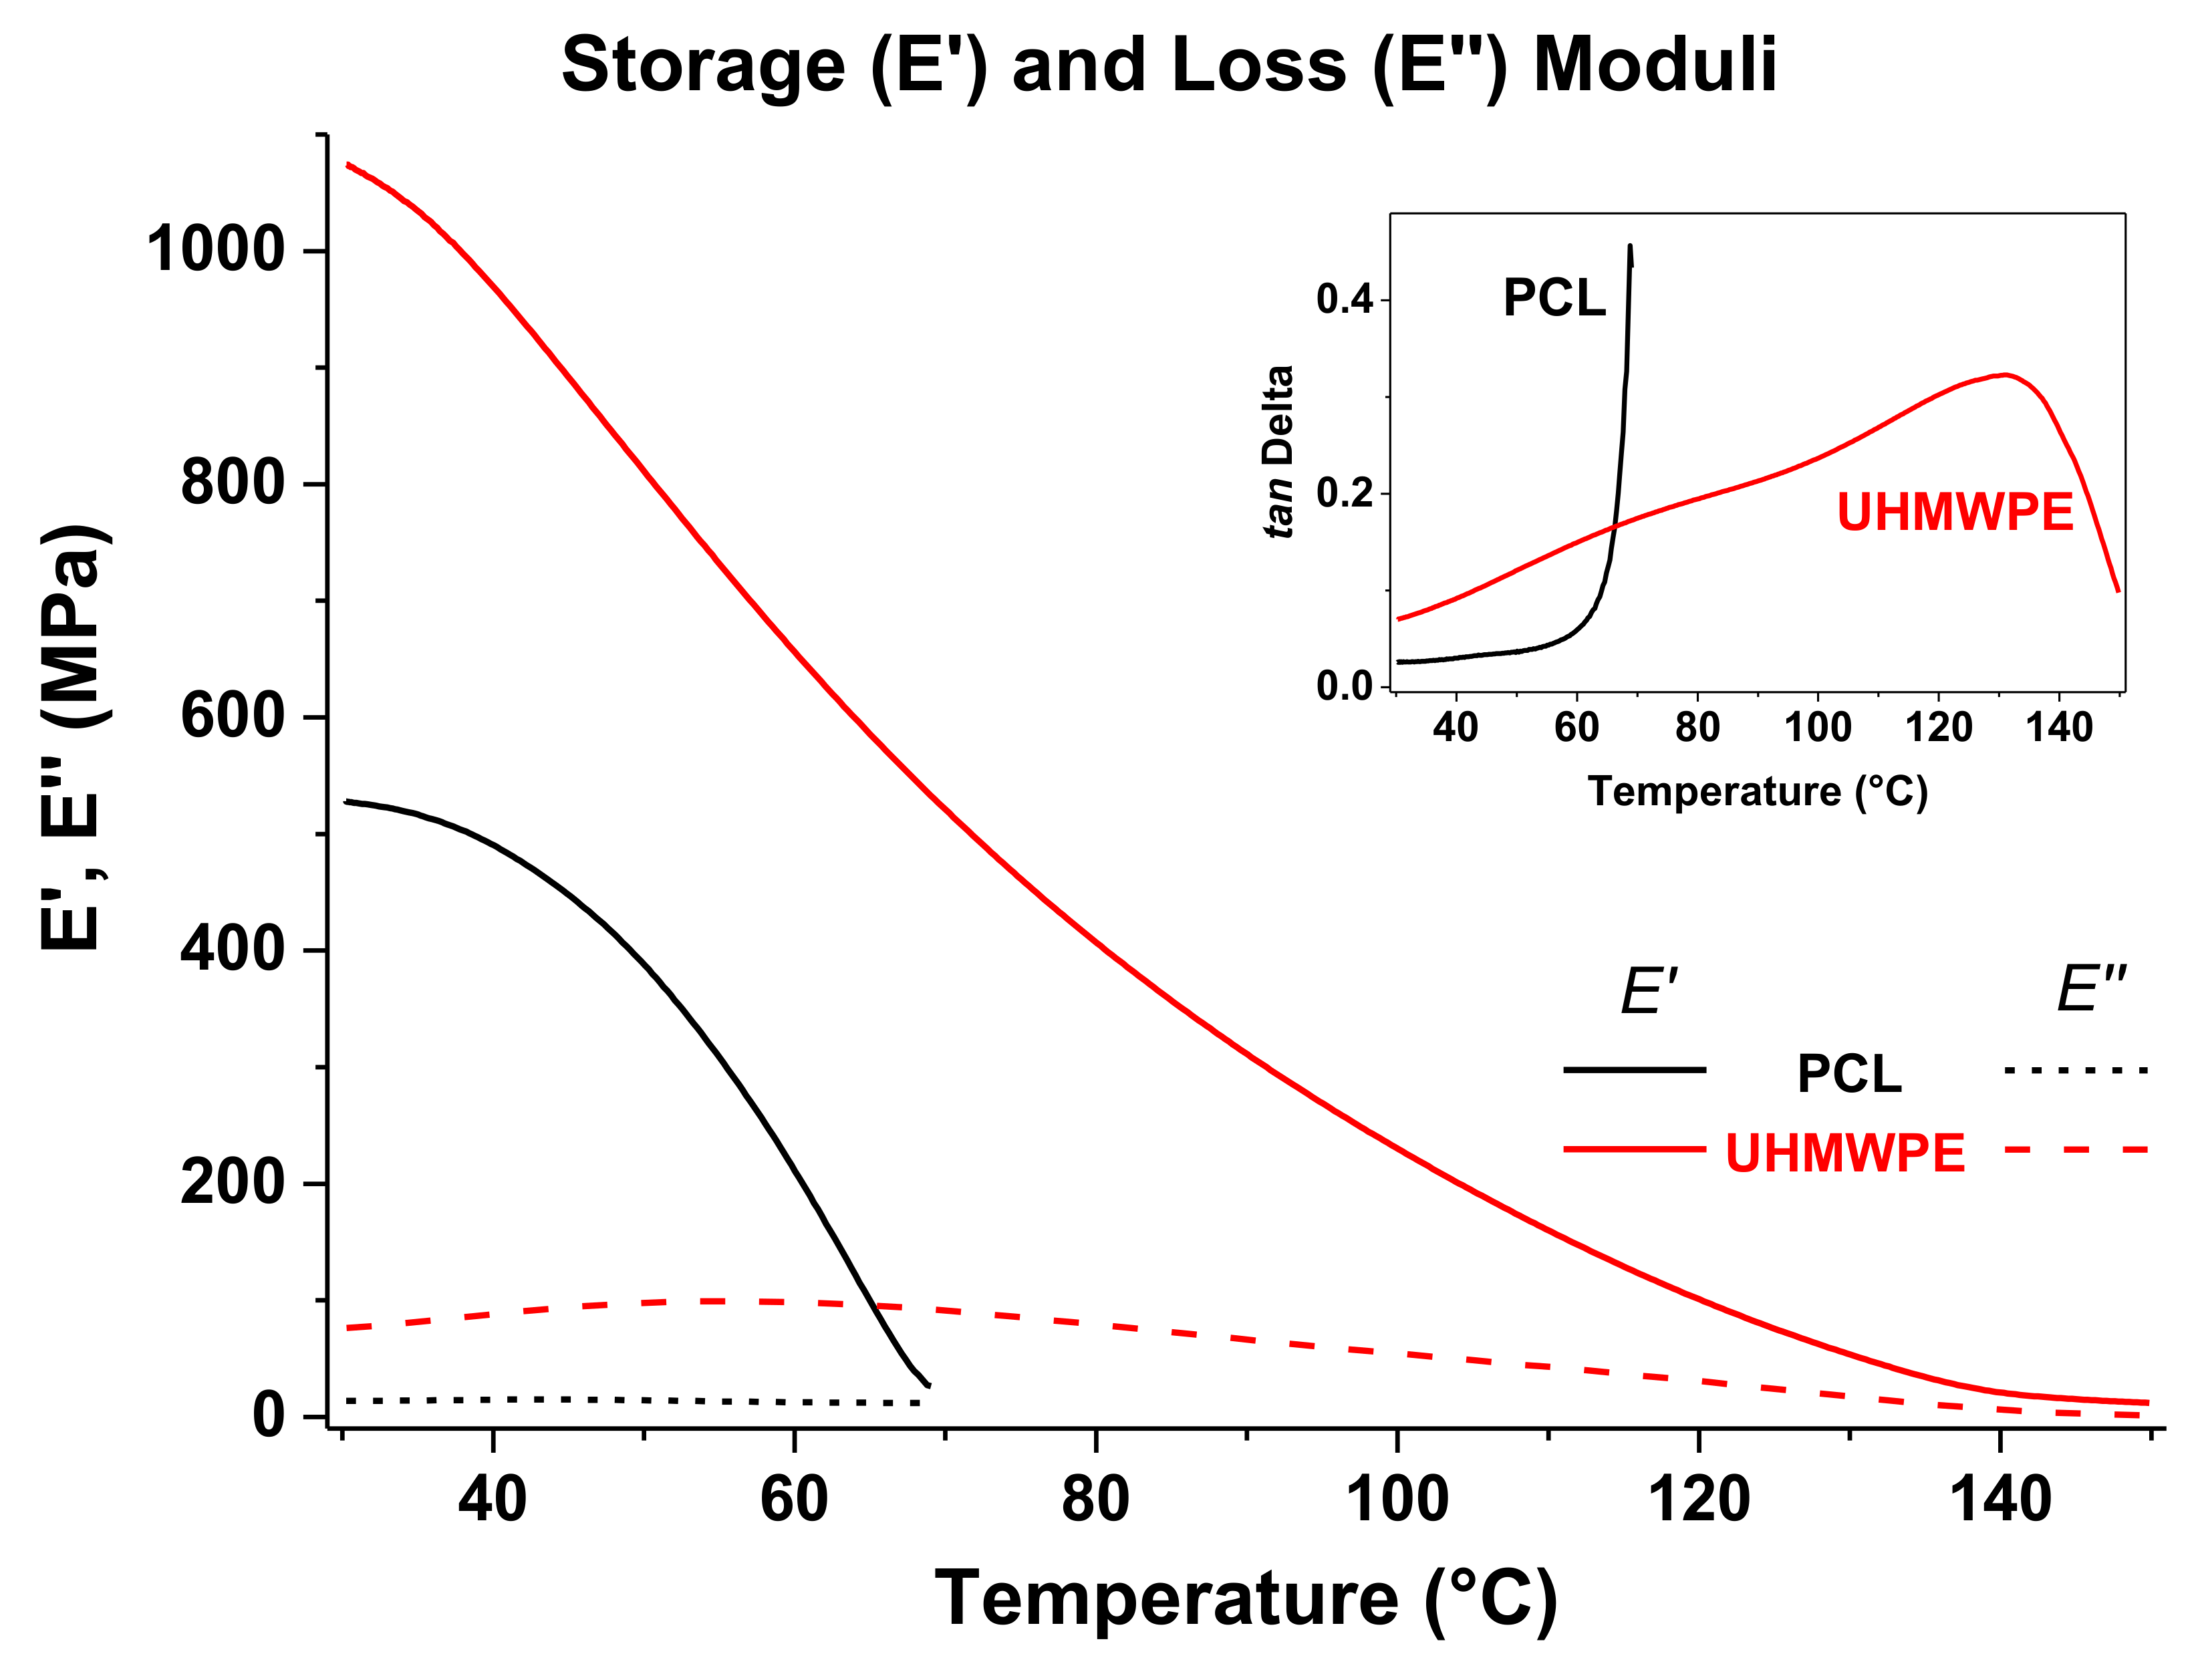
The storage and loss moduli of PCL and UHMWPE have been plotted together in
Figure 7, and the tan δ curves are shown in the inset graph. For both polymers,
E′ reduced gradually as temperature increased, which is typical in thermoplastics and represents that less force is required for deformation; however, it is observed that
E′ of PCL decreases more sharply and UHMWPE displays higher
E’ values meaning a more rigid structure. In other words, based on the DMA results it would be more difficult to plastically deform UHMWPE than PCL. In the inset figure, the tan δ curve of PCL shows a pronounced increase as it approaches the
Tm, unlike the tan δ curve of UHMPE that exhibits a continuing increase throughout the whole temperature sweep. The temperature transitions in UHMWPE, specifically the melting transition, occur more gradually due to the presence of long molecular chains in a manner that before the melt is reached, i.e., where large-scale chain slippage occurs and the material flows, the coiled long chains must be disentangled first.
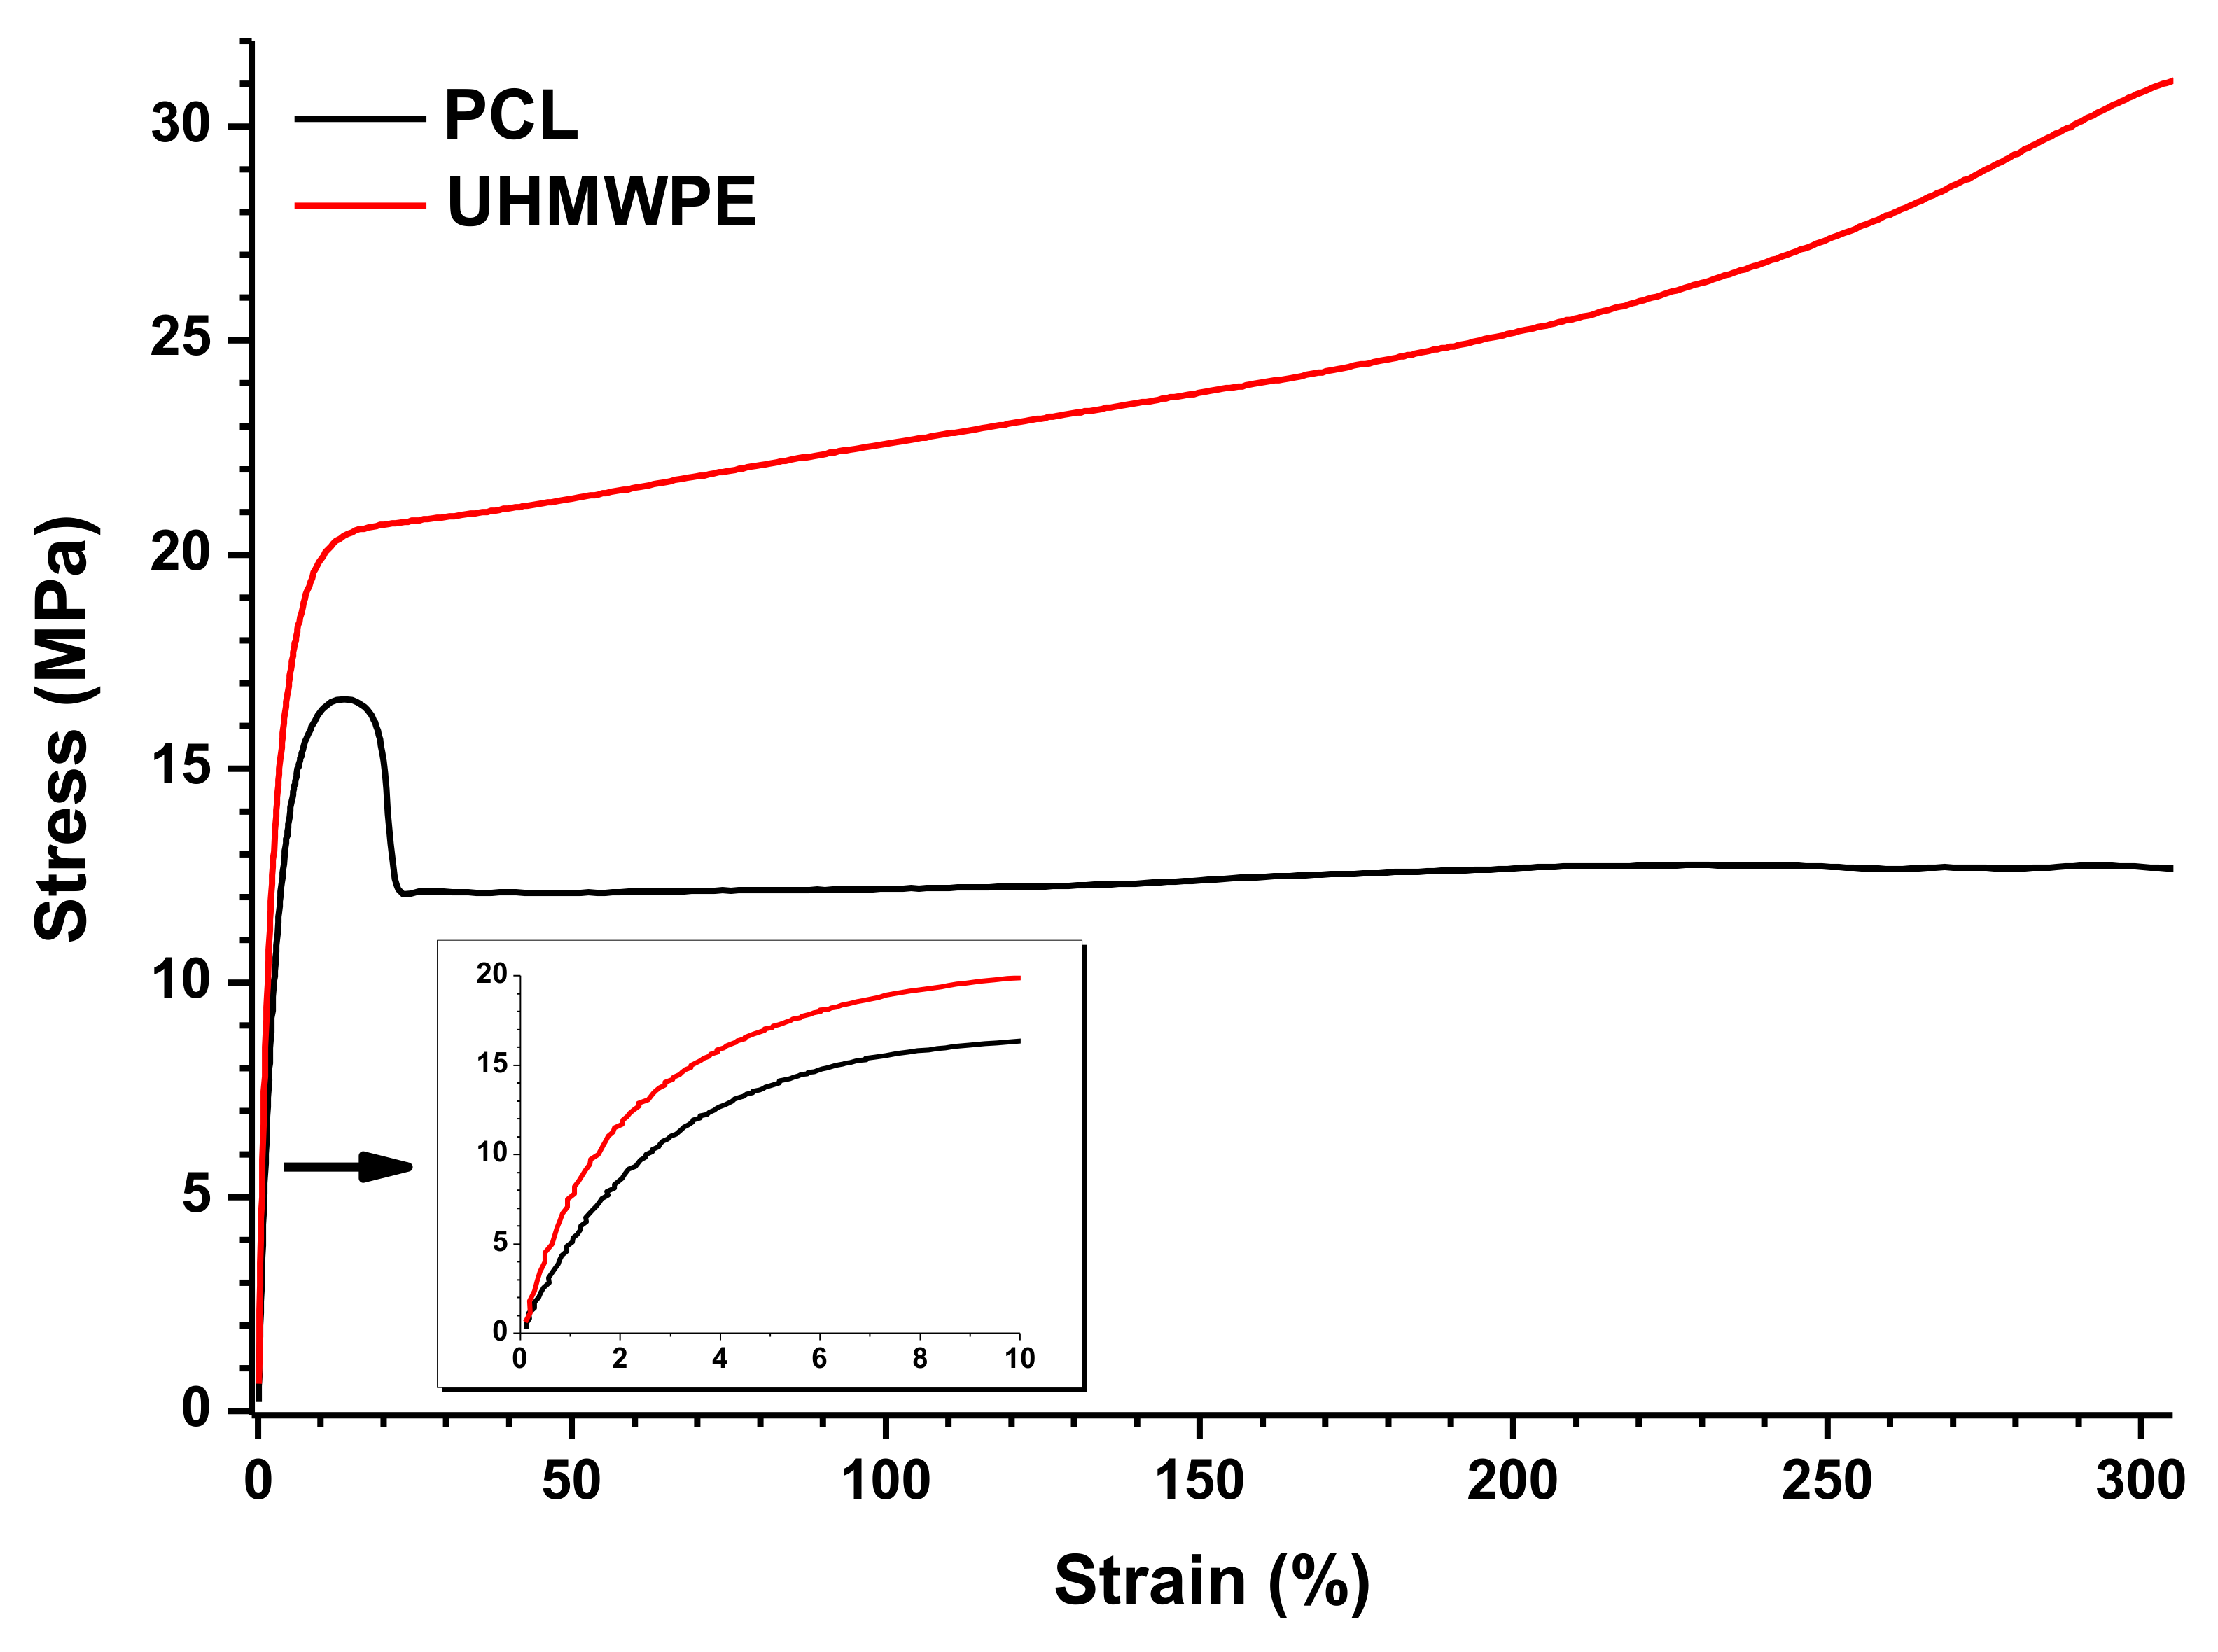
The results from tensile tests of PCL and UHMWPE are graphically shown in
Figure 8. For this, the graph of only one specimen of each material was taken, but it is properly representative of the behavior observed in all the specimens tested. During the tensile test, PCL shows a decrease in strength after the yield point, although it is maintained in a stable value. This behavior is typically observed when the specimen undergoes a necking effect. On the other hand, UHMWPE shows a continuous increase of the supported tensile stress after the yield point, which is clear evidence that a strain hardening effect occurs in the specimen. The inset graph in
Figure 8 represents the initial stage of the stress versus strain curve, where a higher Young’s modulus is observed in UHMWPE indicating a more rigid material as was also observed by DMA. The mechanical properties from the tensile tests are summarized in
Table 4. From these data, it was determined that the ultimate tensile strength of PCL and UHMWPE was 16.4 and 20.2 MPa, respectively. It is worth mentioning that the tensile strength of UHMWPE was taken at a point on the stress versus strain curve near where the plastic deformation begins, so the strain hardening effect is not considered (see
Figure 8). Both materials showed a highly ductile behavior with an average elongation at the end of the test of more than 450% and 340% for PCL and UHMWPE, respectively. Moreover, due to the strain hardening effect observed in UHMWPE, it is clear that it has higher toughness than PCL.
3.2. SPIF of PCL and UHMWPE Sheets
The results obtained from the BB design of experiments were statistically analyzed by means of the response surface methodology; however, a behavior similar to that previously reported by Bagudanch et al. [
26] was found even when the PCL and UHMWPE sheets corresponded to polymers with different properties to those used in this work. So, the detailed analysis of the response surface methodology can be reviewed in detail in [
26]. In the present work, the effect that the parameters considered in the design of experiments have when processing PCL and UHMWPE by SPIF will be briefly analyzed by using box diagrams in order to make a correlation between the behavior shown in the forming process and the properties studied by the different characterization techniques used here.
The maximum formed depth (in percentage), forming force in the
z-axis (
Fz), and maximum temperature reached (
Tmax) in each test done from the BB design of experiments are summarized in
Table 5 for the PCL sheets and in
Table 6 for the UHMWPE sheets. For convenience, the conditions of each test (enlisted previously in
Table 2) have been listed again. The results for PCL (see
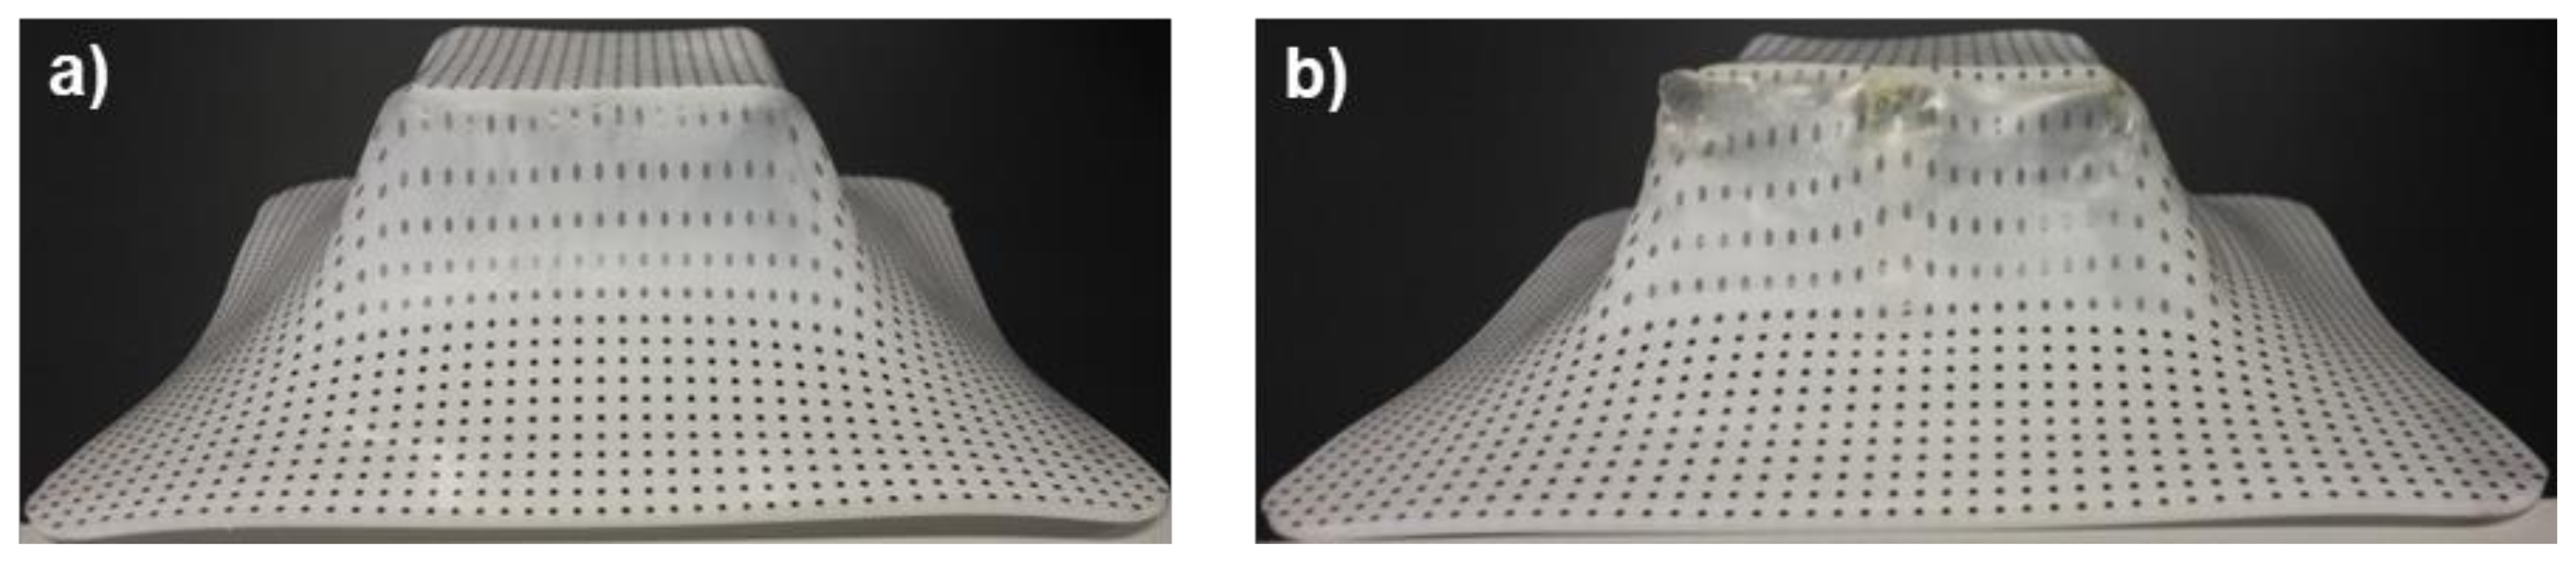
Table 5) show that most of the experiments reached a depth of 100%. The images in
Figure 9 represent sheets of PCL completely formed and with failure. The pyramid-shaped part of
Figure 9b corresponds to the sheet formed under parameters of experiment #15, which failed at a depth of 95%. This experiment is particularly interesting because it registered the maximum temperature (67.52 °C) among all of the tests made with PCL, which caused a very irregular surface as observed on the walls of the pyramid-like part. The temperature reached in this experiment is close to the
Tm of PCL, so that at the end of the SPIF processing, the polymer likely behaved more as a viscous liquid than as a solid.
From the design of experiments, it was found that
Dt and
S are the parameters that mostly affect
Fz and
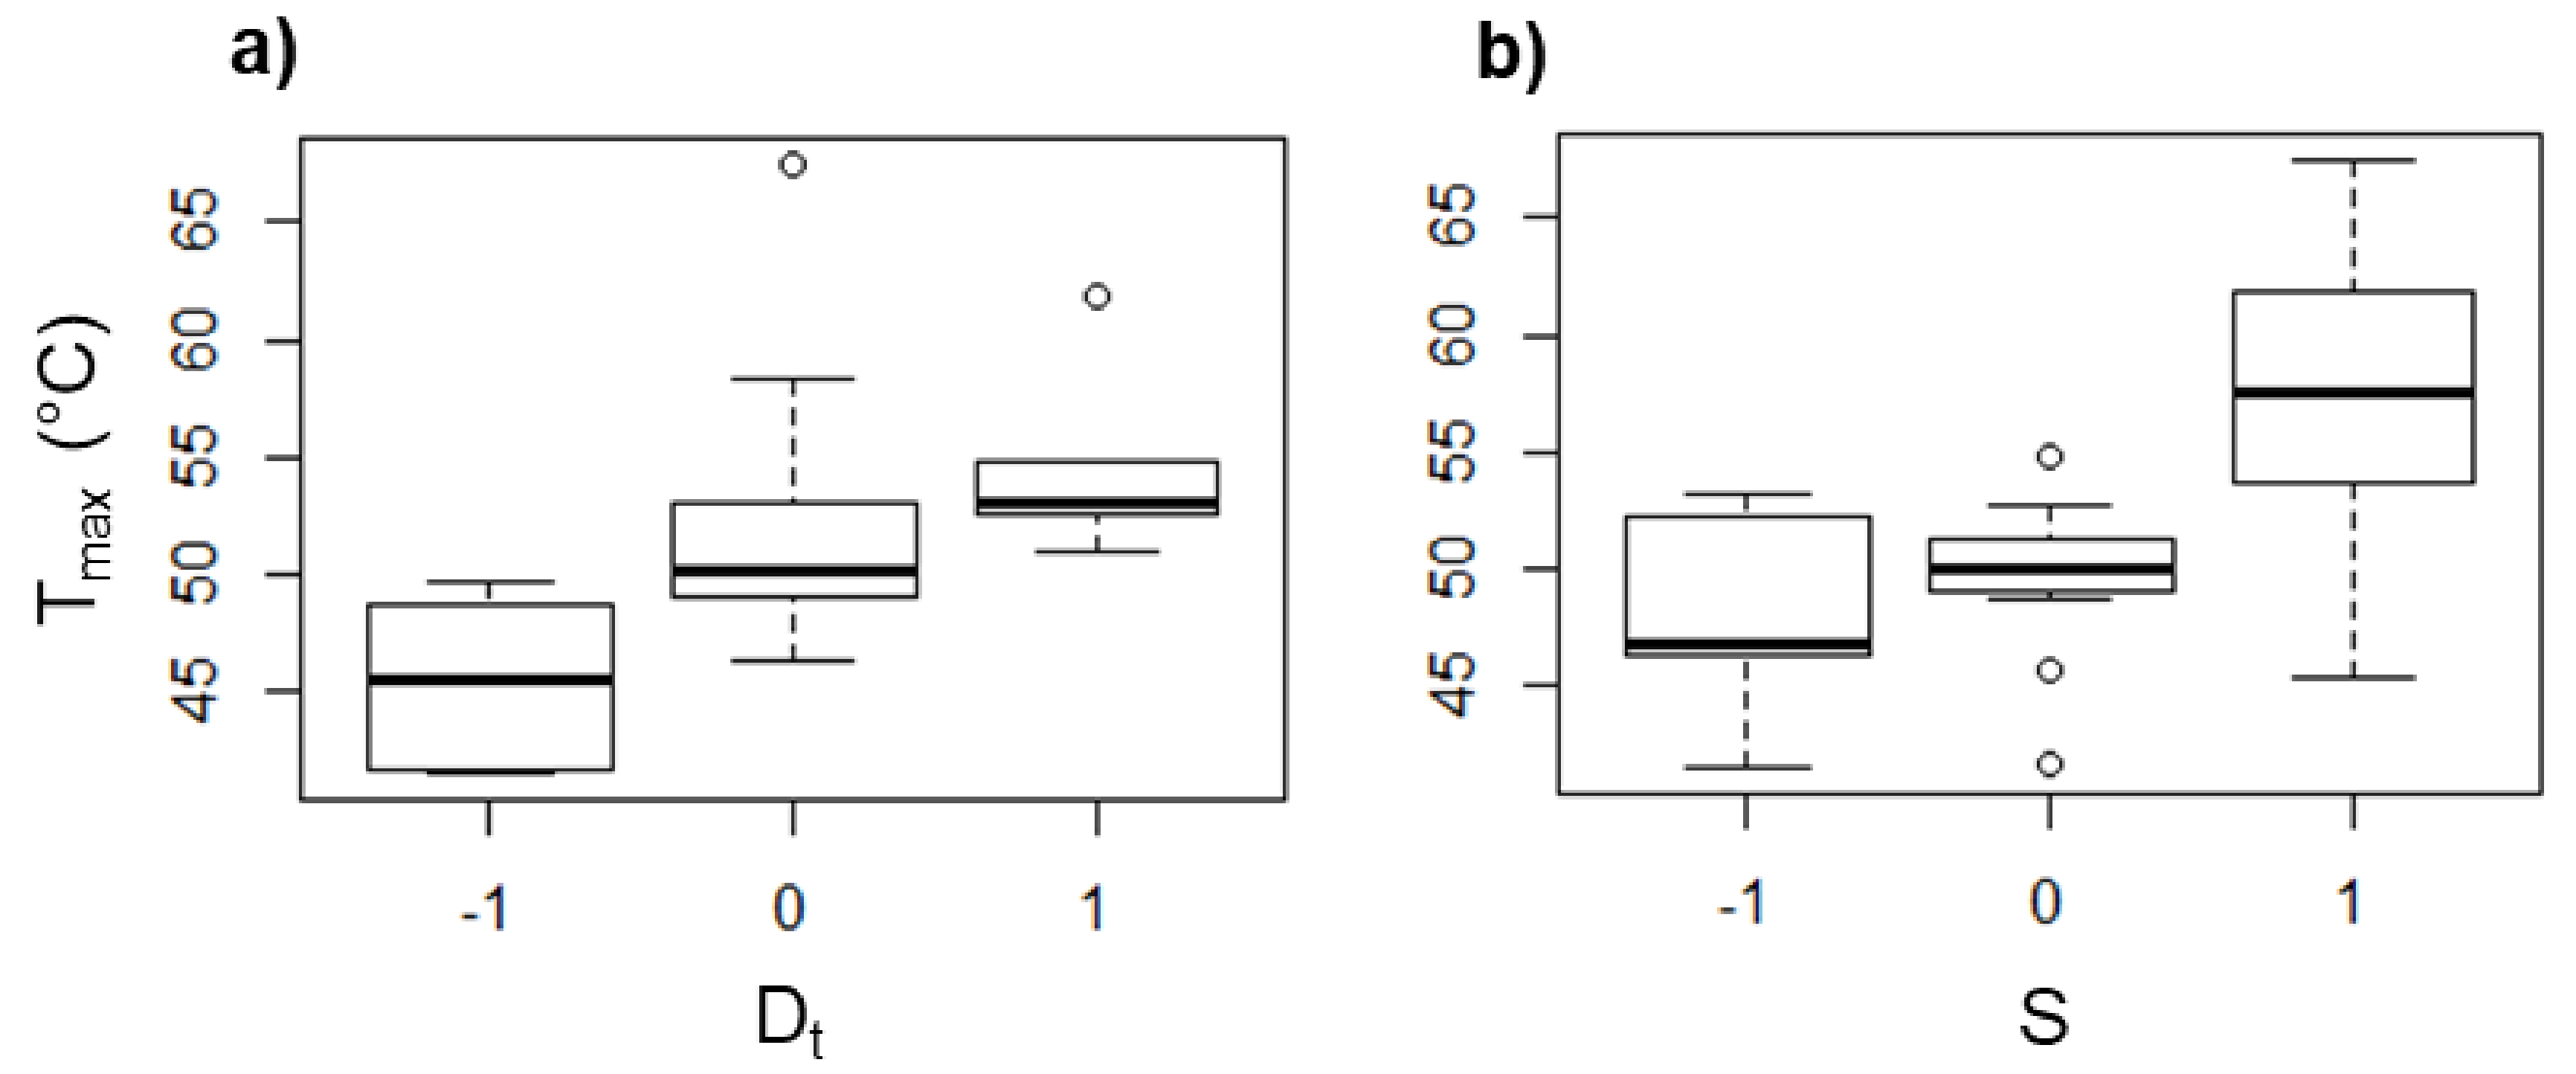
Tmax. The box diagrams displayed in
Figure 10 and
Figure 11 show the tendency of
Tmax and
Fz, respectively, in PCL as an effect of
Dt and
S. The effect of the feed speed and the step size (data not shown) was found to be negligible for
Tmax and
Fz. It is noticed that
Tmax increases as
Dt is increased (see
Figure 10a). When a forming tool of larger diameter is used, the area in contact with the polymer sheet increases, generating a greater friction between both surfaces and consequently a higher temperature. A similar behavior associated with the friction occurs when
S is varied (see
Figure 10b), since there is more friction between surfaces when the tool rotates faster, i.e., the temperature increases when
S is increased. In fact, it has been reported that the spindle speed has the most important role in the temperature variation in the SPIF of polymers [
13].
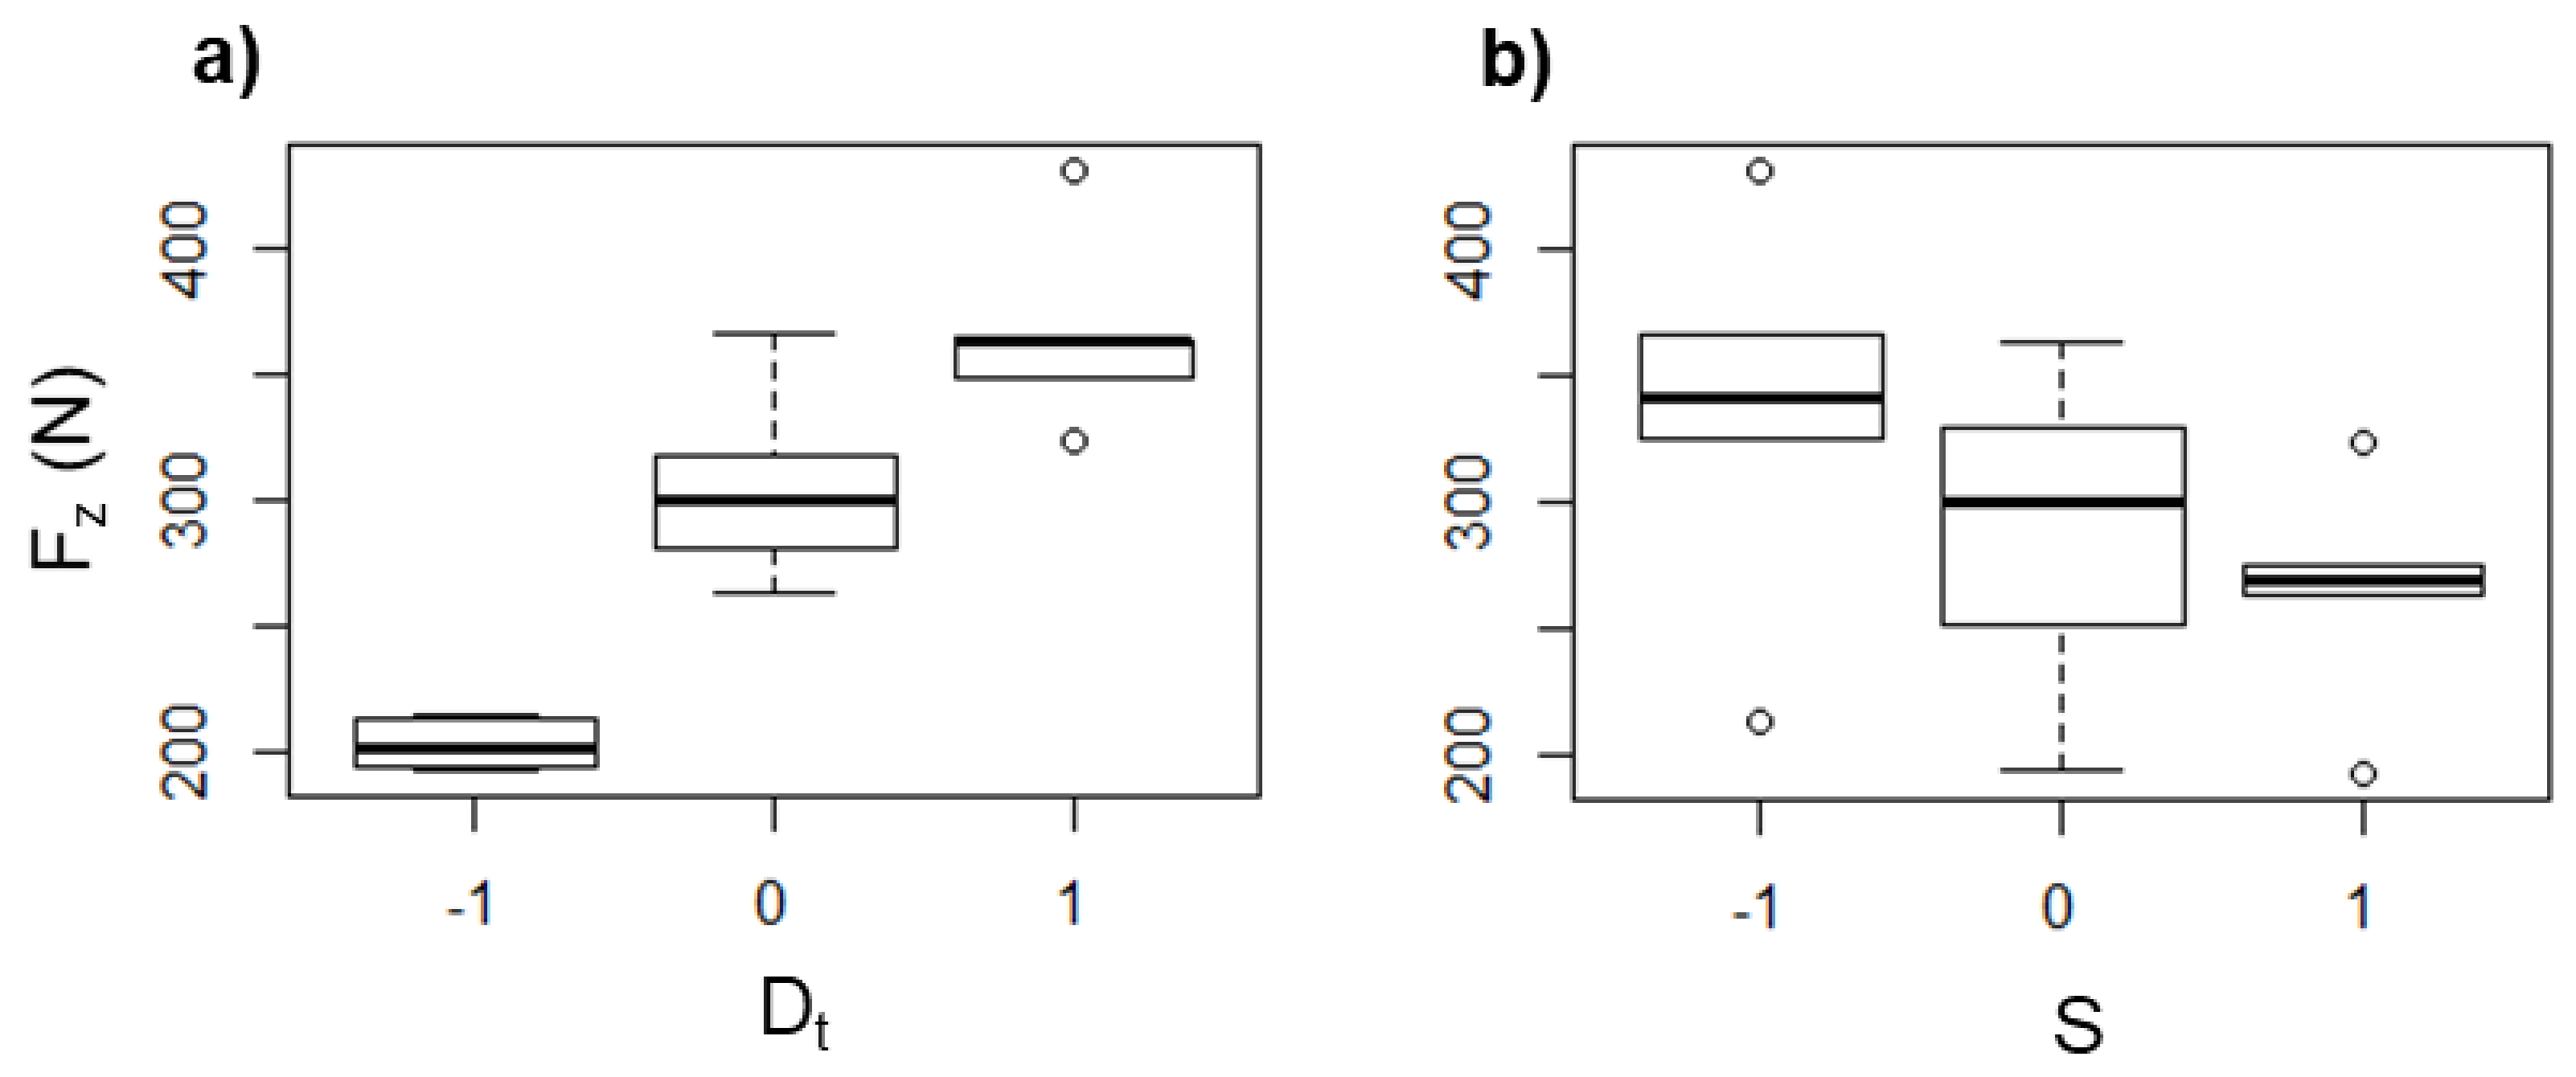
On the other hand,
Fz increased with larger
Dt (see
Figure 11a). This could be a result of the higher contact area between the forming tool and the polymer sheet, and with this, there is a greater amount of material that must be pushed down. Meanwhile, the force is reduced as
S is increased (see
Figure 11b), which can be directly associated with the softening of the polymer as a consequence of the temperature increase due to the friction between the tool and the polymer sheet as was mentioned before. In general, when the temperature is increased, the forming force is reduced because the polymer undergoes a softening.
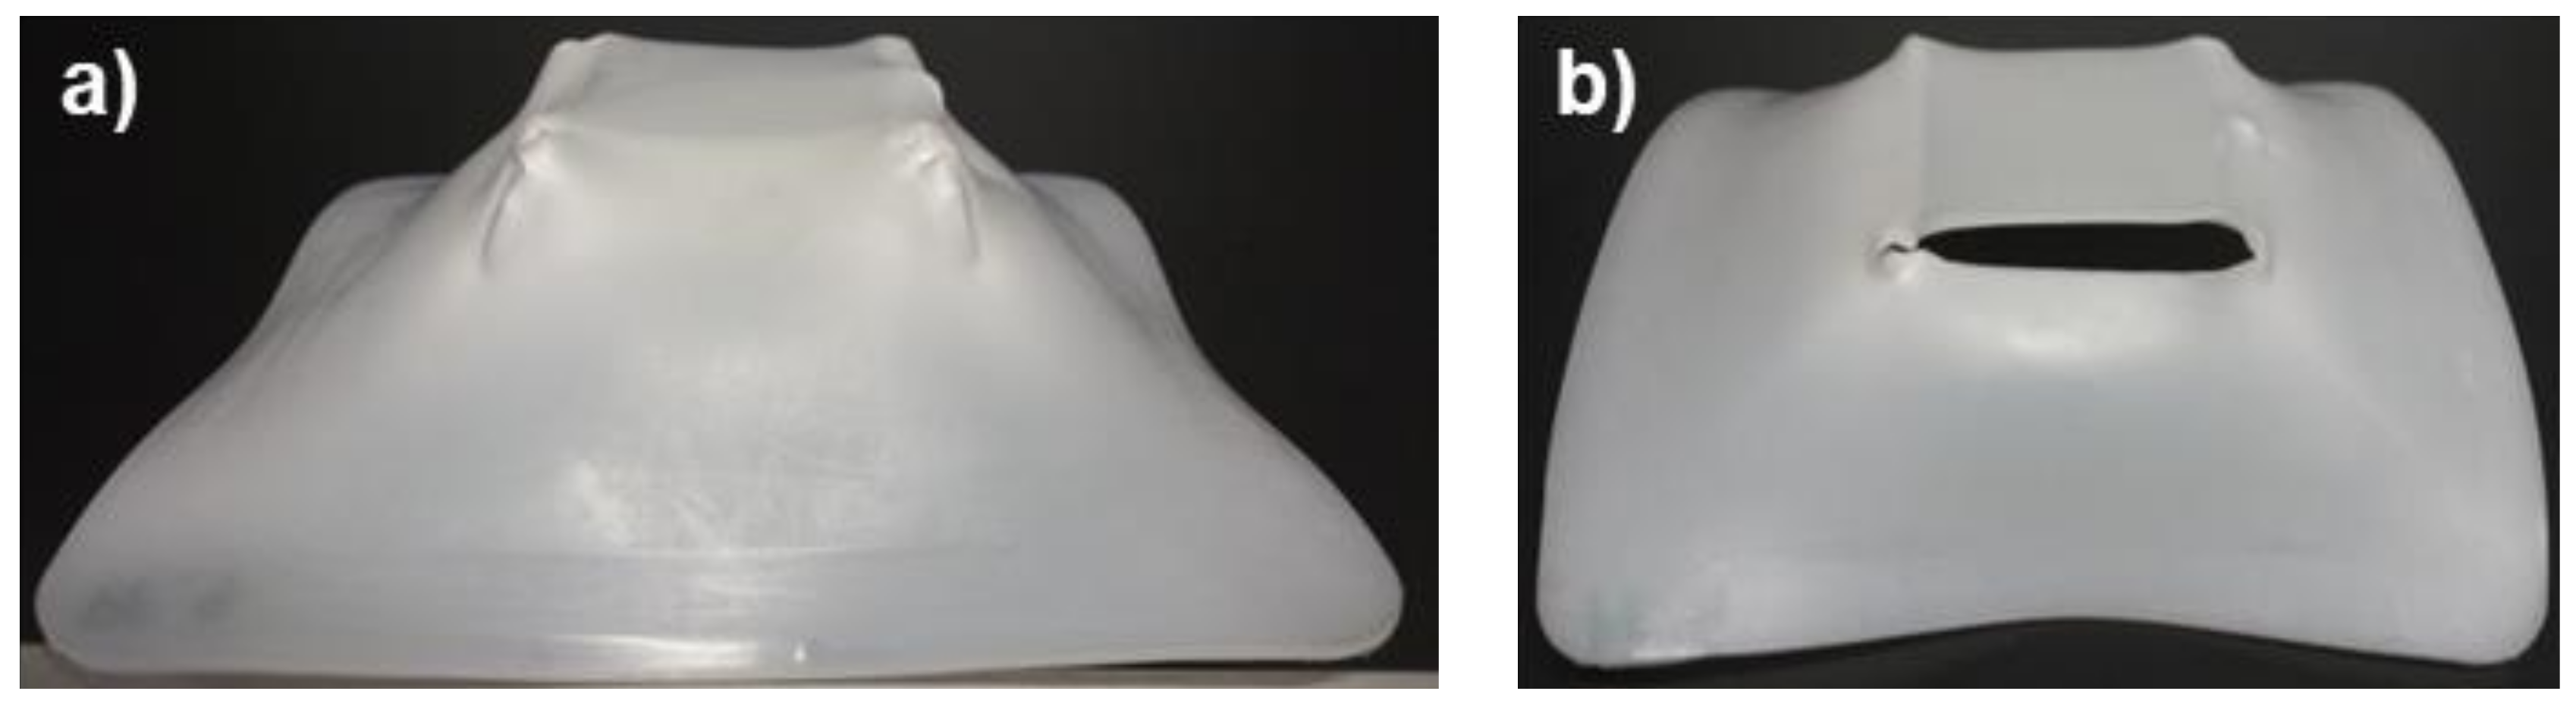
For the case of UHMWPE,
Table 6 shows that most of the sheets tested in SPIF formed to 100% of the final geometry; however, more sheets fractured compared to PCL.
Figure 12 shows a pyramid-like part completely formed and and another with failure. At first sight, it is observed that the geometric precision of the pyramids is low since the shape of the manufactured parts has a curvature in the walls that is very different from that originally designed by the toolpath.
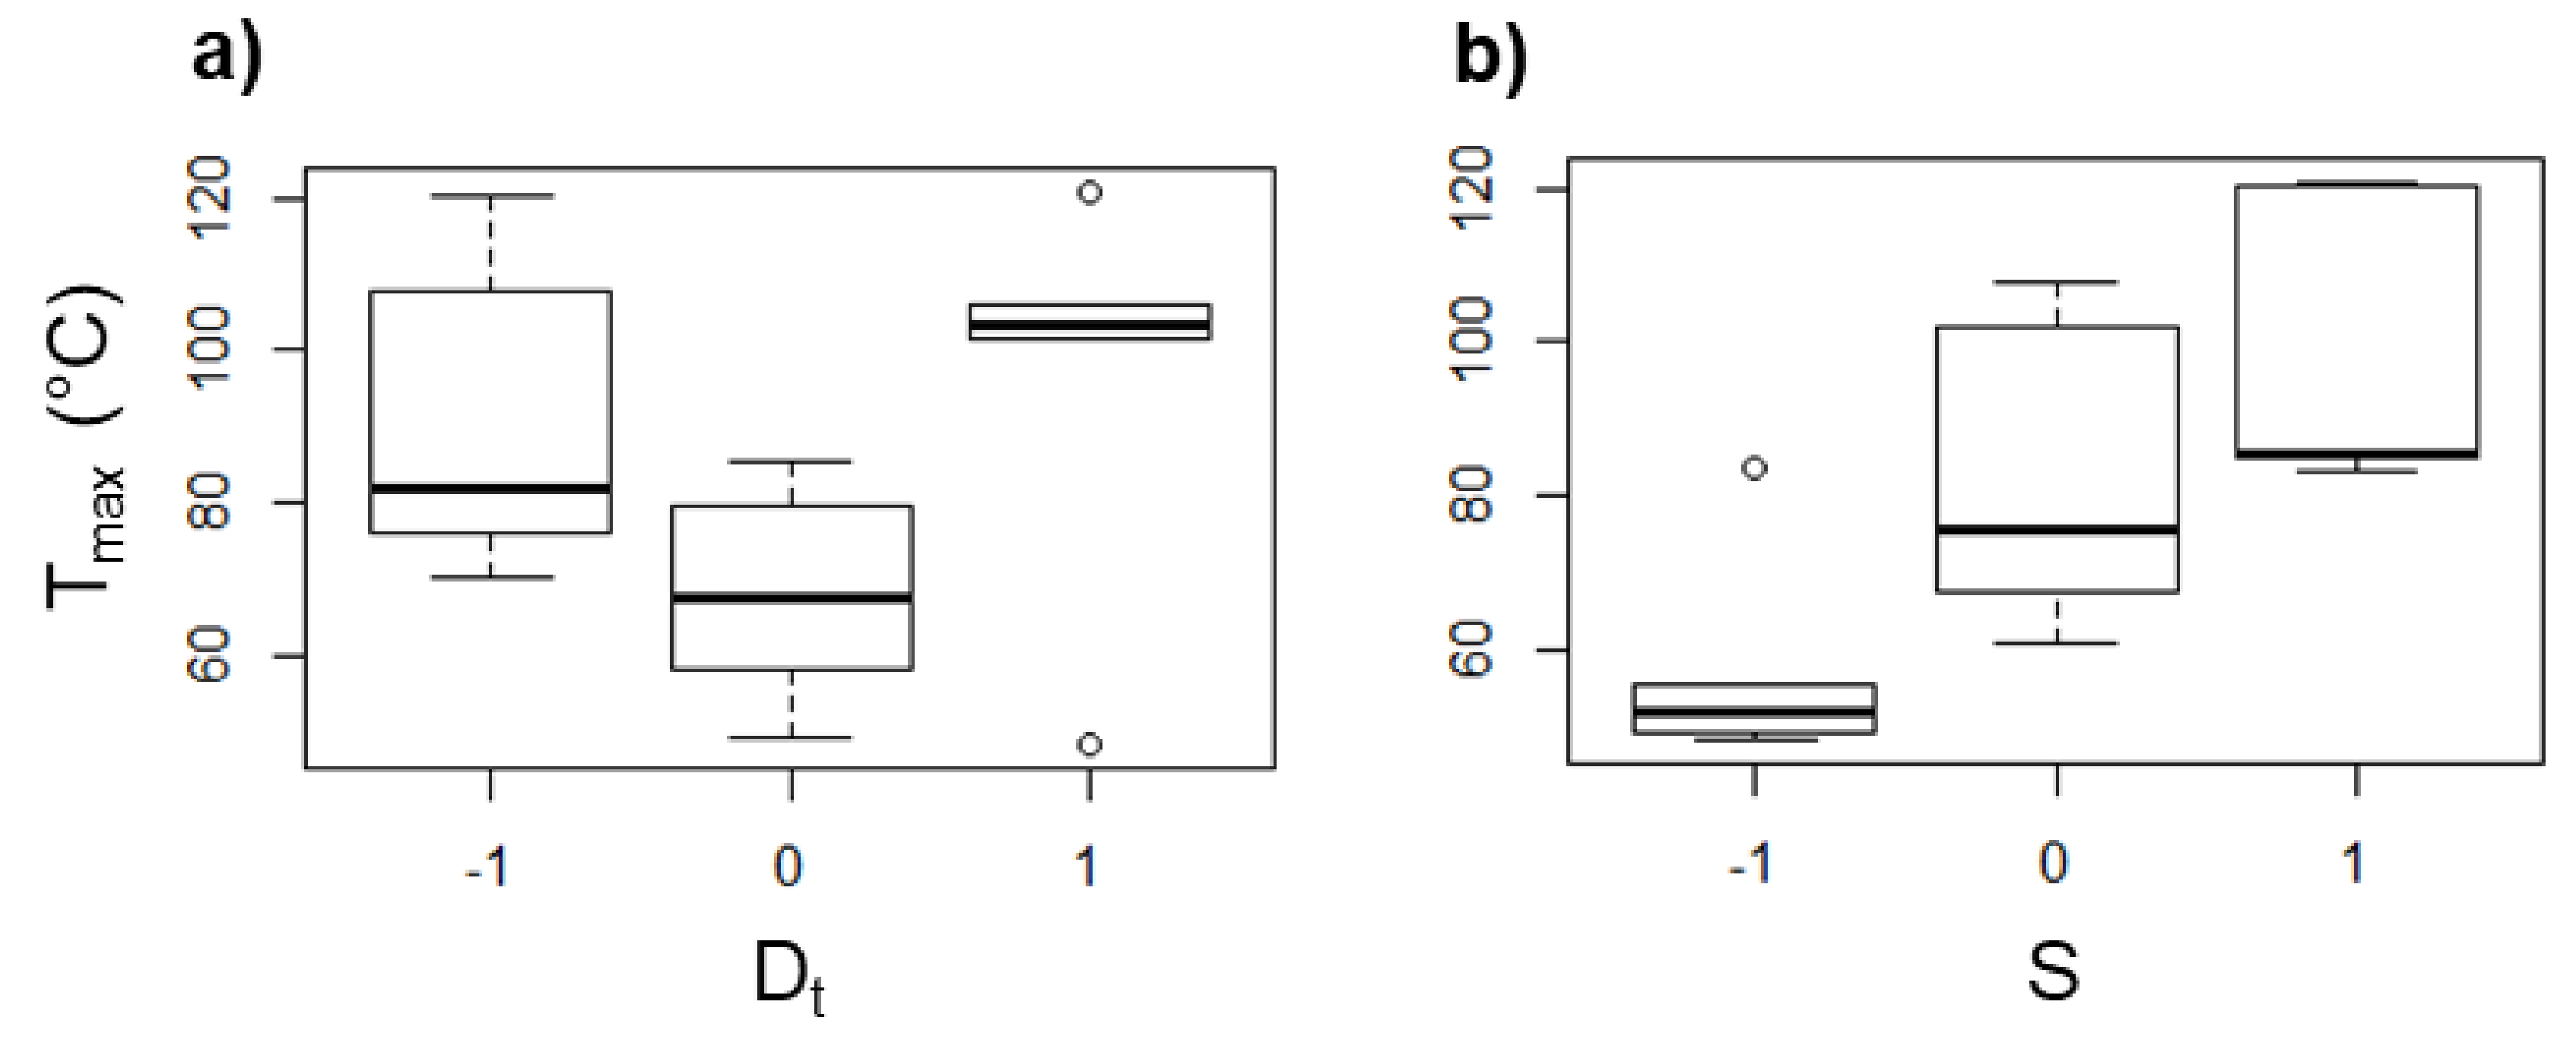
An increase of
S leads to a remarkable rise of the heat generated due to the tool–sheet friction as determined from the values of
Tmax measured with rotation of the tool. In this regard, in some experiments with UHMWPE sheets,
Tmax values of up to 120 °C were reached with
S = 2000 rpm, while for some experiments without rotation, the
Tmax registered was below 50 °C. In general, the values of
Tmax measured for the UHMWPE sheets show more variation than that observed in the experiments with PCL, as it can be seen in the box diagrams of
Figure 13, and additionally, there is not a clear tendency of
Tmax as a function of
Dt (see
Figure 13a), so it could be stated that the long chains of UHMWPE can generate a random behavior during the SPIF processing. Nonetheless, it can be still concluded that
Tmax increases as
S increases (
Figure 13b), which reaffirms that, regardless of the molecular structure of the polymer,
S is the parameter in SPIF that most influences the temperature reached in the sheet.
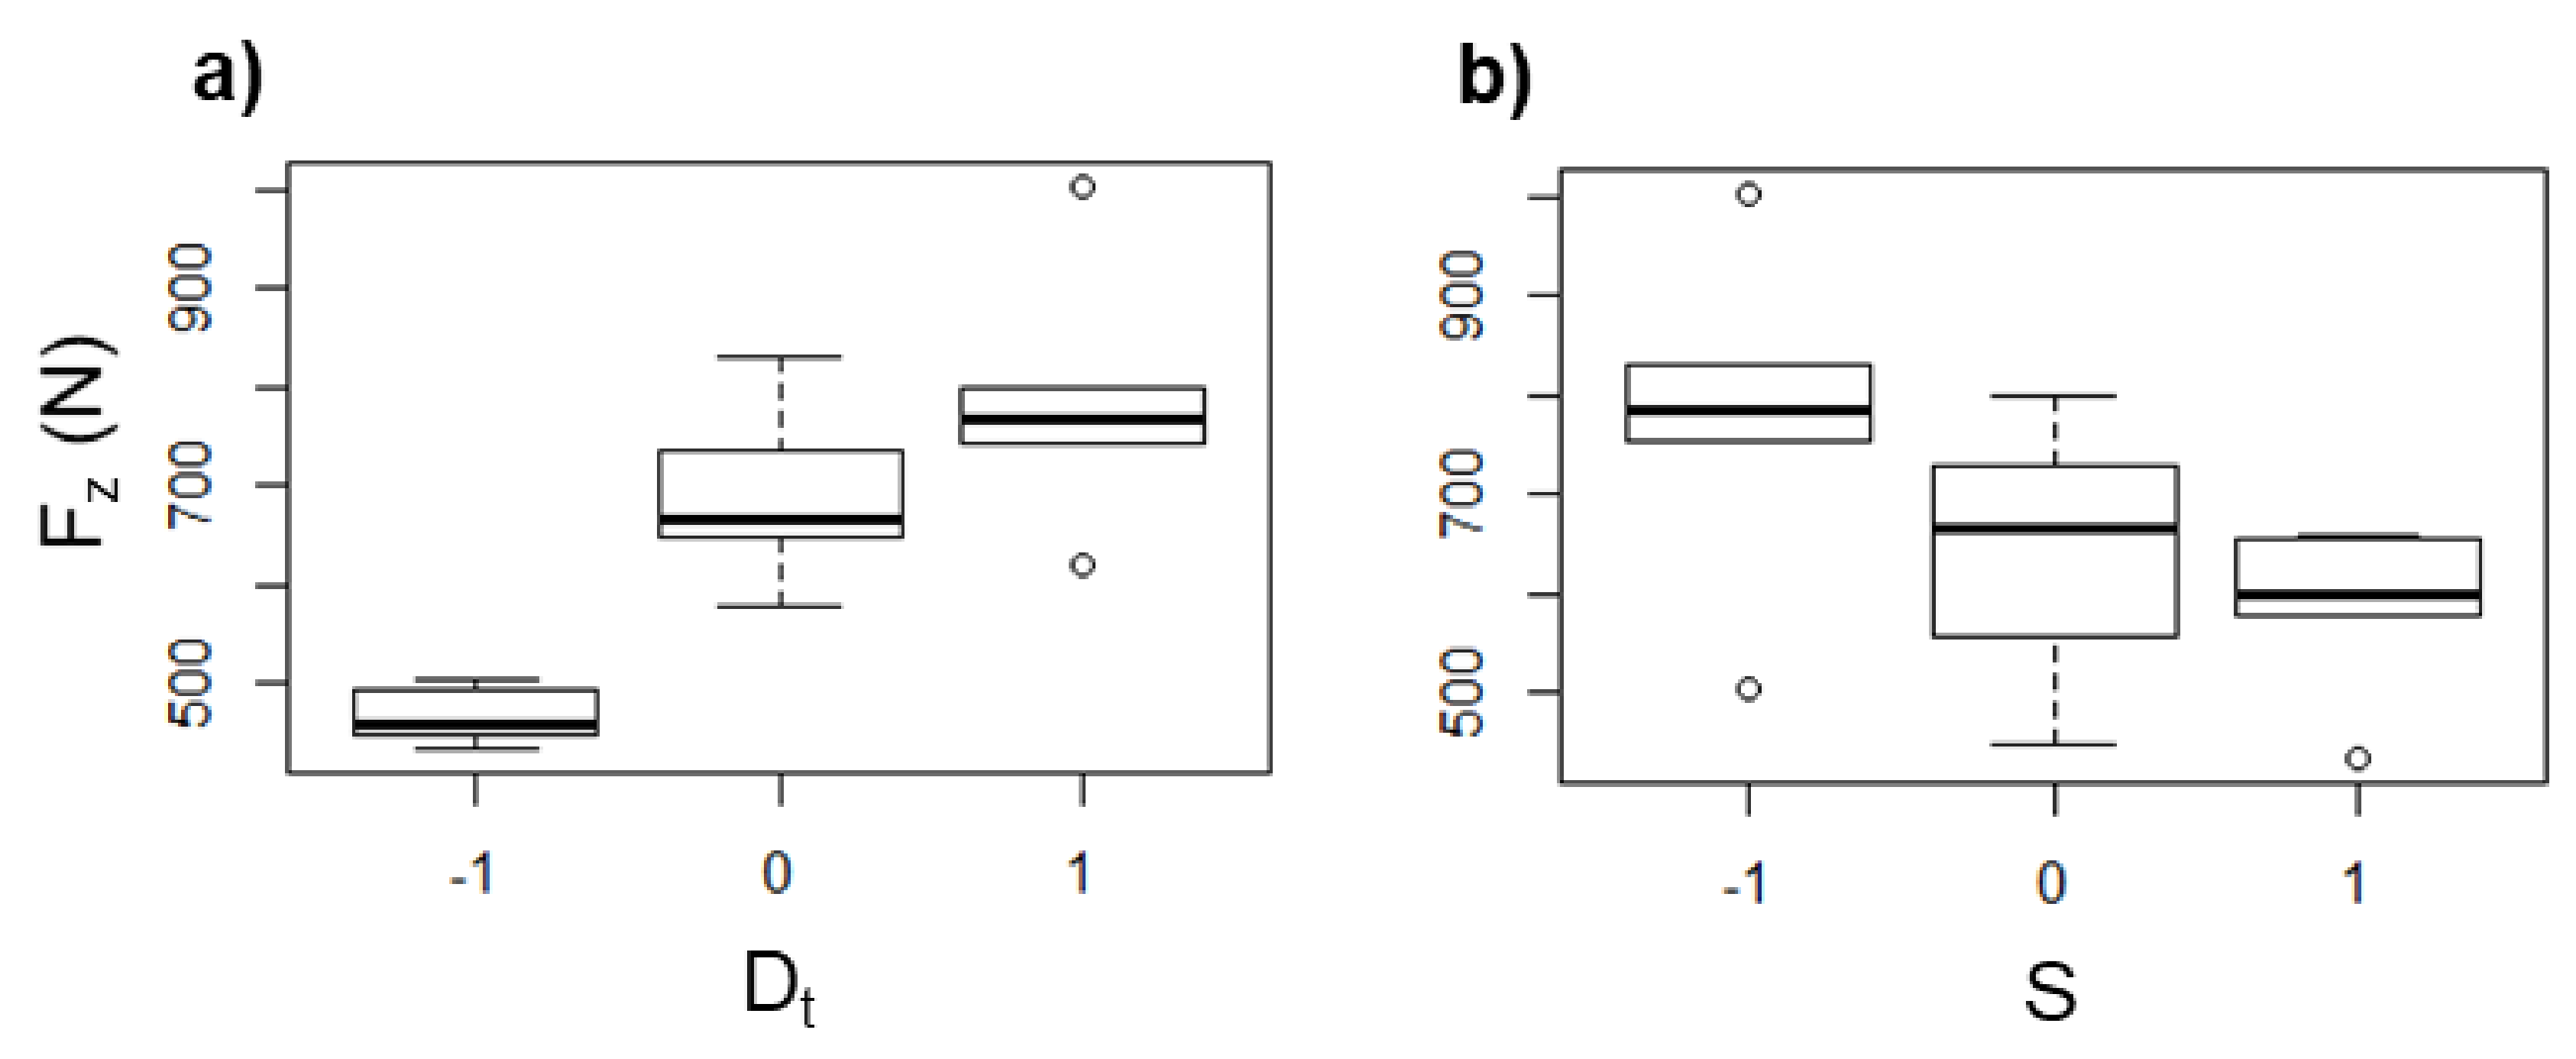
The
Fz in UHMWPE shows the same tendency previously observed in PCL as a function of
Dt and
S, i.e.,
Fz increases as
Dt increases (
Figure 14a) and decreases as
S increases (
Figure 14b), which is attributed to the same as discussed earlier for the case of PCL, i.e., a greater
Dt represents a greater amount of material pushed down, and so the
Fz is higher, while a higher
S generates more heat due the friction between the tool and the sheet, which in turn softens the polymer, and consequently
Fz is reduced.
3.3. Characterization by XRD after the SPIF Processing
Pyramid-shaped parts of PCL and UHMWPE formed by SPIF were analyzed by XRD in order to assess the molecular chain orientation as a result of the SPIF processing. In a previous work, Lozano-Sánchez et al. [
15] observed by small- and wide-angle X-ray scattering (SWAXS) the orientation of Polypropylene chains in the vertical direction of cone-shaped parts as a result of SPIF processing. Nonetheless, it should be pointed out that the SWAXS analysis is completed through-thickness of the sample. Here, XRD was used to separately analyze the inner and outer surfaces of the wall of the pyramid-shaped parts based on the fact that compressive and tensile stresses are exerted on each side of sheets formed by SPIF as was previously concluded by Jiménez et al. [
16]. Due to the large amount of samples formed from the design of experiments, the XRD analysis was completed in the pyramid-like parts obtained from only four different experiments: 9, 10, 11, and 12, which vary
Dt and ∆
z from the lowest value to the highest (
Dt = 6, 14 mm; ∆
z = 0.2, 0.5 mm), and the spindle speed and feed rate remained unchanged and in the middle value (see
Table 2). Only variations of
Dt and ∆
z were considered since these parameters directly influence the shaping of the polymer in the vertical direction, i.e., the direction of descent of the forming tool, during SPIF processing.
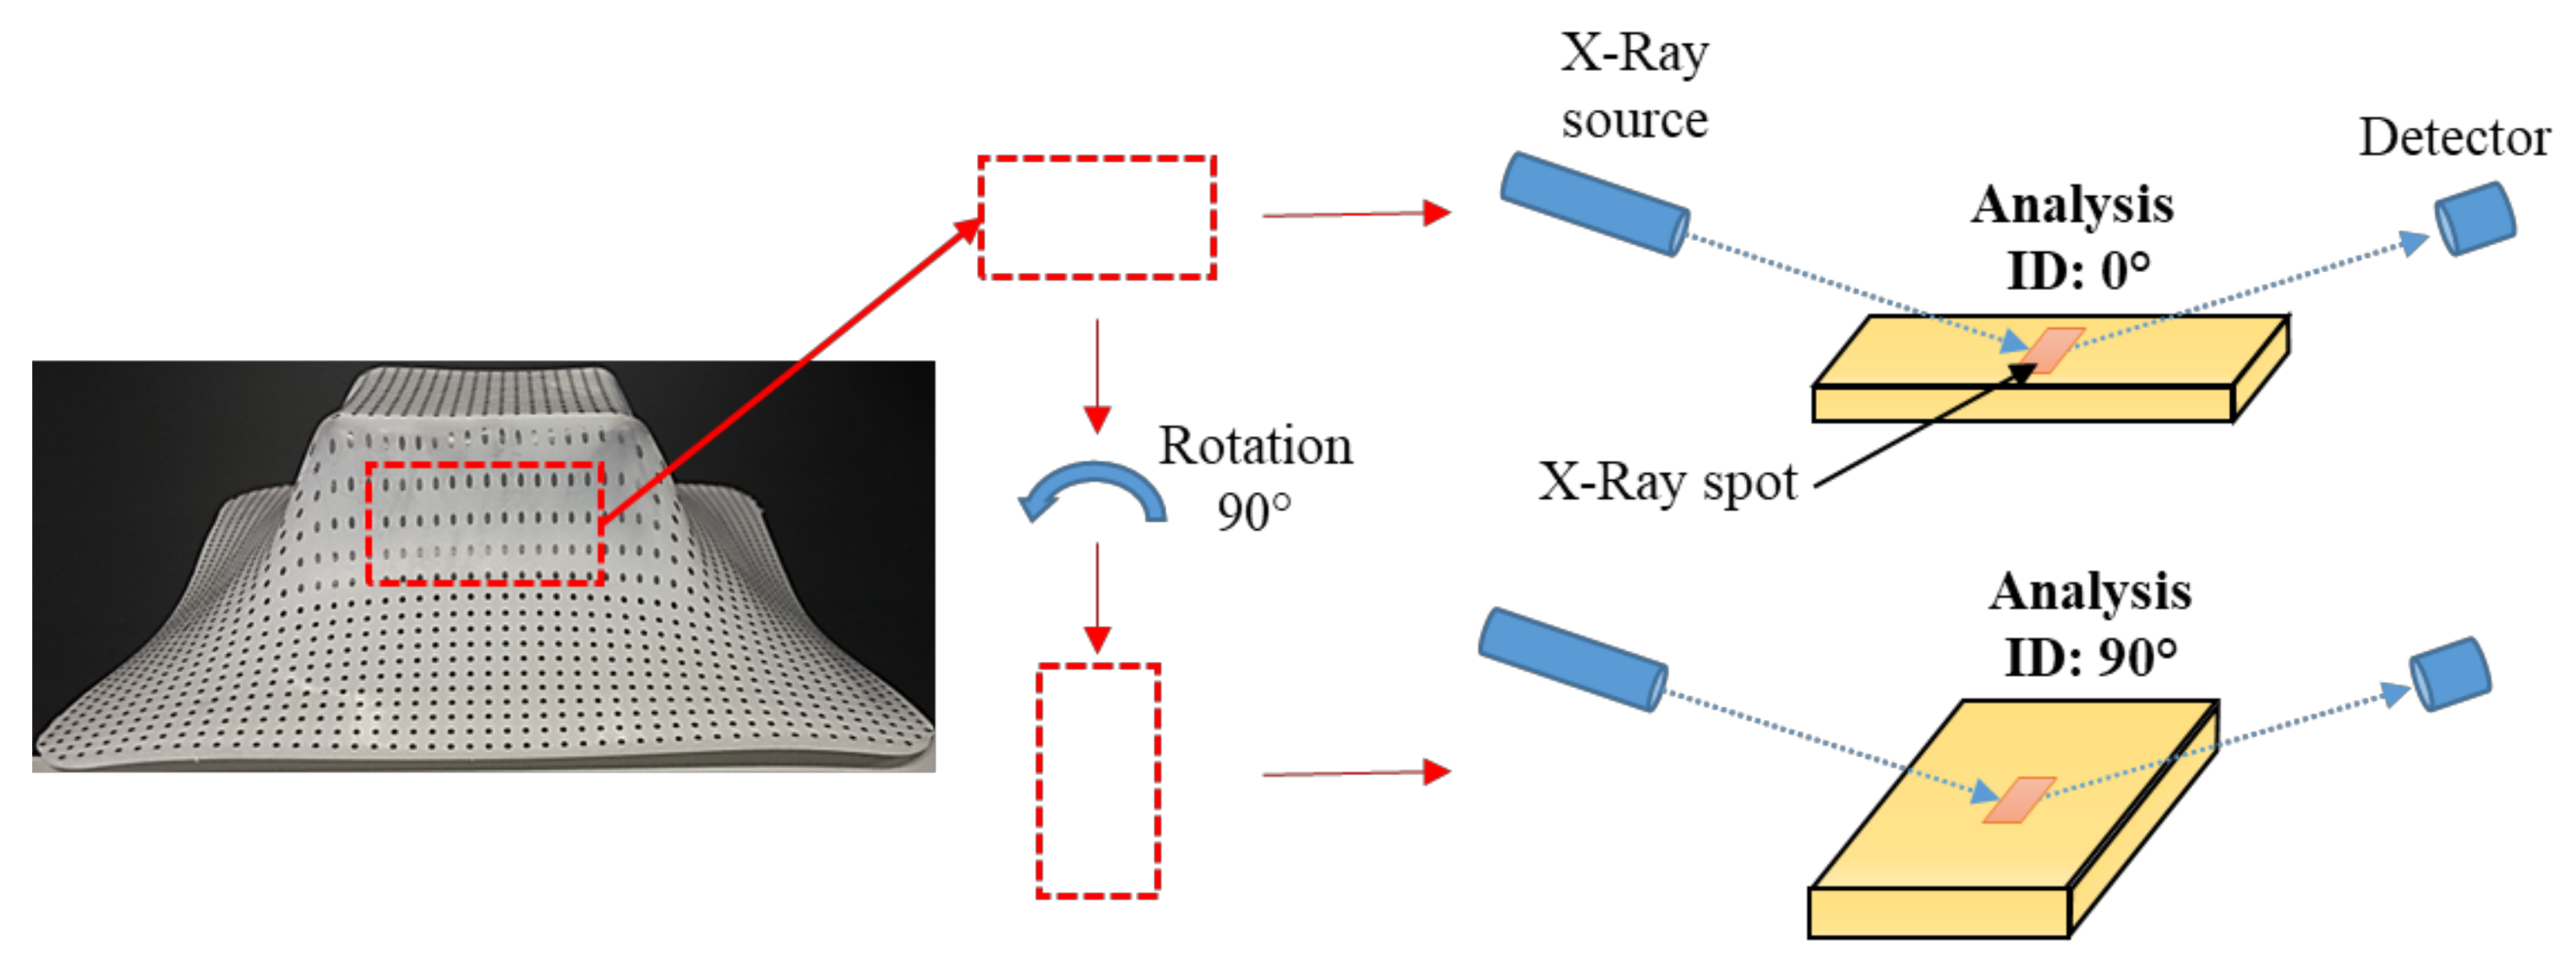
For the XRD analysis, a rectangular sample was taken from the wall of the pyramid-shaped parts. All of the samples analyzed correspond to the side opposite to the descent side of the forming tool. The samples were first analyzed in one direction with respect to the X-ray incident beam, and then a second analysis was completed after rotating the sample 90° as is schematically illustrated in
Figure 15. This rotation of the samples was done in order to detect differences in the intensity of the diffraction peaks associated with the crystallographic planes of the polymer unit cell, mainly the {hk0} plane groups, that is, those that are parallel to the
c-axis. If the molecular chains of the polymer are preferably oriented in one direction, a greater intensity could be seen in the diffraction peaks since the planes would also be elongated in the longitudinal axis of the oriented polymer chains, i.e., along the
c-axis. Here, it should be emphasized that
x,
y,
z coordinates are used as reference directions in the pyramid-shaped parts, where
z corresponds to the vertical direction or the direction of descent of the forming tool, being
x and
y the directions of the horizontal plane, while the
a,
b,
c coordinates are used as reference directions for the crystal unit cell for both PCL and UHMWPE crystalline structures.
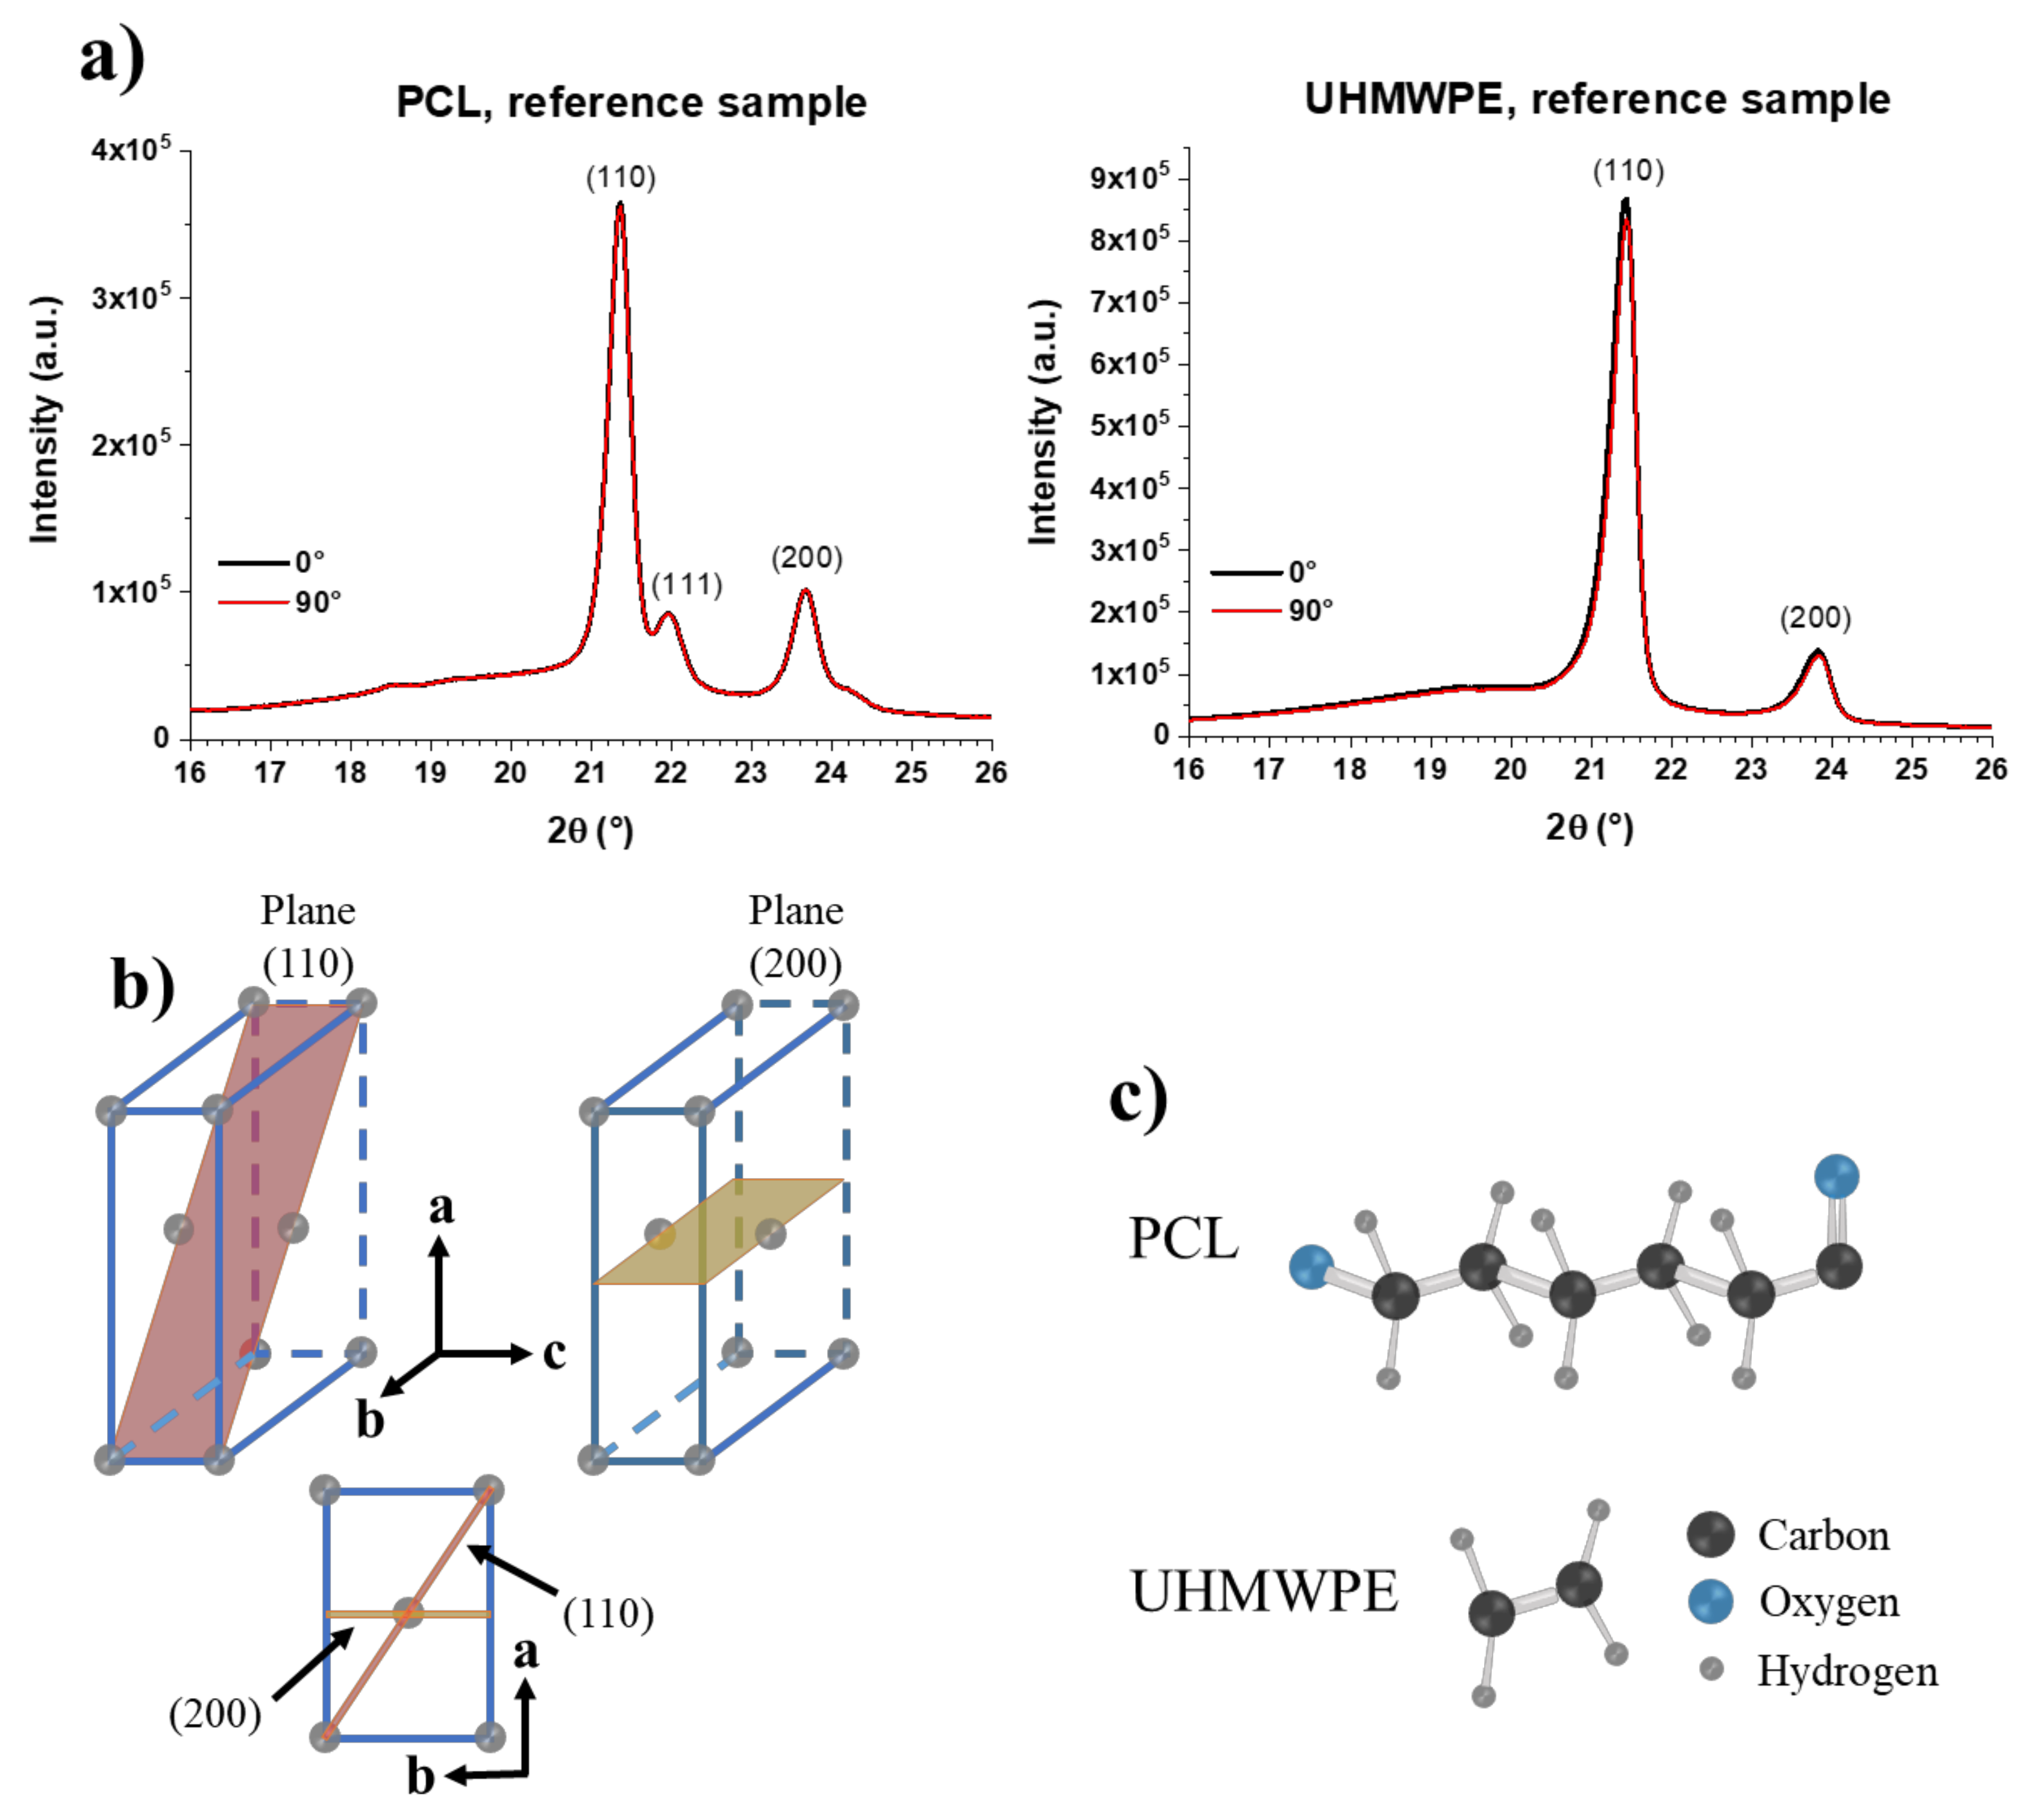
First, the XRD patterns of the PCL and UHMWPE reference samples, i.e., unformed sheets, are shown in
Figure 16a. These samples were analyzed in only one side considering that they are unformed, so the existence of inner and outer surfaces does not apply. In fact, it is expected that there is no difference in the order of the molecular chains on both sides of the unformed sheets. The XRD patterns show peaks of the diffraction planes (110) and (200) of the orthorhombic unit cell in around 21.4° and 23.7°, respectively, for both PCL and UHMWPE. The pattern of PCL shows a small peak at 22° associated with planes (111), which are also of the orthorhombic unit cell [
28]. From these XRD patterns, it is concluded that both polymers have a semi-crystalline structure, evidenced by the well-defined, high-intensity peaks observed, which correspond to the crystalline part, and to the wide, low-intensity signal that can be seen at 2θ angles below 21°, which corresponds to the amorphous part. As was expected, the XRD patterns of the unformed sheets of PCL and UHMWPE show no difference between the measurements made at 0° and 90°, indicating that there is no chain orientation in these samples. The diffraction planes (110) and (200) of an orthorhombic unit cell are schematically represented in
Figure 16b. It should be noted that the polymer chains extend along the
c-axis. The structures of the repeat unit of PCL and UHMWPE are shown in
Figure 16c. A repeat unit corresponds to each of the gray spheres that make up the orthorhombic cell shown in
Figure 16b.
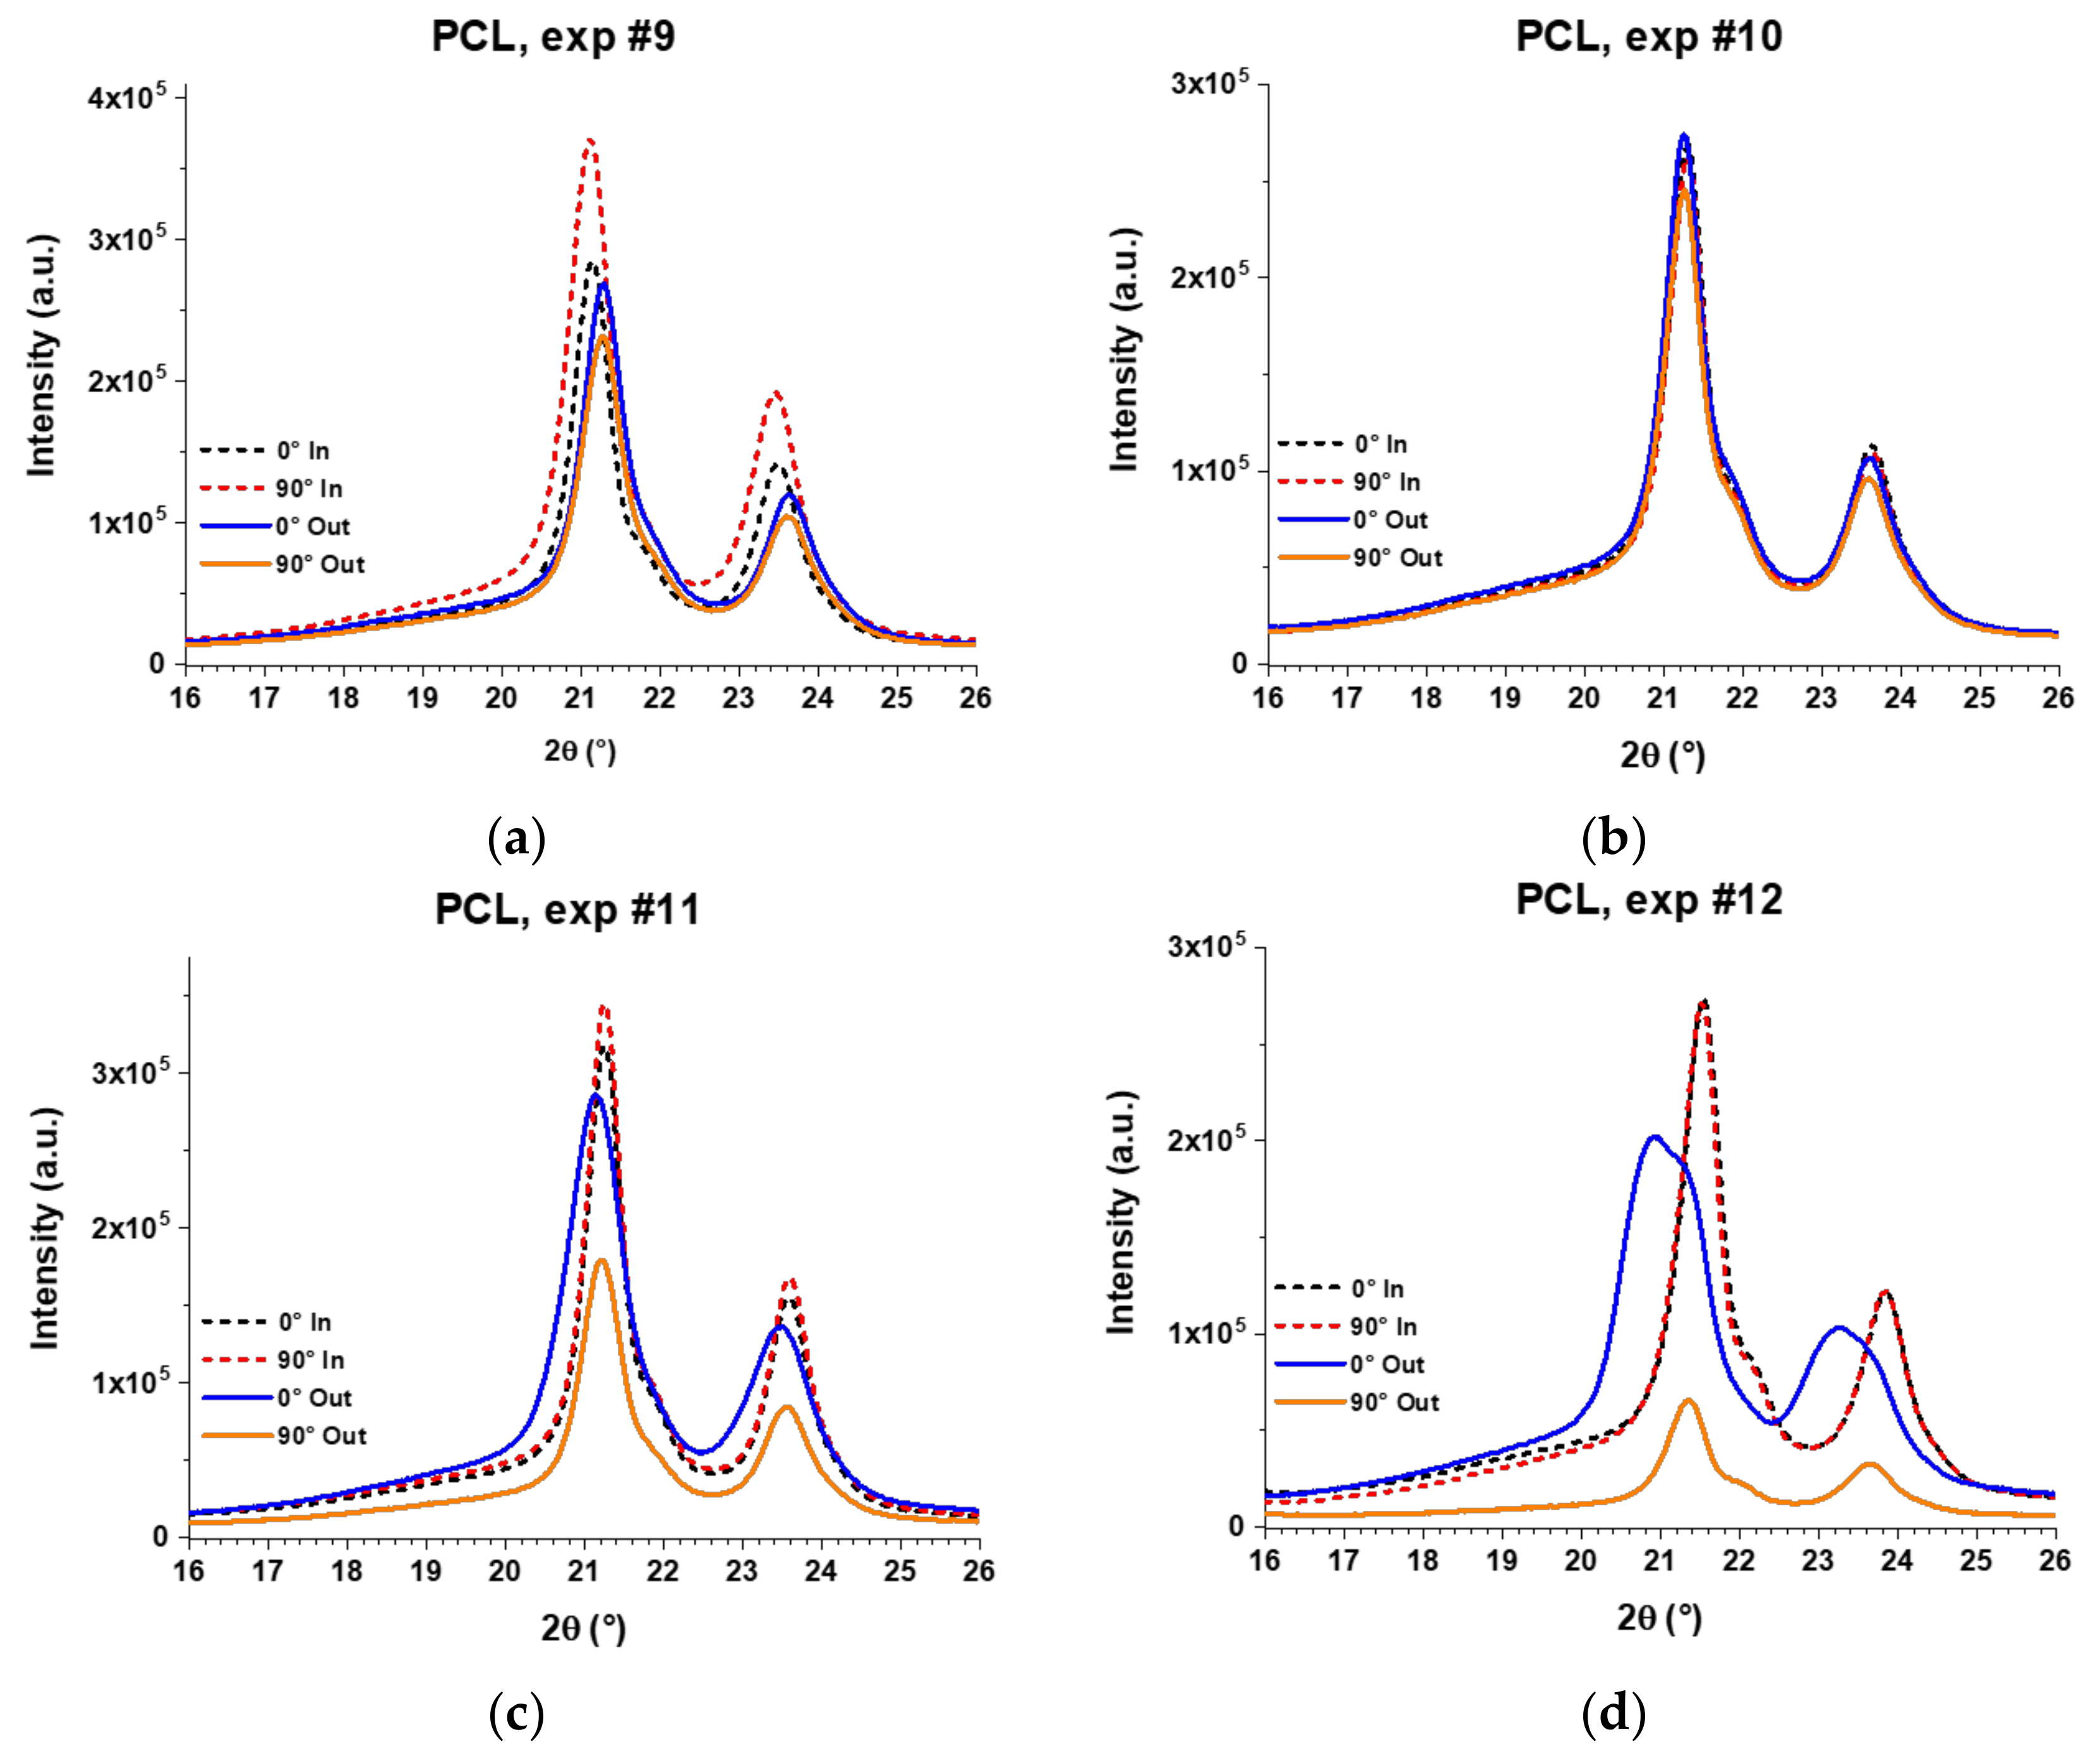
The XRD patterns of the PCL final parts fabricated through the experiments 9, 10, 11, and 12 are shown in
Figure 17. The dotted lines correspond to the measurements made on the inner surface and the solid lines to those made on the outer surface of the wall of the pyramid-shaped parts. The XRD patterns of formed parts still show the peaks of (110) and (200) planes at around 21.4° and 23.7°, respectively. However, the peak attributed to the (111) plane is rather observed as an overlapped shoulder with the (110) peak, which evidenced a reduced crystallinity in the formed samples compared to the unformed sheet (i.e., reference PCL, see
Figure 16a). In fact, some peaks show a clear broadening that also proves a reduction in crystallinity. In addition, it is possible to observe a clear shift of the diffraction peaks in the XRD patterns of the PCL formed sheets, which is due to the inherent curvature in the final parts resulting from the forming process. For a structural comparison between the analyzed samples, this shift will be dismissed and attention will be paid only to the maximum intensities and width of the peaks.
Furthermore, the XRD patterns in
Figure 17 demonstrate a different molecular behavior between the inner and outer surfaces, except in experiment 10 where diffraction patterns are practically equal. This different behavior is more evident in experiments 11 and 12, where patterns of the outer surface are wider than those of the inner surface. In fact, in “Exp. #12”, the broad peaks obtained on the outer surface show a crystallinity that is well below the crystallinity observed on the inner surface. Interestingly, on the outer surface, the patterns obtained at 0° are more intense than those obtained at 90°, proving that PCL molecular chains are oriented in the vertical direction of the pyramid-shaped parts, that is, the direction of descent of the forming tool, according to the experimental setup used in this work for the XRD analysis (see
Figure 15). On the other hand, the XRD patterns obtained on the inner surface show more intense peaks at 90° than at 0°, especially in experiments 9 and 11, indicating that in the inner surface, the PCL chains are preferentially oriented in the horizontal direction. These results suggest that PCL molecular chains are oriented horizontally in the inner surface due to the action of the forming tool, because it moves almost completely along the
x and
y directions (except for the small region where the tool steps down) and in this movement it could be “pulling” the molecular chains in the same direction. The difference between the patterns obtained at 0° and 90° on the inner surface is small, perhaps due to the fact that the movement of the forming tool is alternating, that is, a bidirectional contouring, which would be inhibiting a greater chain orientation.
In the outer surface, the polymer chains are not in contact with the forming tool, but these are incrementally stretched along the vertical direction at the same time and in the same way as the pyramid-shaped part is incrementally formed. As was mentioned before, the orientation of polymer chains in the vertical direction was observed by means of SWAXS in polypropylene sheets [
15]; however, in those previous results, the horizontal orientation of chains in the inner surface could not be observed because the SWAXS analysis is performed through-thickness of the sheet. Nonetheless, in that previous work the authors obtained a hint of the difference in molecular behavior of the polymer between the inner and outer surfaces when they noticed a whitening on the polypropylene sheets after the SPIF processing and highlighted that this whitening only occurred on the outer surface of the formed parts. This whitening has also been observed in PVC [
4], and is attributed to a crazing effect, which, according to McLeish et al. [
29], is related to the disentanglement of chains.
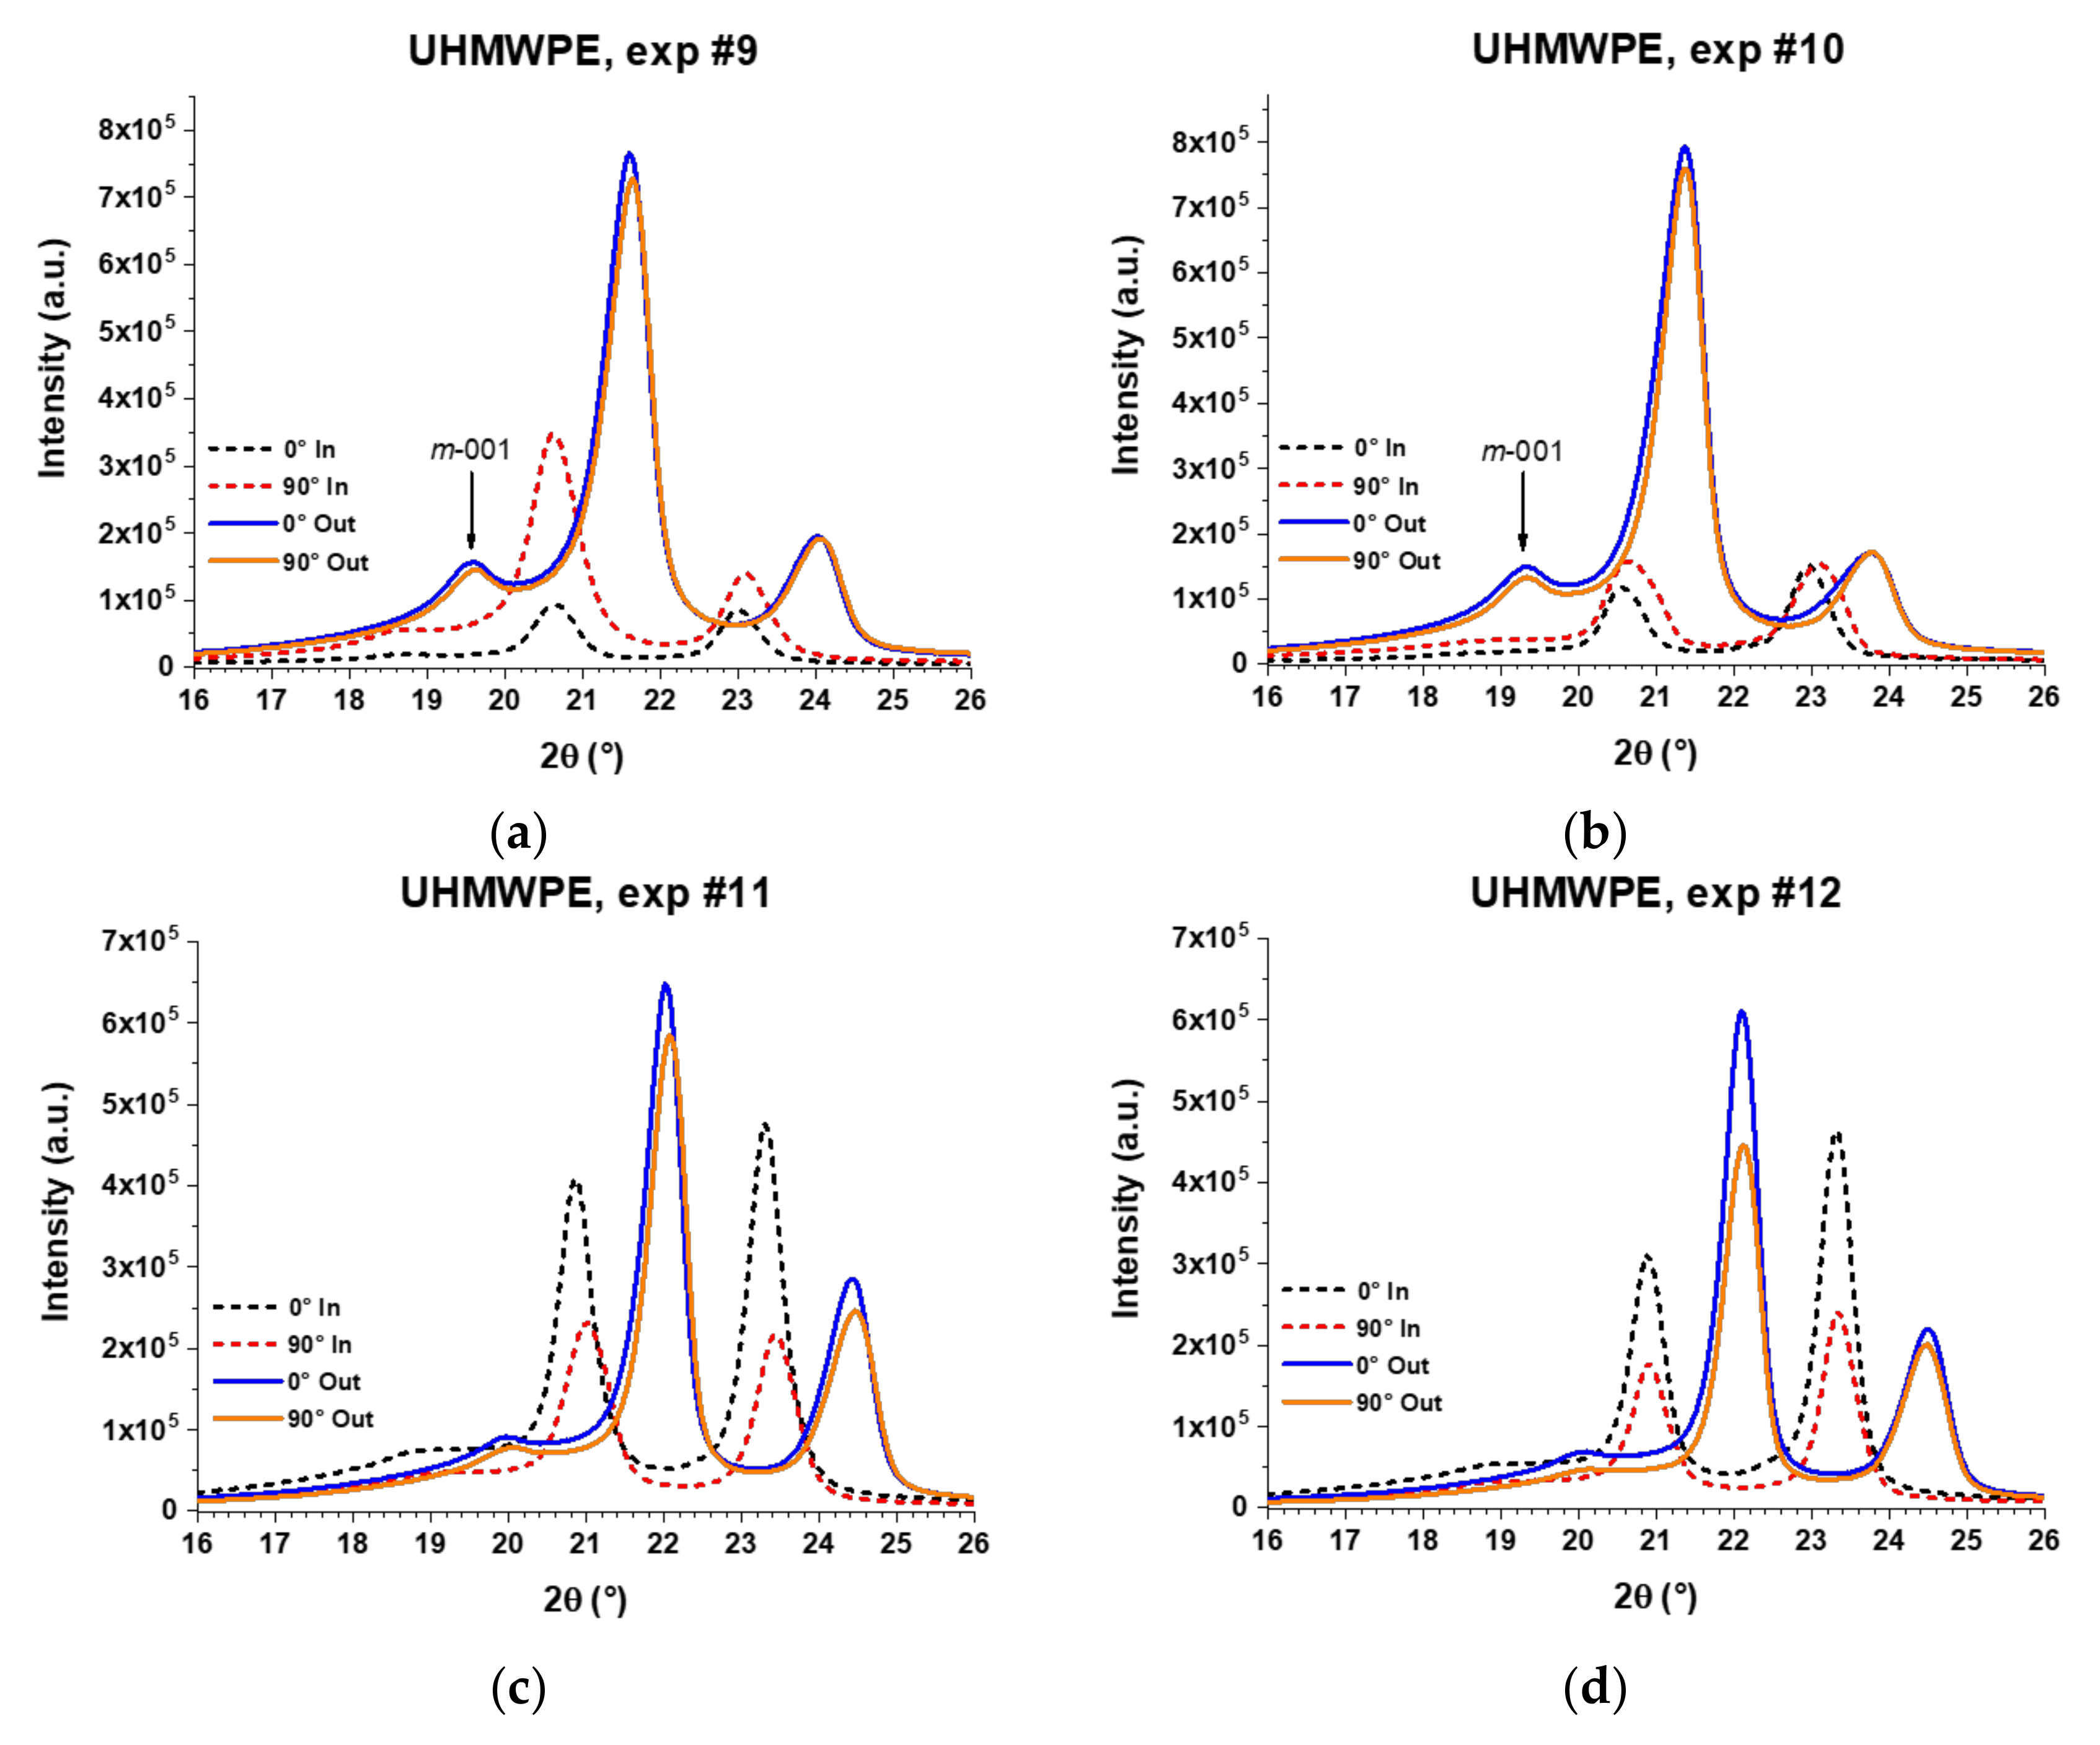
Figure 18 shows the XRD patterns in the 2θ range from 16° to 26° of the pyramid-shaped parts of UHMWPE. The shift of peaks is more evident than in the case of the PCL sheets because the curvature of the UHMWPE parts is greater than in the parts of PCL, as can be observed in the pyramid parts shown in the images of
Figure 9 and
Figure 12. All patterns of the UHMWPE formed sheets show the peaks of (110) and (200) planes, and it is evident that both surfaces, inner and outer, behave differently when they are processed by SPIF. Regarding the inner surface, in experiments 9 and 10, the patters obtained at 90° are more intense than those at 0°, suggesting that polymer chains are oriented horizontally, similar to what happens with PCL. However, in experiments 11 and 12, the opposite occurs, i.e., the peaks at 0° are more intense, indicating that in the formed parts fabricated through these experiments, the polymer chains are preferentially oriented along the vertical direction. Experiments 11 and 12 were performed with the larger
Dt, which should contribute to this difference in chain orientation.
Regarding the outer surface, the XRD patterns of UHMPWE formed parts show a slight difference in intensities between the measurements obtained at 0° and 90° in experiments 9, 10, and 11, but in experiment 12, the difference in intensities is more marked, being greater for the measurement carried out at 0°, which indicates that the polymer chains are oriented in the vertical direction. It is worth noting that in experiments 9 and 10, the patterns obtained on the outer surface show a peak in the 2θ range of 19.3°–19.7°, which is associated to the (001) diffraction plane of the monoclinic structure of UHMWPE [
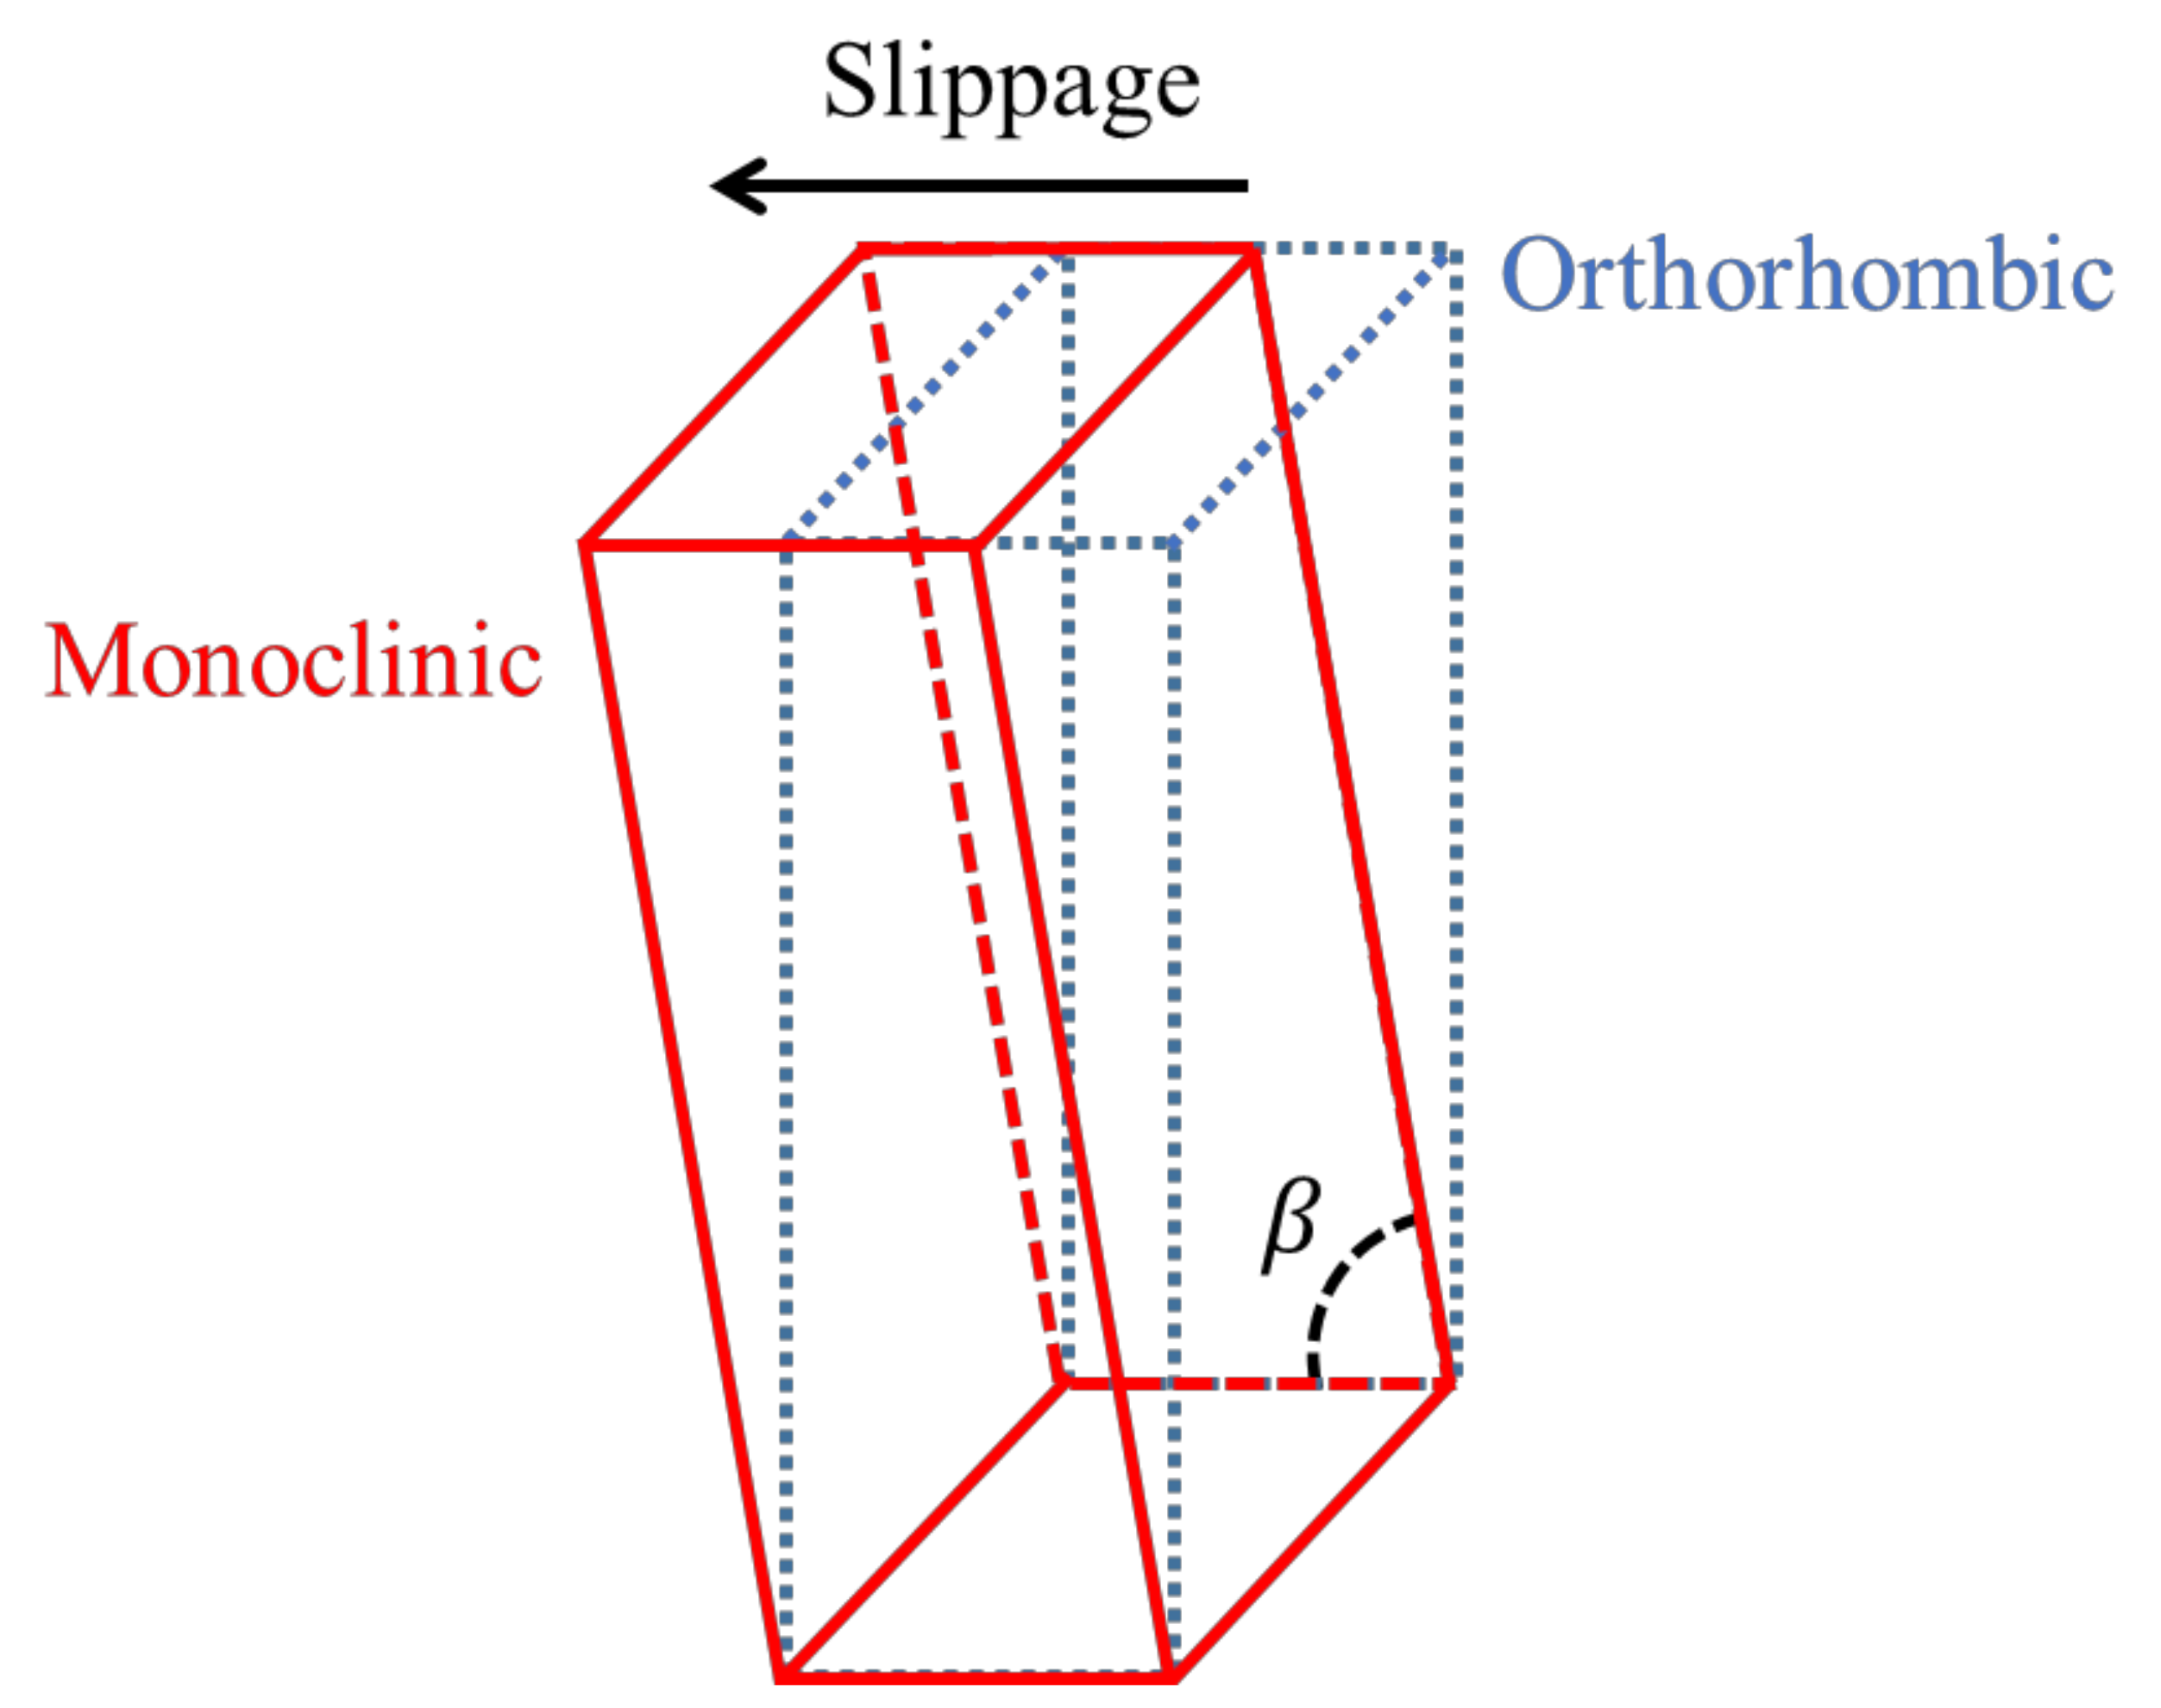
30]. Thus, it is possible to infer that the movement of chains in a preferential direction generates a distortion in the initial orthorhombic unit cell. In fact, a monoclinic unit cell differs from an orthorhombic in only one of the angles between planes, specifically the angle β between the cell parameters
a and
c, being β ≠ 90° in the monoclinic unit cell
, and β = 90° in the orthorhombic unit cell. This distortion in the unit cell, which is schematically represented in
Figure 19, can be related to the slippage between crystallites that was previously detected by DMA and identified as the alpha star transition. Such distortion of the unit cell was not observed in PCL, probably due to the fact that the crystalline region of the UHMWPE is more compact because it contains a linear structure with carbon-carbon bonds in the main chain while the structure of PCL contains carbonyl groups (see
Figure 16c).
The chain orientation in the outer surface of the UHMWPE formed parts was less than that observed in the PCL ones because of the larger size of the UHMWPE chains. The forming tool generates the movement of chains on the surface of the sheet that is in direct contact with the tool (i.e., the inner surface). This produces a rearrangement of the polymer chains that continues along the thickness of the sheet, that is, towards the outer surface. However, this rearrangement requires the movement of the long, coiled chains of UHMWPE, which is hardly carried out. In fact, the DMA results showed that in UHMWPE, more energy is lost due to friction and internal movements compared to PCL (the loss modulus, E”, of UHMWPE is higher); however, the tan δ curve of UHMWPE showed a gradual increase as the temperature is also increased, while that of PCL increased more abruptly. Considering that tan δ is a measure of how efficiently a material loses energy due to molecular rearrangements, these results indicate that in the case of UHMWPE, the lost energy is scarcely used for molecular rearrangement, while in PCL the opposite occurs, mainly as it approaches the melting temperature where the energy is efficiently harnessed for molecular motion and the consequent flow of the material.
In order to analyze how the parameters
Dt and ∆
z affect the chain orientation in the formed parts,
Figure 20 presents the values of the ratio
I0/
I90 for the diffraction peak associated to the (110) plane, where
I0 corresponds to the maximum intensity obtained in the measurement at 0° and
I90 corresponds to the maximum intensity in the measurement at 90°. In this way, a value of
I0/
I90 = 1 represents that the polymer chains are not oriented in a preferential direction, a value of
I0/
I90 >1 indicates that the chains are oriented vertically in the pyramid-shaped parts, and
I0/
I90 <1 indicates that the chains are oriented horizontally. If the value of
I0/
I90 is farther from 1, it means that the chain orientation is greater. The graphs show the results for the inner surface (small internal square) and for the outer surface (large external square). The central red values represent the
I0/
I90 ratio of the corresponding reference sample (unformed sheet) of each polymer. This value for PCL and UHMWPE is close to 1, since the polymer chains are not oriented in these unformed sheets as was mentioned before.
As has been discussed, in the formed parts of PCL, the molecular chains are preferentially oriented in the horizontal direction in the inner surface. The experiment performed with Dt = 6 mm and ∆z = 0.2 mm generates the greater orientation of chains in the inner surface. One can think that a small tool concentrates the pulling of chains in a smaller region, and thus the crystalline parts of the polymer are oriented in the feed direction of the tool. A larger Dt implies a less-concentrated molecular movement, so that it could be causing the movement of a large amount of crystalline parts, but also of a large amount of the amorphous part of the polymer. To some extent, a small Δz also represents a way of concentrating the movement of chains in a small size region. If the step size is small, in a second step down, the chains of the previous step can still be pulled by the forming tool, something that would not happen if the step size were larger, where the chains that were pulled in a previous step would hardly be affected by the displacement of the tool in the subsequent steps. Based on the aforementioned, a smaller Δz causes a higher chain orientation, although this parameter is not as significant as Dt is for the orientation of chains in the inner surface.
Concerning the outer surface, Dt causes the most marked impact in the orientation of chains, which could be attributed to the same reason explained before regarding the large amount of material that is pulled by the forming tool when its diameter is larger. However, in the outer surface the orientation is preferentially towards the vertical direction of the pyramid-shaped parts because on this surface, the tool path in the x-y plane does not have an impact. Therefore, regardless of the direction, the orientation of polymer chains in the outer surface is higher than in the inner surface because in the outer surface the polymer is pulled only in one direction, that is, downwards.
In the case of UHMWPE, the parameter that most influences the orientation is Dt. For a polymer that contains very long chains, such as UHMWPE, a tool of greater diameter creates a greater contact area between the tool and the surface of the sheet, which can be a more significant parameter compared to a polymer whose chains are not that big (the case of PCL). On the inner surface, a small Dt generates the horizontal orientation, while the larger Dt gives rise to the vertical orientation. The orientation of the chains on the outer surface is less evident than in the case of the PCL due to the energy lost by the molecular rearrangement from the inner surface to the outer one. Only a combination of parameters consisting of the largest Dt and the largest Δz is able to generate a greater orientation on the outer surface because one could think that in this way a greater amount of material is pulled down and so a greater molecular rearrangement among the UHMWPE chains takes place.
The characterization of PCL and UHMWPE performed in this work before and after being processed by SPIF has revealed important thermal and structural properties that certainly should be considered when forming thermoplastics by SPIF. Even though the XRD analyzes were imprecise due to the curvature of the samples evaluated, this characterization technique allowed us to separately study the surface of the sheet that is in contact with the forming tool and the opposite surface that is not, and in this manner, it was clearly revealed that polymer chains behave differently on each surface. It is strongly believed that the use of techniques such as DMA and XRD may become a very useful tool for SPIF of polymers and that the results presented here can be extended to other semicrystalline thermoplastics.

 ,
, 


