Controlled Surface Modification of Polyamide 6.6 Fibres Using CaCl2/H2O/EtOH Solutions


Abstract
:
1. Introduction
2. Materials and Methods
2.1. Materials
2.2. Sample Preparation
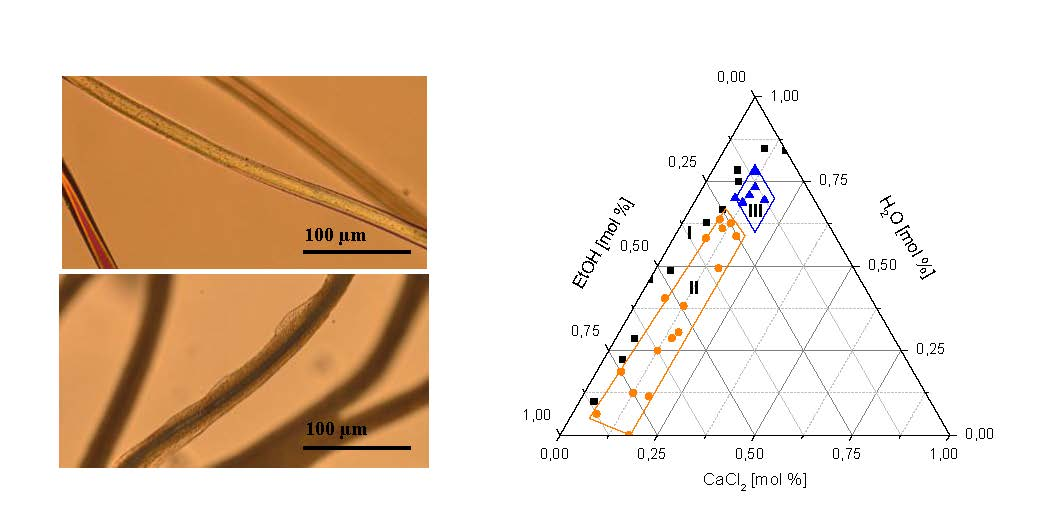
2.2.1. Mapping of Solvent Quality as a Function of Composition
2.2.2. In Situ Measurement
2.2.3. Measurement after Washing
2.2.4. Fibre Bundle Treatments
2.3. Analytical Methods
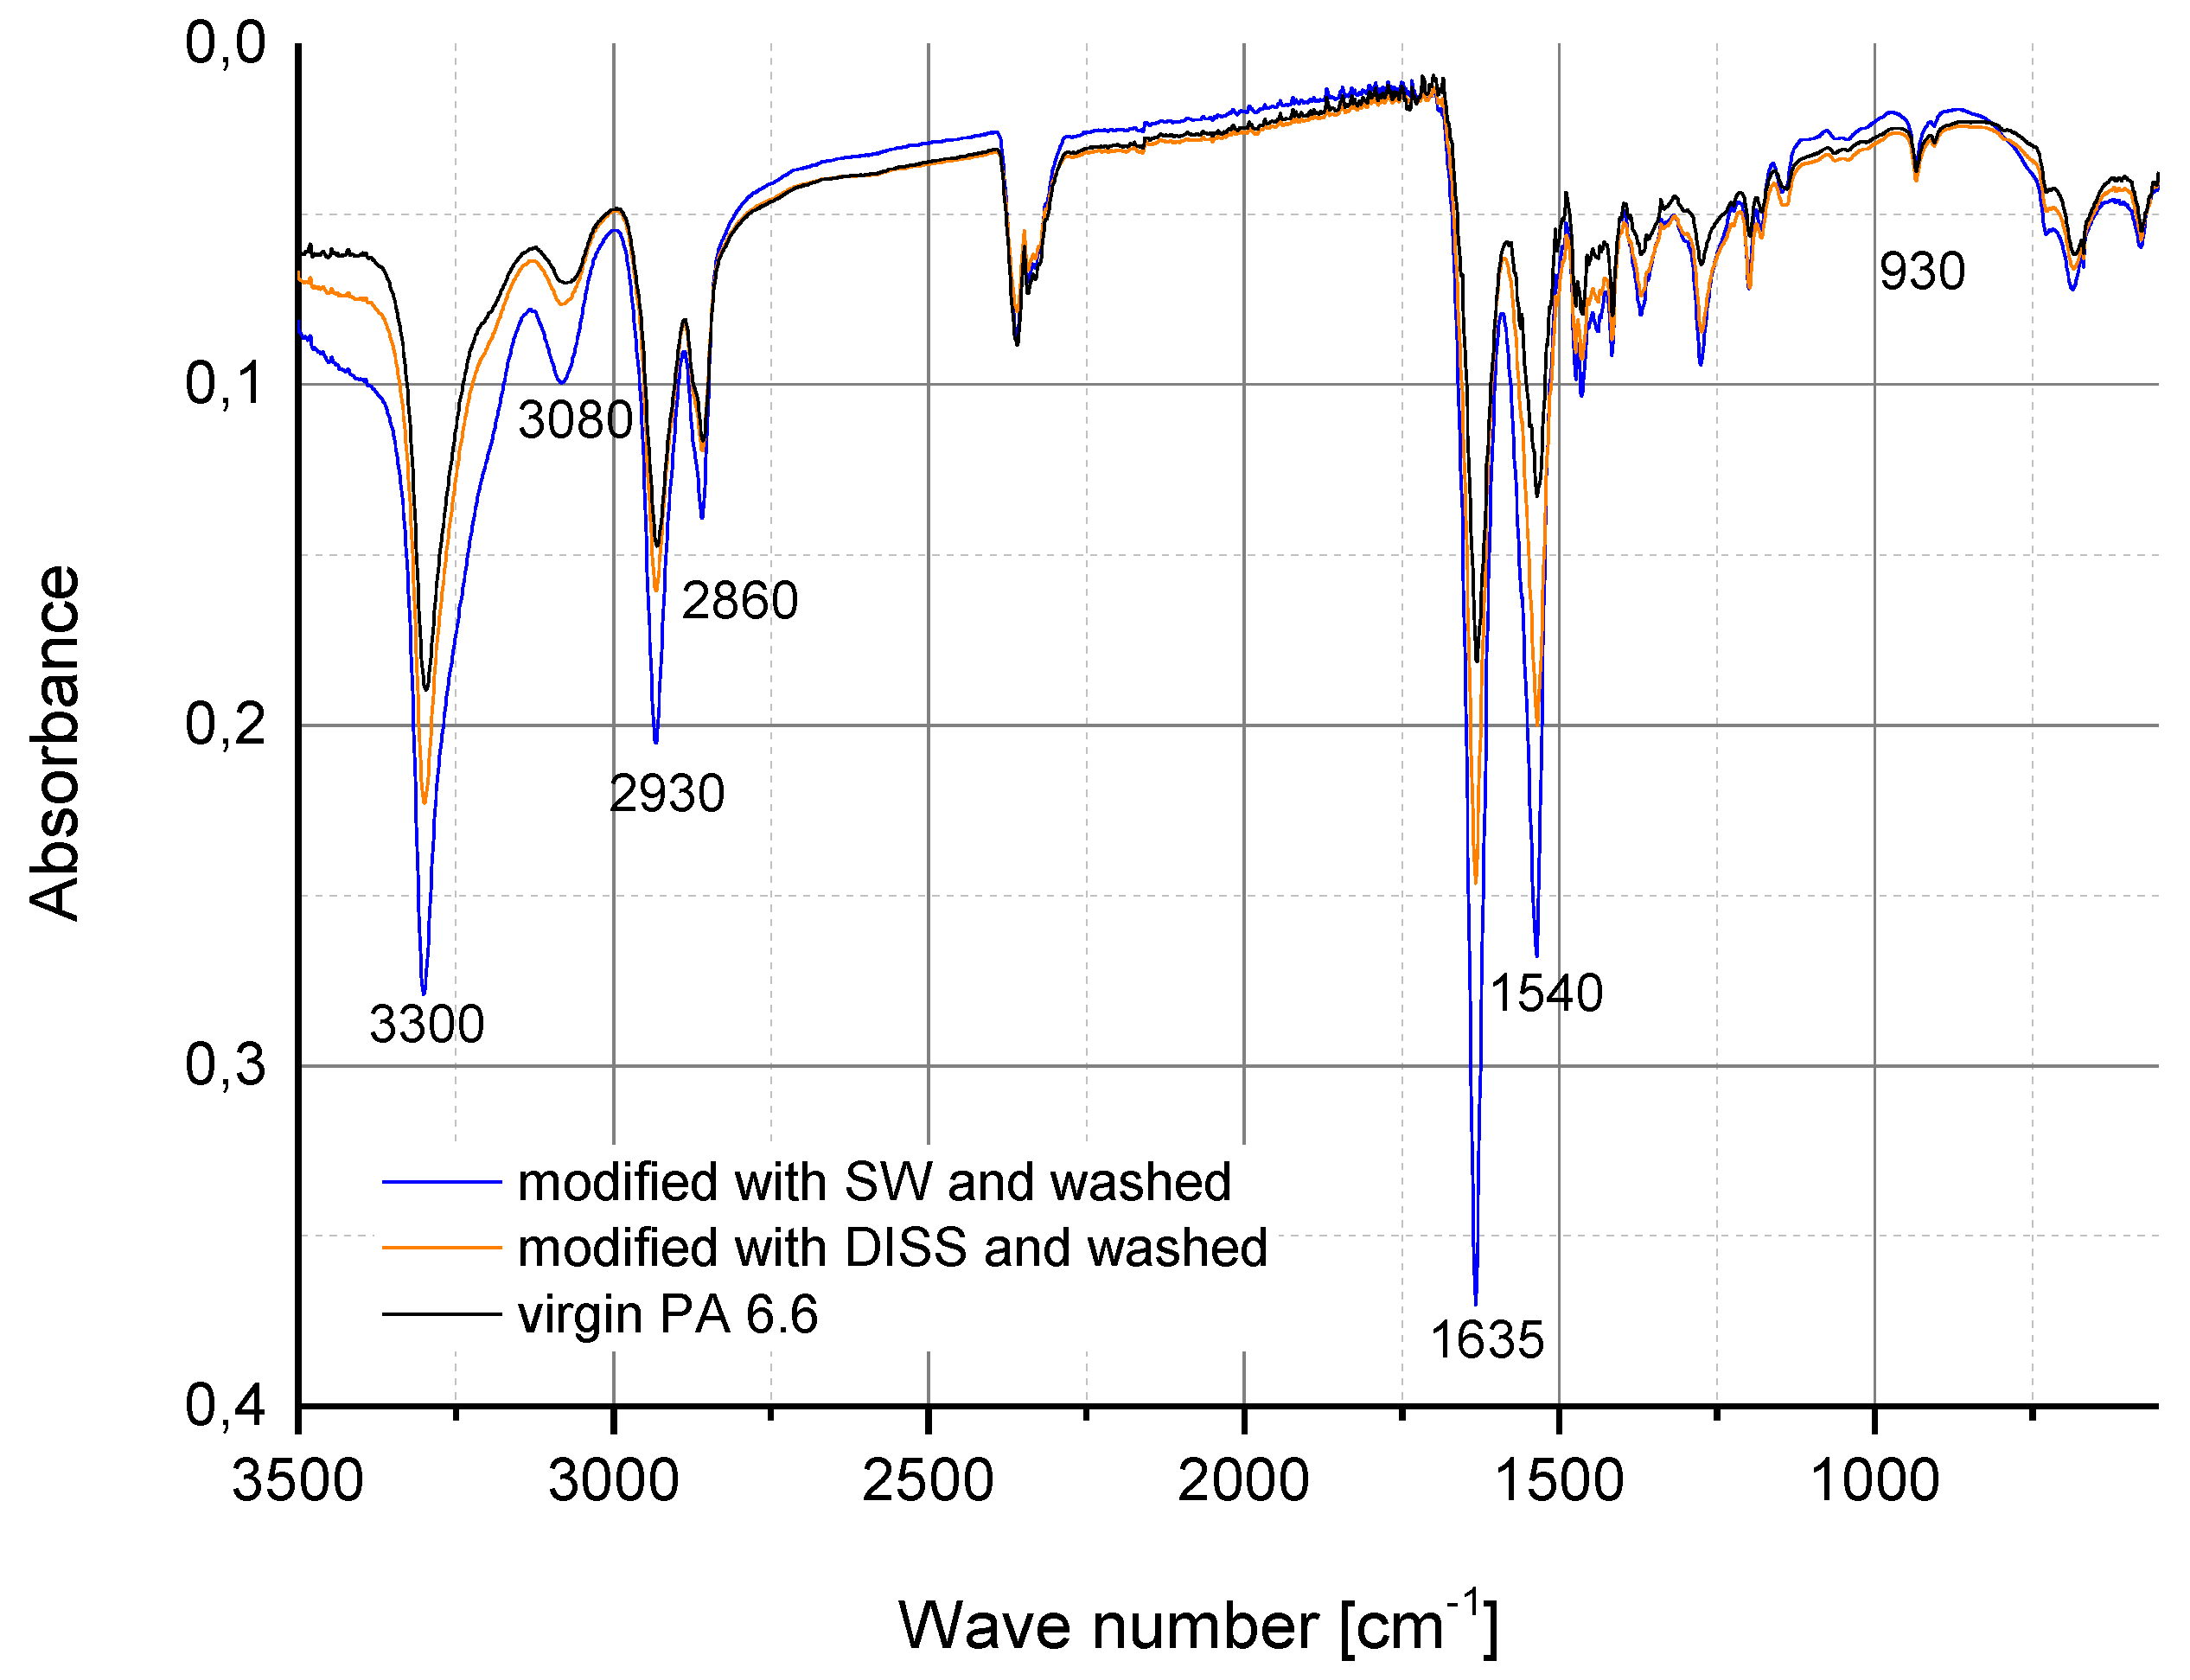
2.3.1. Fourier Transform Infrared Spectroscopy (FTIR)
2.3.2. Water Retention Value Determination
2.3.3. Confocal 3D Laser-Scanning Microscopy
3. Results and Discussion
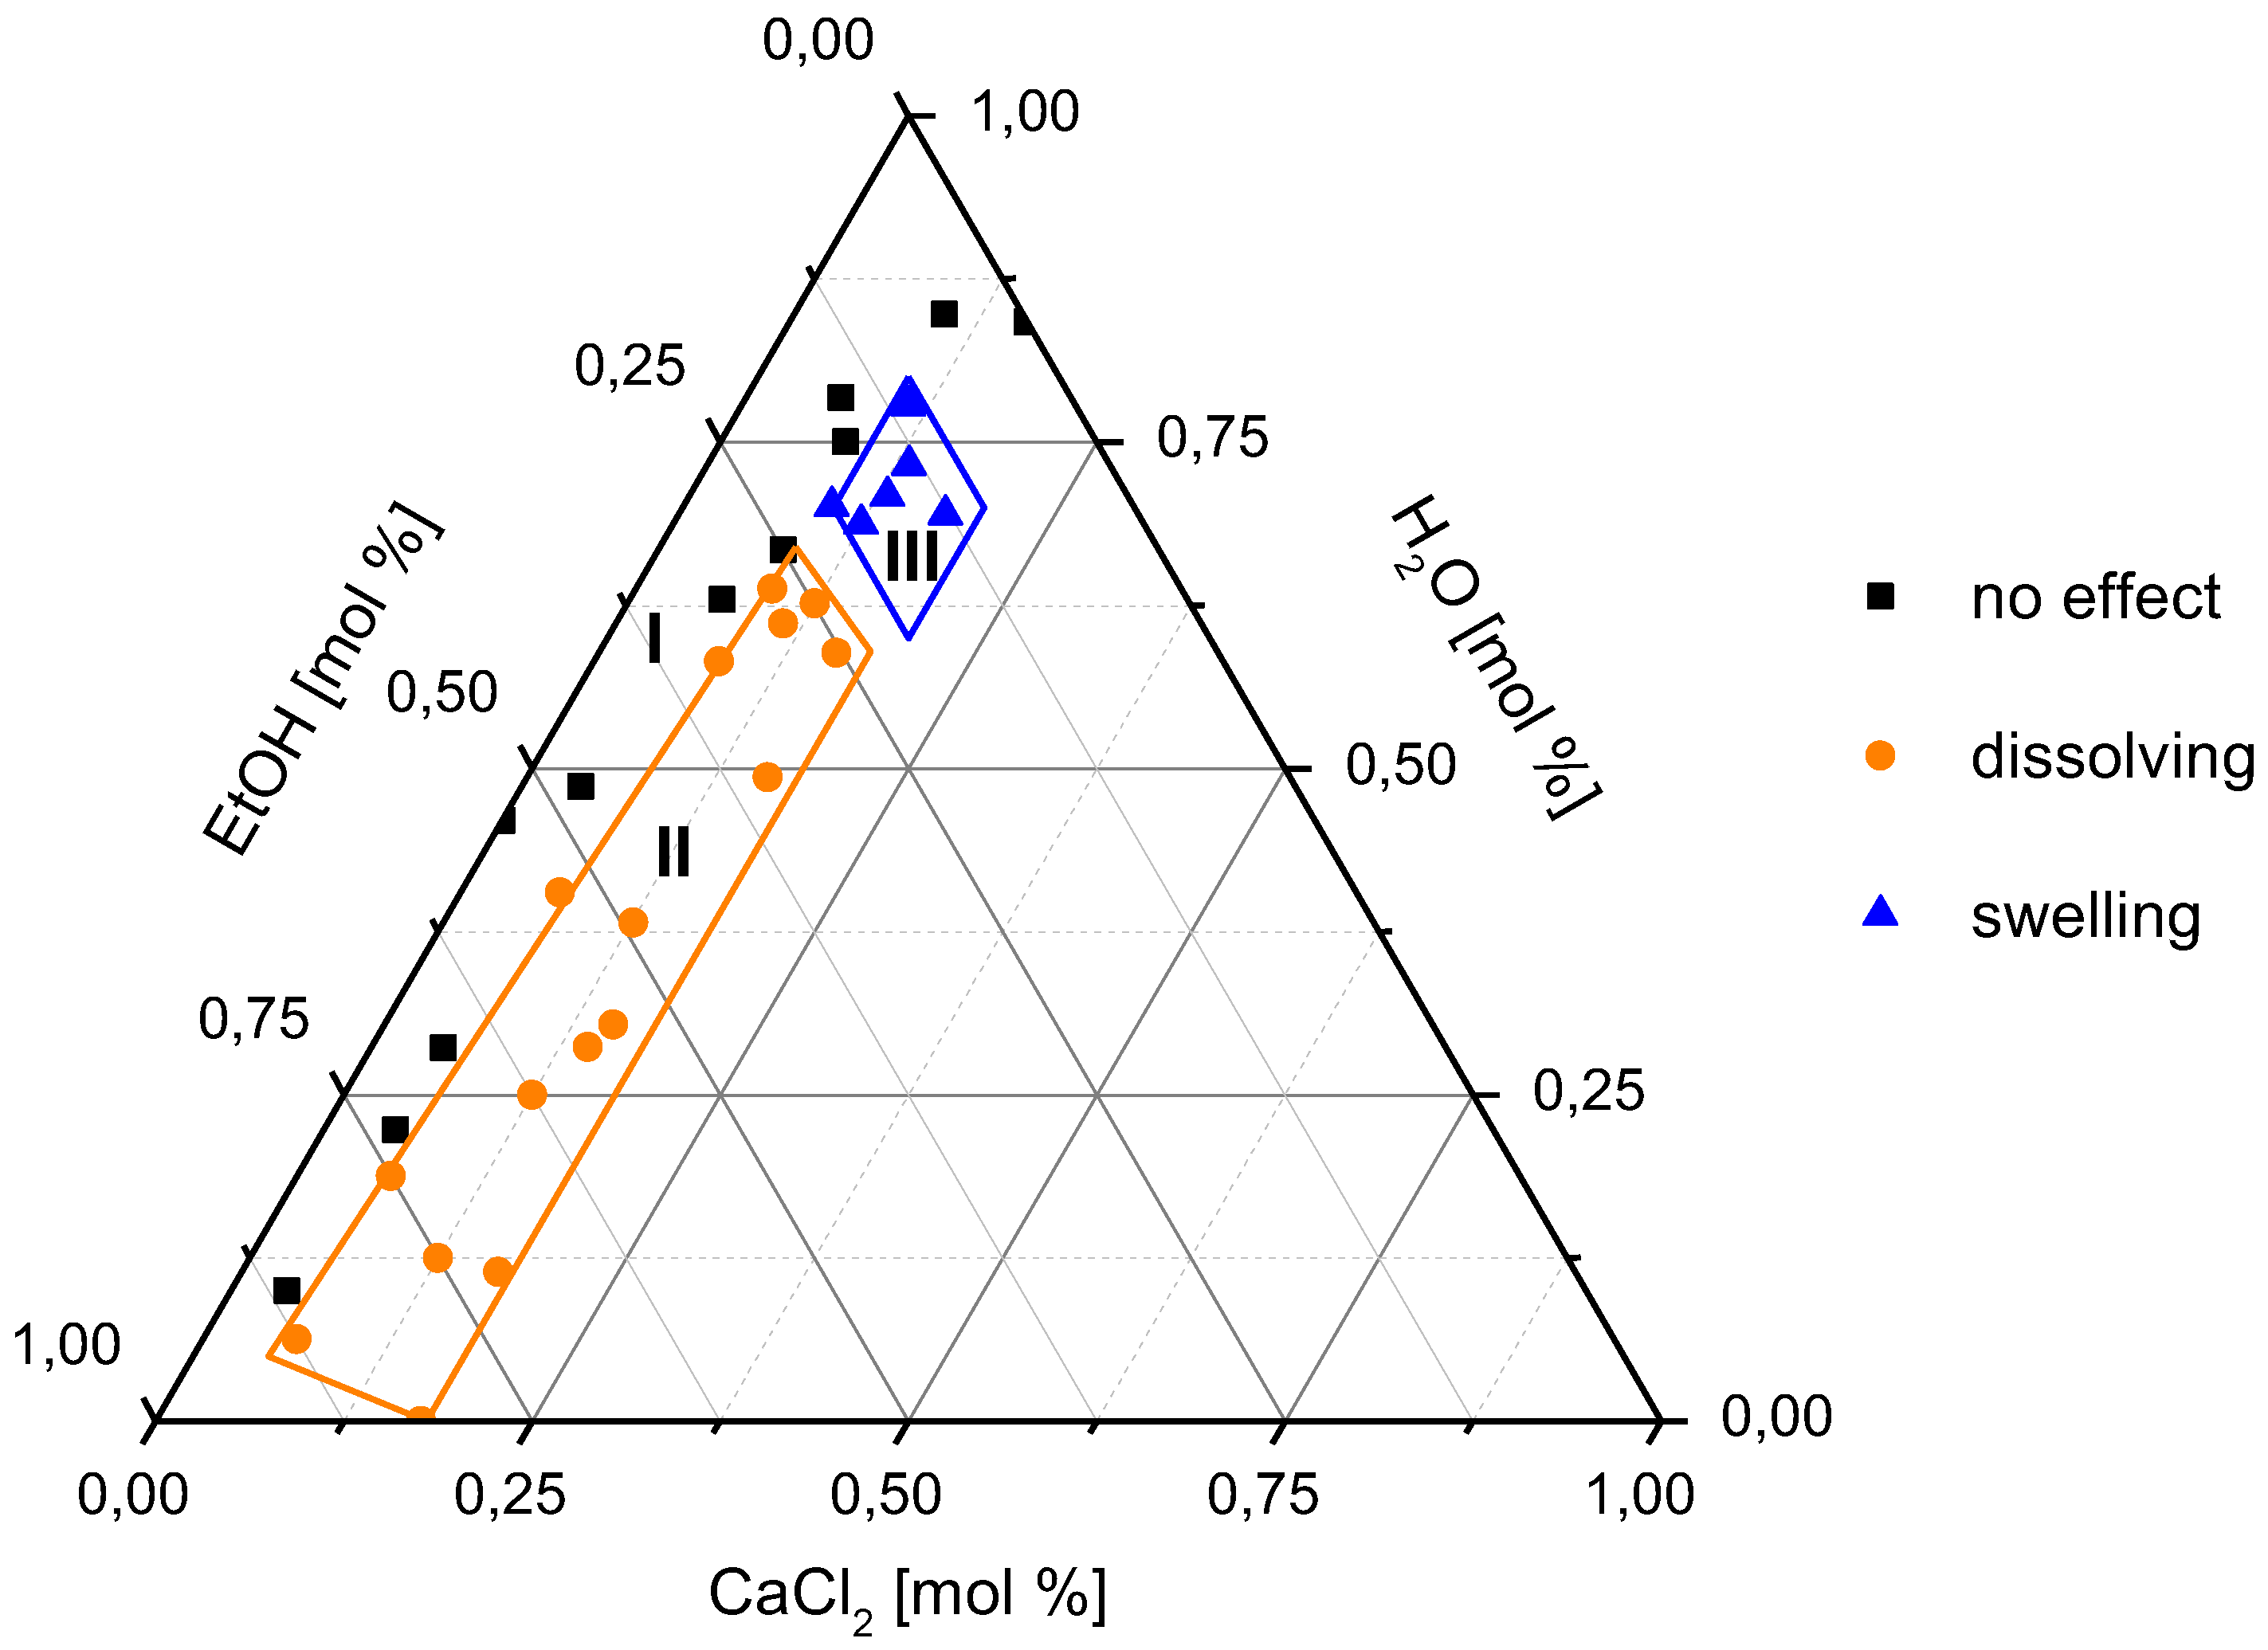
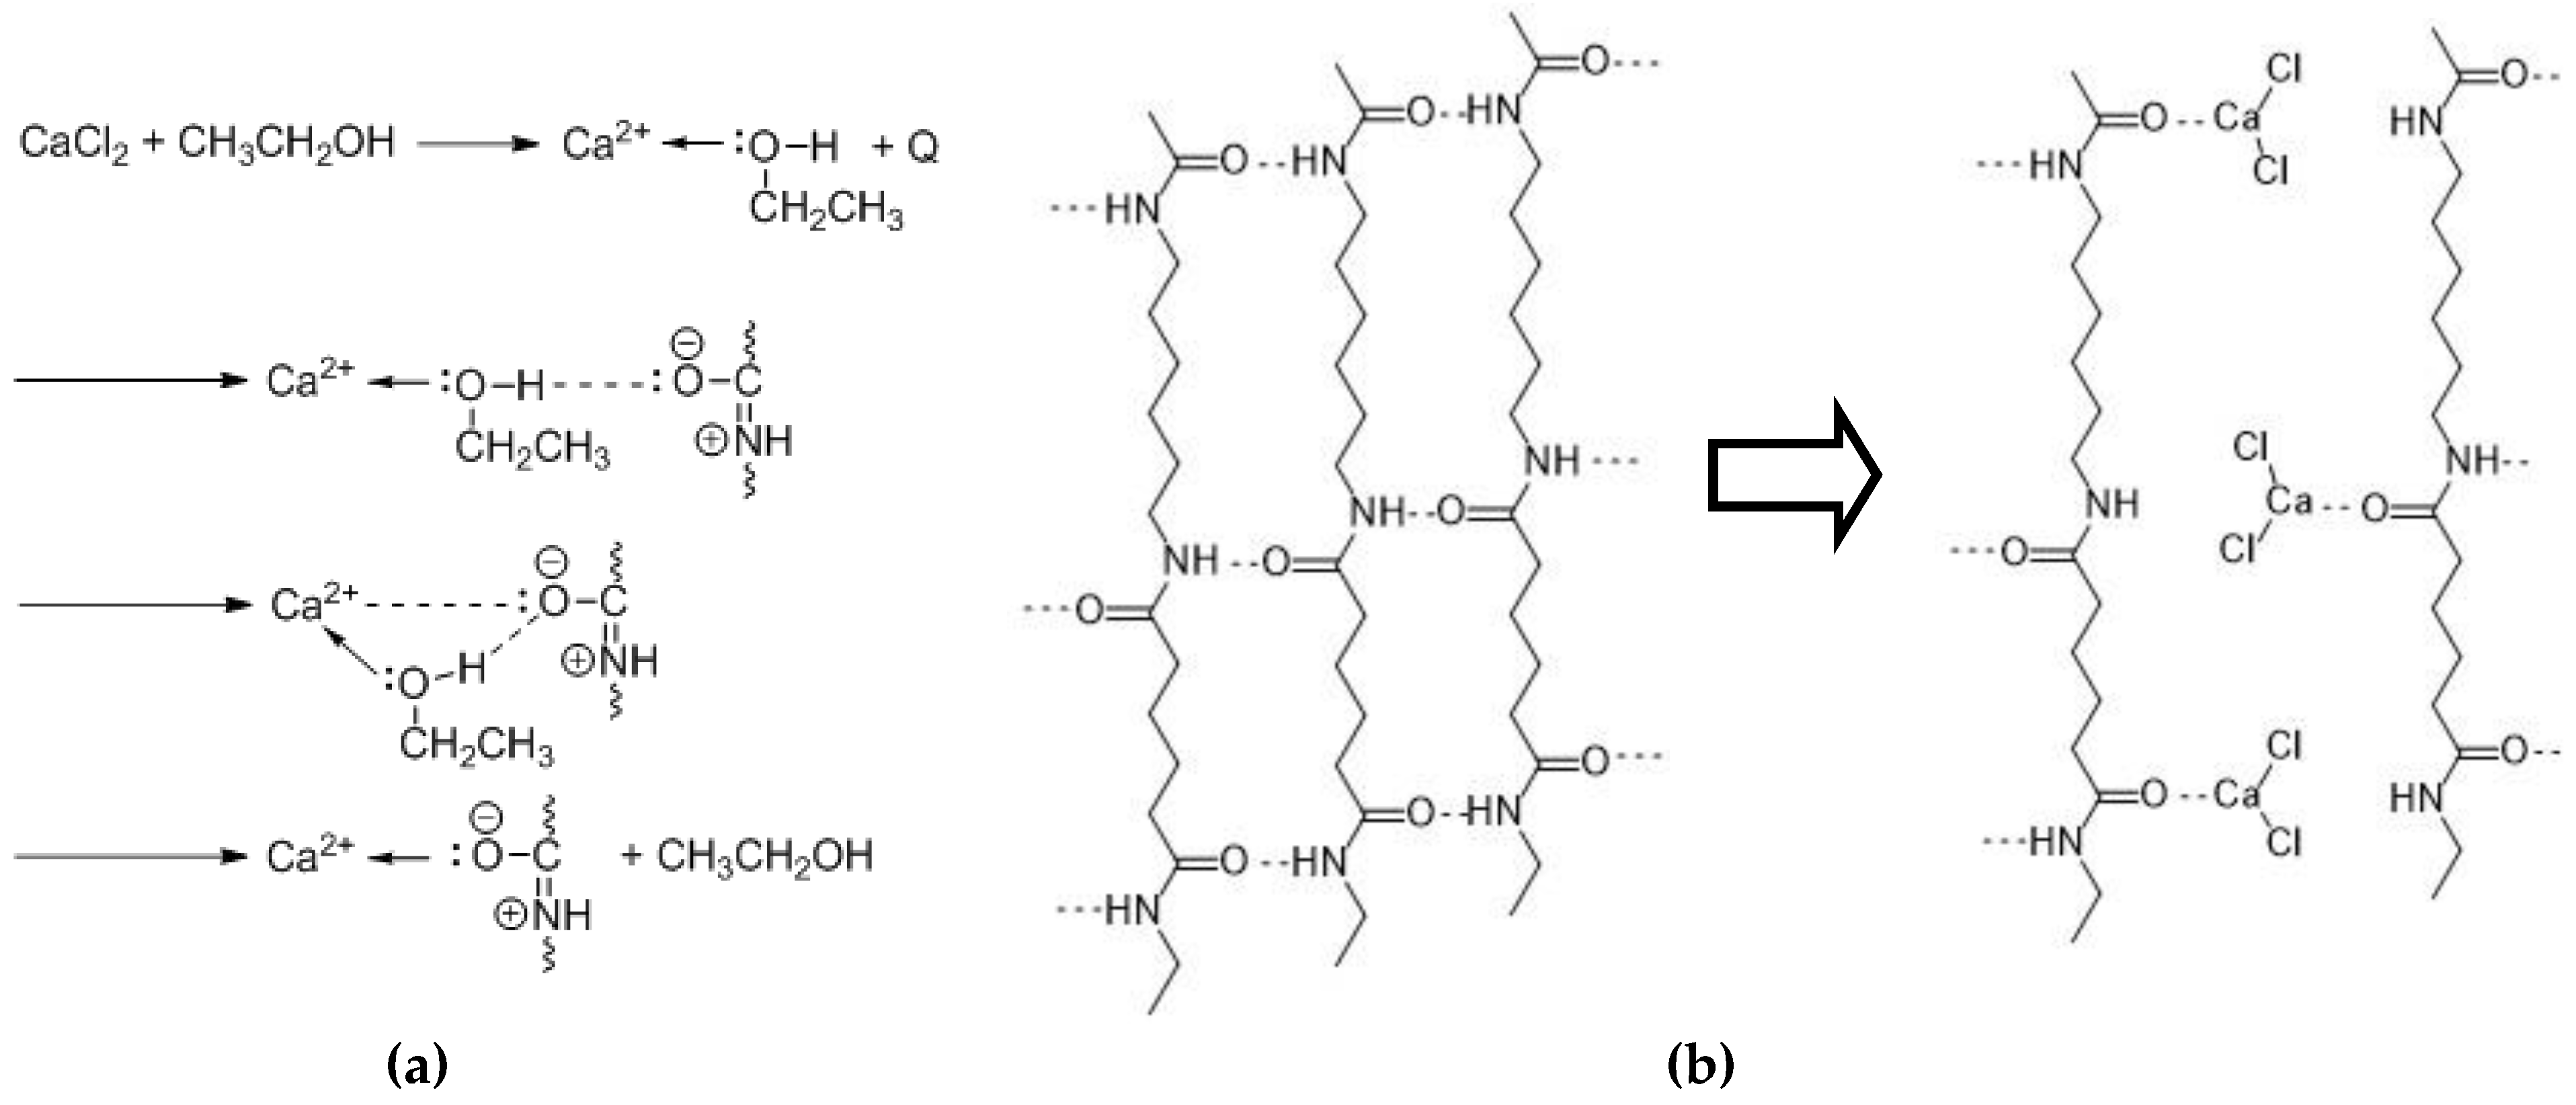
3.1. Swelling and Dissolution Behaviour of PA 6.6 Fibres in CaCl2/H2O/EtOH Solvents
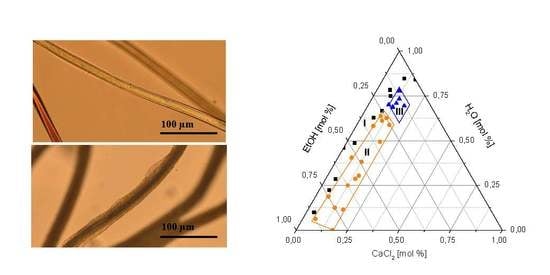
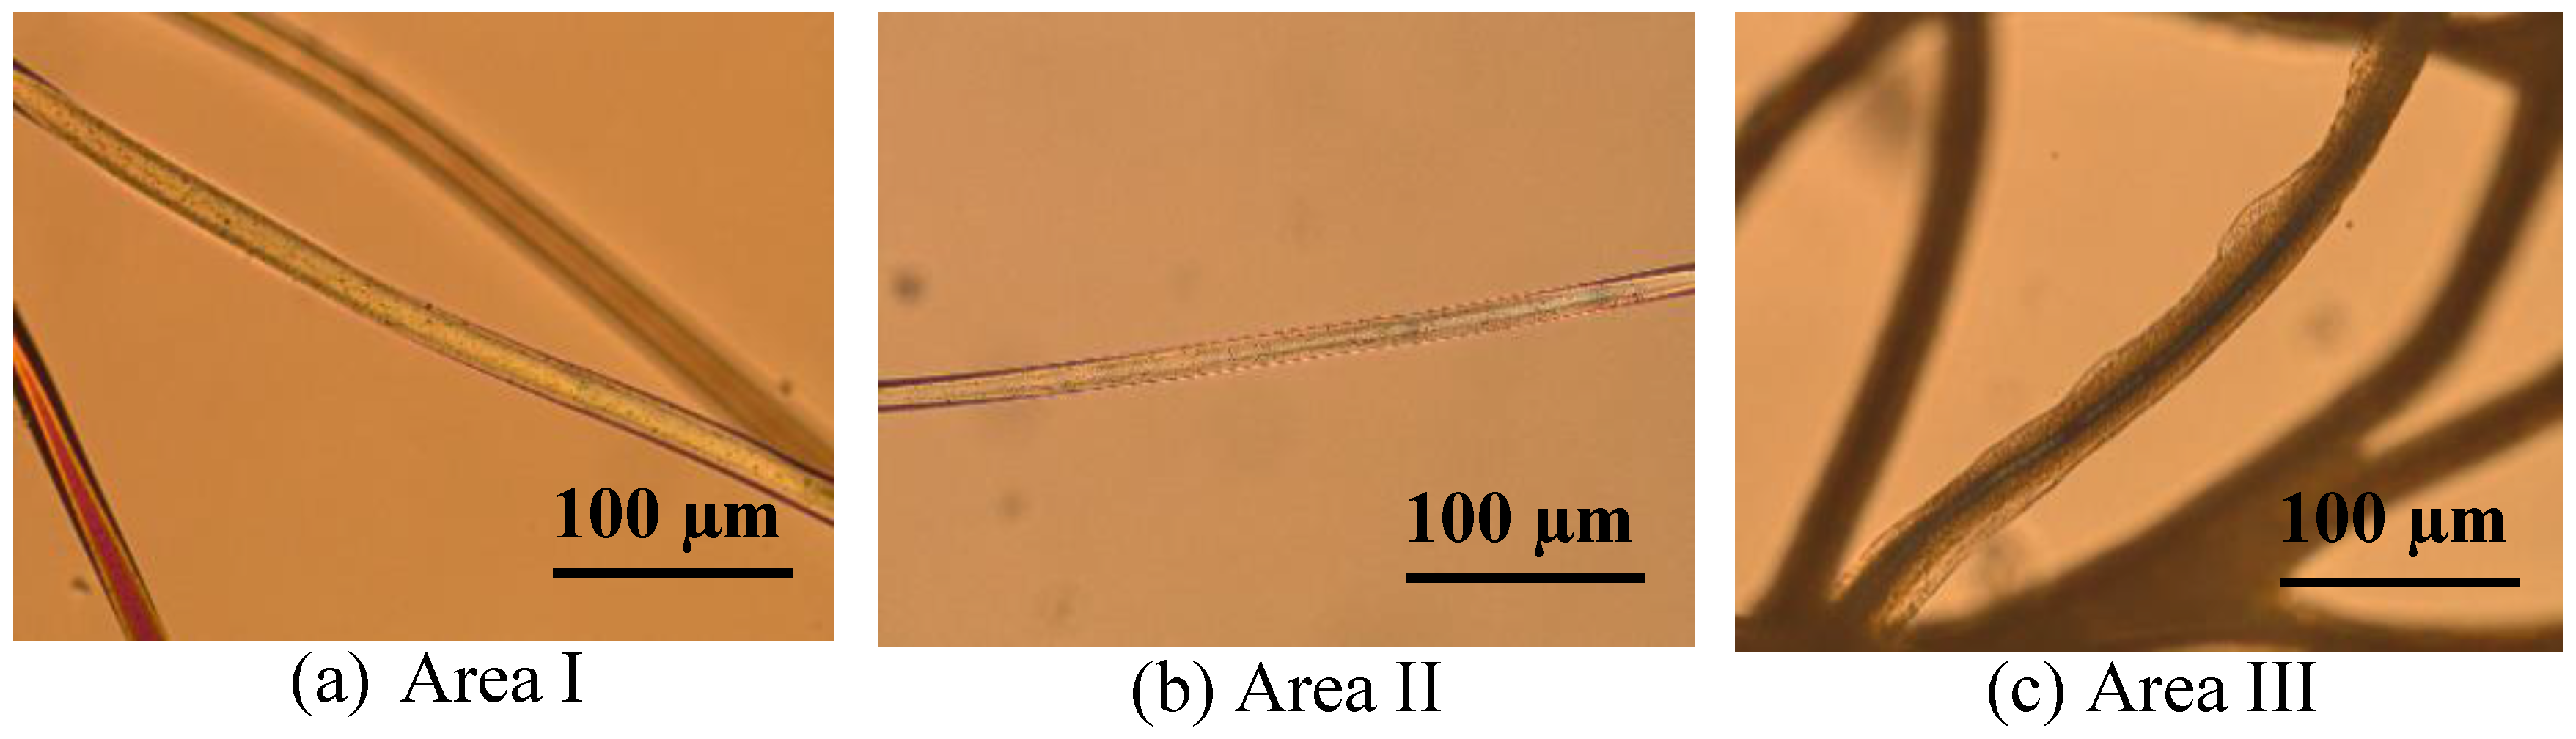
3.2. Microscopic Investigation of Swelling and Dissolving of PA 6.6 Fibres
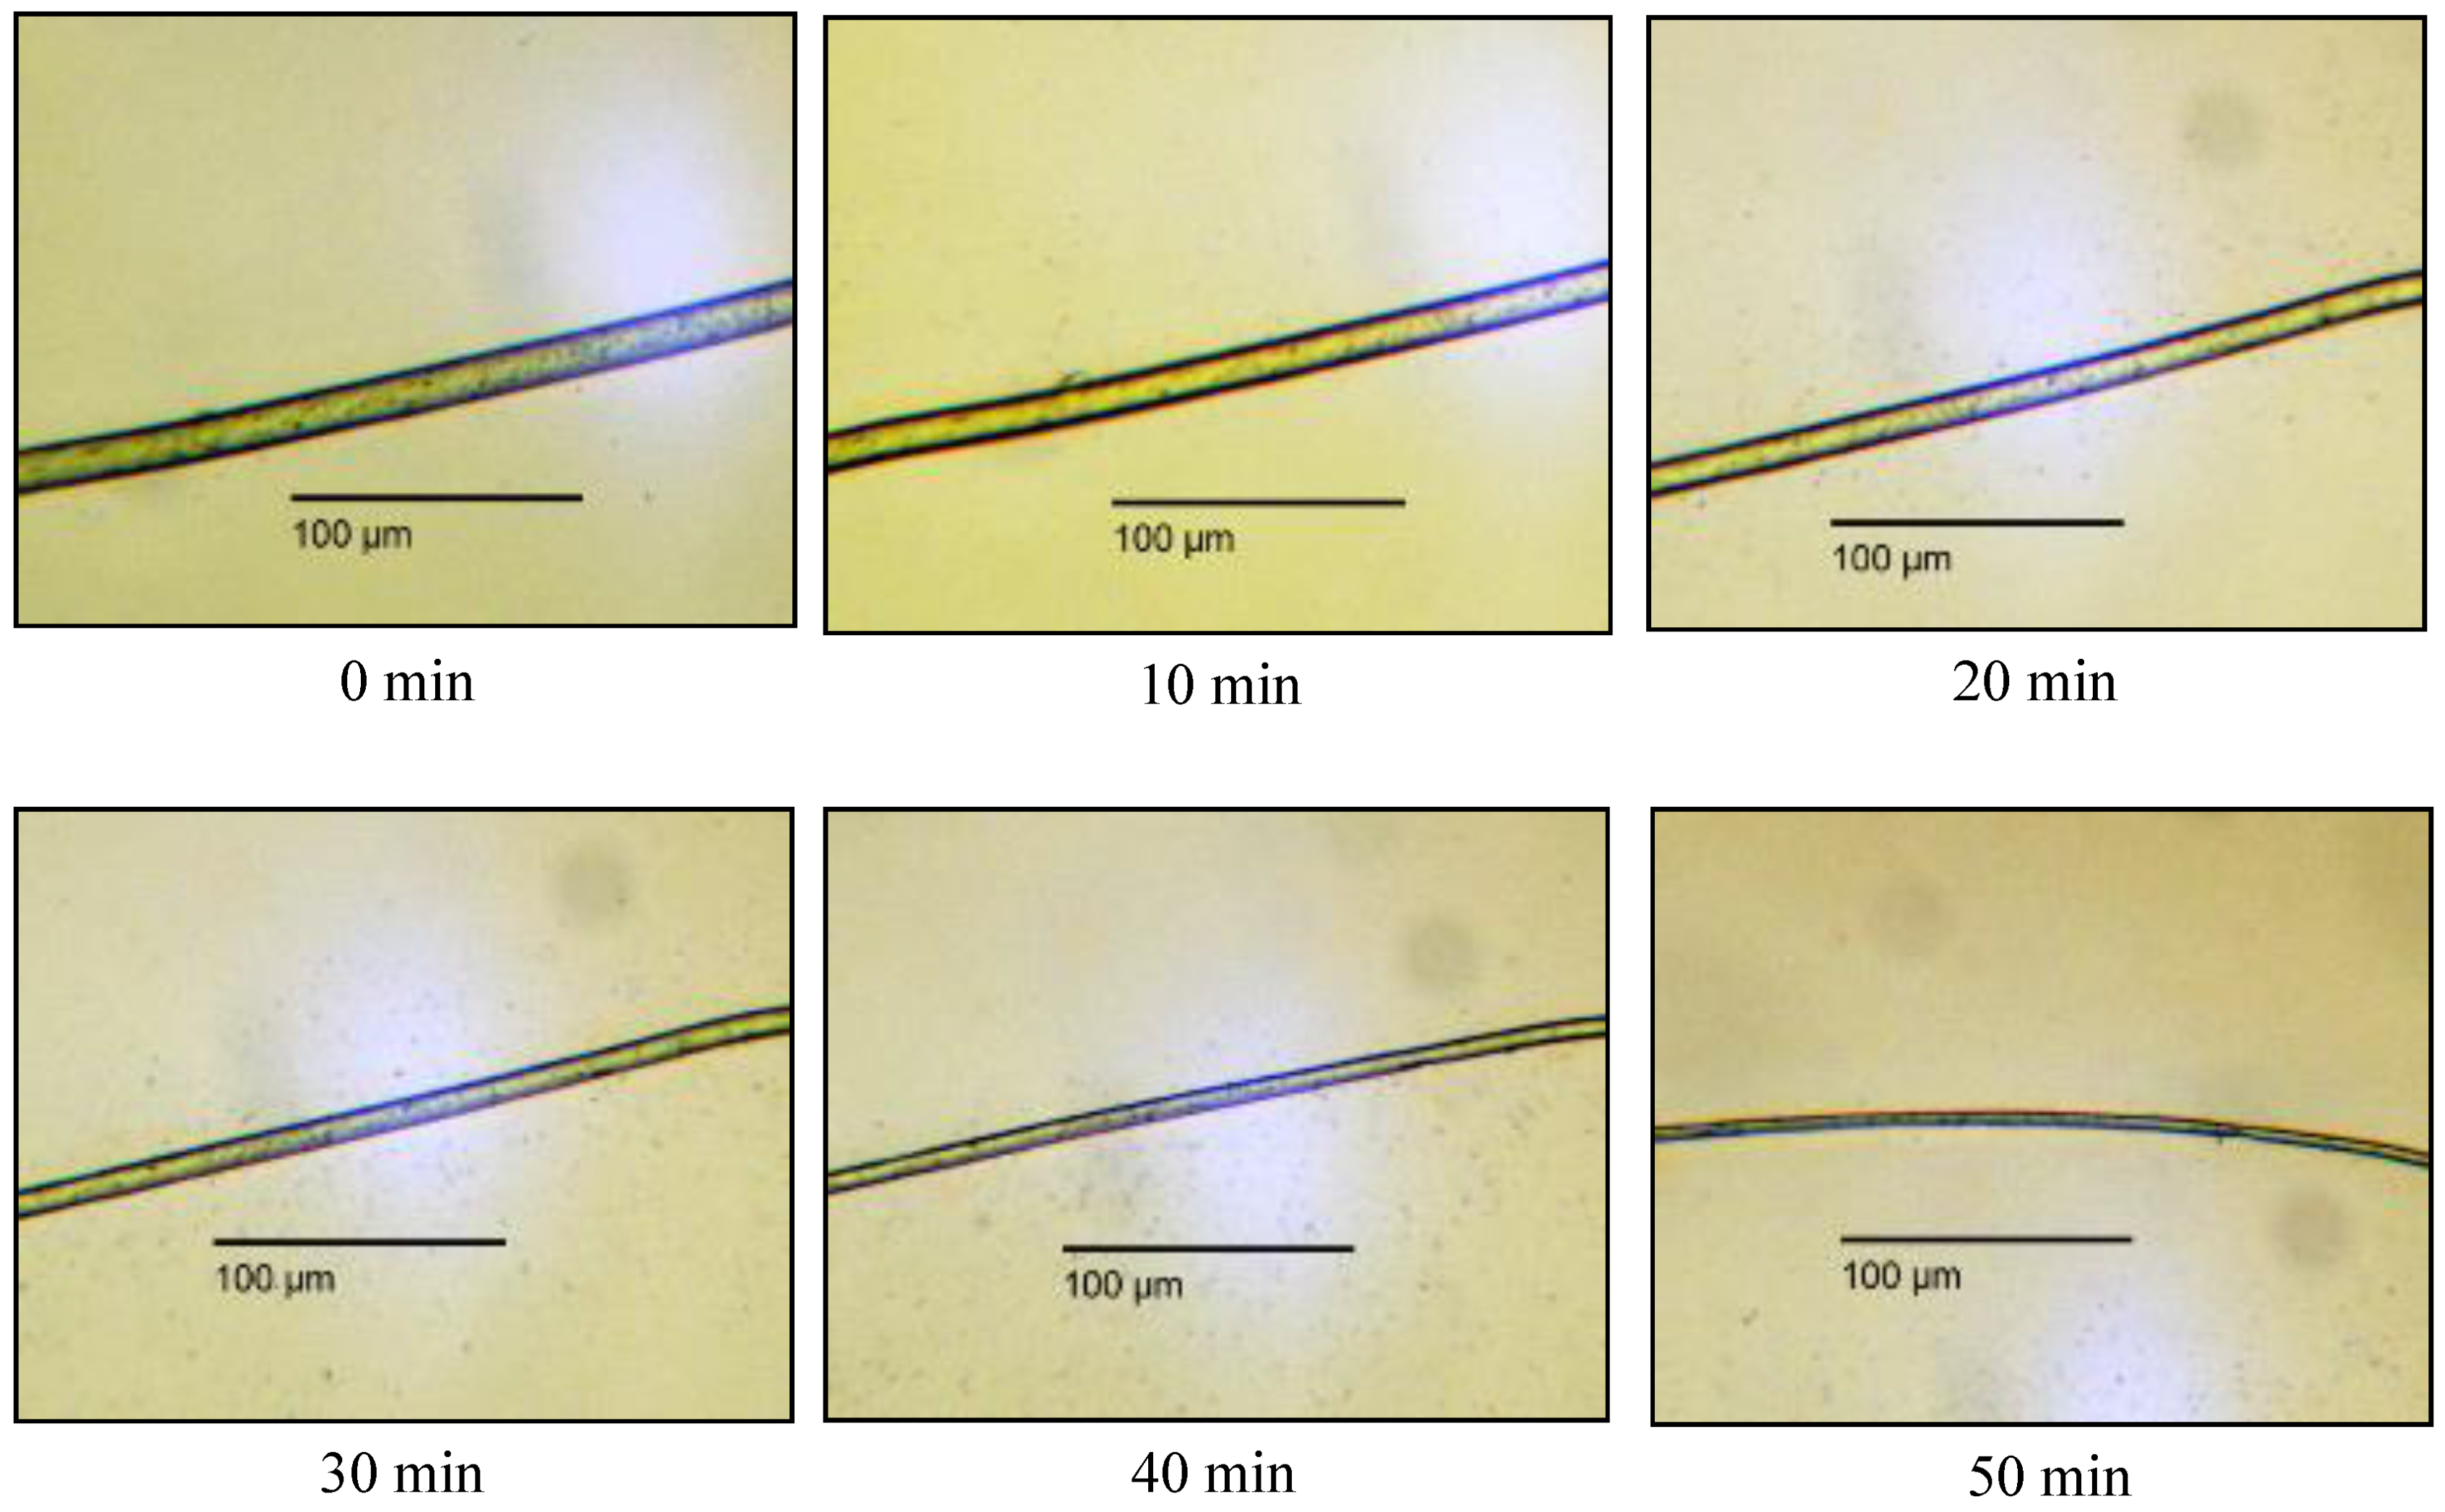
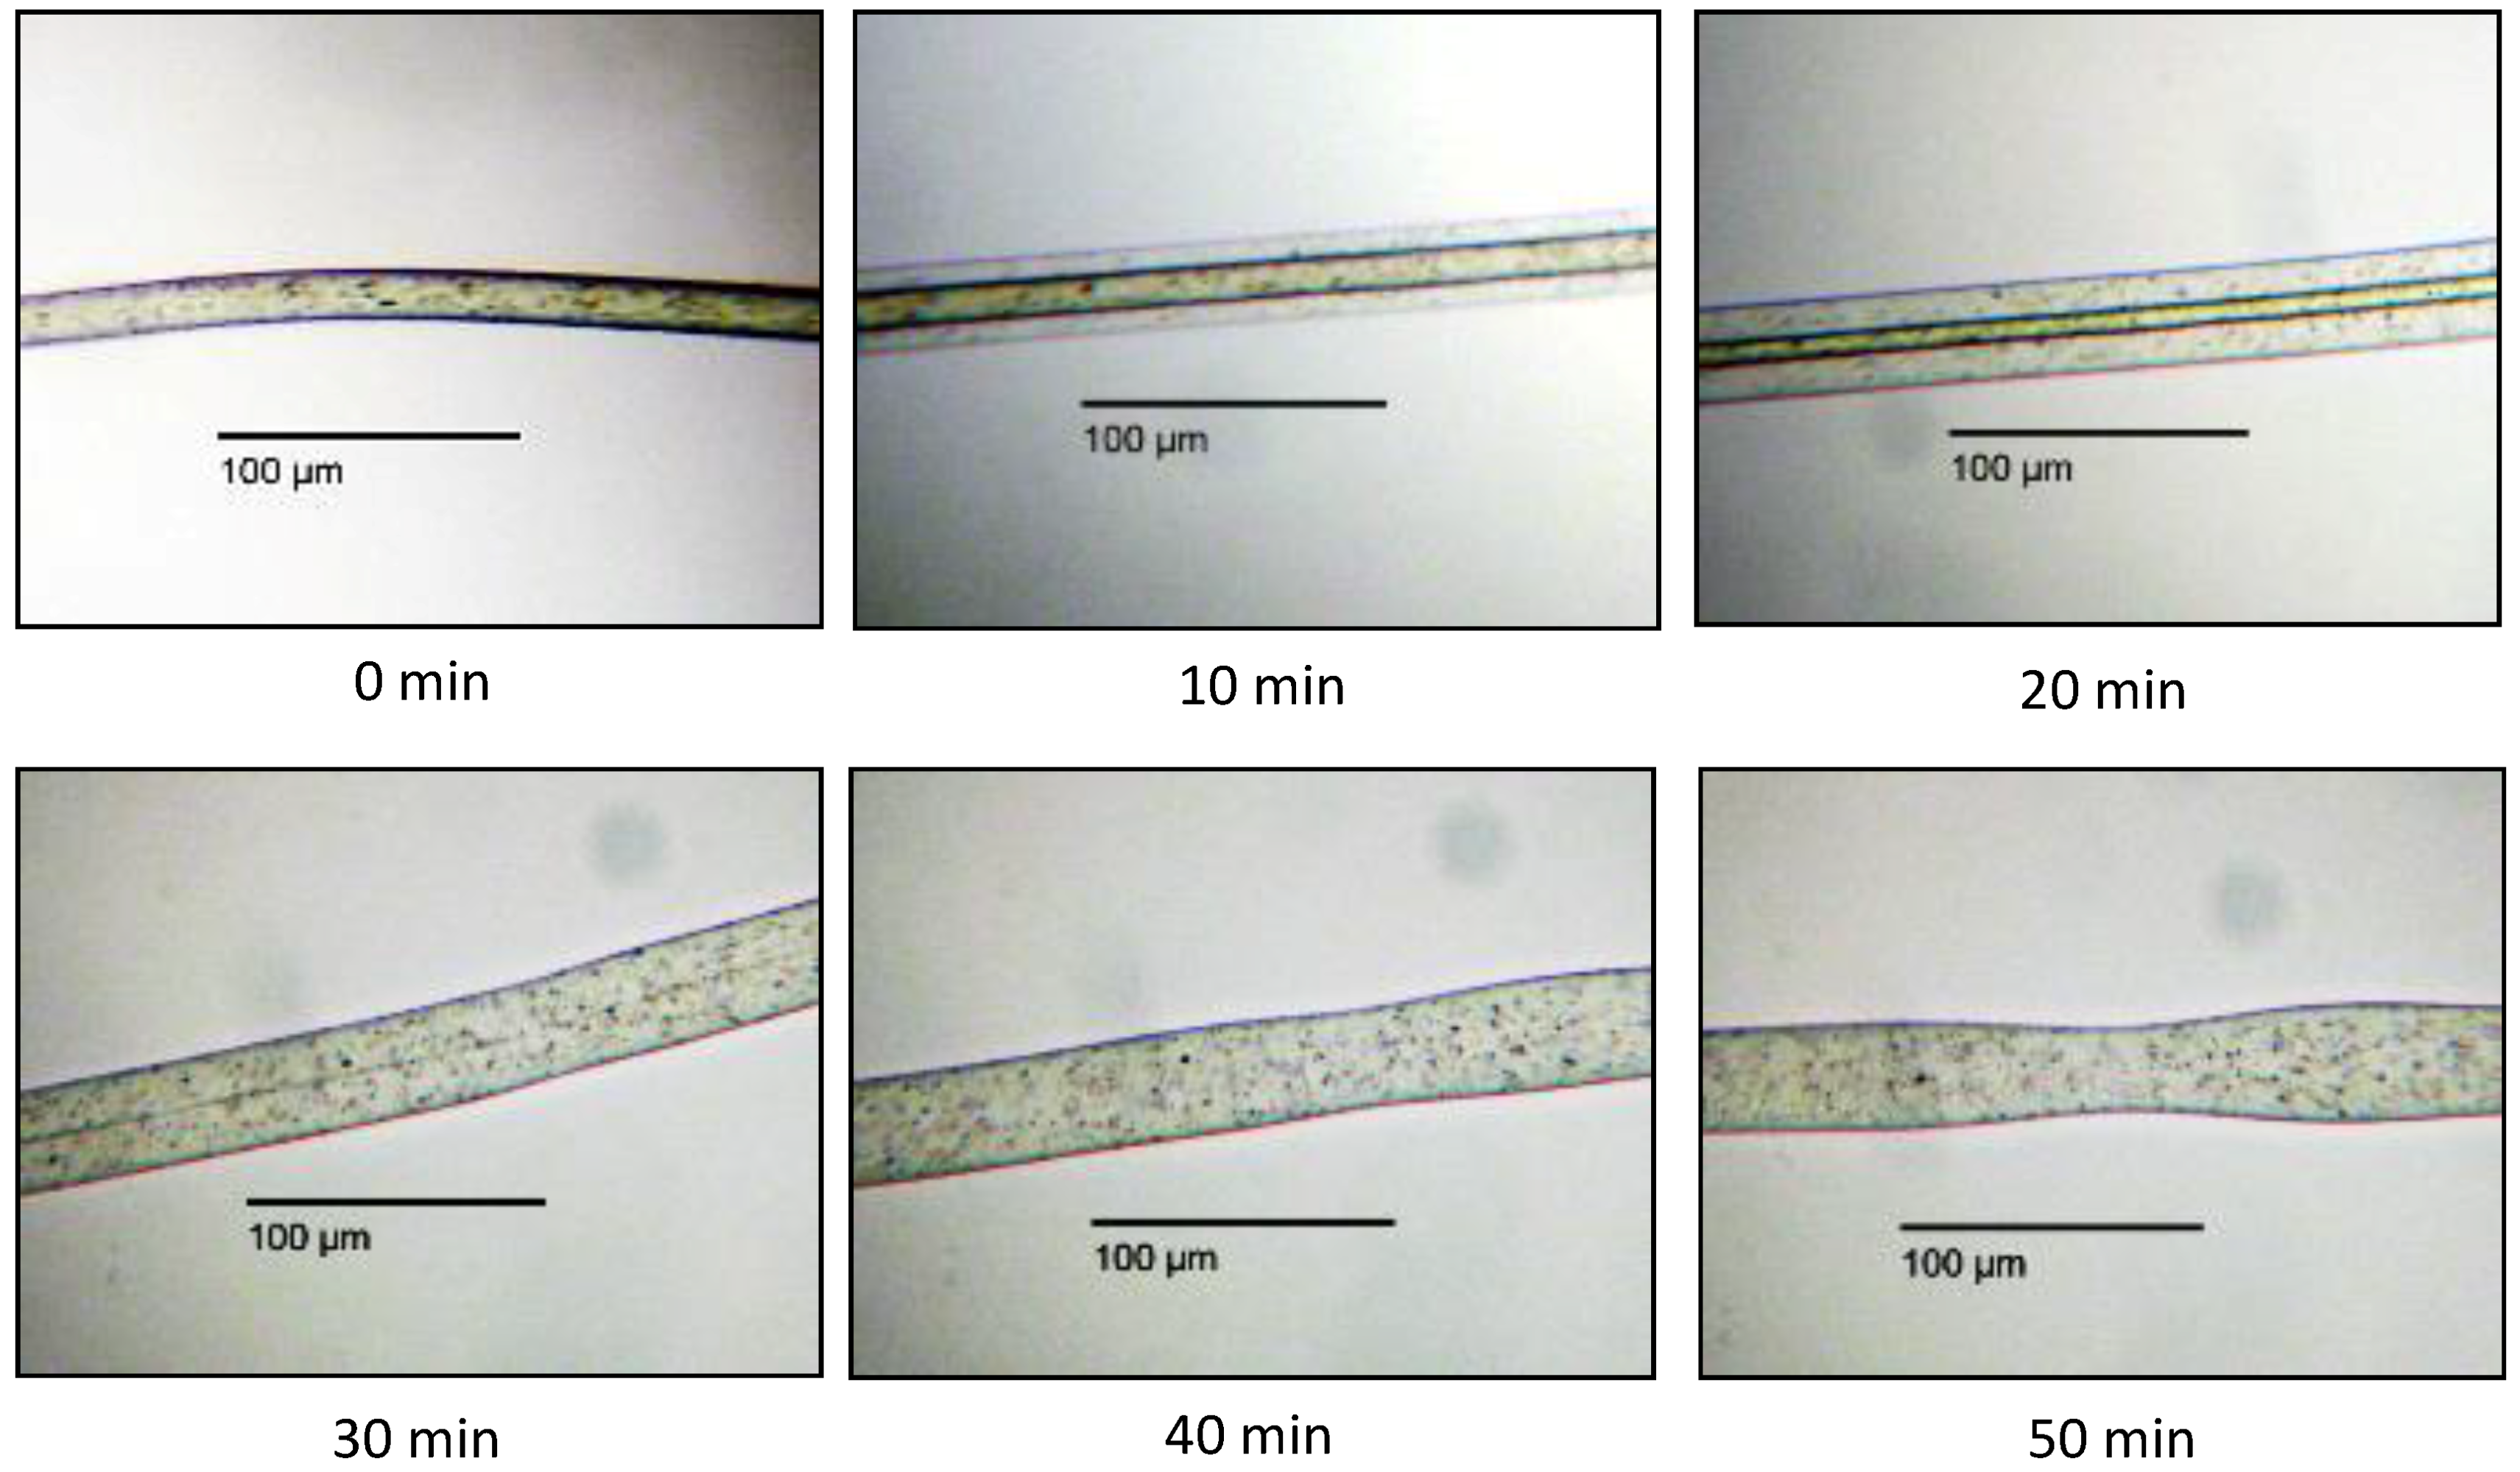
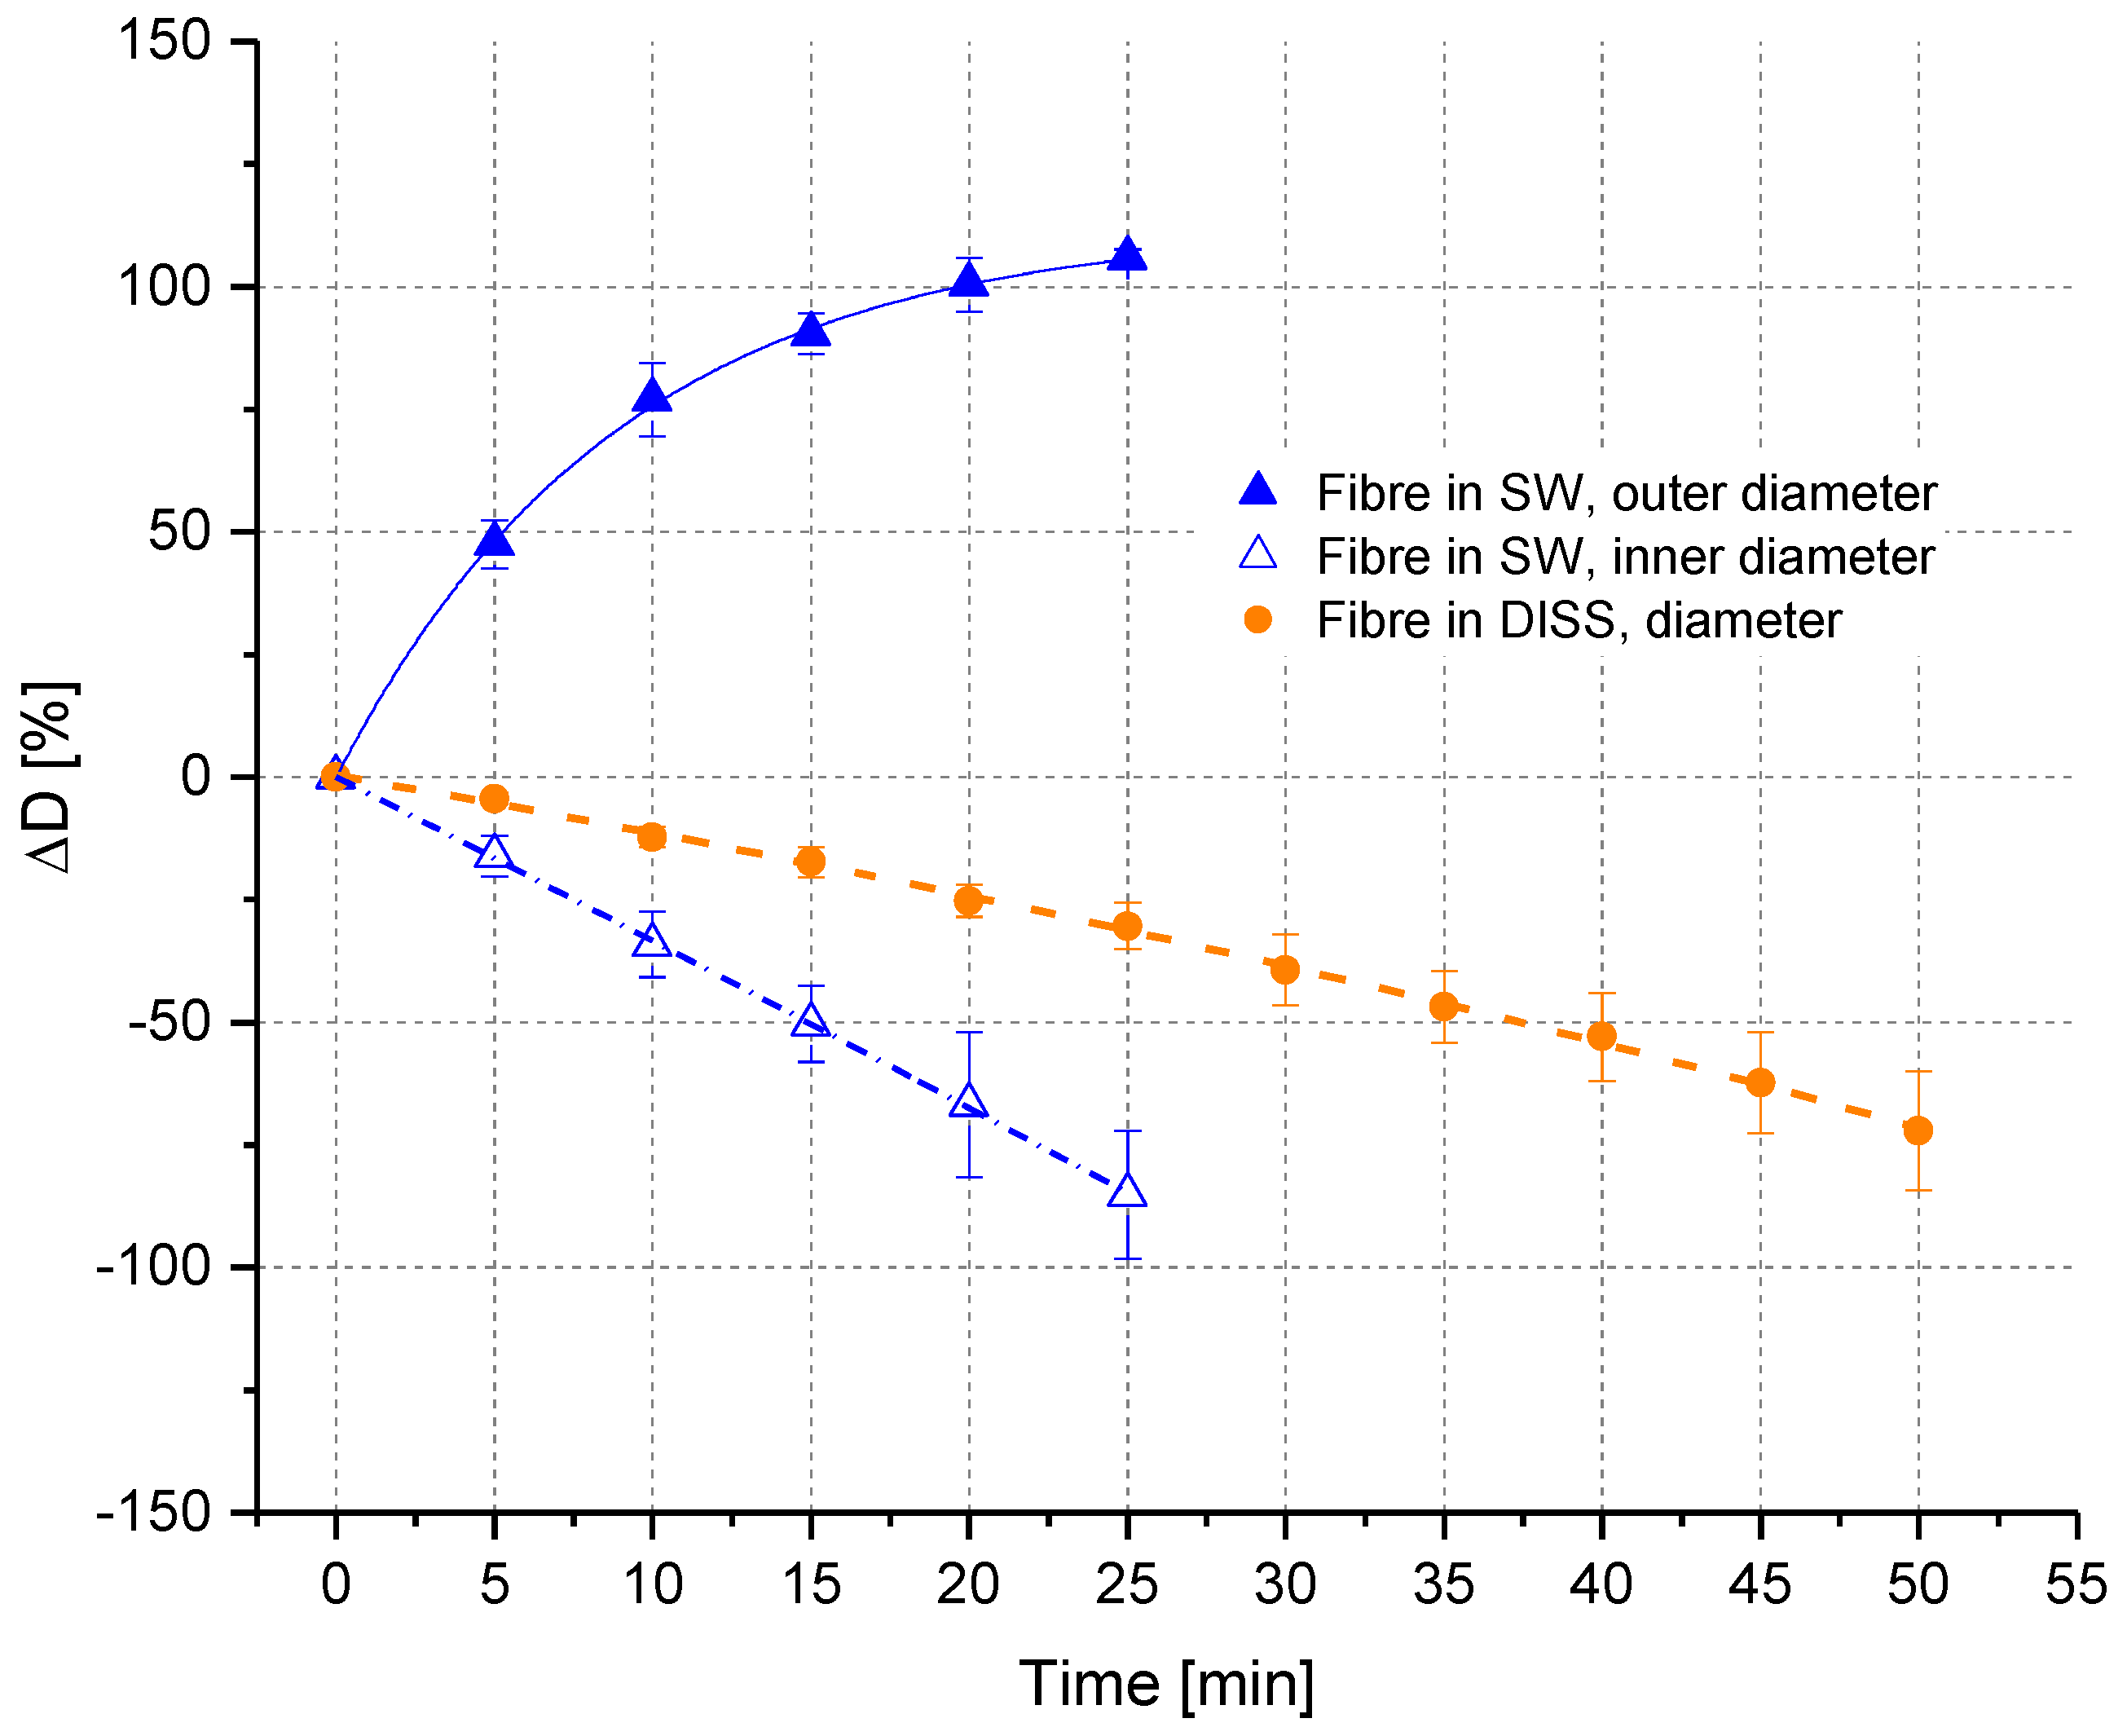
3.2.1. In Situ Swelling and Dissolution Experiments
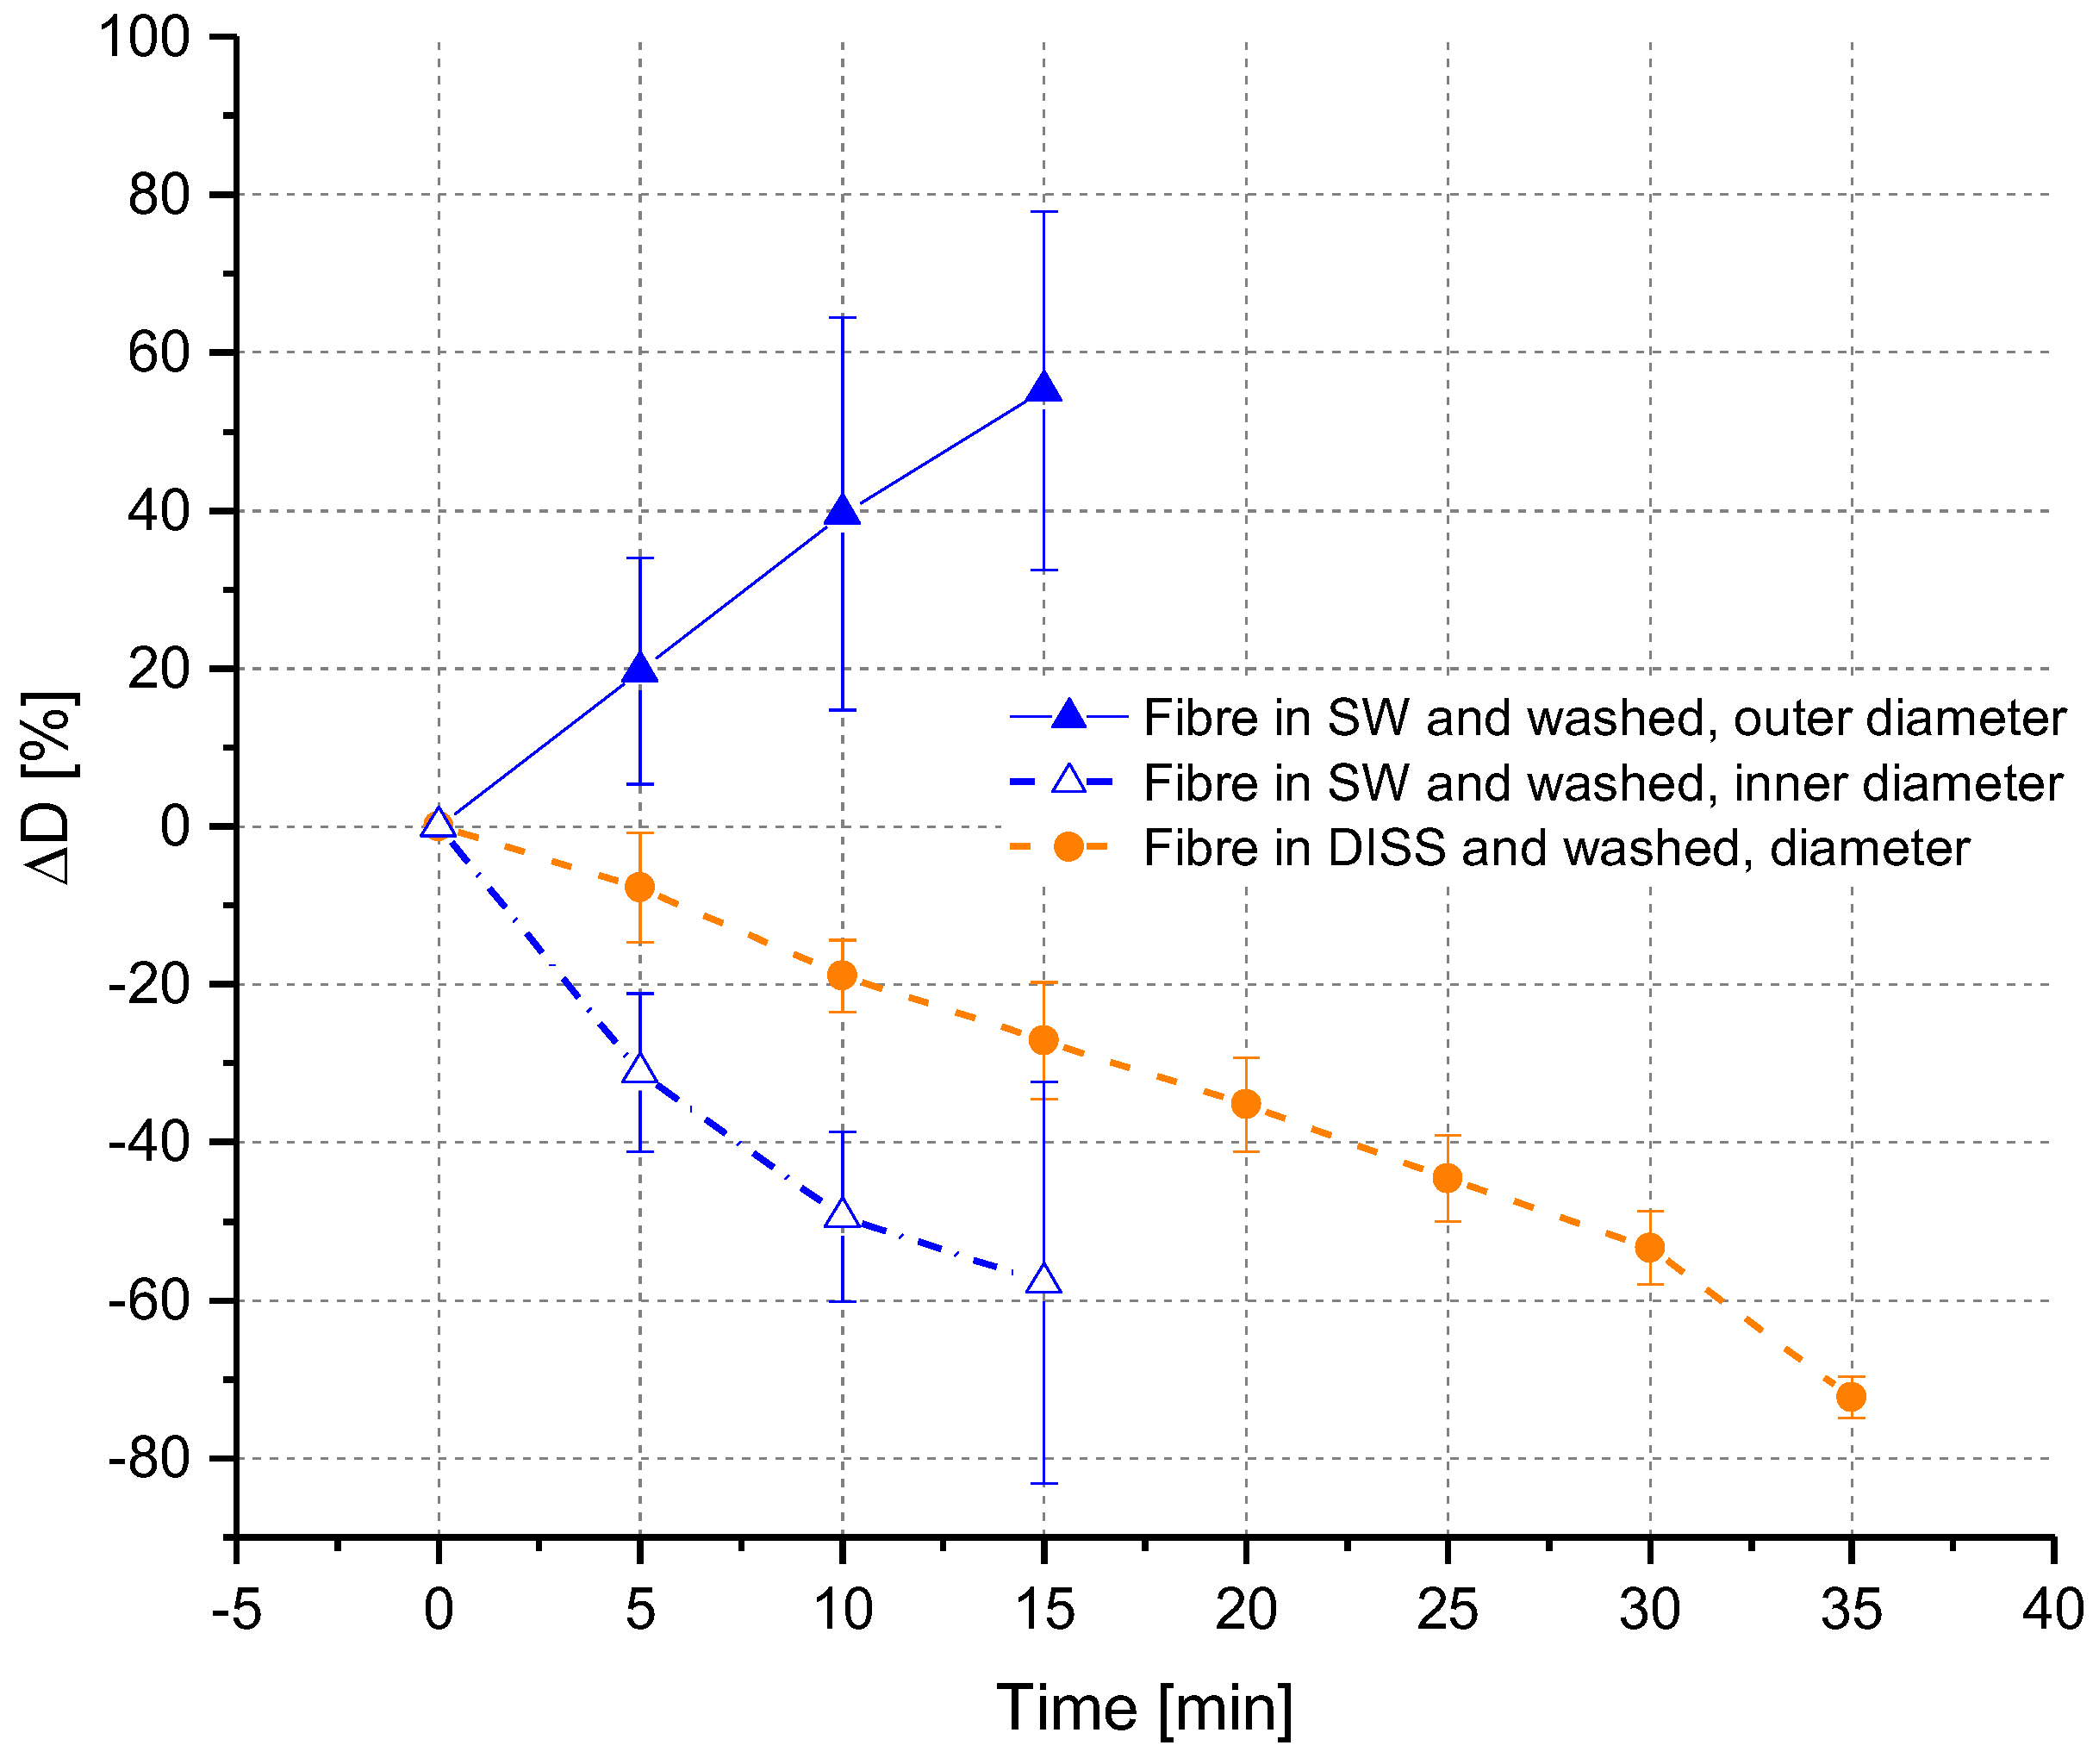
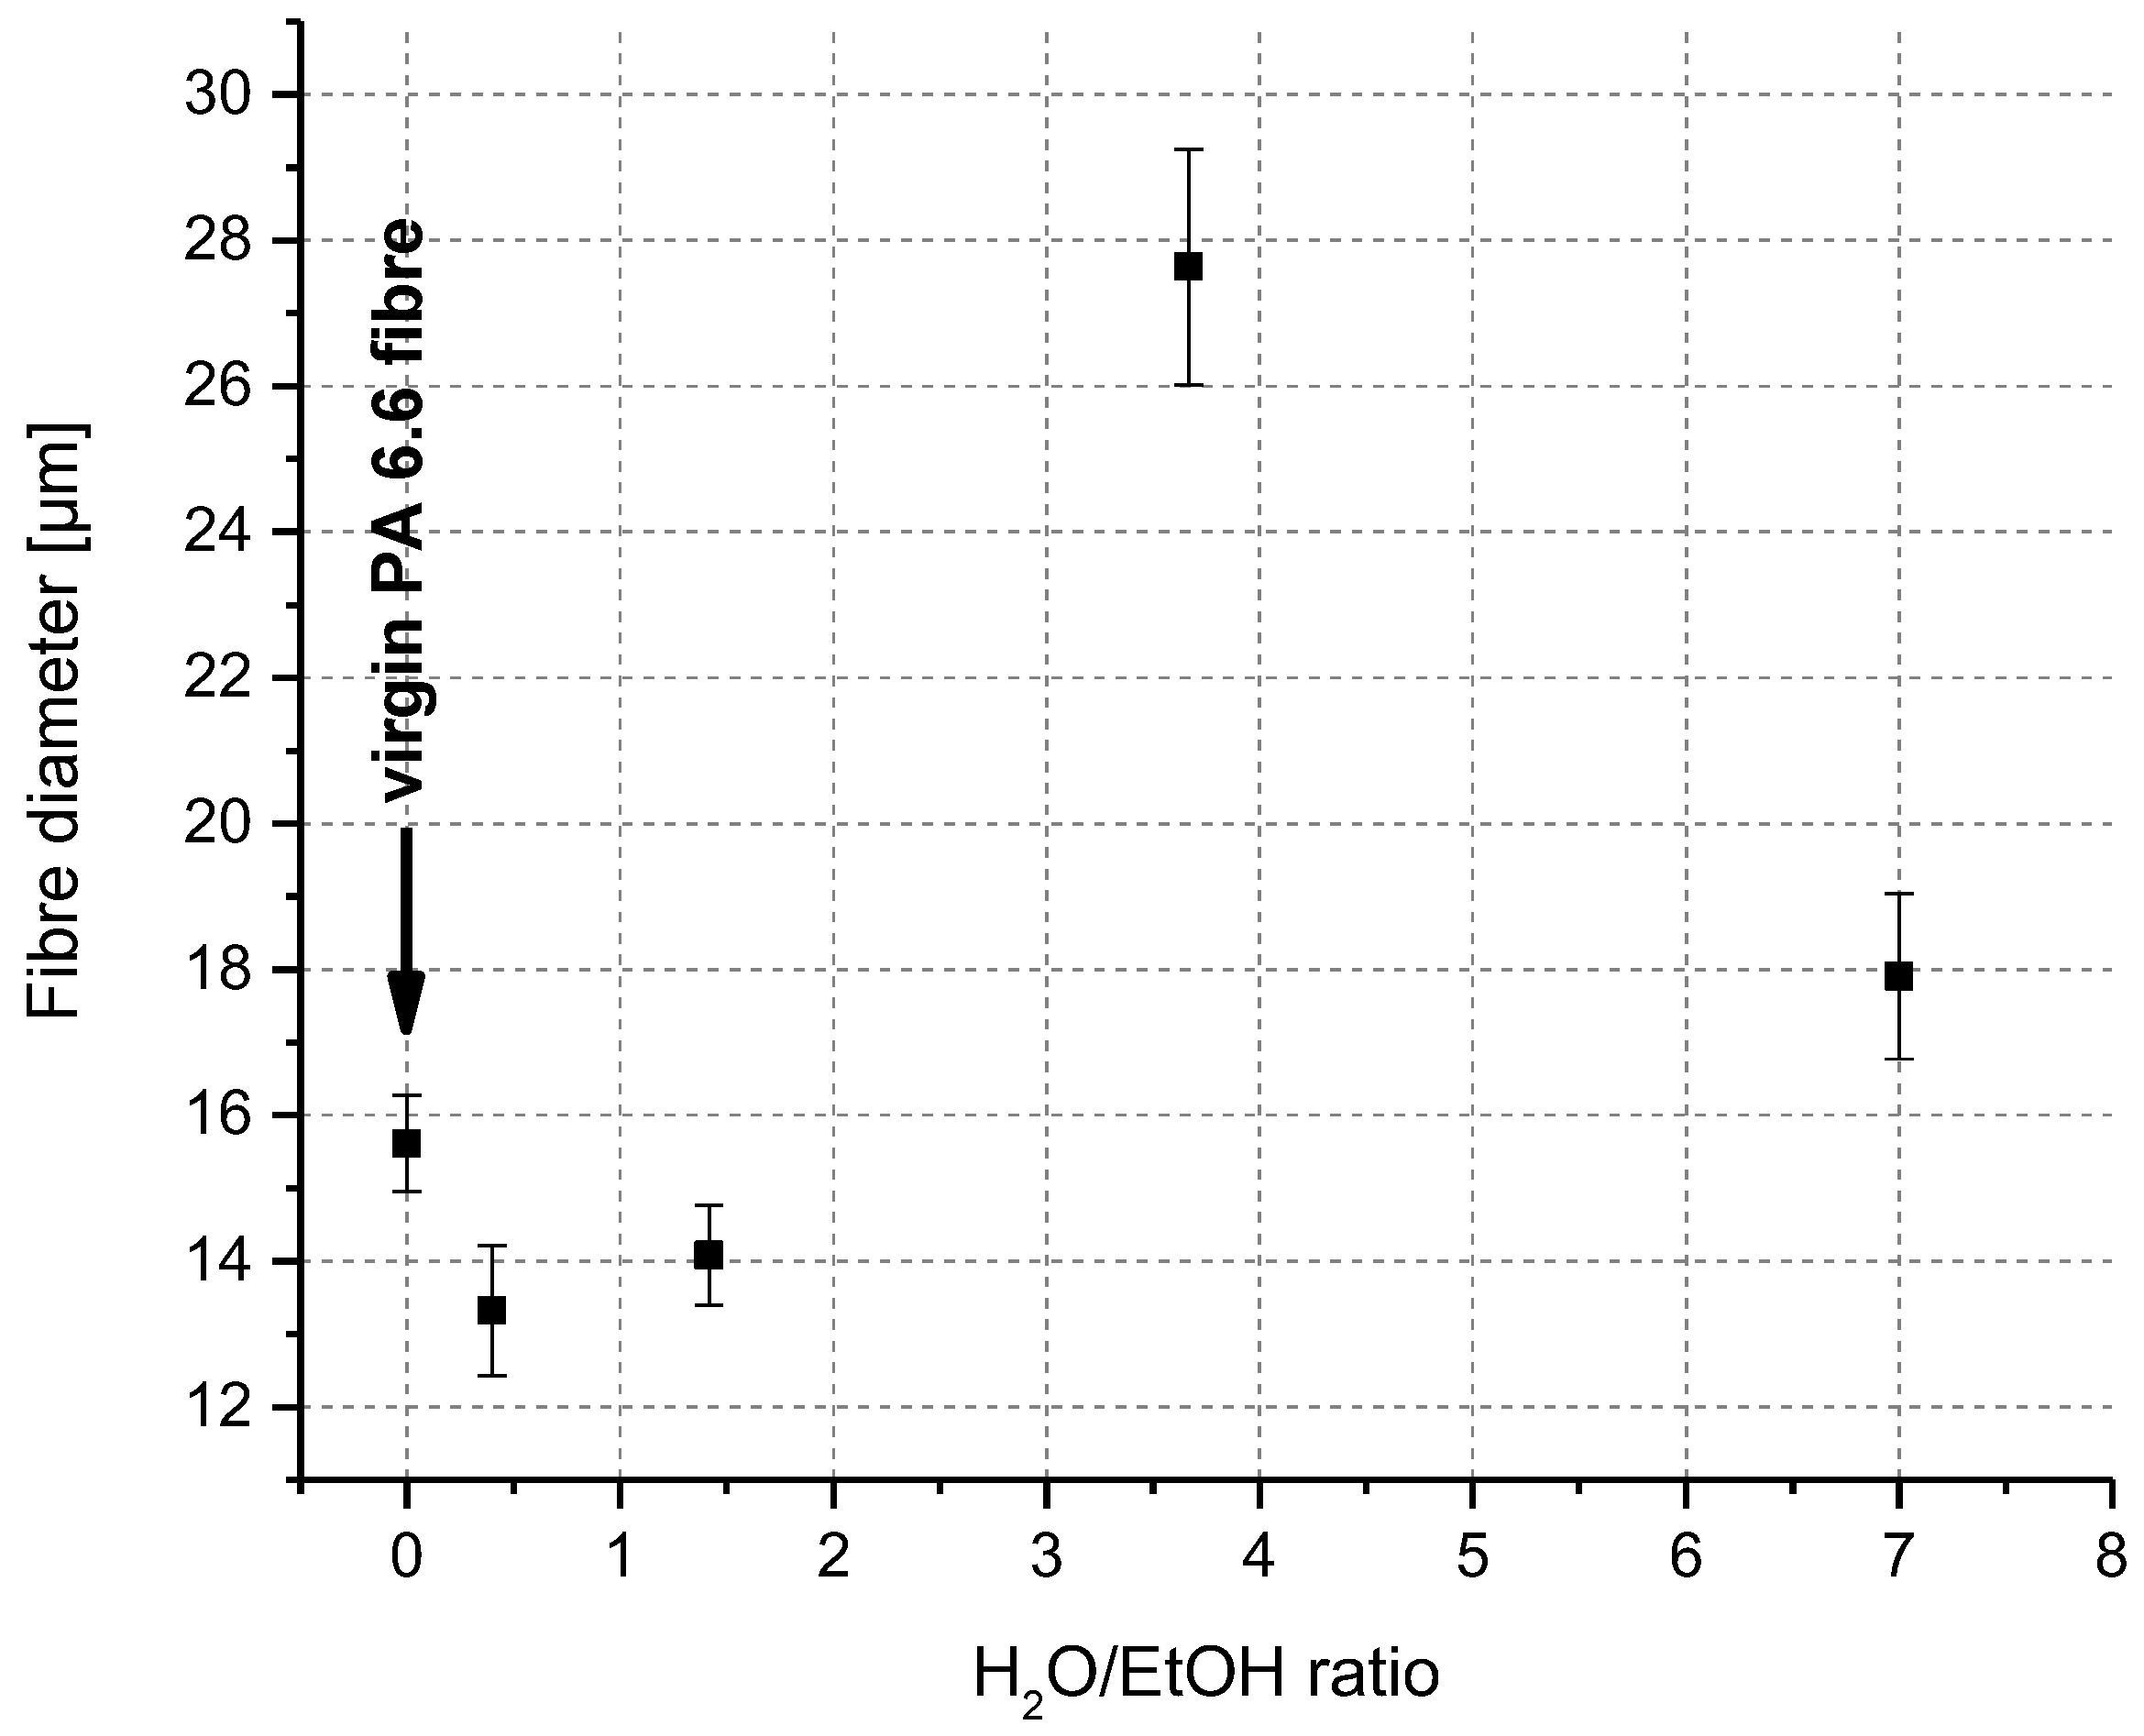
3.2.2. Ex Situ Swelling and Dissolution Experiments with a Washing Step
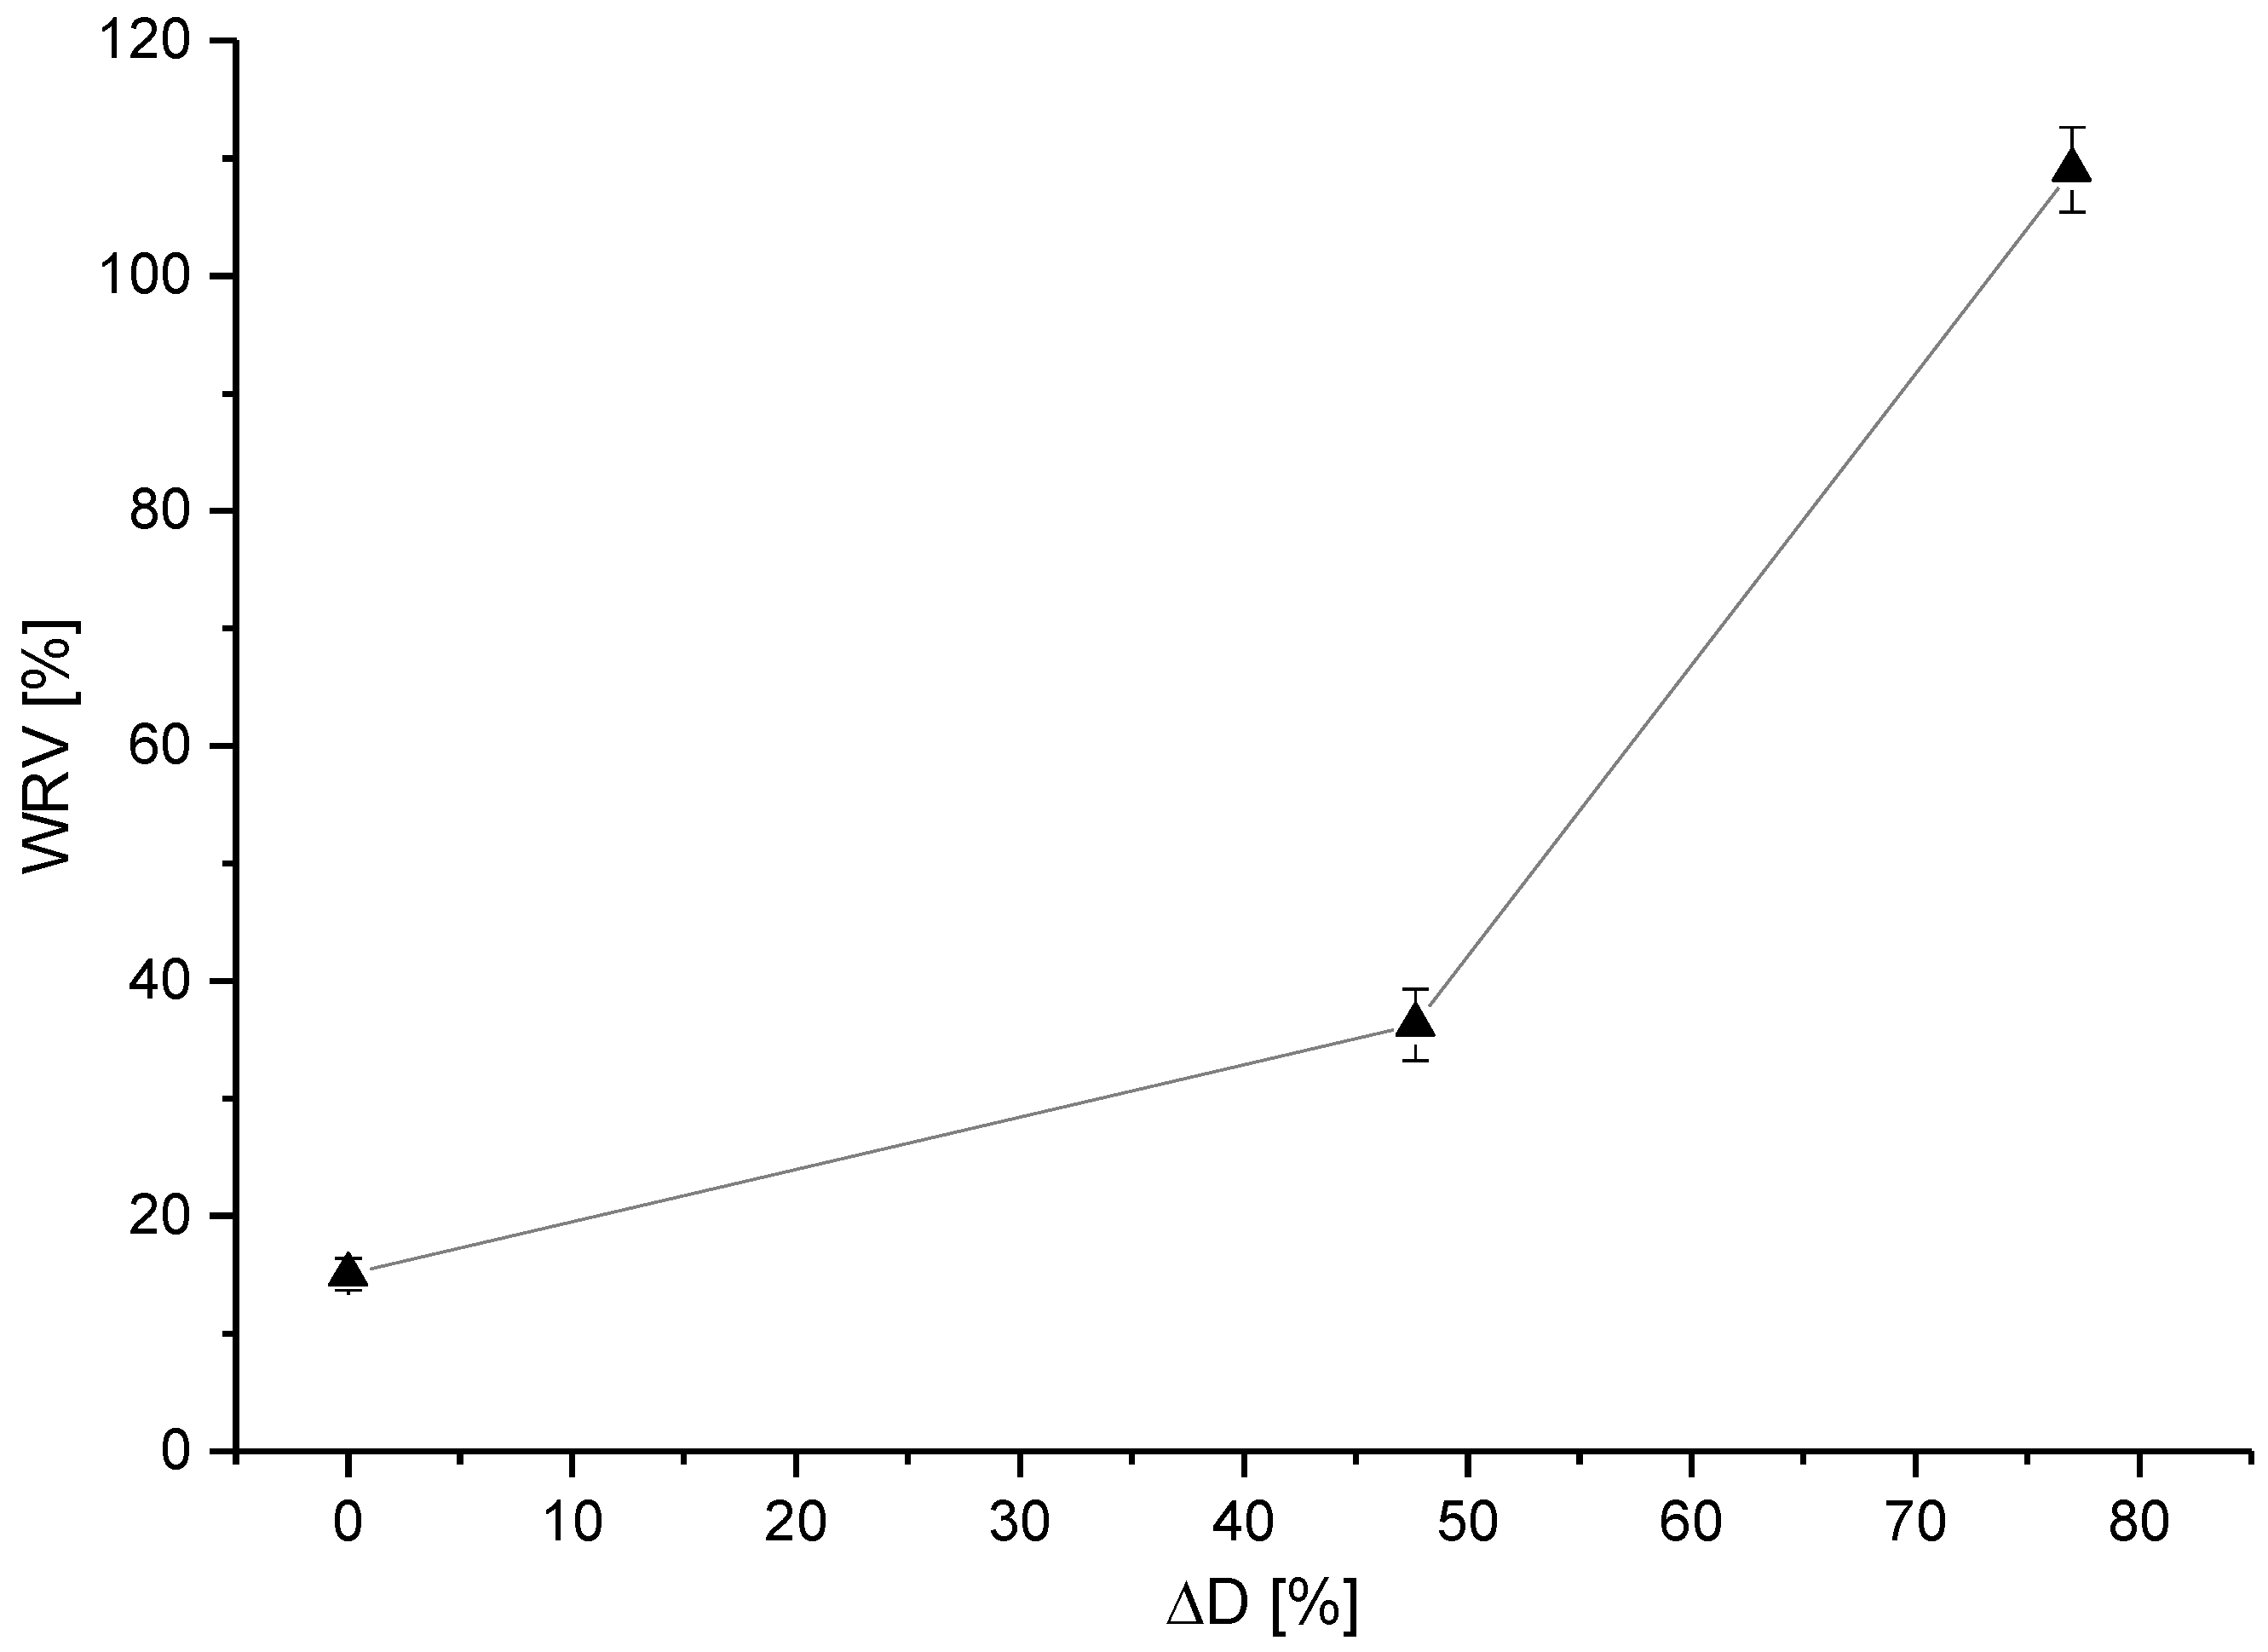
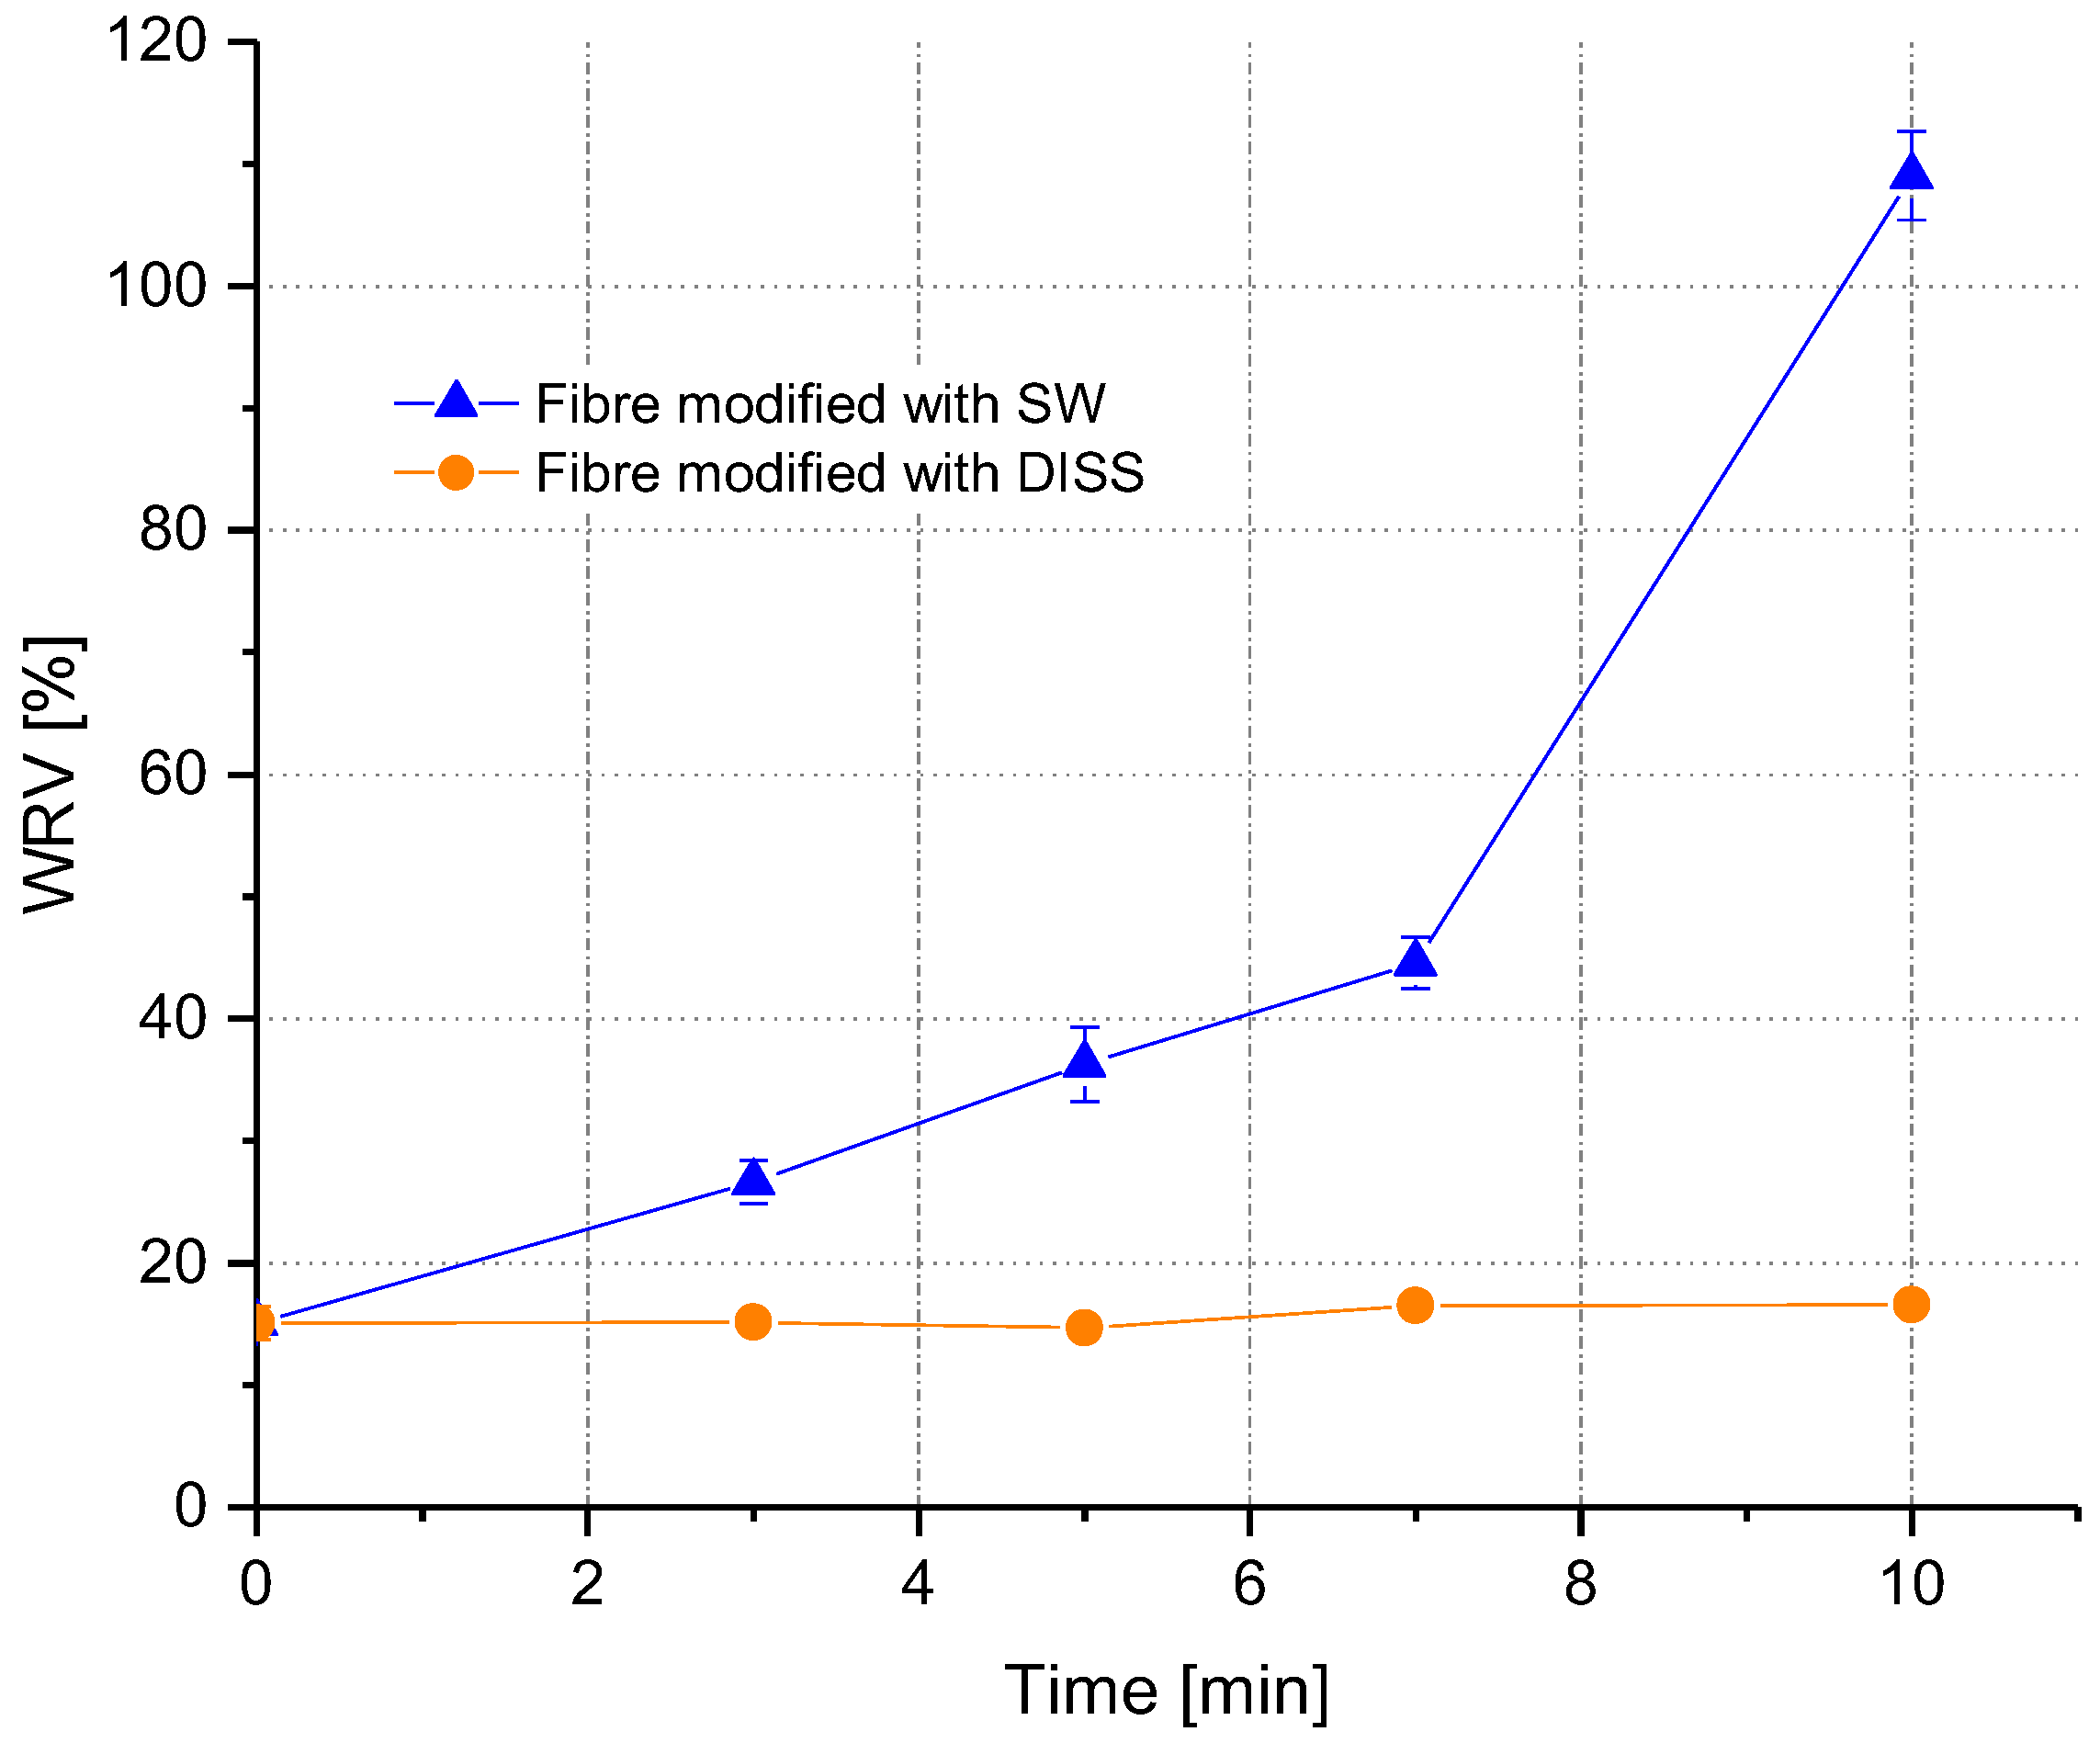
3.3. Liquid Storage Capability
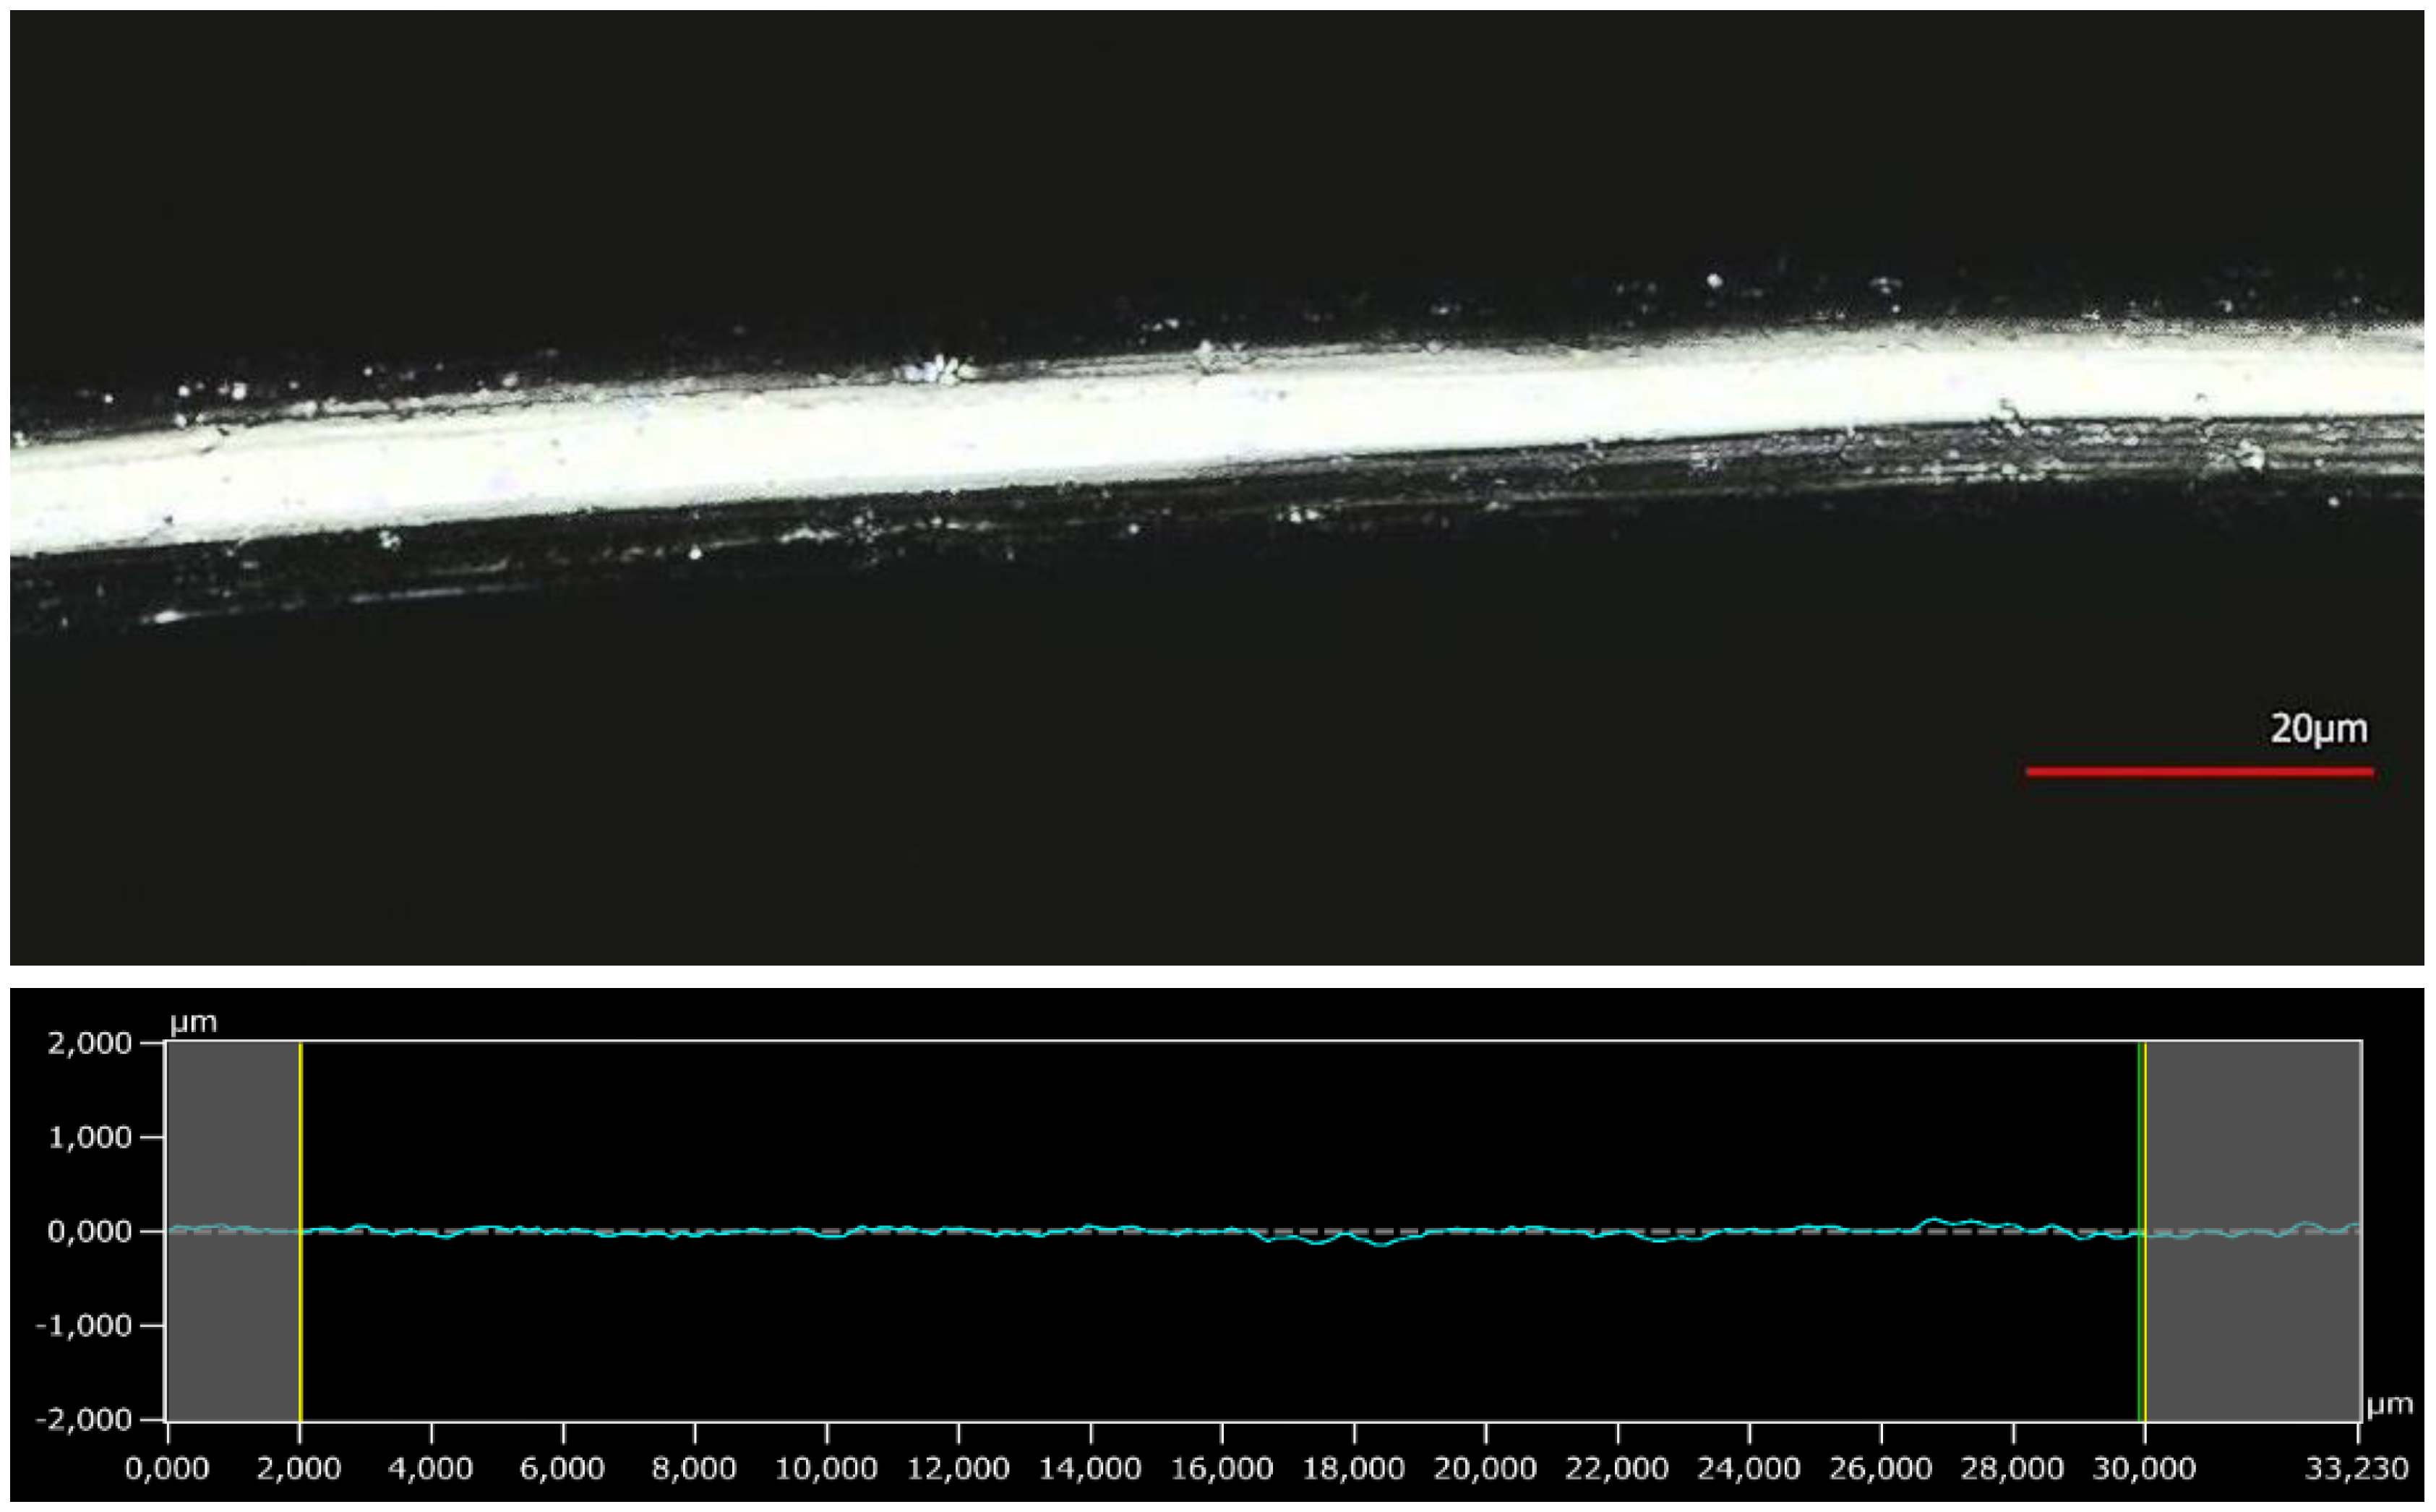
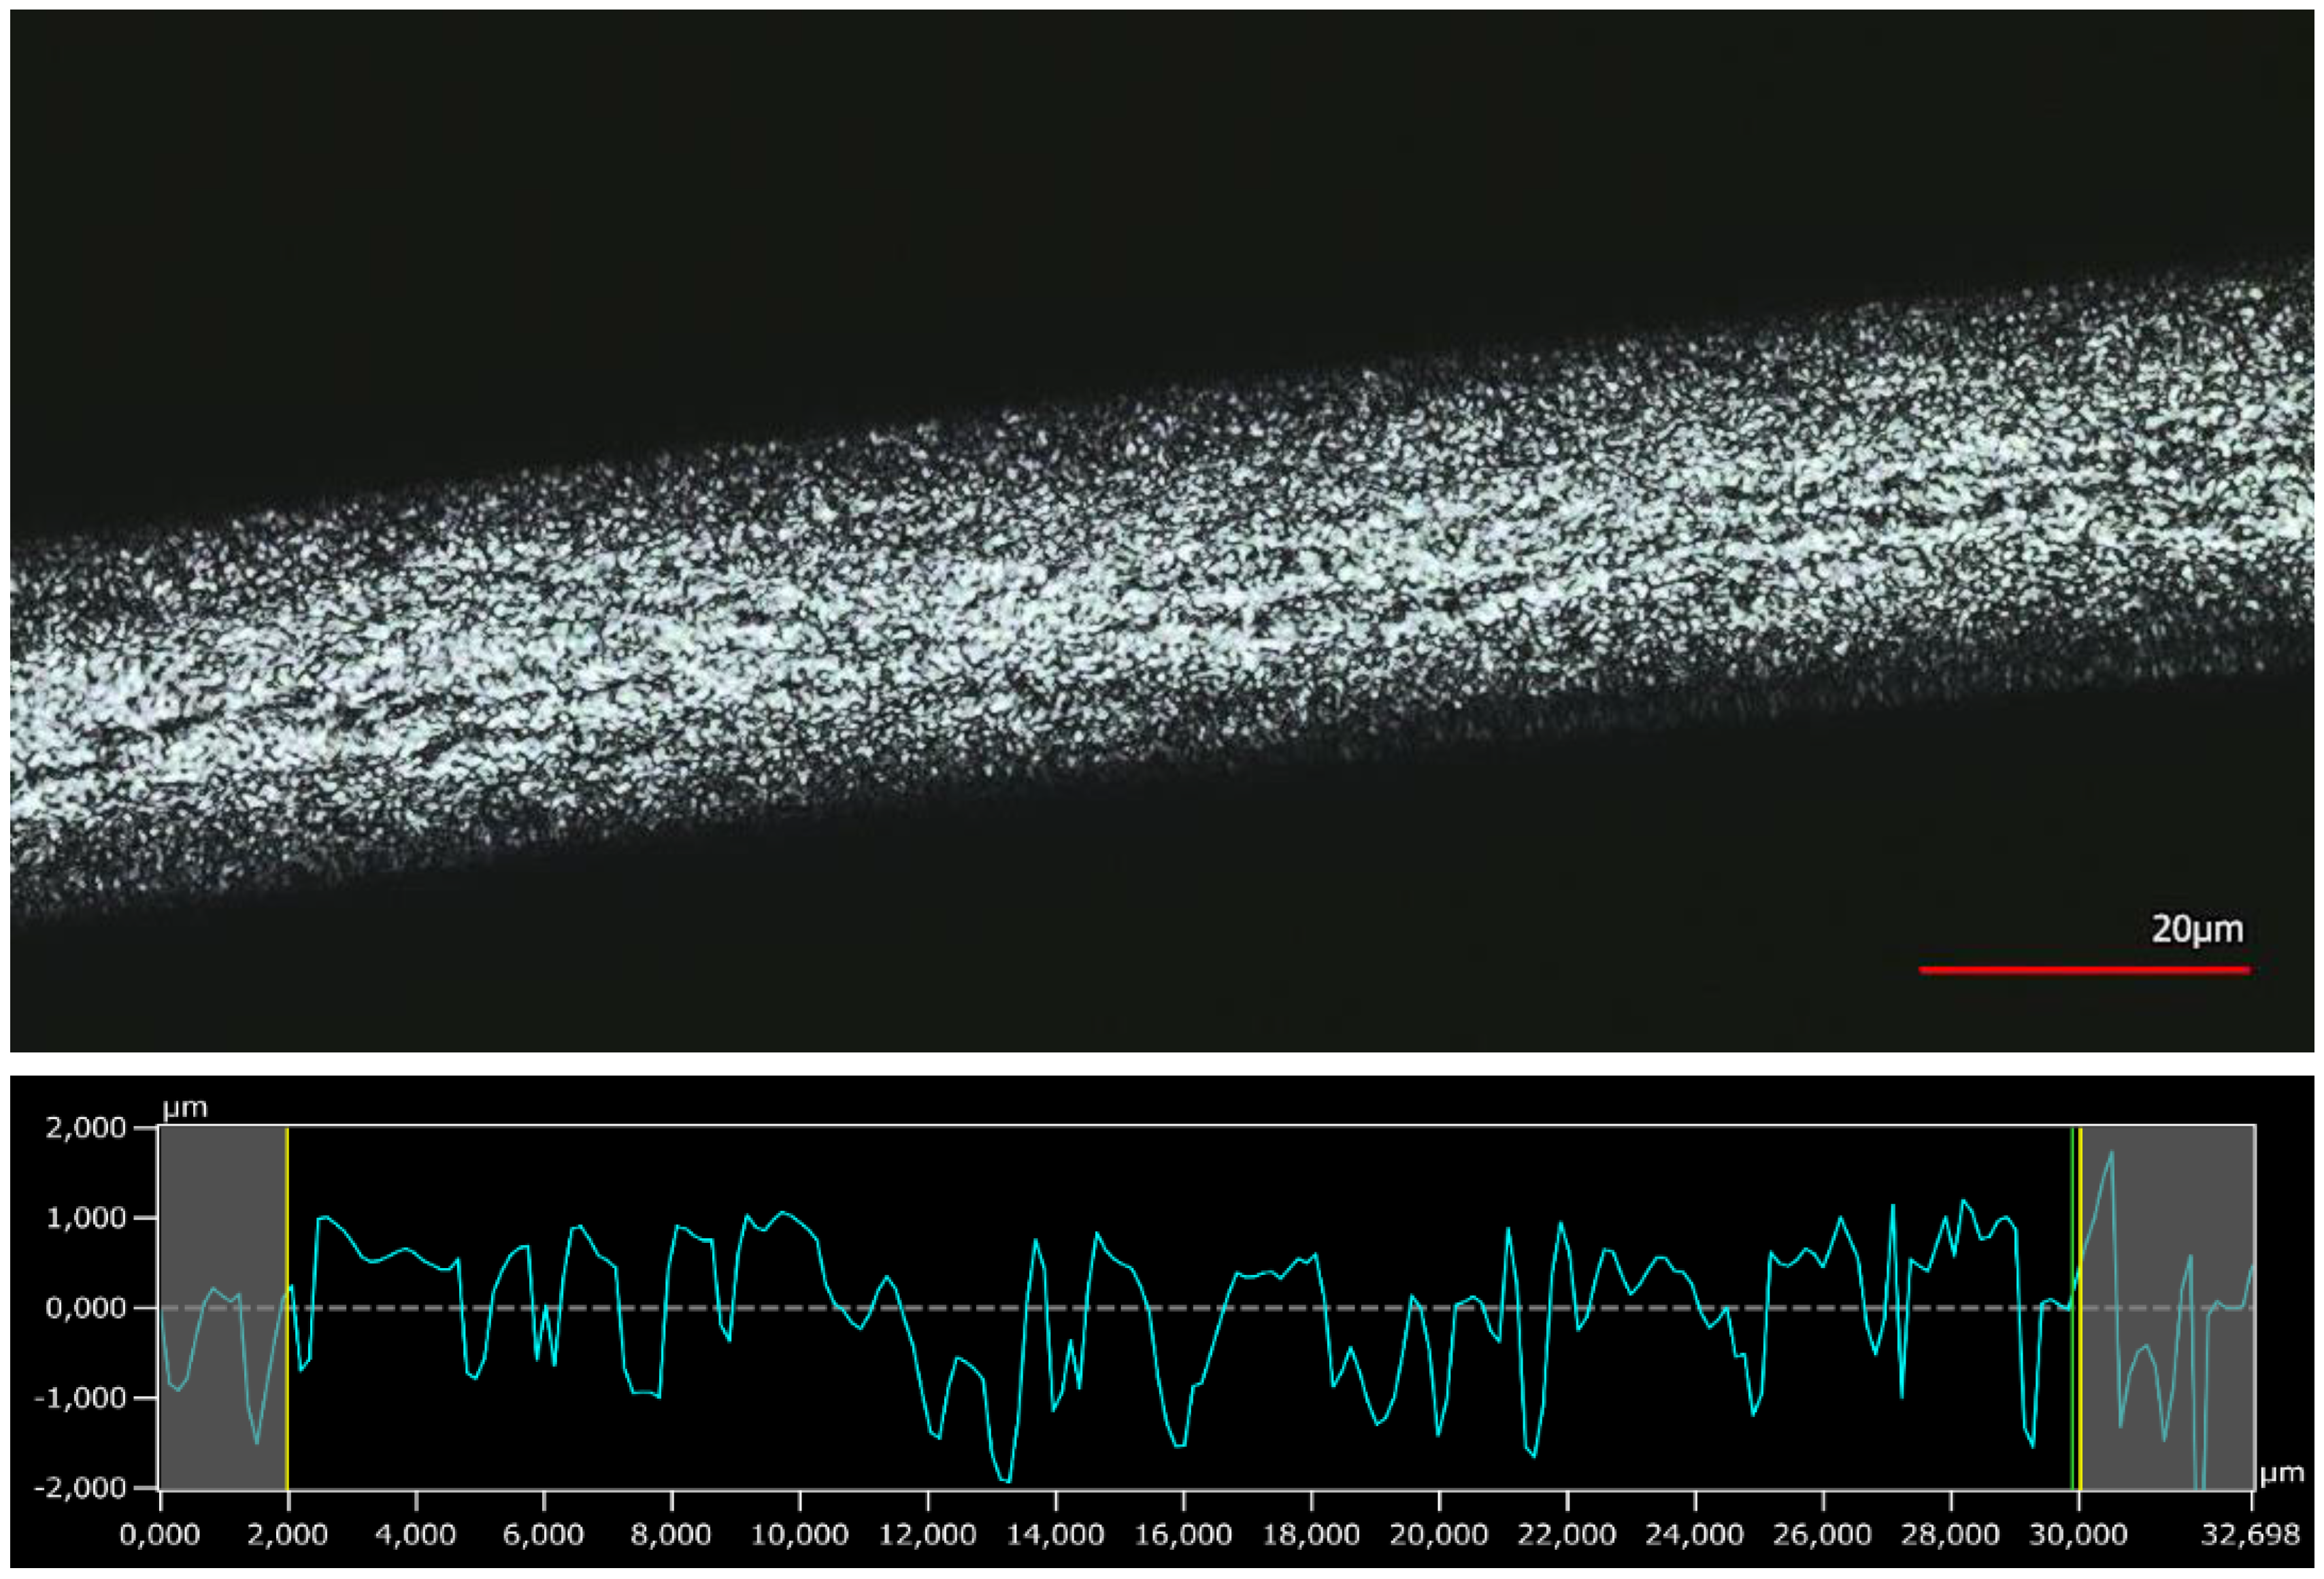
3.4. Surface Analysis by 3D Confocal Laser-Scanning Microscopy
4. Conclusions
Supplementary Materials
Acknowledgments
Author Contributions
Conflicts of Interest
References
- Peng, M.Y.; Li, L.; Xiong, J.; Hua, K.; Wang, S.; Shao, T. Study on surface properties of polyamide 66 using atmospheric Gglow-like discharge plasma treatment. Coatings 2017, 7, 123. [Google Scholar] [CrossRef]
- Clarke, D.; Tyuftin, A.A.; Cruz-Romero, M.C.; Bolton, D.; Fanning, S.; Pankaj, S.K.; Bueno-Ferrer, C.; Cullen, P.J.; Kerry, J.P. Surface attachment of active antimicrobial coatings onto conventional plastic-packaged beef sub-primals. Food Microbiol. 2017, 62, 196–201. [Google Scholar] [CrossRef] [PubMed]
- Zanini, S.; Freti, S.; Citterio, A.; Riccardi, C. Characterization of hydro- and oleo-repellent pure cashmere and wool/nylon textiles obtained by atmospheric pressure plasma pre-treatment and coating with a fluorocarbon resin. Surf. Coat. Tech. 2016, 292, 155–160. [Google Scholar] [CrossRef]
- Kim, J.; Kim, H.-S.; Park, C.H. Contribution of surface energy and roughness to the wettability of polyamide 6 and polypropylene film in the plasma-induced process. Text. Res. J. 2016, 86, 461–471. [Google Scholar] [CrossRef]
- Li, L.; Peng, M.Y.; Teng, Y.; Gao, G. Diffuse plasma treatment of polyamide 6.6 fabric in atmospheric pressure air. Appl. Surf. Sci. 2016, 362, 348–354. [Google Scholar] [CrossRef]
- Schäfer, J.; Hofmann, T.; Holtmannspötter, J.; Frauenhofer, M.; von Czarnecki, J.; Gudladt, H.J. Atmospheric-pressure plasma treatment of polyamide 6 composites for bonding with polyurethane. J. Adhes. Sci. Technol. 2015, 29, 1807–1819. [Google Scholar] [CrossRef]
- Cui, N.Y.; Upadhyay, D.J.; Anderson, C.A.; Brown, N.M.D. Study of the surface modification of a Nylon 6.6 film processed in an atmospheric pressure air dielectric barrier discharge. Surf. Coat. Tech. 2005, 192, 94–100. [Google Scholar] [CrossRef]
- Yu, H.Y.; Kang, Y.; Liu, Y.; Mi, B. Grafting polyzwitterions onto polyamide by click chemistry and nucleophilic substitution on nitrogen: A novel approach to enhance membrane fouling resistance. J. Memb. Sci. 2014, 449, 50–57. [Google Scholar] [CrossRef]
- Zhao, Q.; Gu, X.; Zhang, S.; Dong, M.; Jiang, P.; Hu, Z. Surface modification of polyamide 6.6 fabric by microwave induced grafting with 2-hydroxyethyl methacrylate. Surf. Coat. Tech. 2014, 240, 197–203. [Google Scholar] [CrossRef]
- Shen, J.; Li, Y.; Zuo, Y.; Zou, Q.; Li, J.; Huang, D.; Wang, X. Characterization and cytocompatibility of surface modified polyamide 6.6. J. Biomed. Mater. Res. B 2009, 91B, 897–904. [Google Scholar] [CrossRef] [PubMed]
- Kanelli, M.; Vasilakos, S.; Ladas, S.; Symianakis, E.; Christakopoulos, P.; Topakas, E. Surface modification of polyamide 6.6 fibers by enzymatic hydrolysis. Process Biochem. A 2017, 59, 97–103. [Google Scholar] [CrossRef]
- Periyasamy, S.; Krishna Prasad, G.; Chattopadhyay, S.K.; Raja, A.S.M.; Raj Kumar, K.; Jagadale, S. Micro-roughening of polyamide fabric using protease enzyme for improving adhesion strength of rubber-polyamide composite. J. Polym. Eng. 2017, 37, 297–306. [Google Scholar] [CrossRef]
- Roberts, M.; Jenekhe, S. Lewis Acid Complexation of polymers: Gallium chloride complex of nylon 6. Chem. Mater. 1990, 2, 224–226. [Google Scholar] [CrossRef]
- Roberts, M.; Jenekhe, S. Site-specific reversible scission of hydrogen bonds in polymers: An investigation of polyamides and their Lewis acid-base complexes by infrared spectroscopy. Macromolecules 1991, 24, 3142–3146. [Google Scholar] [CrossRef]
- Vasanthan, N.; Kotek, R.; Jung, W.W.; Shin, D.; Tonelli, A.E.; Salem, D.R. Lewis acid–base complexation of polyamide 6.6 to control hydrogen bonding, extensibility and crystallinity. Polymer 2004, 45, 4077–4085. [Google Scholar] [CrossRef]
- Afshari, M.; Gupta, A.; Jung, D.; Kotek, R.; Tonelli, A.E.; Vasanthan, N. Properties of films and fibers obtained from Lewis acid–base complexed nylon 6.6. Polymer 2008, 49, 1297–1304. [Google Scholar] [CrossRef]
- Wu, Y.; Xu, Y.; Wang, D.; Zhao, Y.; Weng, S.; Xu, D.; Wu, J. FT-IR spectroscopic investigation on the interaction between nylon 6.6 and lithium salts. J. Appl. Polym. Sci. 2004, 91, 2869–2875. [Google Scholar] [CrossRef]
- Hattori, M.; Saito, M.; Okajima, K.; Kamide, K. Molecular Characterization of Nylon 6.6 and Its Dissolved State in Mixture of Calcium Chloride and Methanol. Polym. J. 1995, 27, 631–644. [Google Scholar] [CrossRef]
- Hattori, M.; Saito, M. Thermal Geleation of the Nylon 6.6-Calcium Chloride-Methanol System. Polym. J. 1996, 28, 139–144. [Google Scholar] [CrossRef]
- Wyzgoski, M.; Novak, G. Stress cracking of nylon polymers in aqueous salt solutions, Part 2. J. Mater. Sci. 1987, 22, 1715–1723. [Google Scholar] [CrossRef]
- Li, C.; Zhen, Q.; Luo, Z.; Lu, S. Effect of calcium chloride on the surface properties of Kevlar fiber. J. Appl. Polym. Sci. 2015, 132, 41358. [Google Scholar] [CrossRef]
- Liu, S.; Zhang, C.; Proniewicz, E.; Proniewicz, L.M.; Kim, Y.; Liu, J.; Zhao, Y.; Xu, Y.; Wu, J. Crystalline transition and morphology variation of polyamide 6/CaCl2 composite during the decomplexation process. Spectrochim. Acta A. 2015, 115, 783–788. [Google Scholar] [CrossRef] [PubMed]
- Dhevi, D.M.; Choi, C.W.; Prabu, A.A.; Kim, K.J. Deterioration in mechanical properties of glass fiber-reinforced nylon 6.6 composites by aqueous calcium chloride mixture solutions. Polym. Compos. 2009, 30, 481–489. [Google Scholar] [CrossRef]
- Sun, B. Study on the mechanism of nylon 6.6 dissolving process using CaCl2/MeOH as the solvent. Chin. J. Polym. Sci. 1994, 12, 57–65. [Google Scholar]
- Miller-Chou, B.A.; Koenig, J.L. A review of polymer dissolution. Prog. Polym. Sci. 2003, 28, 1223–1270. [Google Scholar] [CrossRef]
- Cuissinat, C.; Navard, P. Swelling and dissolution of cellulose, part I: Free floating cotton and wood fibres in N-methylmorpholine-N-oxide–water mixtures. Macromol. Symp. 2006, 244, 1–18. [Google Scholar] [CrossRef]
- Cuissinat, C.; Navard, P. Swelling and dissolution of cellulose, part II: Free floating cotton and wood fibres in NaOH–water–additives systems. Macromol. Symp. 2006, 244, 19–30. [Google Scholar] [CrossRef]
- Rietzler, B.; Bechtold, T.; Pham, T. Polyamide Fibres. Patent Application EP17162290.5, 22 March 2017. [Google Scholar]


| Sample Number | CaCl2 (mol %) | H2O (mol %) | EtOH (mol %) | H2O/EtOH Mole Ratio | Observation |
|---|---|---|---|---|---|
| 1 | 10.00 | 70.00 | 20.00 | 3.50 | swelling |
| 2 | 12.50 | 68.75 | 18.75 | 3.67 | swelling |
| 3 | 13.33 | 73.33 | 13.33 | 5.50 | swelling |
| 4 | 17.16 | 62.13 | 20.71 | 3.00 | swelling |
| 5 | 18.00 | 69.50 | 12.50 | 5.56 | swelling |
| 6 | 11.11 | 77.78 | 11.11 | 7.00 | swelling |
| 7 | 8.33 | 58.33 | 33.33 | 1.75 | dissolving |
| 8 | 12.50 | 56.25 | 31.25 | 1.80 | dissolving |
| 9 | 12.50 | 62.50 | 25.00 | 2.50 | dissolving |
| 10 | 15.20 | 30.40 | 54.40 | 0.56 | dissolving |
| 11 | 15.97 | 49.28 | 34.75 | 1.42 | dissolving |
| 12 | 6.64 | 40.37 | 52.98 | 0.76 | dissolving |
| 13 | 16.50 | 27.00 | 56.50 | 0.48 | dissolving |
| 14 | 12.50 | 12.50 | 75.00 | 0.17 | dissolving |
| 15 | 19.00 | 12.50 | 68.50 | 0.18 | dissolving |
| 16 | 6.25 | 18.75 | 75.00 | 0.25 | dissolving |
| 17 | 12.50 | 25.00 | 62.50 | 0.40 | dissolving |
| 18 | 8.33 | 75.00 | 16.67 | 4.50 | no effect |
| 19 | 8.33 | 66.67 | 25.00 | 2.67 | no effect |
| 20 | 10.00 | 85.00 | 5.00 | 17.00 | no effect |
| 21 | 6.36 | 78.32 | 15.32 | 5.11 | no effect |
| 22 | 3.94 | 48.57 | 47.49 | 1.02 | no effect |
| 23 | 0.00 | 46.01 | 53.99 | 0.85 | no effect |
| 24 | 4.63 | 28.50 | 66.88 | 0.43 | no effect |
| 25 | 4.80 | 22.30 | 72.90 | 0.31 | no effect |
| 26 | 3.70 | 10.00 | 86.30 | 0.12 | no effect |
| Effect of Solvent | CaCl2 (mol %) | EtOH (mol %) | H2O/EtOH Mole Ratio |
|---|---|---|---|
| No effect (area I) | 6 < x < 10 | x ≤ 25 | x > 2.5 |
| No effect (area I) | x < 6 | x > 25 | x < 2.5 |
| Dissolving (area II) | x > 6 | x > 25 | x ≤ 2.5 |
| Swelling (area III) | x > 10 | x < 25 | x > 2.5 |
© 2018 by the authors. Licensee MDPI, Basel, Switzerland. This article is an open access article distributed under the terms and conditions of the Creative Commons Attribution (CC BY) license (http://creativecommons.org/licenses/by/4.0/).
Share and Cite
Rietzler, B.; Bechtold, T.; Pham, T. Controlled Surface Modification of Polyamide 6.6 Fibres Using CaCl2/H2O/EtOH Solutions. Polymers 2018, 10, 207. https://doi.org/10.3390/polym10020207
Rietzler B, Bechtold T, Pham T. Controlled Surface Modification of Polyamide 6.6 Fibres Using CaCl2/H2O/EtOH Solutions. Polymers. 2018; 10(2):207. https://doi.org/10.3390/polym10020207
Chicago/Turabian StyleRietzler, Barbara, Thomas Bechtold, and Tung Pham. 2018. "Controlled Surface Modification of Polyamide 6.6 Fibres Using CaCl2/H2O/EtOH Solutions" Polymers 10, no. 2: 207. https://doi.org/10.3390/polym10020207
APA StyleRietzler, B., Bechtold, T., & Pham, T. (2018). Controlled Surface Modification of Polyamide 6.6 Fibres Using CaCl2/H2O/EtOH Solutions. Polymers, 10(2), 207. https://doi.org/10.3390/polym10020207