Assessment of Axial Behavior of Circular HPFRCC Members Externally Confined with FRP Sheets

Abstract
:
1. Introduction
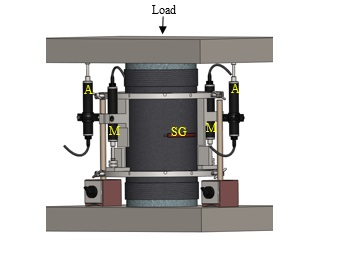
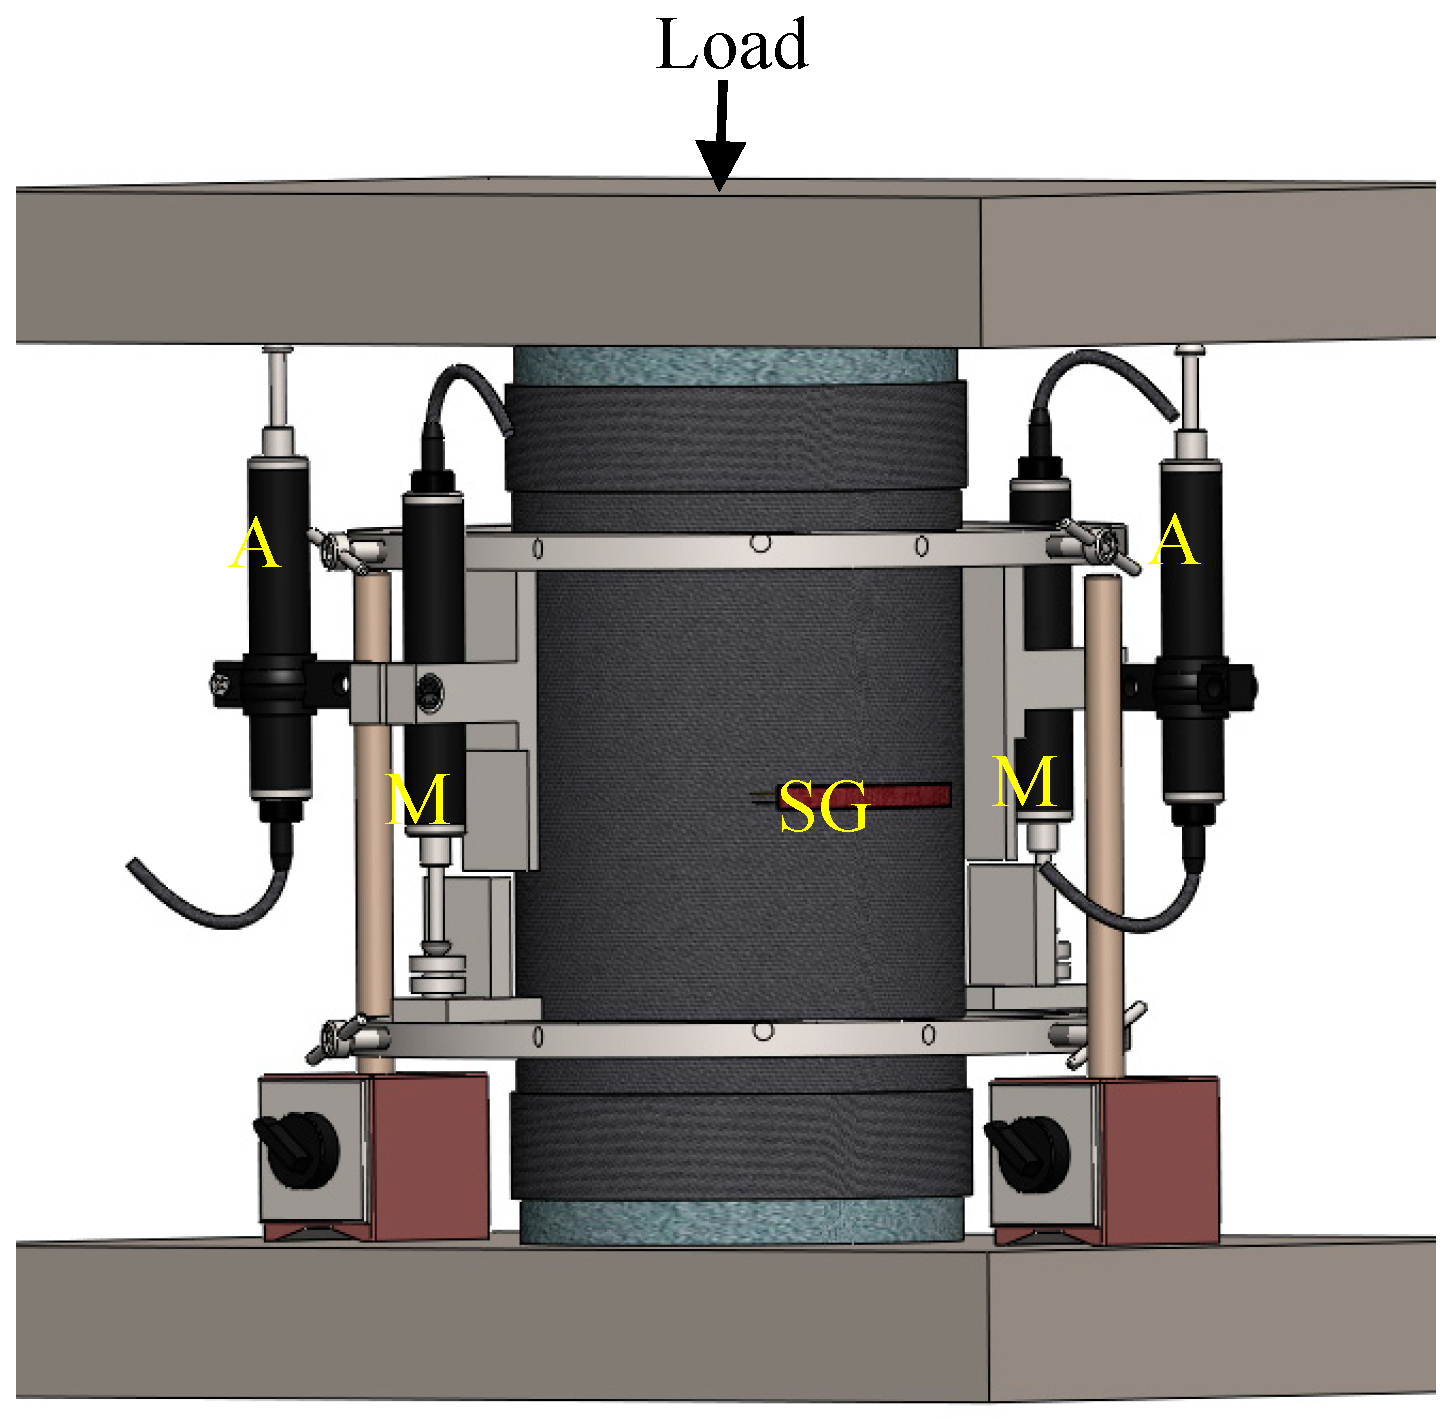
2. Materials and Methods
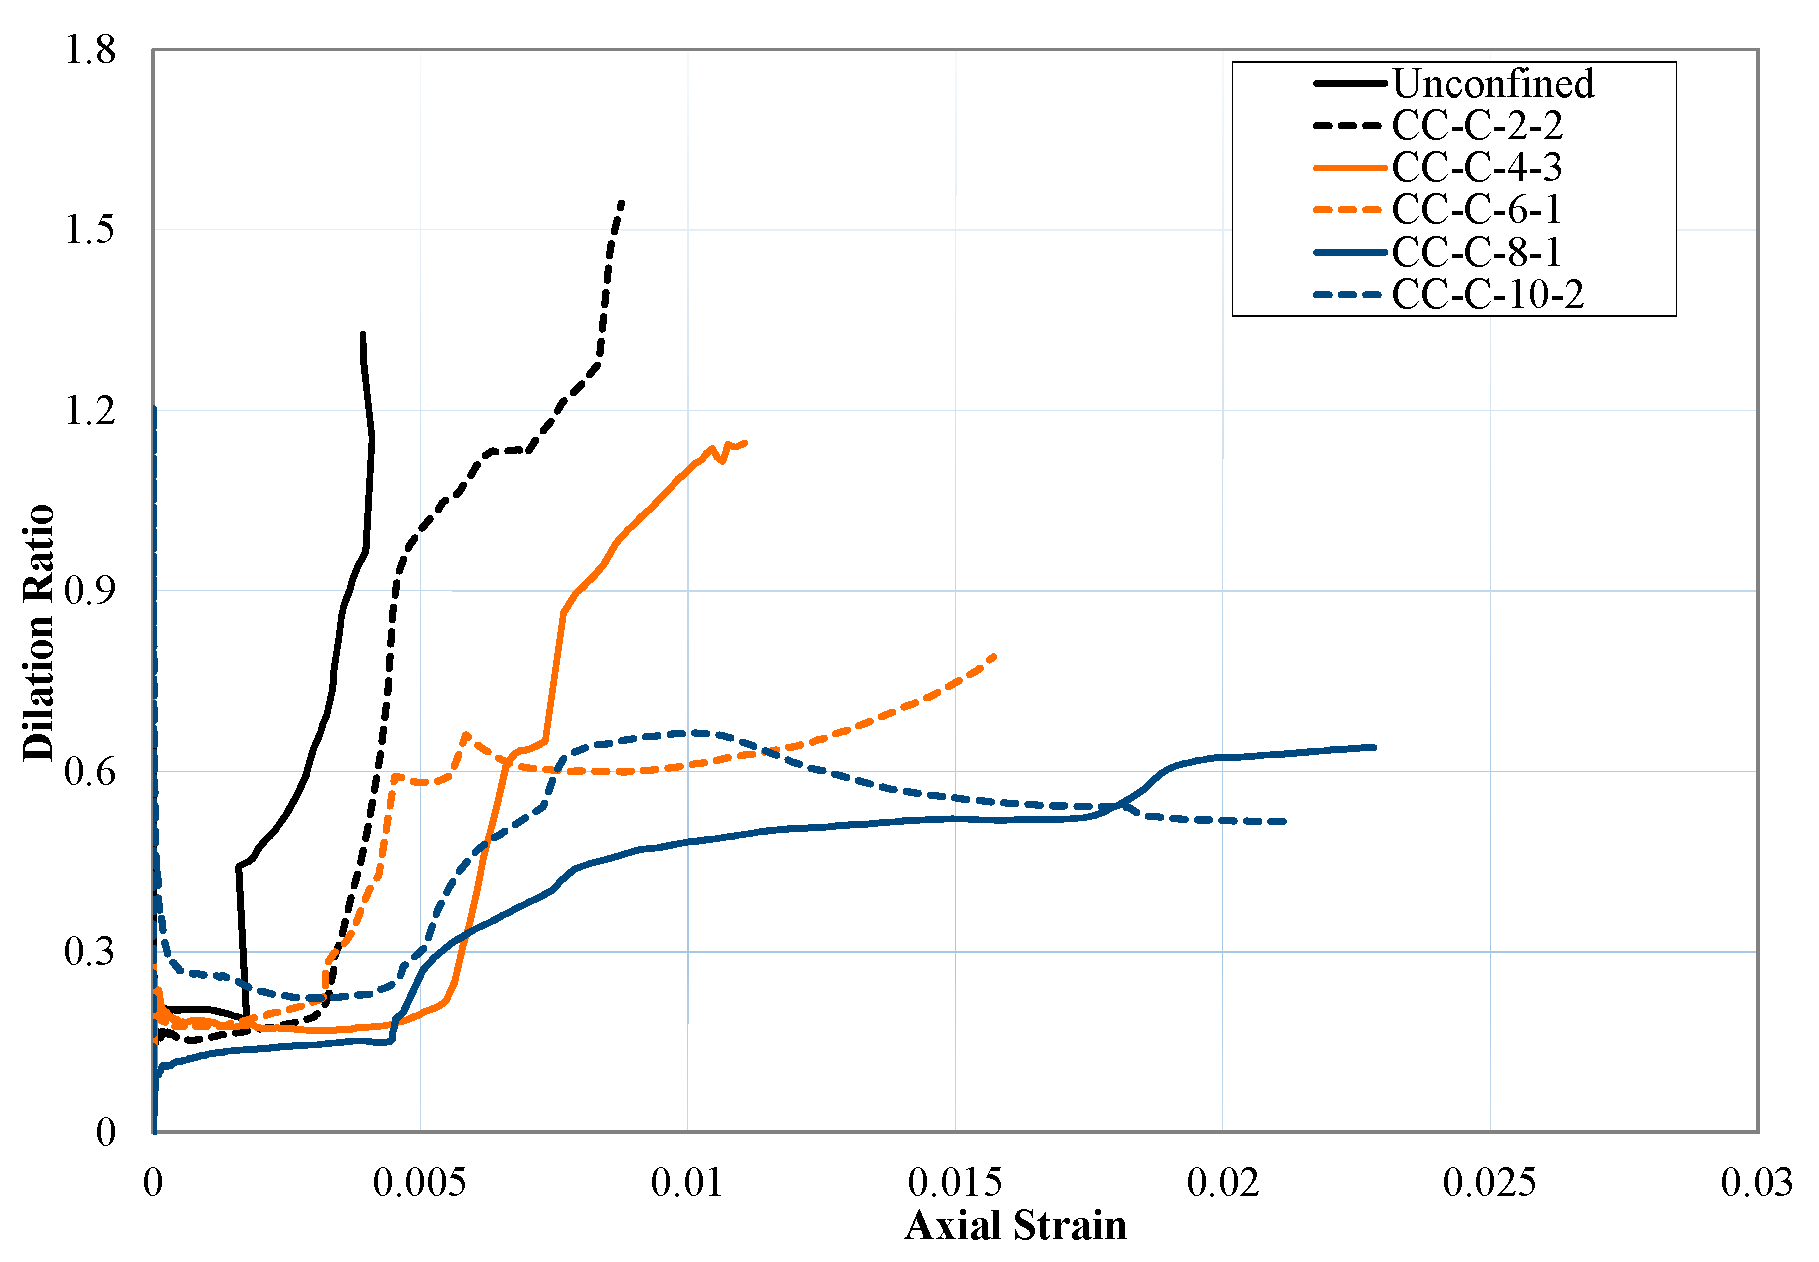
3. Test Results
4. Analytical Work
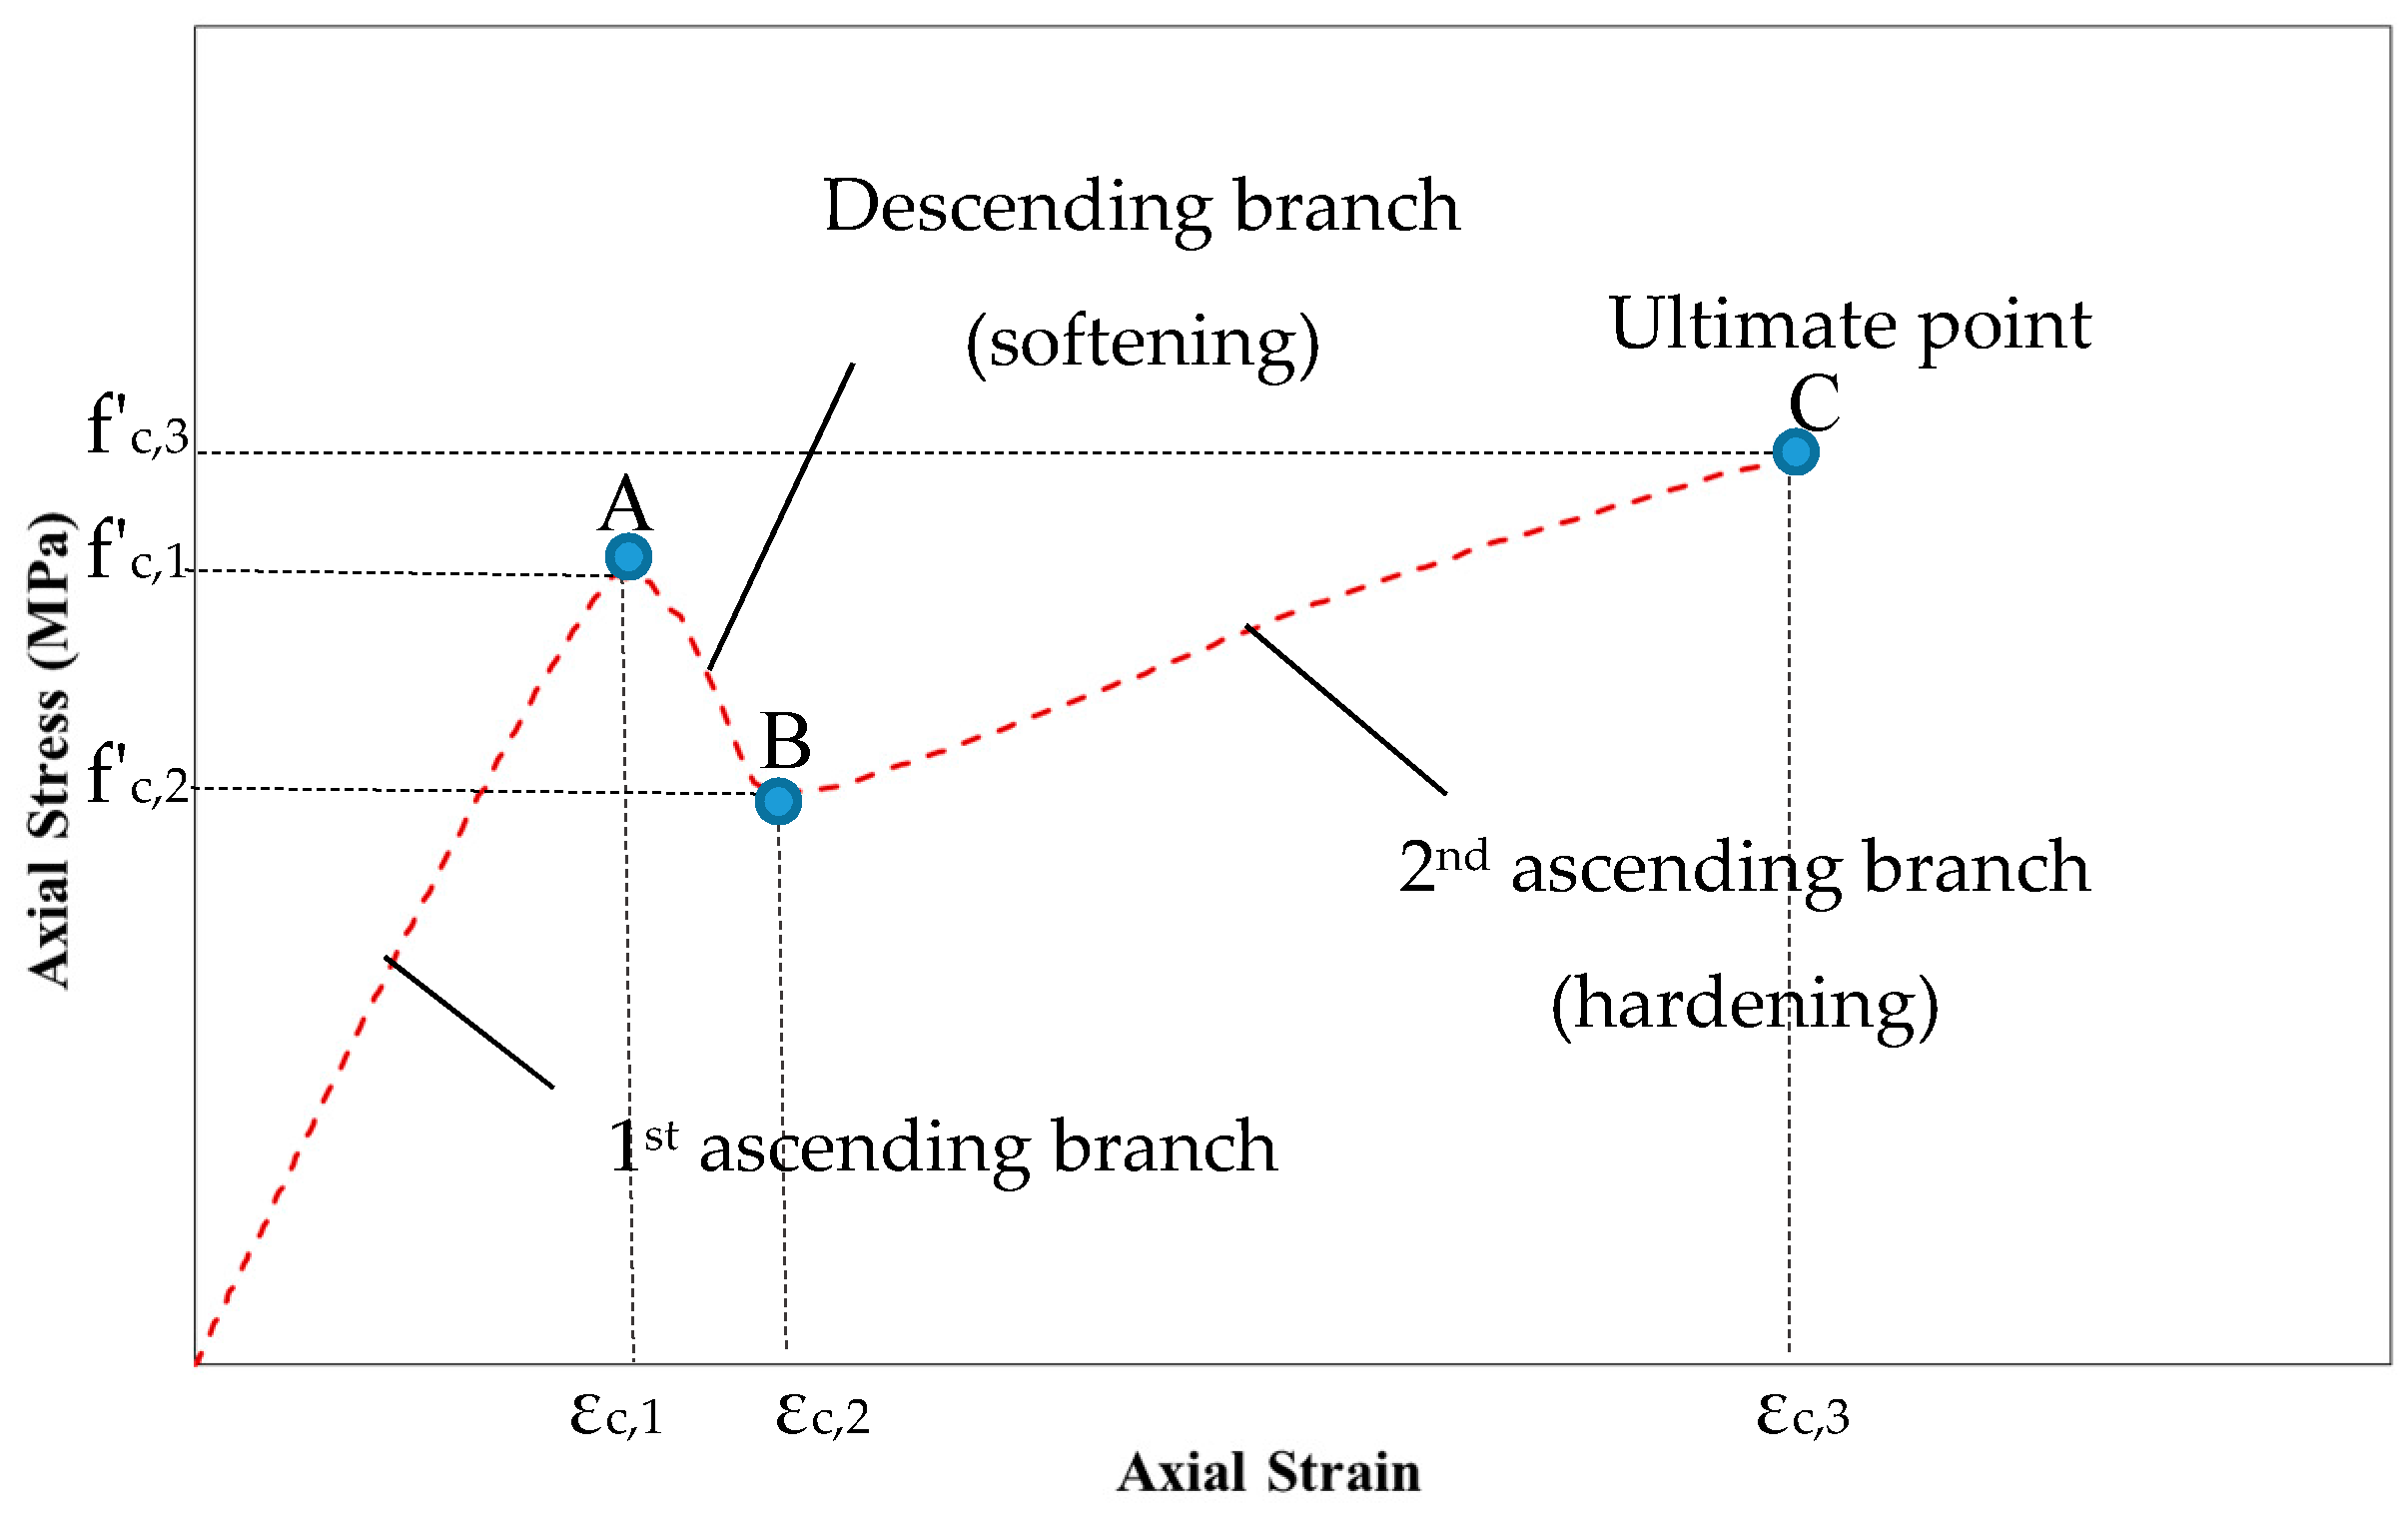
5. Establishment of a Stress–Strain Model for HPFRCC
6. Conclusions
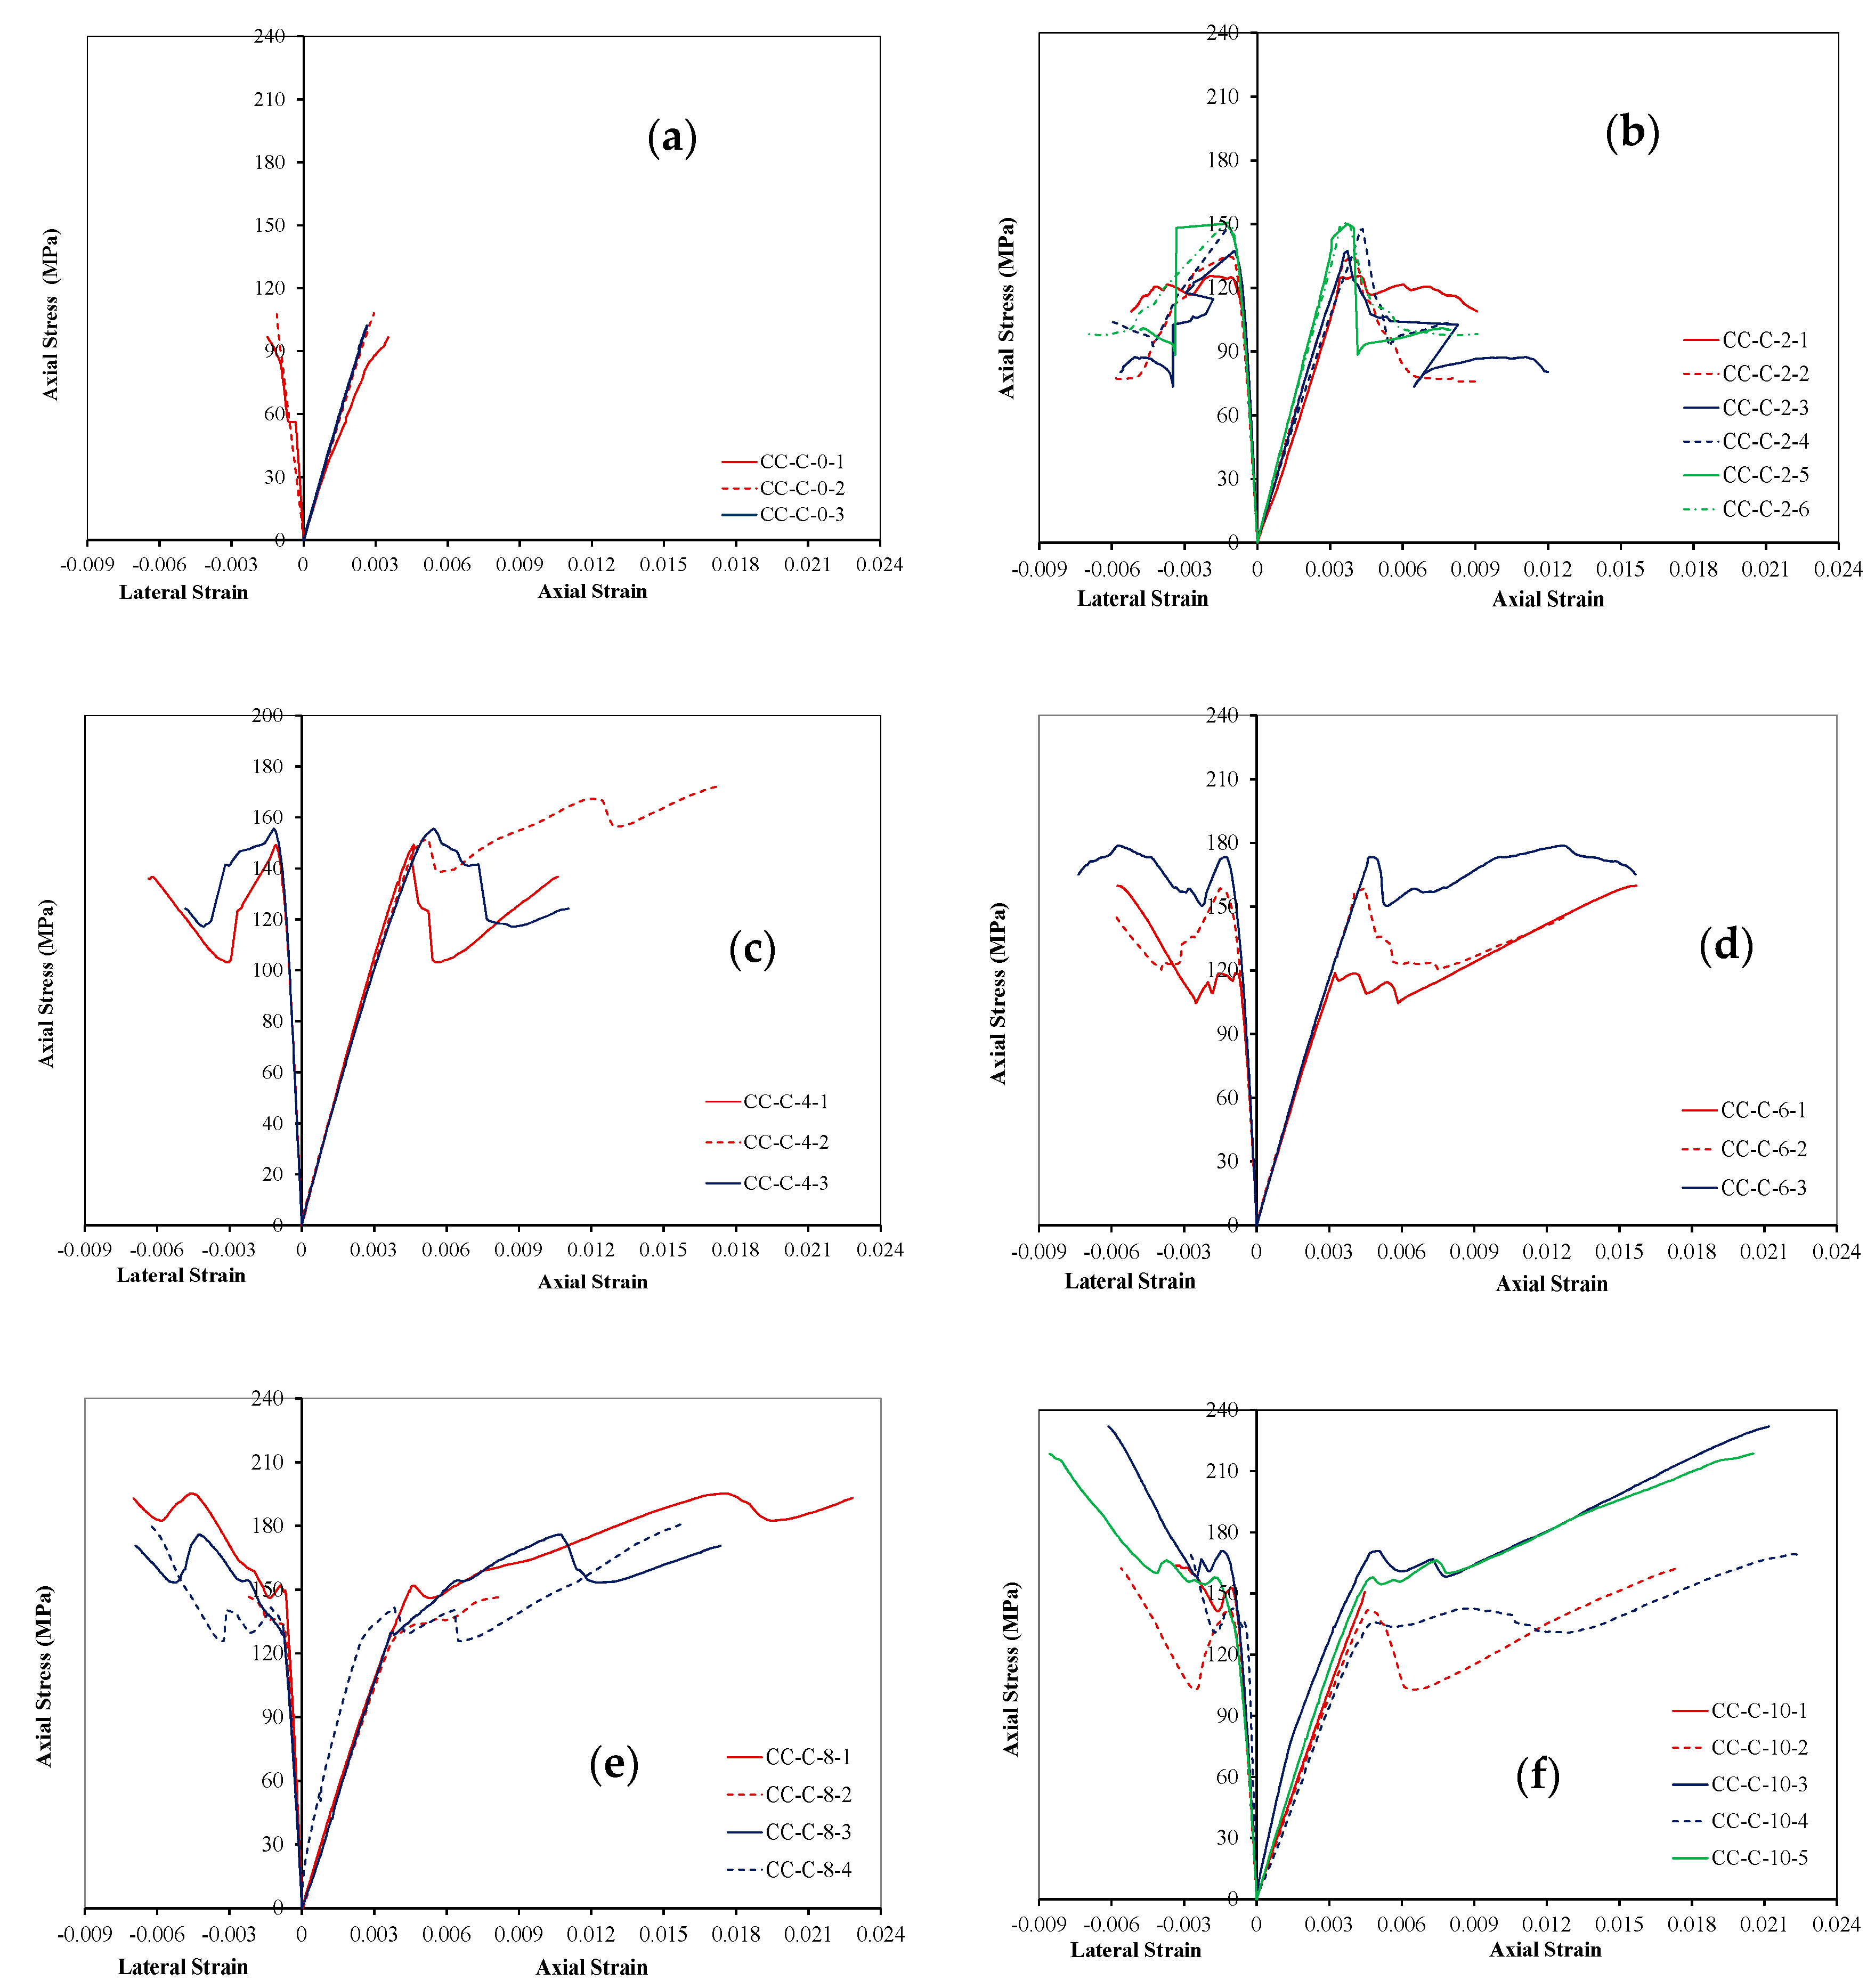
- When confined with CFRP sheets, the axial strength and ultimate strain capacity of the circular HPFRCC specimens are enhanced significantly. The higher is the number of CFRP layers, the more remarkable is the increase in peak compressive strength and ultimate axial strain.
- An average lateral FRP rupture strain of 0.006 and corresponding strain efficiency factor of 0.35 are obtained for HPFRCC confined by CFRP sheets. The values of these two key characteristics are observed to be less than FRP confined NSC and HSC. After the first ascending branch in the stress–strain curves, due to the different nature of HPFRCC in comparison with ordinary concrete, confinement pressure changed by local concentration of stresses resulting with lower hoop rupture strains and corresponding strain efficiency factors.
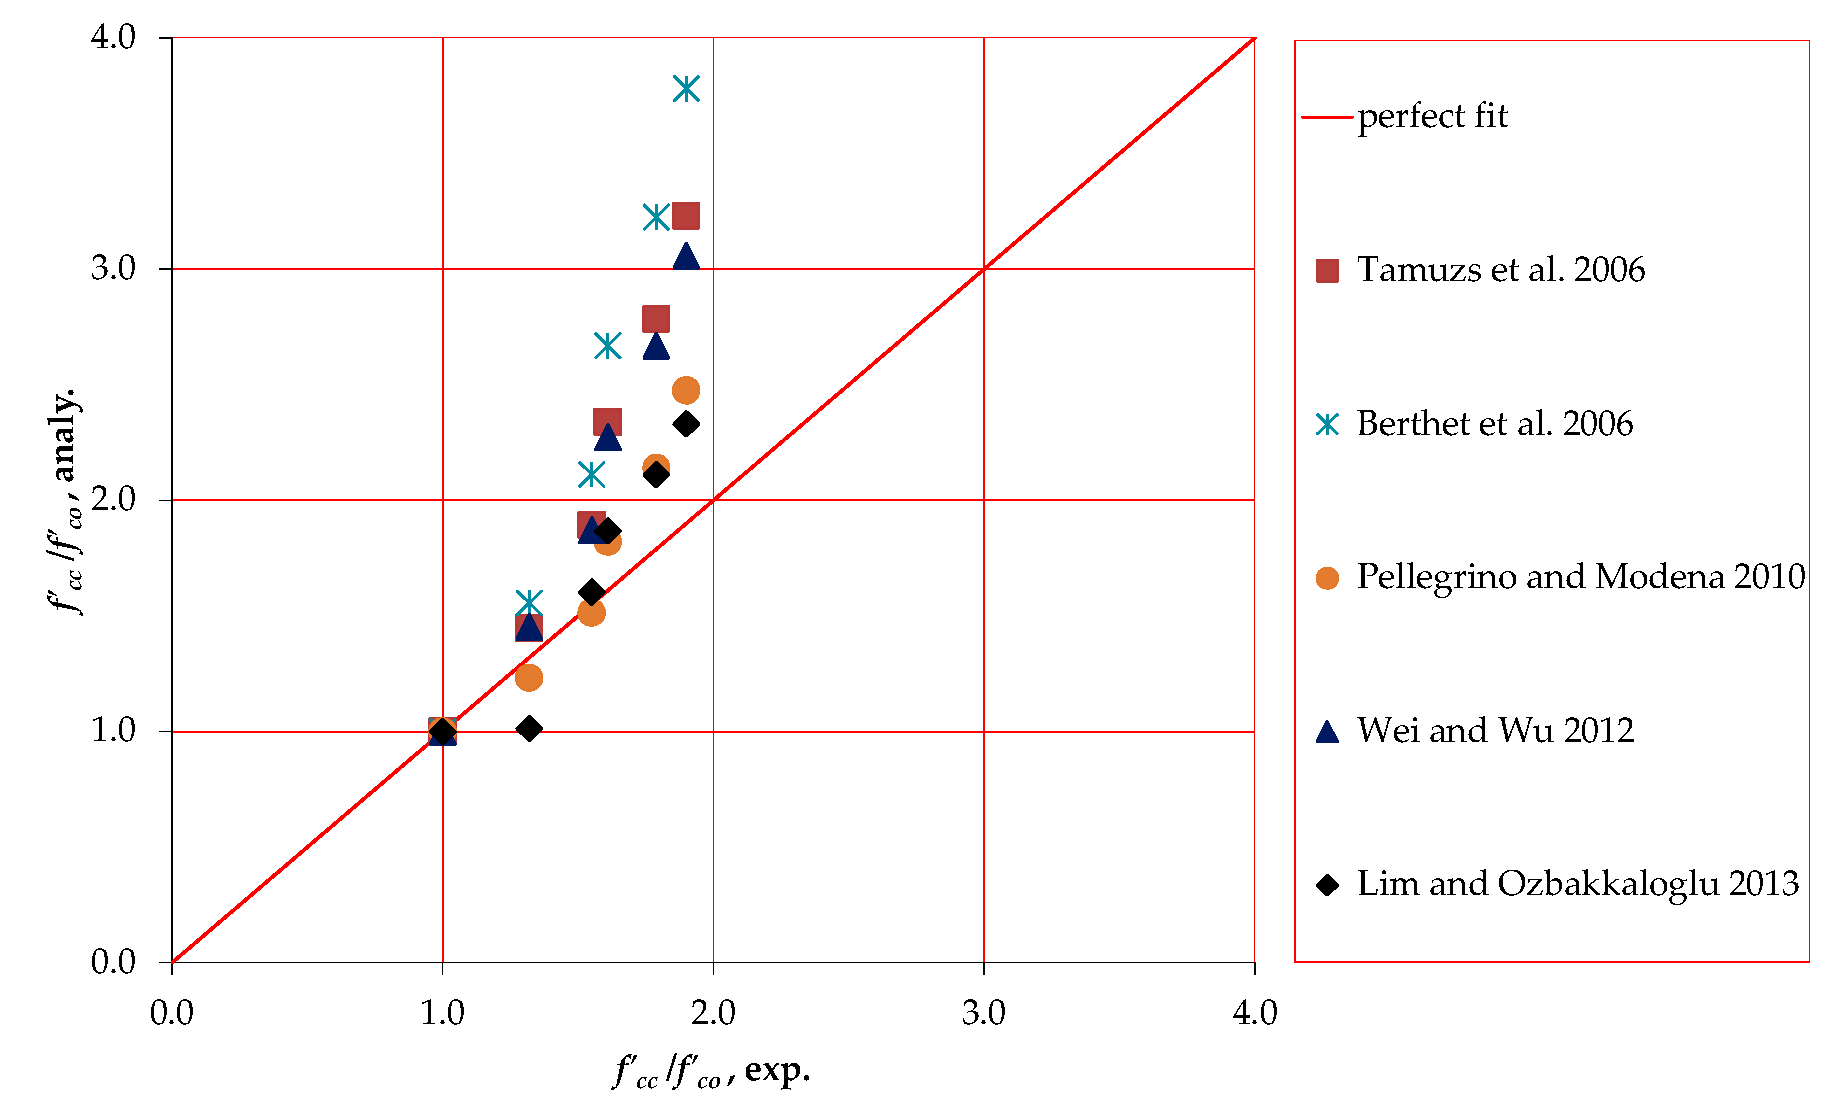
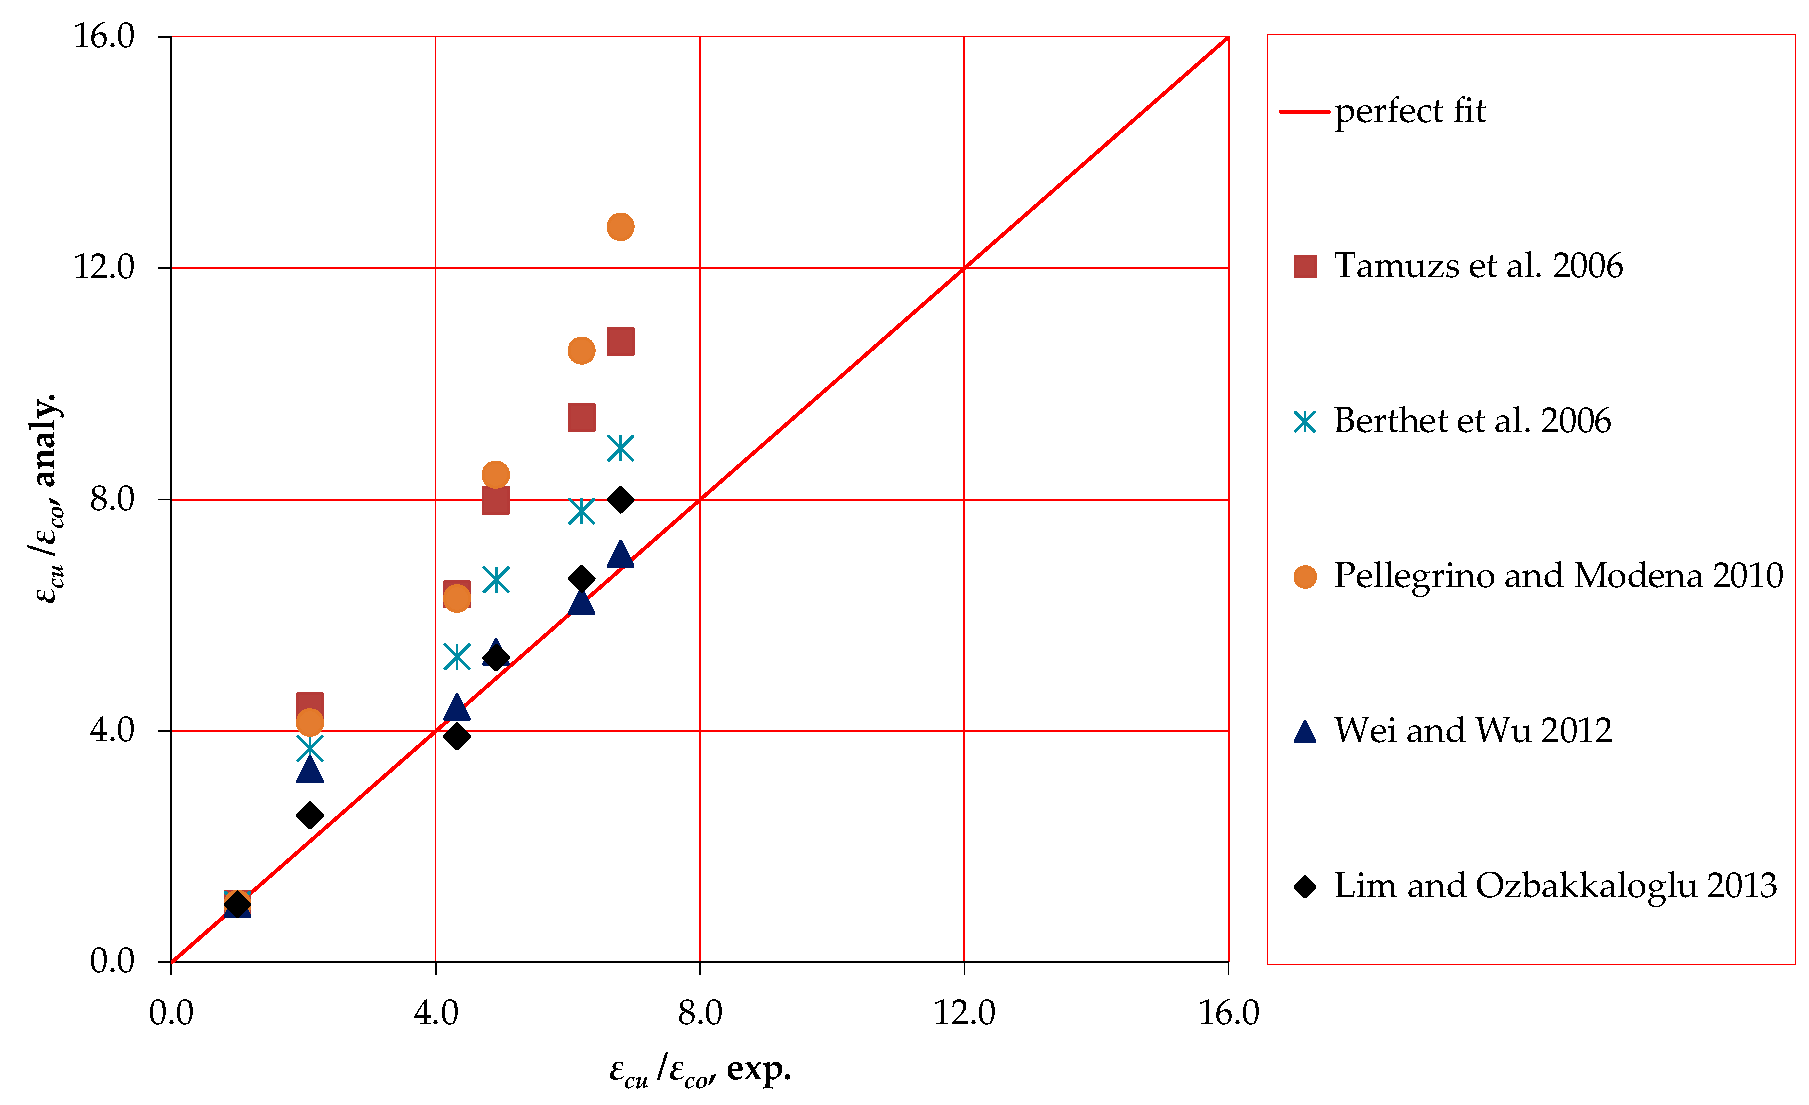
- Investigation of five available models showed that only the model developed by Lim and Ozbakkaloglu [26] is in Category I in terms of axial strength and ultimate strain prediction performances. As seen Figure 5 and Figure 6, the predictions of the models are generally less accurate for axial strength and ultimate axial strain when stiffness of the FRP jacket is high. Obviously, there is a need for further research for different ranges of effective parameters, particularly for heavily confined HPFRCC.
Acknowledgments
Author Contributions
Conflicts of Interest
References
- Rangan, B.V. High-performance high-strength concrete, design recommendations. Concr. Int. 1998, 20, 63–68. [Google Scholar]
- Koksal, F.; Ilki, A.; Tasdemir, M.A. Optimum mix design of steel-fibre-reinforced concrete plates. Arab. J. Sci. Eng. 2013, 38, 2971–2983. [Google Scholar] [CrossRef]
- Brandt, A.M. Fibre reinforced cement-based (FRC) composites after over 40 years of development in building and civil engineering. Compos. Struct. 2008, 86, 3–9. [Google Scholar] [CrossRef]
- Nisticò, N.; Pallini, F.; Rousakis, T.; Wu, Y.F.; Karabinis, A. Peak strength and ultimate strain prediction for FRP confined square and circular concrete sections. Compos. Part B Eng. 2014, 67, 543–554. [Google Scholar] [CrossRef]
- Lam, L.; Teng, J.G. Strength models for fiber-reinforced plastic confined concrete. J. Struct. Eng. 2002, 5, 612–623. [Google Scholar] [CrossRef]
- Ilki, A.; Kumbasar, N.; Koc, V. Low strength concrete members externally confined with FRP sheets. Struct. Eng. Mech. 2004, 18, 167–194. [Google Scholar] [CrossRef]
- Ilki, A.; Peker, O.; Karamuk, E.; Demir, C.; Kumbasar, N. FRP retrofit of low and medium strength circular and rectangular reinforced concrete columns. ASCE J. Mater. Civ. Eng. 2008, 20, 169–188. [Google Scholar] [CrossRef]
- Ilki, A.; Demir, C.; Bedirhanoglu, I.; Kumbasar, N. Seismic retrofit of brittle and low strength RC columns using fiber reinforced polymer and cementitious composites. Adv. Struct. Eng. 2009, 12, 325–347. [Google Scholar] [CrossRef]
- Dai, J.G.; Bai, Y.L.; Teng, J.G. Behavior and modeling of concrete confined with FRP composites of large deformability. J. Compos. Constr. 2011, 15, 963–973. [Google Scholar] [CrossRef]
- Parvin, A.; Brighton, D. FRP composites strengthening of concrete columns under various loading conditions. Polymers 2014, 6, 1040–1056. [Google Scholar] [CrossRef]
- Wu, H.; Wang, Y.; Yu, L.; Li, X. Experimental and computational studies on high-strength concrete circular columns confined by aramid fiber-reinforced polymer sheets. J. Compos. Constr. 2009, 13, 125–134. [Google Scholar] [CrossRef]
- Xiao, Q.G.; Teng, J.G.; Yu, T. Behavior and modeling of confined high-strength concrete. J. Compos. Constr. 2010, 14, 249–259. [Google Scholar] [CrossRef]
- Vincent, T.; Ozbakkaloglu, T. Influence of concrete strength and confinement method on axial compressive behavior of FRP confined high-and ultra high-strength concrete. Compos. Part B 2013, 50, 413–428. [Google Scholar] [CrossRef]
- Lim, J.C.; Ozbakkaloglu, T. Influence of silica fume on stress-strain behavior of FRP-confined HSC. Constr. Build. Mater. 2014, 63, 11–24. [Google Scholar] [CrossRef]
- Ozbakkaloglu, T.; Vincent, T. Axial compressive behavior of circular high-strength concrete-filled FRP tubes. J. Compos. Constr. 2014, 18, 04013037. [Google Scholar] [CrossRef]
- Ozbakkaloglu, T.; Oehlers, D.J. Concrete-filled square and rectangular FRP tubes under axial compression. J. Compos. Constr. 2008, 12, 469–477. [Google Scholar] [CrossRef]
- Ozbakkaloglu, T. Axial compressive behavior of square and rectangular high-strength concrete-filled FRP tubes. J. Compos. Constr. 2013, 17, 151–161. [Google Scholar] [CrossRef]
- Ozbakkaloglu, T. Behavior of square and rectangular ultra high-strength concrete-filled FRP tubes under axial compression. Compos. Part B 2013, 54, 97–111. [Google Scholar] [CrossRef]
- Xie, T.; Ozbakkaloglu, T. Behavior of steel fiber-reinforced high-strength concrete-filled FRP tube columns under axial compression. Eng. Struct. 2015, 90, 158–171. [Google Scholar] [CrossRef]
- Zohrevand, P.; Mirmiran, A. Behavior of ultra-high-performance concrete confined by fiber-reinforced polymers. ASCE J. Mater. Civ. Eng. 2012, 23, 1727–1734. [Google Scholar] [CrossRef]
- Tamuzs, V.; Tepfers, R.; Sparnins, E. Behavior of concrete cylinders confined by carbon composite 2. Prediction of strength. Mech. Compos. Mater. 2006, 42, 109–118. [Google Scholar] [CrossRef]
- Tamuzs, V.; Tepfers, R.; Zile, E.; Ladnova, O. Behavior of concrete cylinders confined by a carbon composite 3. Deformability and the ultimate axial strain. Mech. Compos. Mater. 2006, 42, 303–314. [Google Scholar] [CrossRef]
- Berthet, J.F.; Ferrier, E.; Hamelin, P. Compressive behavior of concrete externally confined by composite jackets: Part B: Modeling. Constr. Build. Mater. 2006, 20, 338–347. [Google Scholar] [CrossRef]
- Pellegrino, C.; Modena, C. Analytical model for FRP confinement of concrete columns with and without internal steel reinforcement. J. Compos. Constr. 2010, 14, 693–705. [Google Scholar] [CrossRef]
- Wei, Y.Y.; Wu, Y.F. Unified stress-strain model of concrete for FRP-confined columns. Constr. Build. Mater. 2012, 26, 381–392. [Google Scholar] [CrossRef]
- Lim, J.C.; Ozbakkaloglu, T. Confinement model for FRP-confined high-strength concrete. J. Compos. Constr. 2013, 18, 04013058. [Google Scholar] [CrossRef]
- Wu, Y.F.; Zhou, Y.W. Unified strength model based on Hoek-Brown failure criterion for circular and square concrete columns confined by FRP. J. Compos. Constr. 2010, 14, 175–184. [Google Scholar] [CrossRef]
- Lorenzis, L.D.; Micelli, F.; Tegola, A.L. Influence of the specimen size and resin type on the behavior of FRP-confined concrete cylinders. In Proceedings of Advanced Composites for Structural Applications in Construction (ACIC-2002); University of Southampton: Southampton, UK, 2002; pp. 46–53. [Google Scholar]
- Théirault, M.; Neale, K.W.; Claude, S. Fiber-reinforced polymer-confined circular concrete columns: Investigation of size and slenderness effects. J. Compos. Constr. 2004, 8, 323–331. [Google Scholar] [CrossRef]
- Carey, S.A.; Harries, K.A. Axial behavior and modeling of confined small-, medium-, and large-scale circular sections with carbon fiber-reinforced polymer jackets. ACI Struct. J. 2005, 102, 596. [Google Scholar]
- Zhu, Z.; Ahmad, I.; Mirmiran, A. Effect of column parameters on axial compression behavior of concrete-filled FRP tubes. Adv. Struct. Eng. 2005, 8, 443–449. [Google Scholar] [CrossRef]
- American Concrete Institute. Guide for the Design and Construction of Externally Bonded FRP Systems for Strengthening Concrete Structures; ACI-440.2R-08; ACI-440 Committee: Detroit, MI, USA, 2008. [Google Scholar]
- Canadian Standard Association. Design and Construction of Building Components with Fibre-Reinforced Polymers; CSA-S806-2002; Canadian Standard Association: Toronto, ON, Canada, 2002. [Google Scholar]
- Turkish Seismic Design Code. Regulations for Buildings to Be Constructed in Earthquake Prone Areas; Ministry of Public Works and Settlement: Ankara, Turkey, 2007. [Google Scholar]


| Designation | Number of Specimens | Number of CFRP Plies | FRP Volumetric Ratio (ρf) |
|---|---|---|---|
| CC-C-0 | 3 | Unconfined | - |
| CC-C-2 | 6 | 2 | 0.008 |
| CC-C-4 | 3 | 4 | 0.018 |
| CC-C-6 | 3 | 6 | 0.027 |
| CC-C-8 | 4 | 8 | 0.035 |
| CC-C-10 | 5 | 10 | 0.044 |
| C | SF | S | STF | W | SP | Total |
|---|---|---|---|---|---|---|
| 1000 | 250 | 815 | 78.5 | 124 | 125 | 2392.5 |
| Tensile Strength (MPa) | Tensile Elasticity Modulus (MPa) | Ultimate Tensile Deformation (%) | Effective Thickness (mm) |
|---|---|---|---|
| 4200 | 240,000 | 1.8 | 0.166 |
| Specimen | Average Strength Loss | (MPa) | (Average) | ||||||||||||
|---|---|---|---|---|---|---|---|---|---|---|---|---|---|---|---|
| (MPa) | (%) | (MPa) | (MPa) | (%) | (%) | (Average) | (Average) | (Average) | (Average) | ||||||
| CC-C-2-1 | 102.7 | 0.300 | 126.6 | 108.9 | 0.36 | 0.907 | 0.521 | 0.577 | 36,695 | 39,524 | 1.23 | 1.38 | 3.02 | 2.10 | 0.32 |
| CC-C-2-2 | 102.7 | 0.300 | 134.7 | 75.9 | 0.540 β | 0.601 | 39,658 | 1.31 | 1.80 | ||||||
| CC-C-2-3 | 102.7 | 0.300 | 137.4 | 80.3 | 0.805 β | 0.564 | 38,141 | 1.34 | 2.69 | ||||||
| CC-C-2-4 | 102.7 | 0.300 | 147.6 | 103.8 | 0.550 β | 0.597 | 36,489 | 1.44 | 1.83 | ||||||
| CC-C-2-5 | 102.7 | 0.300 | 150.2 | 100.2 | 0.410 β | 0.483 | 44,358 | 1.46 | 1.37 | ||||||
| CC-C-2-6 | 102.7 | 0.300 | 150.8 | 98.1 | 0.570 β | 0.701 | 41,806 | 1.47 | 1.90 | ||||||
| CC-C-4-1 | 102.7 | 0.300 | 149.3 | 136.7 | 1.062 | 0.636 | 0.559 | 35,850 | 34,765 | 1.45 | 1.55 | 3.54 | 4.32 | 0.31 | |
| CC-C-4-2 α | 102.7 | 0.300 | 172.1 | - | 0.21 | 1.722 | - | 34,259 | 1.68 | 5.74 | |||||
| CC-C-4-3 | 102.7 | 0.300 | 155.7 | 124.2 | 1.106 | 0.482 | 34,187 | 1.52 | 3.69 | ||||||
| CC-C-6-1 | 102.7 | 0.300 | 159.9 | - | 1.571 | 0.576 | 0.632 | 37,784 | 38,951 | 1.56 | 1.61 | 5.24 | 4.91 | 0.35 | |
| CC-C-6-2 | 102.7 | 0.300 | 158.6 | 145.7 | 0.17 | 1.284 | 0.585 | 38,806 | 1.55 | 4.28 | |||||
| CC-C-6-3 | 102.7 | 0.300 | 178.7 | 165.1 | 1.567 | 0.737 | 40,265 | 1.74 | 5.22 | ||||||
| CC-C-8-1 | 102.7 | 0.300 | 195.4 | 193.1 | 2.282 | 0.699 | 0.672 | 36,842 | 41,395 | 1.90 | 1.79 | 7.61 | 6.21 | 0.37 | |
| CC-C-8-2 α | 102.7 | 0.300 | 146.3 | - | 0.06 | 0.836 | 0.223 | 36,687 | 1.43 | 2.79 | |||||
| CC-C-8-3 | 102.7 | 0.300 | 175.9 | 170.7 | 1.736 | 0.689 | 36,846 | 1.71 | 5.79 | ||||||
| CC-C-8-4 | 102.7 | 0.300 | 180.6 | - | 1.569 | 0.629 | 55,205 | 1.76 | 5.23 | ||||||
| CC-C-10-1 α | 102.7 | 0.300 | 150.7 | - | 0.448 | 0.301 | 0.677 | 34,092 | 37,146 | 1.47 | 1.90 | 1.49 | 6.80 | 0.38 | |
| CC-C-10-2 | 102.7 | 0.300 | 162.4 | - | 1.744 | 0.562 | 33,438 | 1.58 | 5.81 | ||||||
| CC-C-10-3 | 102.7 | 0.300 | 231.9 | - | 0.06 | 2.119 | 0.613 | 48,578 | 2.26 | 7.06 | |||||
| CC-C-10-4 α | 102.7 | 0.300 | 168.6 | - | 2.244 | 0.267 | 31,468 | 1.64 | 7.48 | ||||||
| CC-C-10-5 | 102.7 | 0.300 | 218.5 | - | 2.054 | 0.856 | 38,154 | 2.13 | 6.85 |
| Model/Strength Range | Strength Expression | Ultimate Strain Expression | Definition |
|---|---|---|---|
| [21,22]/25–82 MPa (Strength) 20–60 MPa (Strain) | ; ; ; ; | ||
| [23]/20–200 MPa | ; ; ; | ||
| [24]/up to 200 MPa | |||
| [25]/18–55 MPa | ; | ||
| [26]/6–170 MPa | ; ; |
| Models | f’cc/f’co | Ɛcu/Ɛco | ||
|---|---|---|---|---|
| AAE | SD | AAE | SD | |
| [21,22] | 0.34 | 0.28 | 0.55 | 0.35 |
| [23] | 0.50 | 0.39 | 0.32 | 0.25 |
| [24] | 0.12 | 0.15 | 0.62 | 0.36 |
| [25] | 0.30 | 0.24 | 0.12 | 0.23 |
| [26] | 0.14 | 0.17 | 0.10 | 0.11 |
| Models | Category I | Category II | Category III | |||
|---|---|---|---|---|---|---|
| Strength | Strain | Strength | Strain | Strength | Strain | |
| [21,22] | x | x | ||||
| [23] | x | x | ||||
| [24] | x | x | ||||
| [25] | x | x | ||||
| [26] | x | x | ||||
| Point | Stress | Strain |
|---|---|---|
| B | 0.03 | 0.04 |
| C | 0.11 | 0.06 |
© 2018 by the authors. Licensee MDPI, Basel, Switzerland. This article is an open access article distributed under the terms and conditions of the Creative Commons Attribution (CC BY) license (http://creativecommons.org/licenses/by/4.0/).
Share and Cite
Demir, U.; Sahinkaya, Y.; Ispir, M.; Ilki, A. Assessment of Axial Behavior of Circular HPFRCC Members Externally Confined with FRP Sheets. Polymers 2018, 10, 138. https://doi.org/10.3390/polym10020138
Demir U, Sahinkaya Y, Ispir M, Ilki A. Assessment of Axial Behavior of Circular HPFRCC Members Externally Confined with FRP Sheets. Polymers. 2018; 10(2):138. https://doi.org/10.3390/polym10020138
Chicago/Turabian StyleDemir, Ugur, Yusuf Sahinkaya, Medine Ispir, and Alper Ilki. 2018. "Assessment of Axial Behavior of Circular HPFRCC Members Externally Confined with FRP Sheets" Polymers 10, no. 2: 138. https://doi.org/10.3390/polym10020138
APA StyleDemir, U., Sahinkaya, Y., Ispir, M., & Ilki, A. (2018). Assessment of Axial Behavior of Circular HPFRCC Members Externally Confined with FRP Sheets. Polymers, 10(2), 138. https://doi.org/10.3390/polym10020138