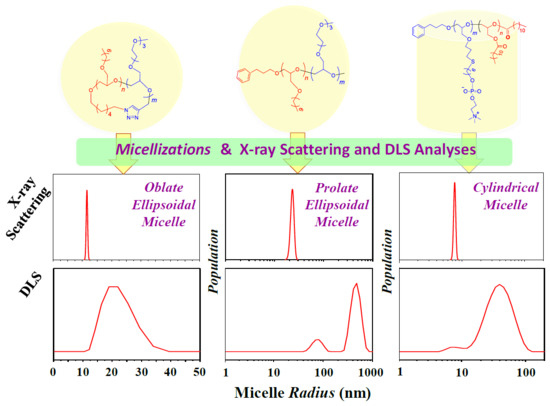
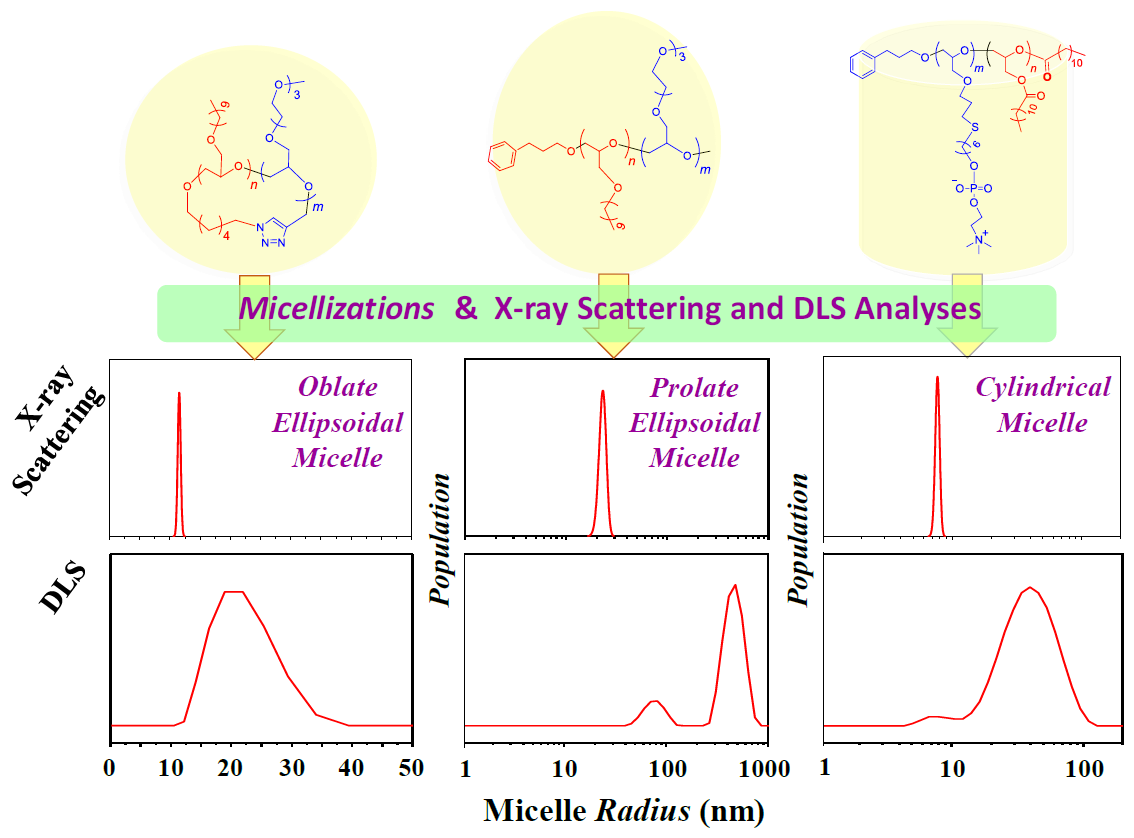
A Comparative Study of Dynamic Light and X-ray Scatterings on Micelles of Topological Polymer Amphiphiles

 ,
,  and
and
Abstract
1. Introduction
2. Materials and Methods
2.1. Materials
2.2. Micelle Formations
2.3. Measurements
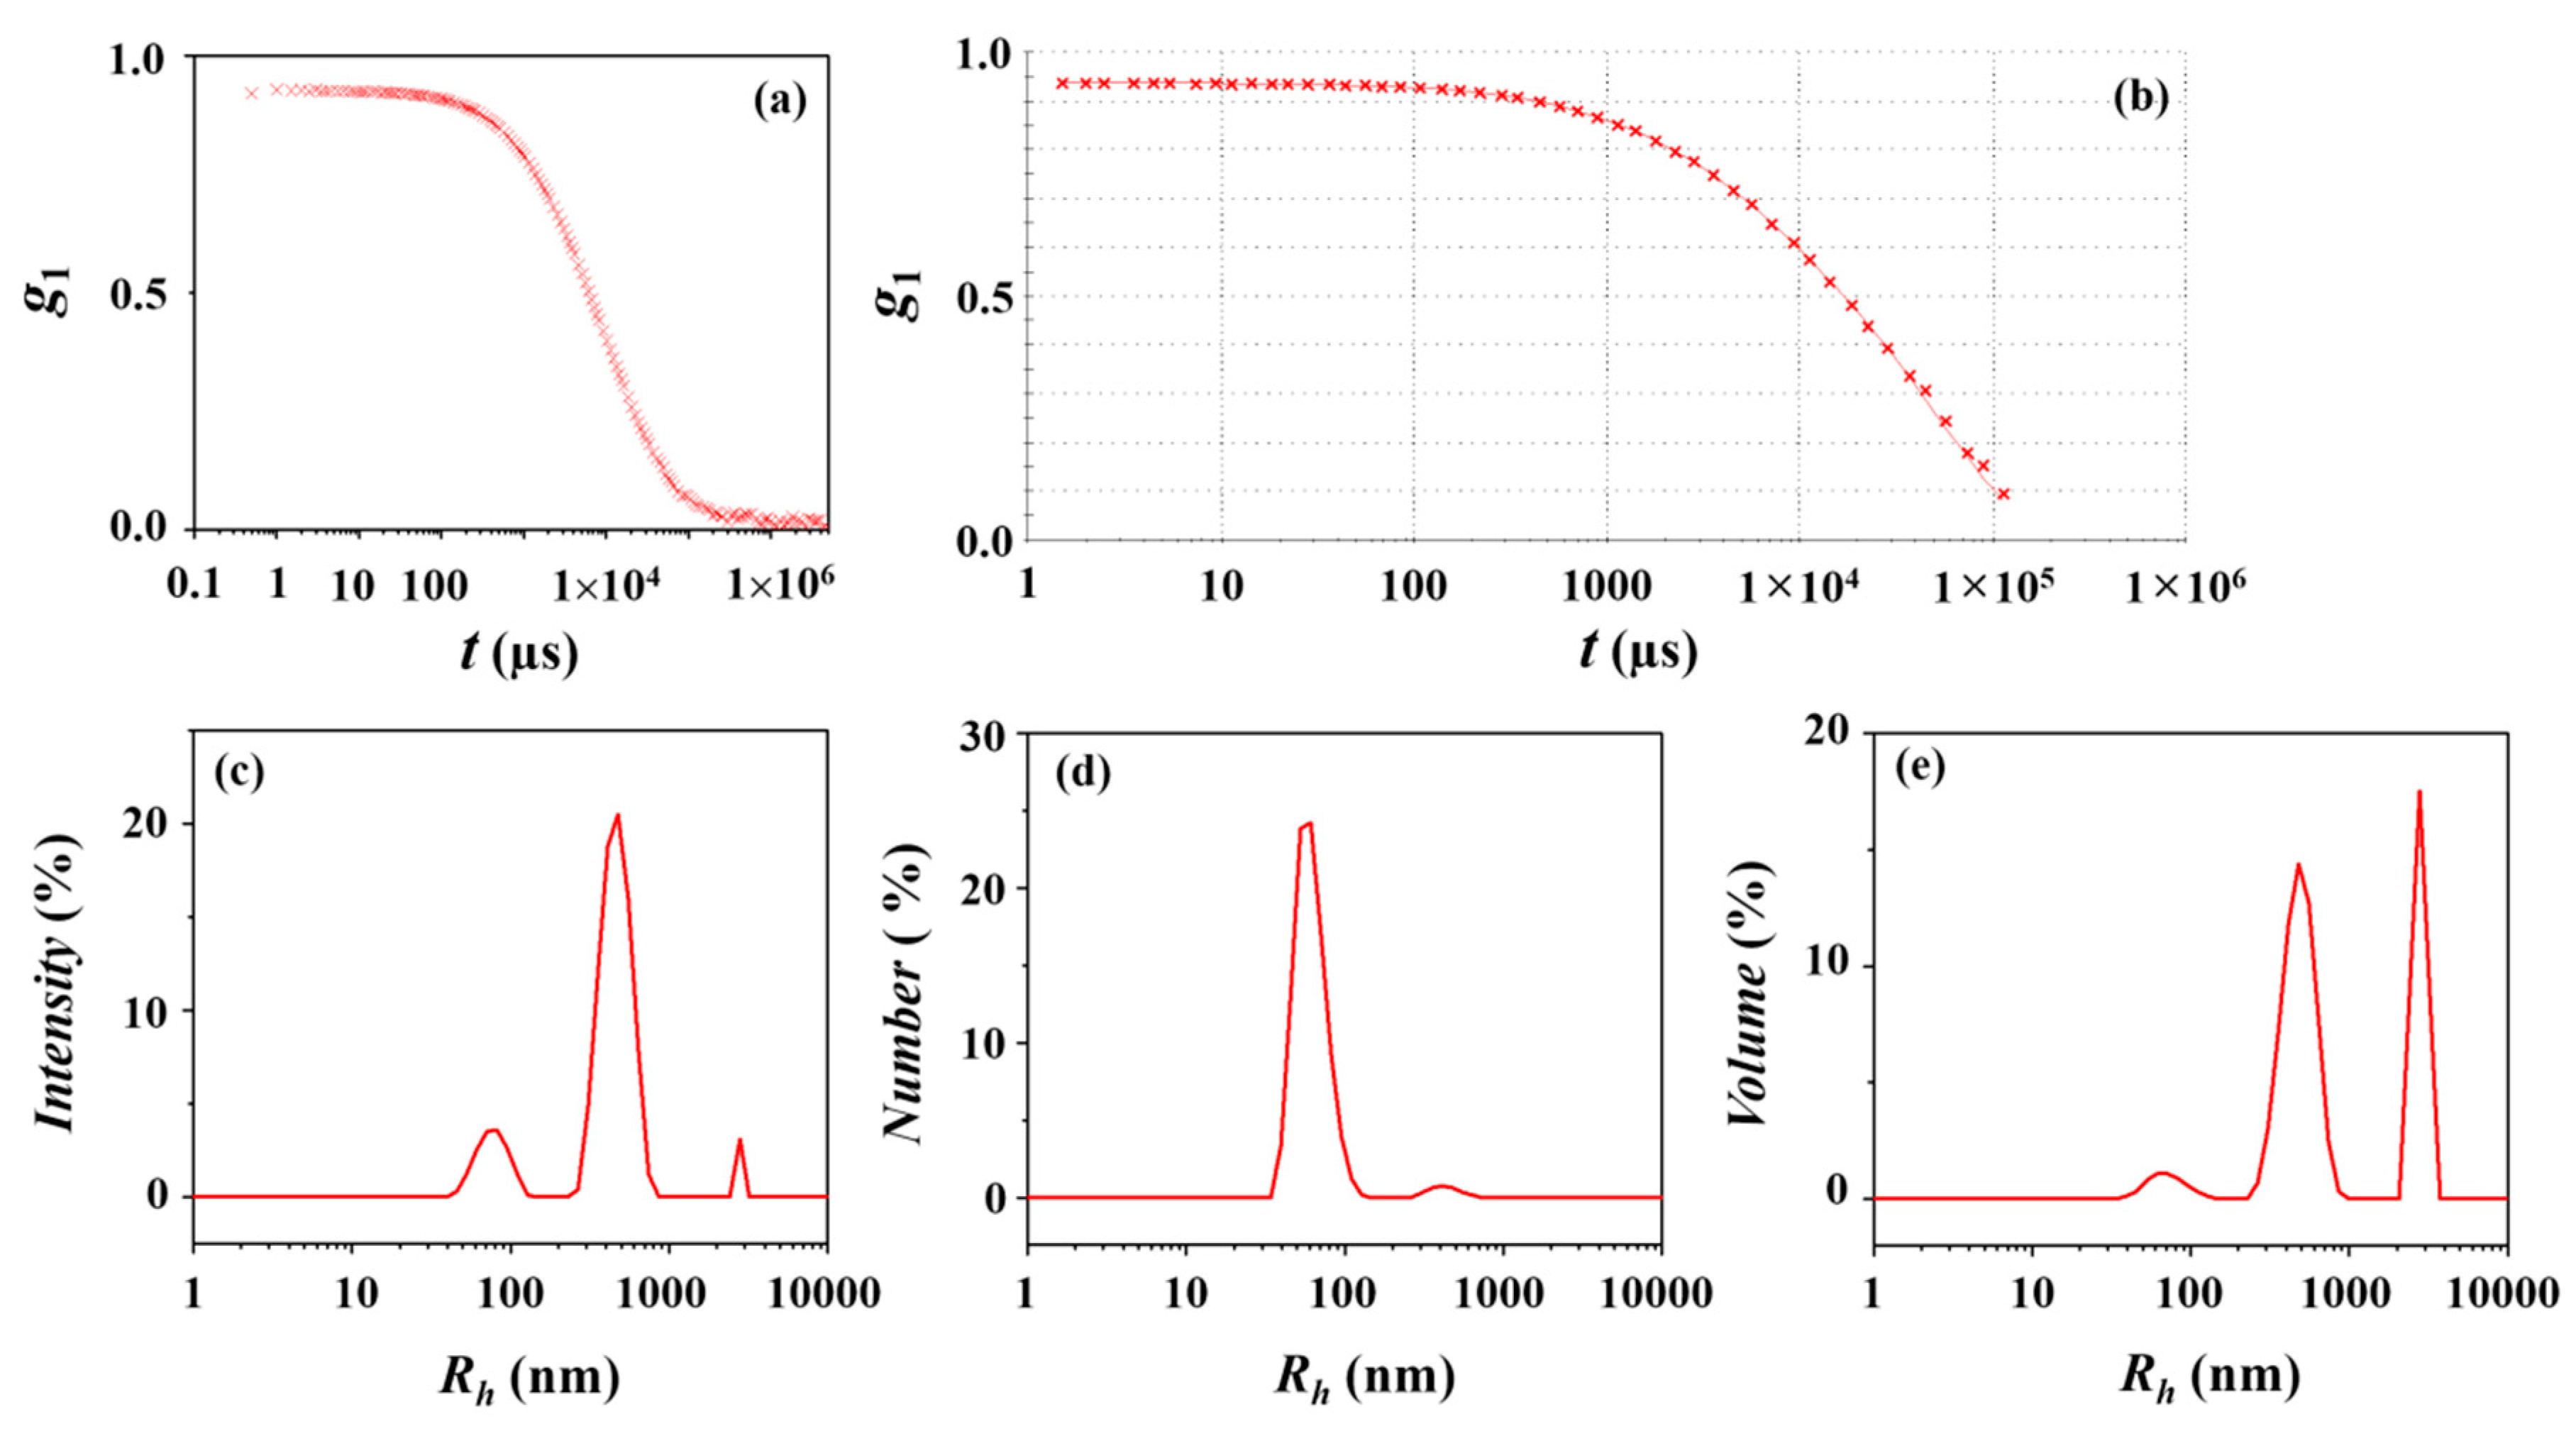
2.4. Dynamic Light Scattering (DLS) Data Analysis
2.5. X-ray Scattering Data Analysis
2.5.1. Guinier Analysis
2.5.2. Indirect Fourier Transformation (IFT) Analysis
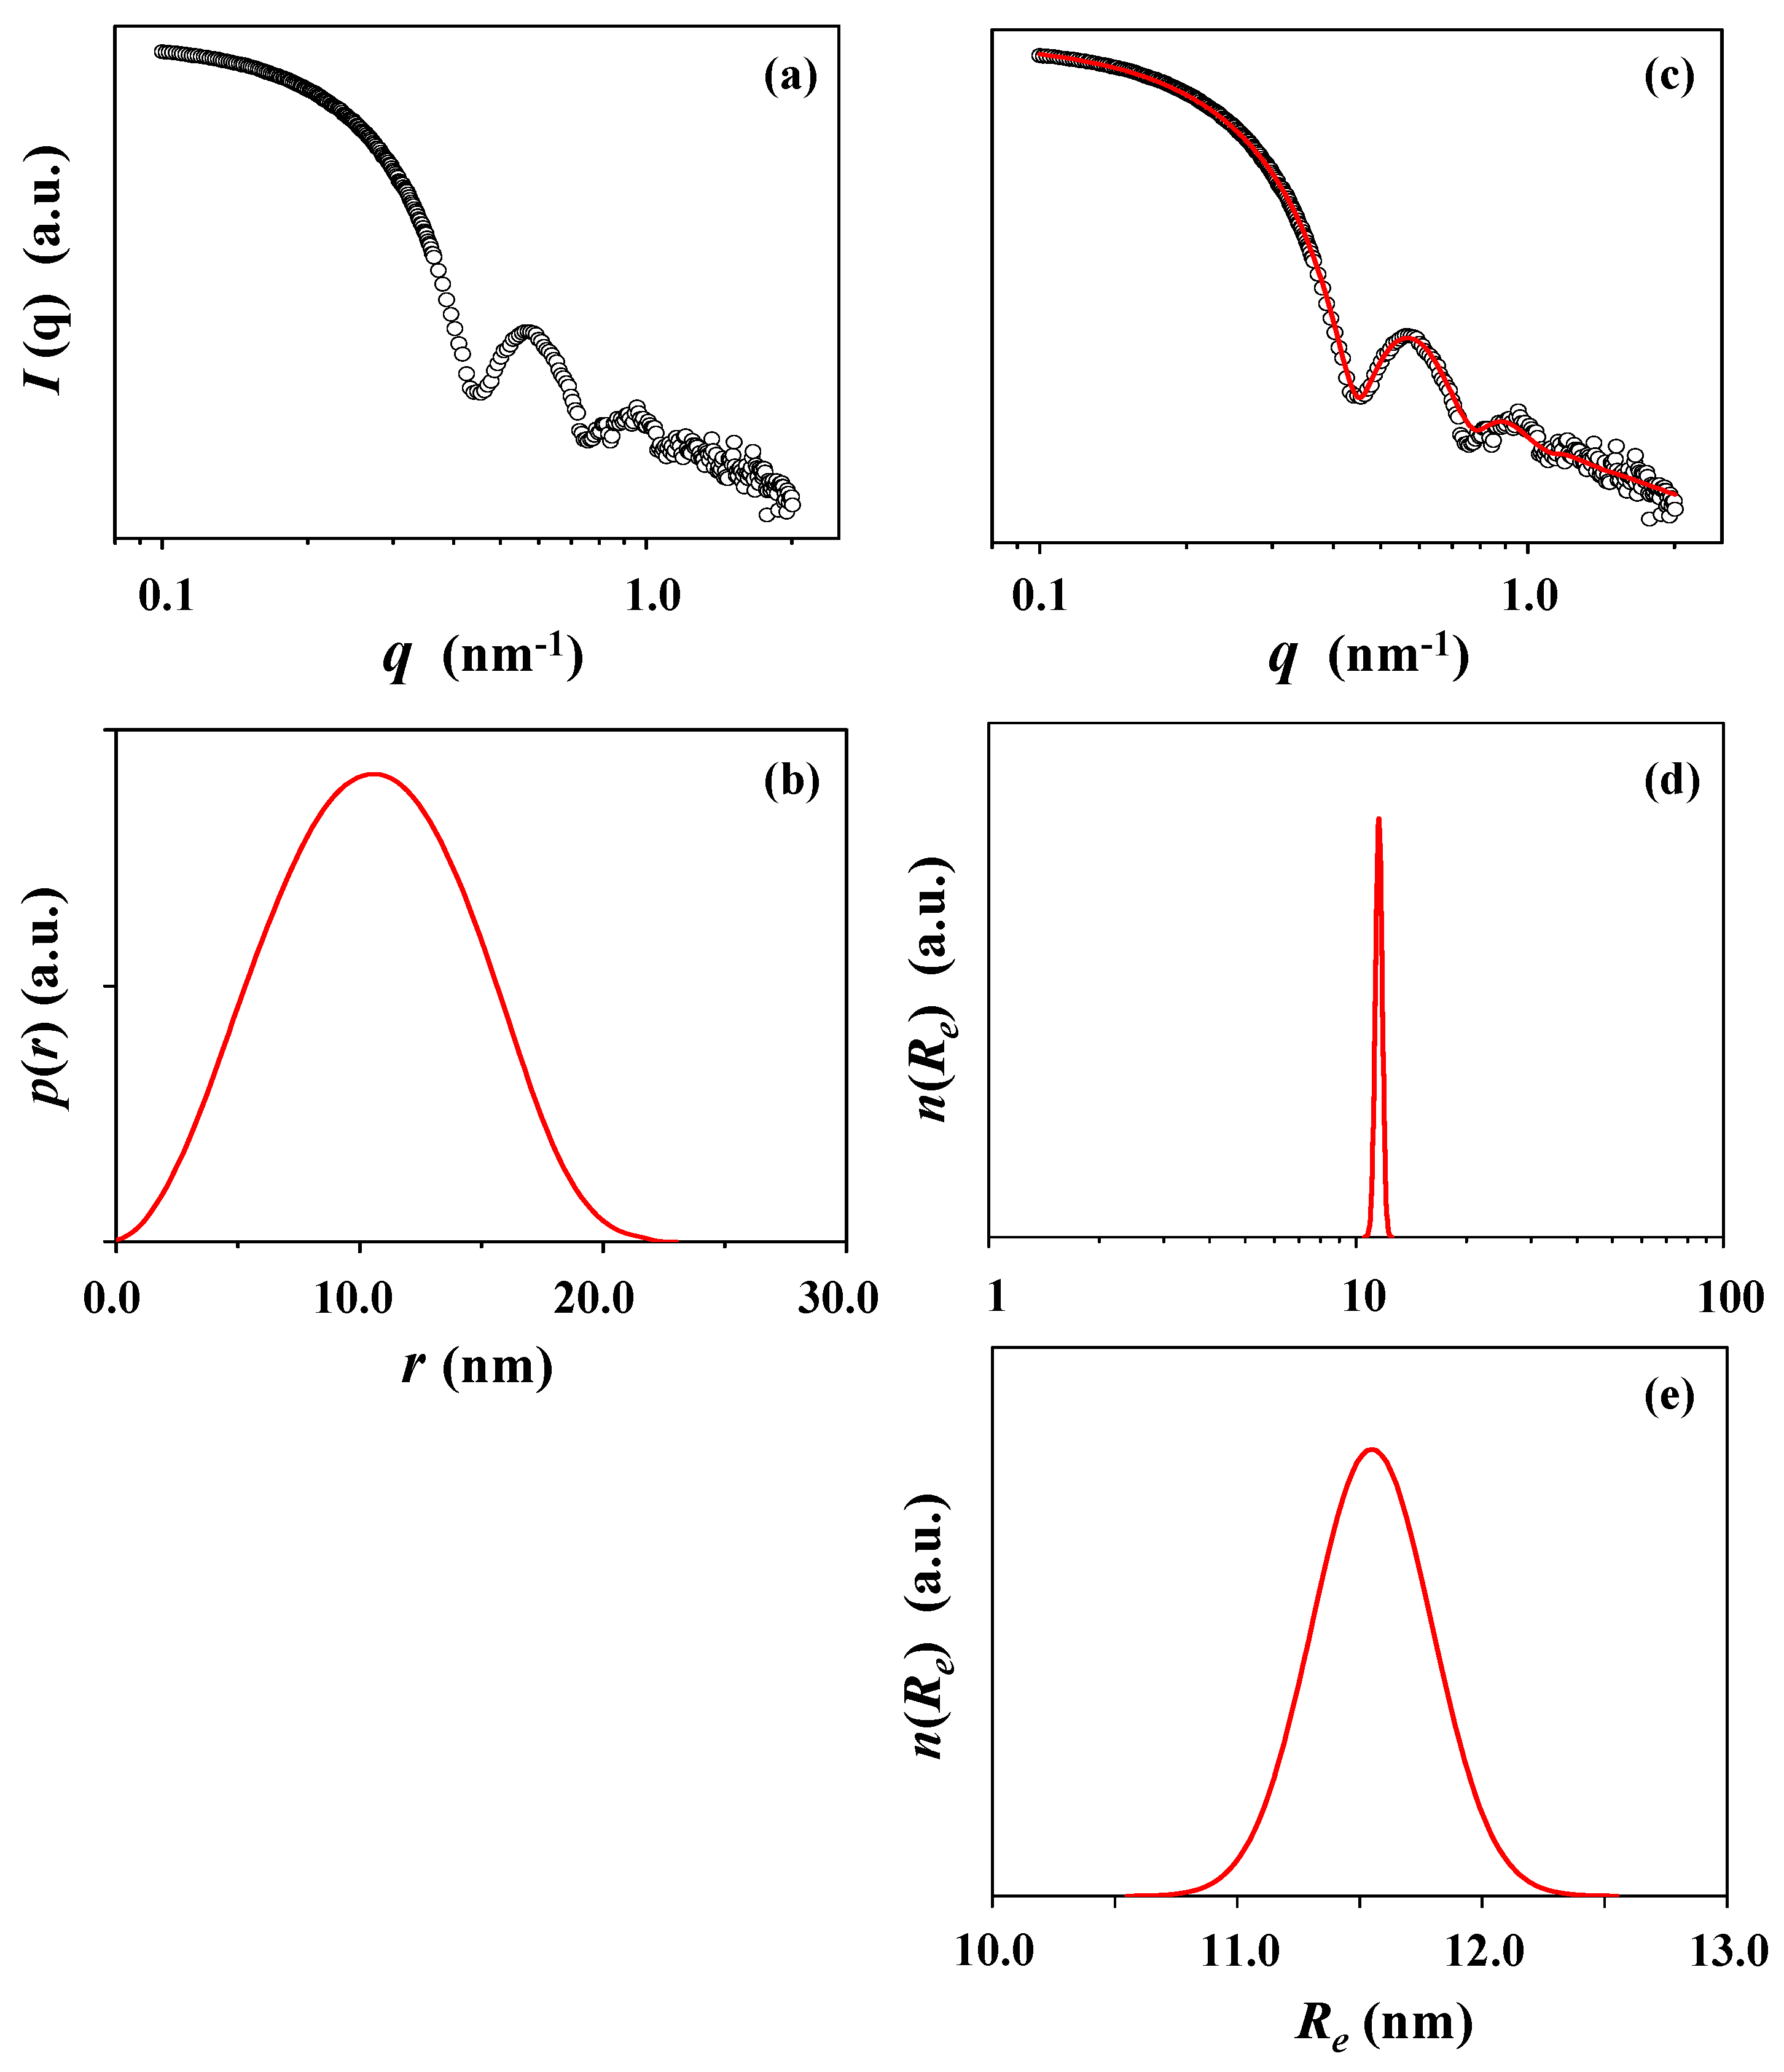
2.5.3. Three-Phase Ellipsoid Model Analysis
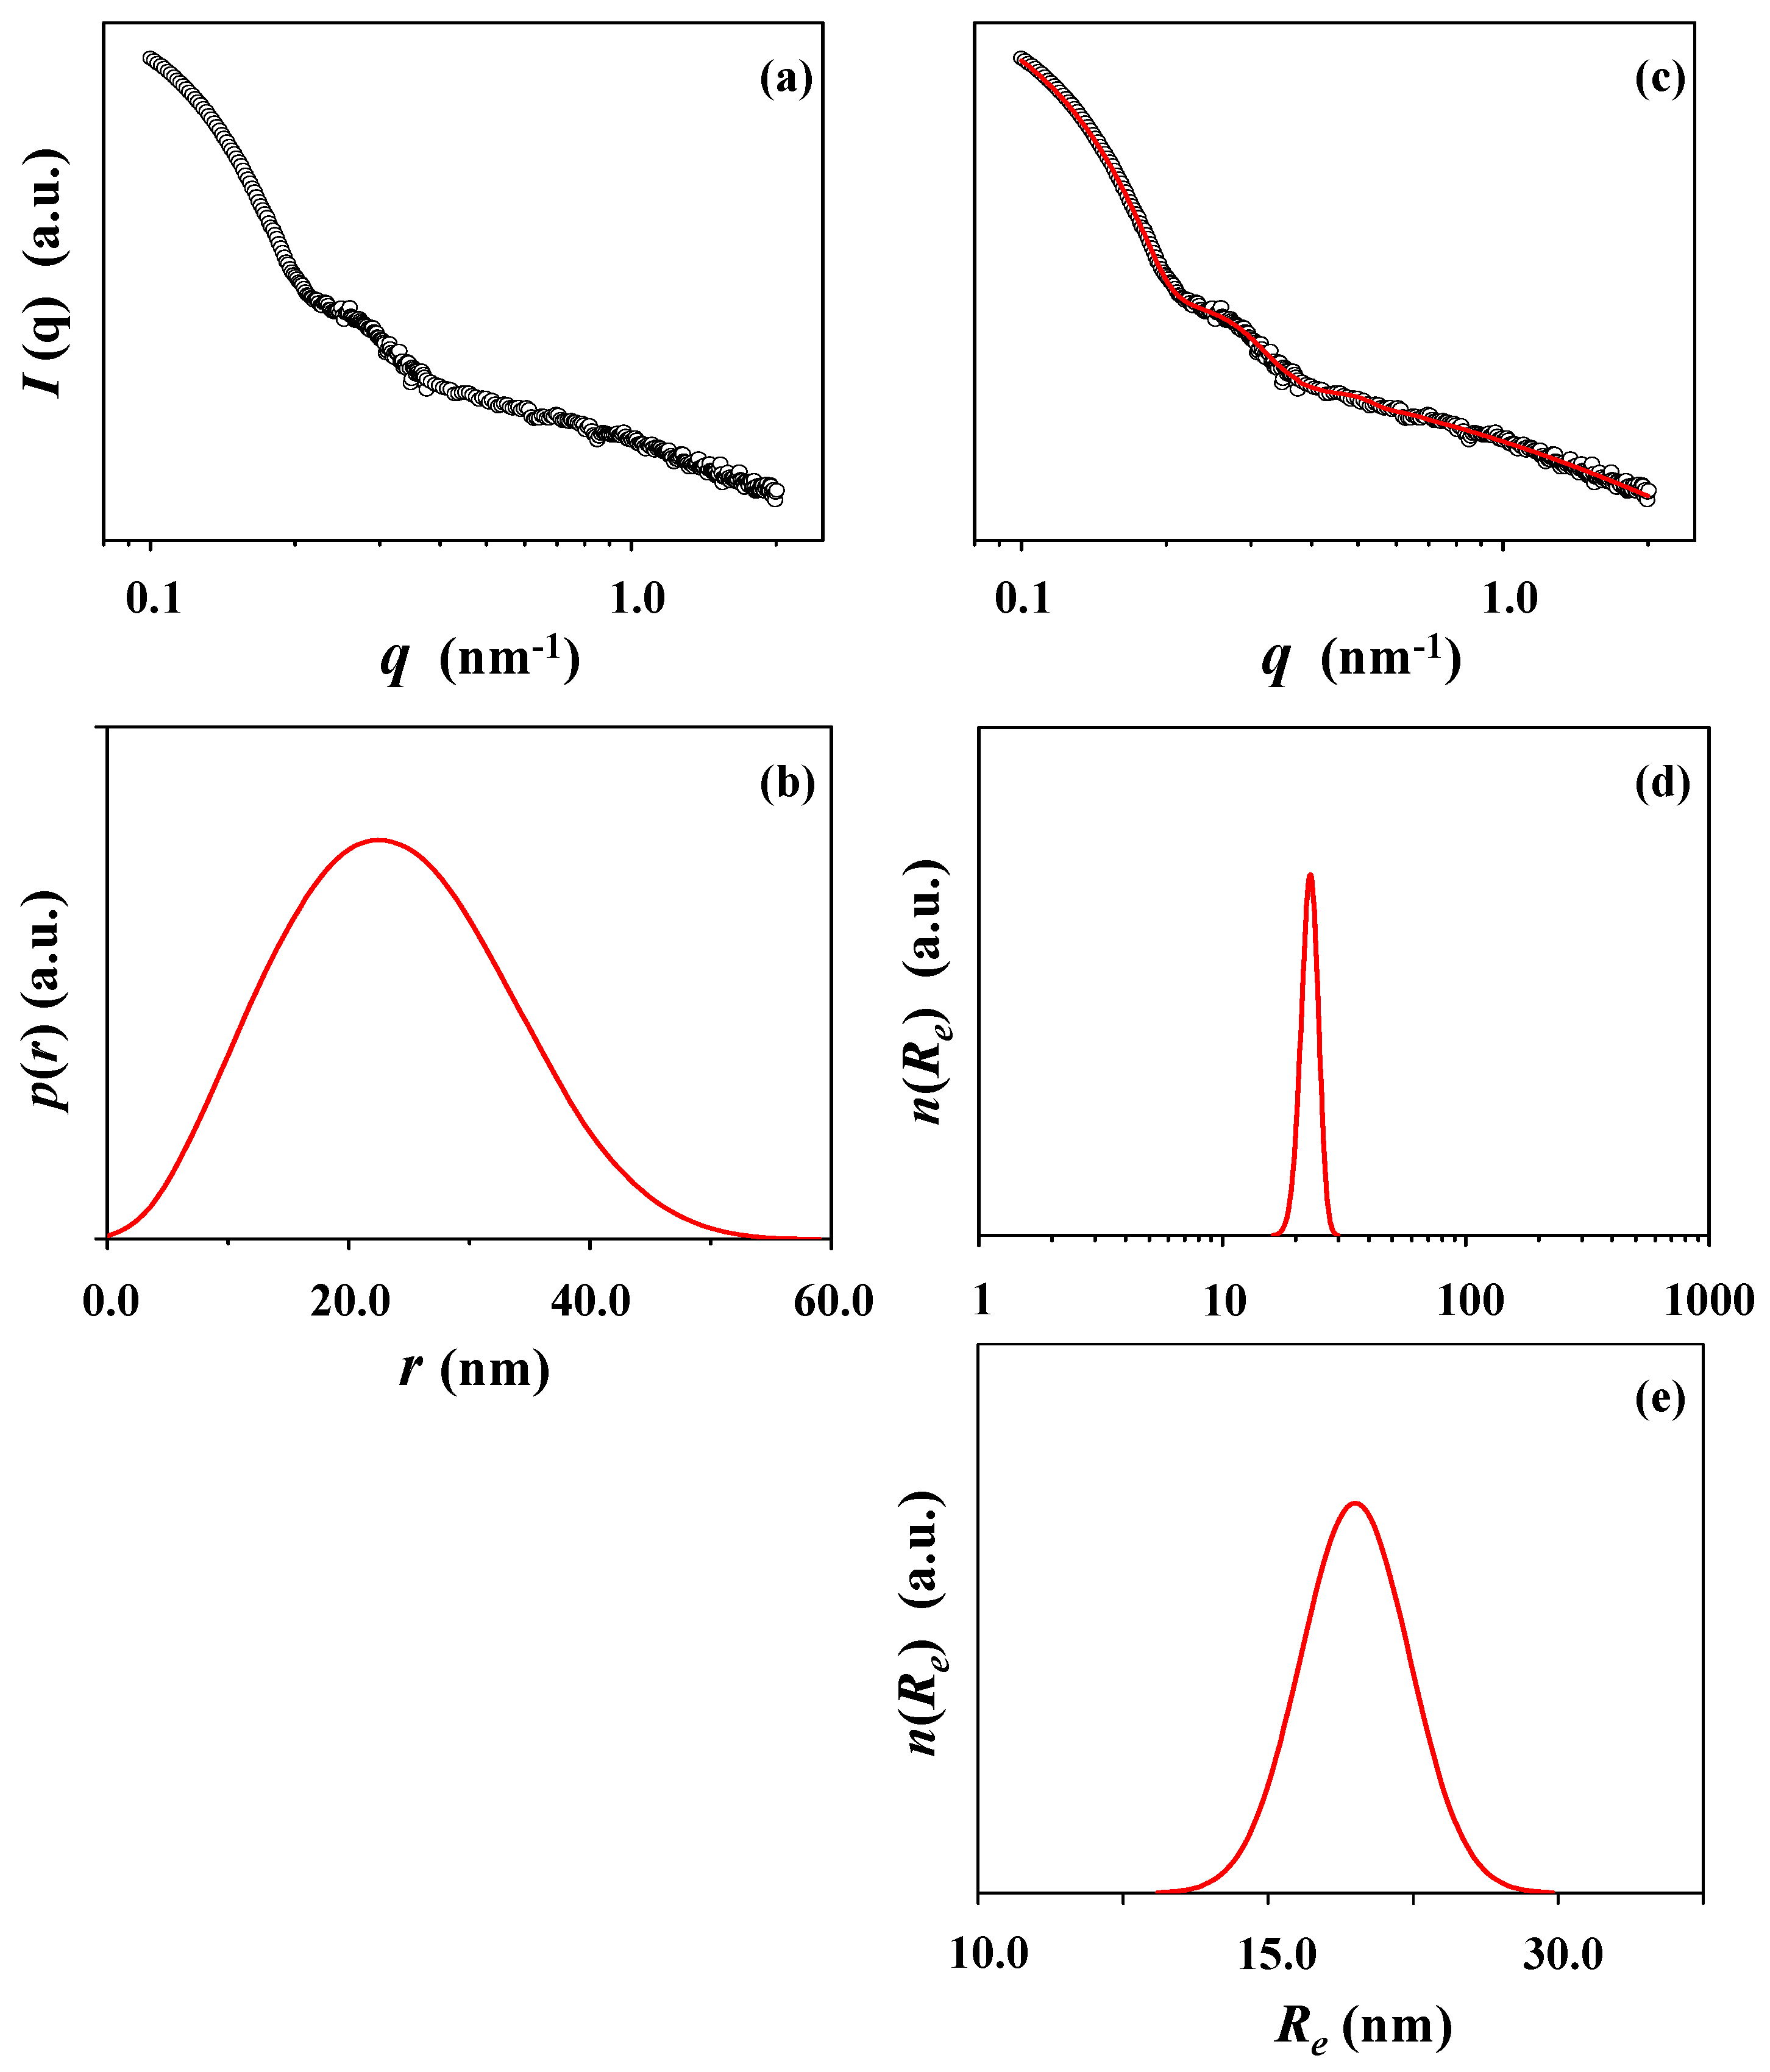
2.5.4. Three-Phase Cylinder Model Analysis
3. Results and Discussion
4. Conclusions
Author Contributions
Funding
Acknowledgments
Conflicts of Interest
References and Notes
- Antonietti, M.; Forster, S. Vesicles and liposomes: A self-assembly principle beyond lipids. Adv. Mater. 2003, 15, 1323–1333. [Google Scholar] [CrossRef]
- Atanase, L.I.; Riess, G. Self-assembly of block and graft copolymers in organic solvents: An overview of recent advances. Polymers 2018, 10, 62. [Google Scholar] [CrossRef]
- Atanase, L.I.; Desbrieres, J.; Riess, G. Micellization of synthetic and polysaccharides-based graft copolymers in aqueous media. Prog. Polym. Sci. 2017, 73, 32–60. [Google Scholar] [CrossRef]
- Kim, Y.Y.; Hwang, B.; Song, S.; Ree, B.J.; Kim, Y.; Cho, S.Y.; Heo, K.; Kwon, Y.K.; Ree, M. Well-defined hollow nanochanneled-silica nanospheres prepared with the aid of sacrificial copolymer nanospheres and surfactant nanocylinders. Nanoscale 2015, 7, 14774–14785. [Google Scholar] [CrossRef] [PubMed]
- Liu, W.T. Nanoparticles and their biological and environmental applications. J. Biosci. Bioeng. 2006, 102, 1–7. [Google Scholar] [CrossRef]
- Zhang, Q.F.; Uchaker, E.; Candelaria, S.L.; Cao, G.Z. Nanomaterials for energy conversion and storage. Chem. Soc. Rev. 2013, 42, 3127–3171. [Google Scholar] [CrossRef]
- Anil, K.; Patri, M.A.; Dobrovolskaia, S.T.; Stern, S.E. McNeil, Preclinical Characterization of Engineered Nanoparticles Intended for Cancer Therapeutics. In Nanotechnology for Cancer Therapy; Amiji, M.M., Ed.; Taylor Francis Group: Boca Raton, FL, USA, 2006; Chapter 7. [Google Scholar]
- Eaton, P.; Quaresma, P.; Soares, C.; Neves, C.; de Almeida, M.P.; Pereira, E.; West, P. A direct comparison of experimental methods to measure dimensions of synthetic nanoparticles. Ultramicroscopy 2017, 182, 179–190. [Google Scholar] [CrossRef]
- Hassellov, M.; Readman, J.W.; Ranville, J.F.; Tiede, K. Nanoparticle analysis and characterization methodologies in environmental risk assessment of engineered nanoparticles. Ecotoxicology 2008, 17, 344–361. [Google Scholar] [CrossRef]
- Wolfgang, H.-G.; Dorothee, H.; Klaus-Peter, J.; Carl Georg, F.; Harald, B. Current limitations of SEM and AFM metrology for the characterization of 3D nanostructures. Meas. Sci. Technol. 2011, 22, 094003. [Google Scholar]
- Mahl, D.; Diendorf, J.; Meyer-Zaika, W.; Epple, M. Possibilities and limitations of different analytical methods for the size determination of a bimodal dispersion of metallic nanoparticles. Colloids Surf. A 2011, 377, 386–392. [Google Scholar] [CrossRef]
- DeBlois, R.W.; Bean, C.P. Counting and sizing of submicron particles by the resistive pulse technique. Rev. Sci. Instrum. 1970, 41, 909–916. [Google Scholar] [CrossRef]
- Stetefeld, J.; McKenna, S.A.; Patel, T.R. Dynamic light scattering: A practical guide and applications in biomedical sciences. Biophys. Rev. 2016, 8, 409–427. [Google Scholar] [CrossRef] [PubMed]
- Pabst, W.; Gregorová, E. Characterization of Particles and Particle Systems; Institute of Chemical Technology (ICT): Prague, Czech, 2007. [Google Scholar]
- Heo, K.; Kim, Y.Y.; Kitazawa, Y.; Kim, M.; Jin, K.D.; Yamamoto, T.; Ree, M. Structural characteristics of amphiphilic linear and cyclic block copolymer micelles in aqueous solutions. ACS Macro Lett. 2014, 3, 233–239. [Google Scholar] [CrossRef]
- Kim, M.; Rho, Y.; Jin, K.S.; Ahn, B.; Jung, S.; Kim, H.; Ree, M. pH-dependent structures of ferritin and apoferritin in solution: Disassembly and reassembly. Biomacromolecules 2011, 12, 1629–1640. [Google Scholar] [CrossRef]
- Shin, S.R.; Jin, K.S.; Lee, C.K.; Kim, S.I.; Spinks, G.M.; So, I.; Jeon, J.-H.; Kang, T.M.; Mun, J.Y.; Han, S.-S.; et al. Fullerene attachment enhances performance of a DNA nanomachine. Adv. Mater. 2009, 21, 1907–1910. [Google Scholar] [CrossRef]
- Berne, B.J.; Pecora, R. Dynamic Light Scattering; Courier Dover: New York, NY, USA, 2000. [Google Scholar]
- Chu, B. Laser Light Scattering: Basic Principles and Practice; Academic Press: New York, NY, USA, 1992. [Google Scholar]
- Pecora, R. Doppler shifts in light scattering from pure liquids and polymer solutions. J. Chem. Phys. 1964, 40, 1604–1614. [Google Scholar] [CrossRef]
- Koppel, D.E. Analysis of macromolecular polydispersity in intensity correlation spectroscopy: The method of cumulants. J. Chem. Phys. 1972, 57, 4814–4820. [Google Scholar] [CrossRef]
- Hassan, P.A.; Kulshreshtha, S.K. Modification to the cumulant analysis of polydispersity in quasielastic light scattering data. J. Colloid Interface Sci. 2006, 300, 744–748. [Google Scholar] [CrossRef]
- Provencher, S. CONTIN: A general purpose constrained regularization program for inverting noisy linear algebraic and integral equations. Comput. Phys. Commun. 1982, 27, 229–242. [Google Scholar] [CrossRef]
- Provencher, S.W. A constrained regularization method for inverting data represented by linear algebraic or integral equations. Comput. Phys. Commun. 1982, 27, 213–227. [Google Scholar] [CrossRef]
- Some of DLS instrument manufacturers and their data analysis software packages: (i) Malvern Instruments Ltd. (Enigma Business Park, Grovewood Road, Malvern, Worcestershire, WR14 1XZ, UK); (ii) Brookhaven Instruments Co. (750 Blue Point Road, Holtsville, NY 11742, USA); (iii) Otsuka Electronics (3-26-3, Shodai-Tajika, Hirakata-shi, Osaka 573-1132, Japan); (iv) Anton Paar GmbH (Anton Paar Strasse 20, 8054 Graz, Austria); (v) LS Instruments AG (Passage du Cardinal 1, CH-1700 Fribourg, Switzerland); (v) Microtrac GmbH (Campus Fichtenhain 42, D-47807 Krefeld, Germany).
- Mizusaki, M.; Endo, T.; Nakahata, R.; Morishima, Y.; Yusa, S.-I. pH-induced association and dissociation of intermolecular complexes formed by hydrogen bonding between diblock copolymers. Polymers 2017, 9, 367. [Google Scholar] [CrossRef]
- Skandalis, A.; Sergides, A.; Bakandritsos, A.; Pispas, S. PLMA-b-POEGMA amphiphilic block copolymers as nanocarriers for the encapsulation of magnetic nanoparticles and indomethacin. Polymers 2018, 10, 14. [Google Scholar] [CrossRef]
- Zhang, B.; Zhang, H.; Li, Y.; Hoskins, J.N.; Grayson, S.M. Exploring the effect of amphiphilic polymer architecture: Synthesis, characterization, and self-assembly of both cyclic and linear poly(ethylene glycol)-b-polycaprolactone. ACS Macro Lett. 2013, 2, 845–848. [Google Scholar] [CrossRef]
- Hu, J.; Whittaker, M.R.; Duong, H.; Li, Y.; Boyer, C.; Davis, T.P. Biomimetic polymers responsive to a biological signaling molecule: Nitric oxide triggered reversible self-assembly of single macromolecular chains into nanoparticles. Angew. Chem. Int. Ed. 2014, 53, 7779–7784. [Google Scholar] [CrossRef] [PubMed]
- Anraku, Y.; Kishimura, A.; Oba, M.; Yamasaki, Y.; Kataoka, K. Spontaneous formation of nanosized unilamellar polyion complex vesicles with tunable size and properties. J. Am. Chem. Soc. 2010, 132, 1631–1636. [Google Scholar] [CrossRef] [PubMed]
- Jo, Y.S.; van der Vlies, A.J.; Gantz, J.; Thacher, T.N.; Antonijevic, S.; Cavadini, S.; Demurtas, D.; Stergiopulos, N.; Hubbell, J.A. Micelles for delivery of nitric oxide. J. Am. Chem. Soc. 2009, 131, 14413–14418. [Google Scholar] [CrossRef] [PubMed]
- Ree, B.J.; Satoh, Y.; Jin, K.S.; Isono, T.; Kim, W.J.; Kakuchi, T.; Satoh, T.; Ree, M. Well-defined stable nanomicelles self-assembled by cyclic and tadpole polymers: A versatile smart carrier platform. NPG Asia Mater. 2017, 9, e453. [Google Scholar] [CrossRef]
- Isono, T.; Satoh, Y.; Miyachi, K.; Chen, Y.; Sato, S.; Tajima, K.; Satoh, T.; Kakuchi, T. Synthesis of linear, cyclic, figure-eight-shaped, and tadpole-shaped amphiphilic block copolyethers via t-Bu-P4-catalyzed ring-opening polymerization of hydrophilic and hydrophobic glycidyl ethers. Macromolecules 2014, 47, 2853–2863. [Google Scholar] [CrossRef]
- Kwon, W.; Rho, Y.; Kamoshida, K.; Kwon, K.H.; Jeong, Y.C.; Kim, J.; Misaka, H.; Shin, T.J.; Kim, J.; Kim, K.-W.; et al. Well-defined functional linear aliphatic diblock copolyethers: A versatile linear aliphatic polyether platform for selective functionalizations and various nanostructures. Adv. Funct. Mater. 2012, 22, 5194–5208. [Google Scholar] [CrossRef]
- Kim, G.; Park, S.; Jung, J.; Heo, K.; Yoon, J.; Kim, H.; Kim, I.J.; Kim, J.R.; Lee, J.I.; Ree, M. Novel brush polymers with phosphorylcholine bristle ends: Synthesis, structure, properties, and biocompatibility. Adv. Funct. Mater. 2009, 19, 1631–1644. [Google Scholar] [CrossRef]
- Jung, J.; Kim, H.; Ree, M. Self-assembly of novel lipid-mimicking brush polymers in nanoscale thin films. Soft Matter 2014, 10, 701–708. [Google Scholar] [CrossRef] [PubMed]
- Lee, J.; Suh, E.; Byambabaatar, S.; Lee, S.; Kim, H.; Jin, K.S.; Ree, M. Structural characteristics of pneumolysin and its domains in a biomimetic solution. ACS Omega 2018, 3, 9453–9461. [Google Scholar] [CrossRef]
- Siegert, A.J.F. On the fluctuations in signals returned by many independently moving scatterers. In Massachusetts Institute of Technology; Radiation Laboratory Report No. 465; MIT: Cambridge, MA, USA, 1949. [Google Scholar]
- Simons, J. The Siegert method in resonance scattering: Relation to L2 methods. Int. J. Quantum Chem. 1981, 20, 779–780. [Google Scholar] [CrossRef]
- Einstein, A. Über die von der molekularkinetischen theorie der wärme geforderte bewegung von in ruhenden flüssigkeiten suspendierten teilchen. Ann. Phys. 1905, 322, 549–560. [Google Scholar] [CrossRef]
- Einstein, A. Zur theorie der brownschen bewegung. Ann. Phys. 1906, 324, 371–381. [Google Scholar] [CrossRef]
- Guinier, A.; Fournet, G. Small Angle Scattering X-ray; Wiley: New York, NY, USA, 1955. [Google Scholar]
- Glatter, O.; Kratky, O. Small Angle X-ray Scattering; Academic: New York, NY, USA, 1982. [Google Scholar]
- Glatter, O.J. A new method for the evaluation of small-angle scattering data. J. Appl. Crystallogr. 1977, 10, 415–421. [Google Scholar] [CrossRef]
- Pedersen, J.S. Analysis of small-angle scattering data from colloids and polymer solutions: Modeling and least-squares fitting. Adv. Colloid Interface Sci. 1997, 70, 171–210. [Google Scholar] [CrossRef]
- Pedersen, J.S.; Gerstenberg, M.C. Scattering form factor of block copolymer micelles. Macromolecules 1996, 29, 1363–1365. [Google Scholar] [CrossRef]
- Rathgeber, S.; Monkenbusch, M.; Kreitschmann, M.; Urban, V.; Brulet, A. Dynamics of star-burst dendrimers in solution in relation to their structural properties. J. Chem. Phys. 2002, 117, 4047–4062. [Google Scholar] [CrossRef]
- Rodríguez-Fernández, J.; Pérez-Juste, J.; Liz-Marzán, L.M.; Lang, P.R. Dynamic light scattering of short Au rods with low aspect ratios. J. Phys. Chem. 2007, 111, 5020–5025. [Google Scholar] [CrossRef]
- Aragón, S.R.; Pecora, R. Theory of dynamic light scattering from polydisperse systems. J. Chem. Phys. 1976, 64, 2395–2404. [Google Scholar] [CrossRef]


| Polymer | Mn,NMR a (g/mol) | Mw/Mn b | Non-Polar Block | Polar Block | ||||||
|---|---|---|---|---|---|---|---|---|---|---|
| DPNB c | ϕNB d | ρe e (nm−3) | ρm f (g/cm3) | DPPB c | ϕPB d | ρe e (nm−3) | ρm f (g/cm3) | |||
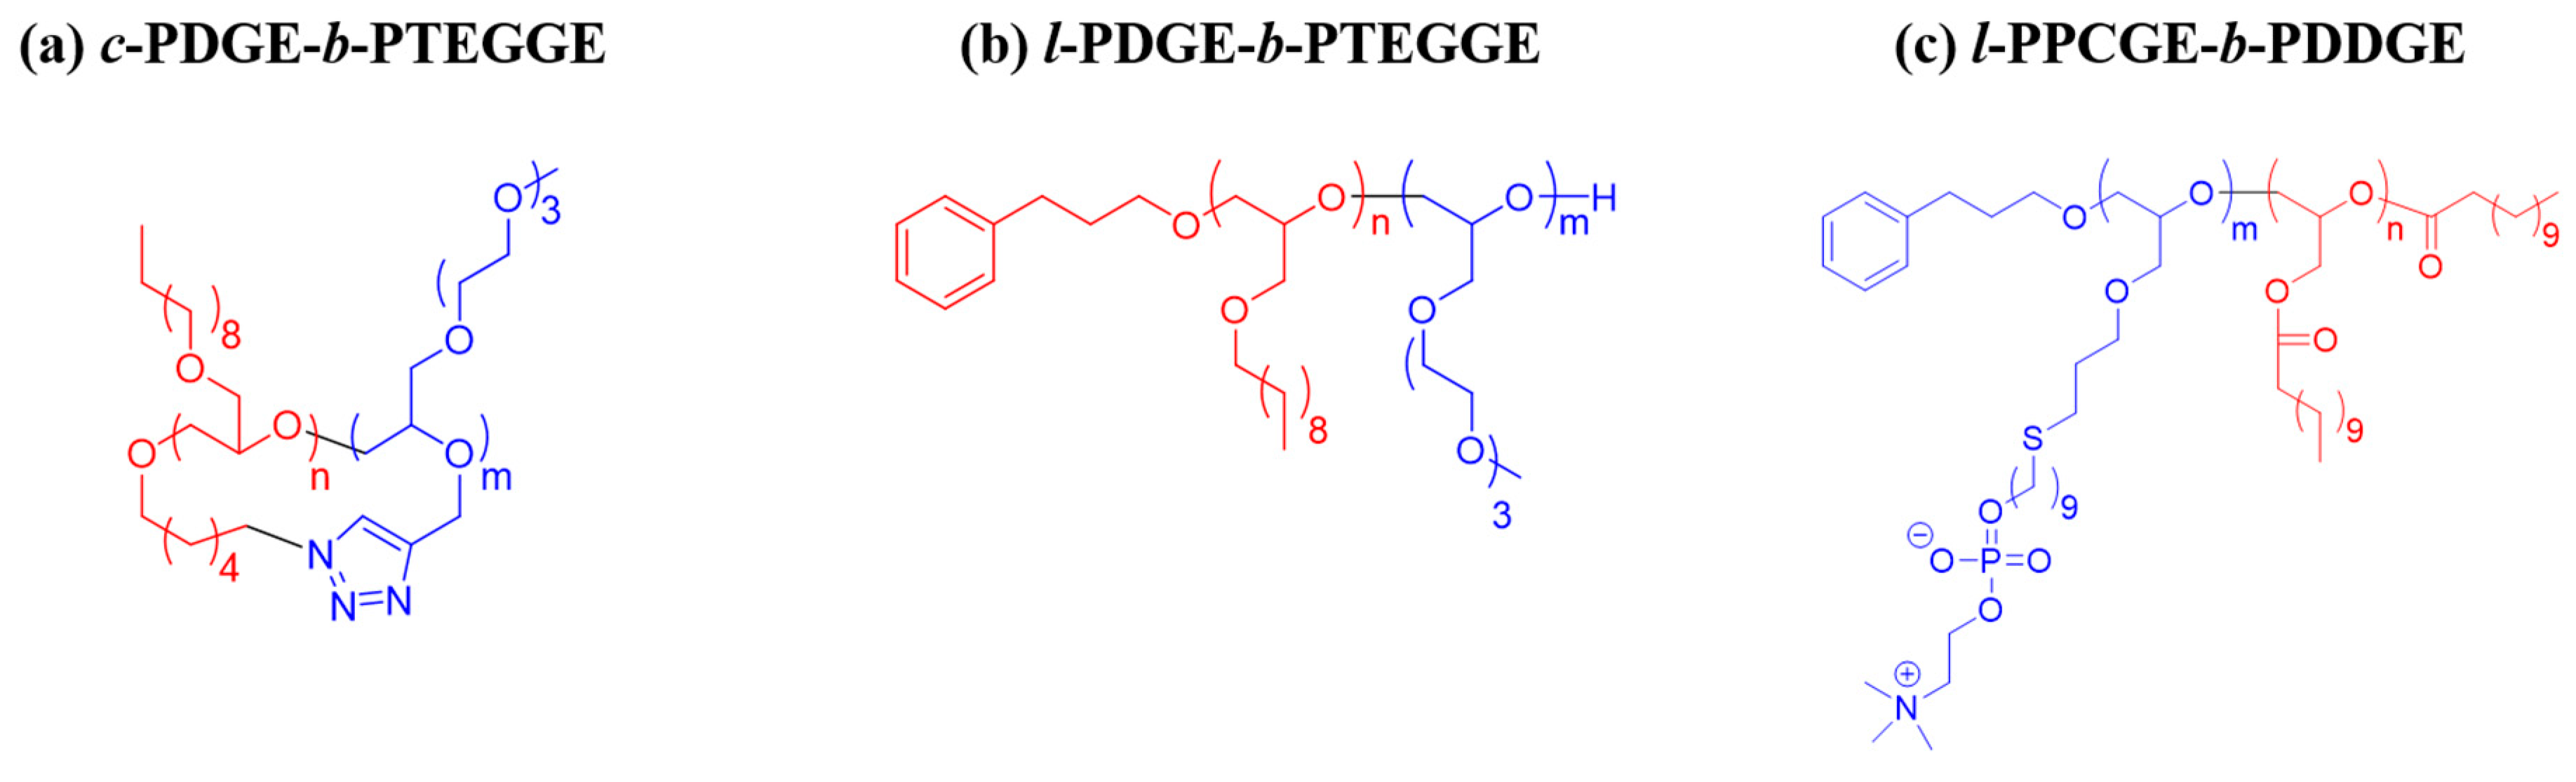
| c-PDGE-b-PTEGGE | 22,300 | 1.04 | 50 | 0.52 | 310 | 0.91 | 51 | 0.48 | - | 0.96 g |
| l-PDGE-b-PTEGGE | 21,900 | 1.04 | 49 | 0.49 | 341 | 1.01 | 51 | 0.51 | 353 | 1.05 |
| l-PPCGE-b-PDDGE | 12,100 | 1.10 | 30 | 0.70 | 380 h | 1.14 | 10 | 0.30 | 405 i | 1.24 |
| DLS Analysis | Peaks Appeared in Size Distribution | ||||||||||
|---|---|---|---|---|---|---|---|---|---|---|---|
| Peak 1 | |||||||||||
| Rh,1a (nm) | φ1 b (%) | Rh,z c (nm) | PDIDLS d | Rg,TPS/Rh,z | Rg,TPS/R h,1 | ||||||
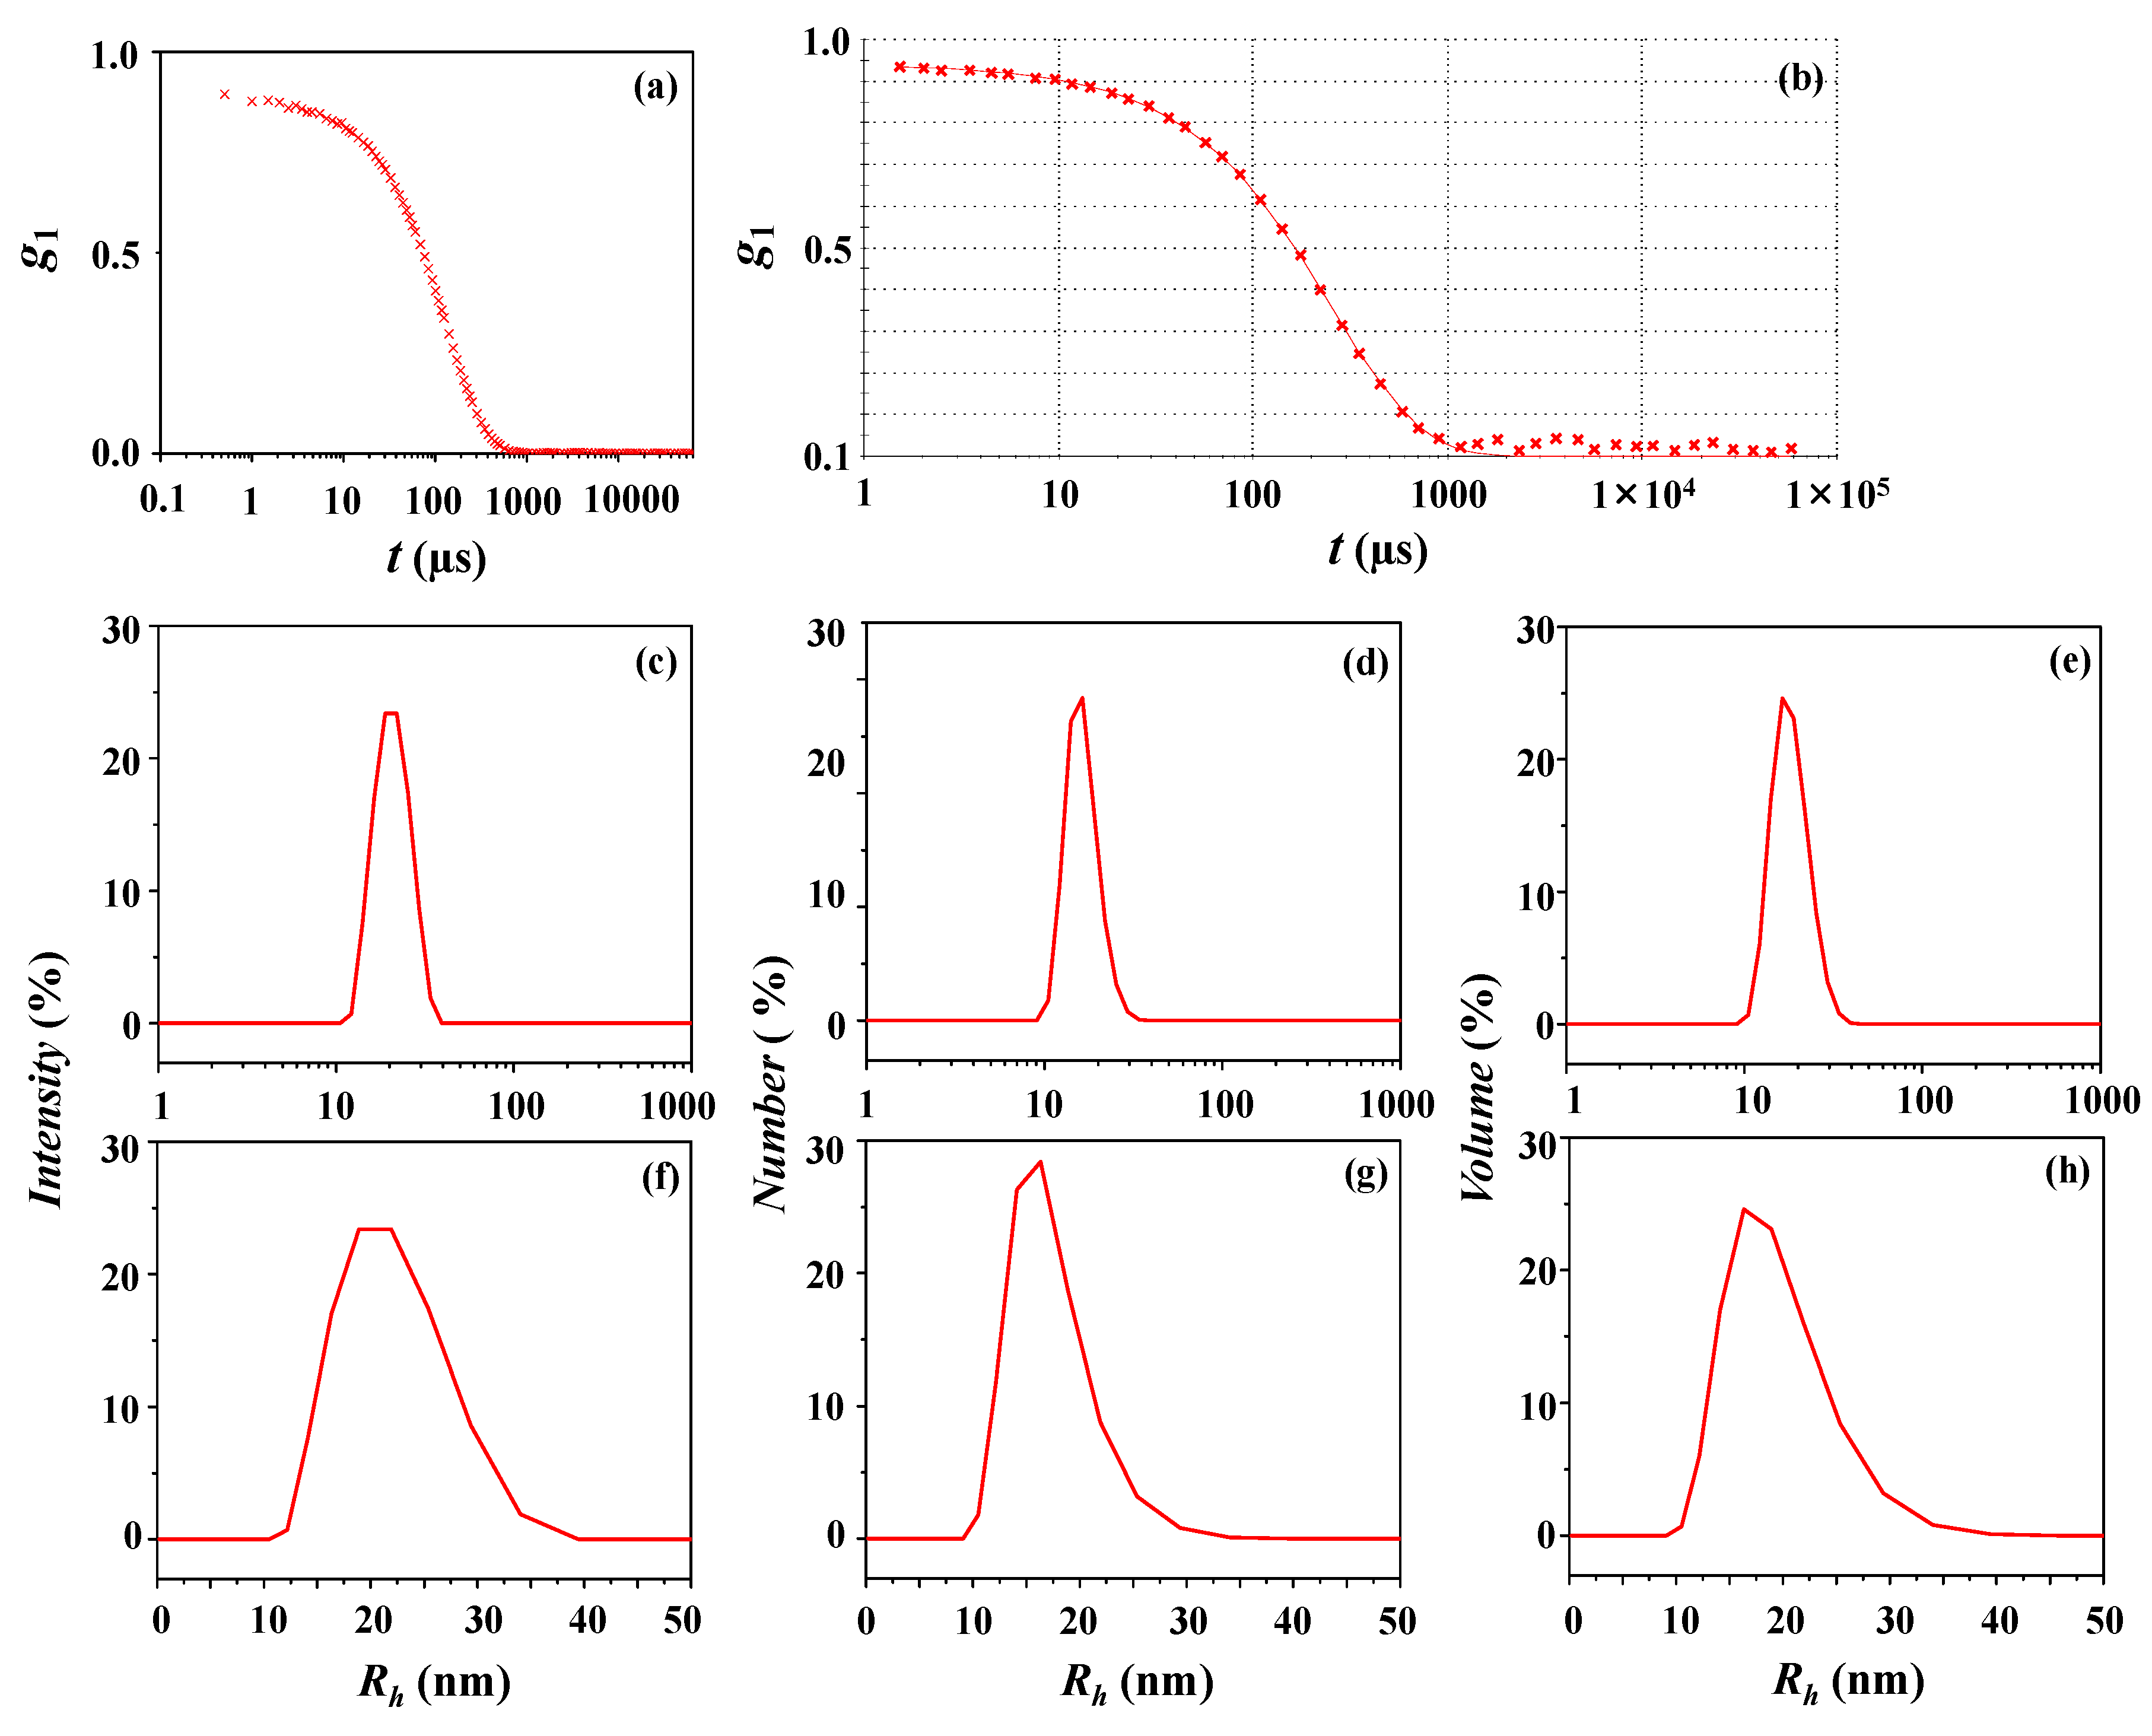
| Intensity-weighted distribution | 21 (5) e | 100 | 20 | 0.03 | 0.42 | 0.40 | |||||
| Number-weighted distribution | 17 (4) | 100 | 0.51 | ||||||||
| Volume-weighted distribution | 19 (4) | 100 | 0.46 | ||||||||
| X-ray scattering analysis | Rg,G f (nm) | Rg,IFT g (nm) | Rg,TPS h (nm) | Rmax i (nm) | Rp j (nm) | Re k (nm) | Dmaxl (nm) | Rg,G/Rg,IFT | Rmax/Rg,IFT | Dmax/Rmax | εelm |
| Guinier | 7.75 | ||||||||||
| Indirect Fourier transformation (IFT) | 7.97 | 10.58 | 23.00 | 0.97 | 1.33 | 2.17 | |||||
| Three-phase ellipsoid | 8.50 | 9.70 | 11.55 | 0.84 | |||||||
| DLS Analysis | Peaks Appeared in Size Distribution | ||||||||||
|---|---|---|---|---|---|---|---|---|---|---|---|
| Peak 1 | Peak 2 | Peak 3 | |||||||||
| Rh,1a (nm) | ϕ1b (%) | Rh,2 (nm) | ϕ2 (%) | Rh,3 (nm) | ϕ3 (%) | Rh,z c (nm) | PDIDLS d | Rg,TPS/Rh,z | Rg,TPS/R h,1 | ||
| Intensity-weighted distribution | 78 (17) e | 15.0 | 467 (99) | 81.9 | 2780 (0) | 3.1 | 1003 | 1.00 | 0.02 | 0.29 | |
| Number-weighted distribution | 62 (15) | 96.6 | 430 (101) | 3.4 | 0 | 0.36 | |||||
| Volume-weighted distribution | 71 (18) | 5.2 | 488 (112) | 59.9 | 2795 (290) | 34.9 | 0.31 | ||||
| X-ray scattering analysis | Rg,G f (nm) | Rg,IFT g (nm) | Rg,TPS h (nm) | Rmax i (nm) | Rp j (nm) | Re k (nm) | Dmaxl (nm) | Rg,G/Rg,IFT | Rmax/Rg,IFT | Dmax/Rmax | εelm |
| Guinier | 18.57 | ||||||||||
| IFT | 18.05 | 22.42 | 59.00 | 1.03 | 1.24 | 2.63 | |||||
| Three-phase ellipsoid | 22.20 | 34.50 | 23.00 | 1.50 | |||||||
| DLS Analysis | Peaks Appeared in Size Distribution | ||||||||||
|---|---|---|---|---|---|---|---|---|---|---|---|
| Peak 1 | Peak 2 | Peak 3 | |||||||||
| Rh,1a (nm) | ϕ1b (%) | Rh,2 (nm) | ϕ2 (%) | Rh,3 (nm) | ϕ3 (%) | Rh,z c (nm) | PDIDLS d | Rg,TPS/Rh,z | Rg,TPS/R h,1 | ||
| Intensity-weighted distribution | 8 (2) e | 3.5 | 42 (18) | 96.5 | 32 | 0.22 | 0.26 | 1.07 | |||
| Number-weighted distribution | 7 (2) | 100 | 1.30 | ||||||||
| Volume-weighted distribution | 7 (2) | 69.6 | 25 (12) | 30.4 | 1.17 | ||||||
| X-ray scattering analysis | Rg,G f (nm) | Rg,IFT g (nm) | Rg,TPS h (nm) | Rmax i (nm) | Rp j (nm) | Re k (nm) | Dmax l (nm) | Rg,G/Rg,IFT | Rmax/Rg,IFT | Dmax/Rmax | εcylm |
| Guinier | 8.44 | ||||||||||
| IFT | 8.61 | 9.95 | 27.30 | 0.98 | 1.16 | 2.74 | |||||
| Three-phase cylinder | 8.43 | 7.70 | 22.30 | 1.45 | |||||||
© 2018 by the authors. Licensee MDPI, Basel, Switzerland. This article is an open access article distributed under the terms and conditions of the Creative Commons Attribution (CC BY) license (http://creativecommons.org/licenses/by/4.0/).
Share and Cite
Ree, B.J.; Lee, J.; Satoh, Y.; Kwon, K.; Isono, T.; Satoh, T.; Ree, M. A Comparative Study of Dynamic Light and X-ray Scatterings on Micelles of Topological Polymer Amphiphiles. Polymers 2018, 10, 1347. https://doi.org/10.3390/polym10121347
Ree BJ, Lee J, Satoh Y, Kwon K, Isono T, Satoh T, Ree M. A Comparative Study of Dynamic Light and X-ray Scatterings on Micelles of Topological Polymer Amphiphiles. Polymers. 2018; 10(12):1347. https://doi.org/10.3390/polym10121347
Chicago/Turabian StyleRee, Brian J., Jongchan Lee, Yusuke Satoh, Kyungho Kwon, Takuya Isono, Toshifumi Satoh, and Moonhor Ree. 2018. "A Comparative Study of Dynamic Light and X-ray Scatterings on Micelles of Topological Polymer Amphiphiles" Polymers 10, no. 12: 1347. https://doi.org/10.3390/polym10121347
APA StyleRee, B. J., Lee, J., Satoh, Y., Kwon, K., Isono, T., Satoh, T., & Ree, M. (2018). A Comparative Study of Dynamic Light and X-ray Scatterings on Micelles of Topological Polymer Amphiphiles. Polymers, 10(12), 1347. https://doi.org/10.3390/polym10121347