Article

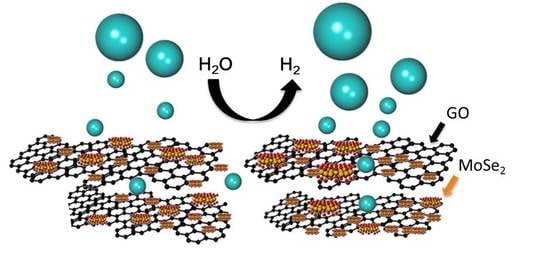
MoSe2-GO/rGO Composite Catalyst for Hydrogen Evolution Reaction

1
School of Chemical Engineering and Materials Science, Chung-Ang University, 84 Heukseok-ro, Dongjak-gu, Seoul 06974, Korea
2
Institute of Research and Development, Duy Tan University, Da Nang 550000, Vietnam
3
Department of Materials Science and Engineering, Research Institute of Advanced Materials, Seoul National University, Seoul 08826, Korea
4
Department of Chemical and Biomolecular Engineering, The University of Hong Kong Science and Technology, Clear Water Bay, Kowloon, Hong Kong
*
Authors to whom correspondence should be addressed.
These authors contributed equally to this work.
Polymers 2018, 10(12), 1309; https://doi.org/10.3390/polym10121309
Submission received: 3 November 2018 / Revised: 21 November 2018 / Accepted: 24 November 2018 / Published: 27 November 2018

Abstract

:
There has been considerable research to engineer composites of transition metal dichalcogenides with other materials to improve their catalytic performance. In this work, we present a modified solution-processed method for the formation of molybdenum selenide (MoSe2) nanosheets and a facile method of structuring composites with graphene oxide (GO) or reduced graphene oxide (rGO) at different ratios to prevent aggregation of the MoSe2 nanosheets and hence improve their electrocatalytic hydrogen evolution reaction performance. The prepared GO, rGO, and MoSe2 nanosheets were characterized by X-ray powder diffraction, Raman spectroscopy, X-ray photoelectron spectroscopy, transmission electron microscopy, energy-dispersive X-ray spectroscopy, and scanning electron microscopy. The electrocatalytic performance results showed that the pure MoSe2 nanosheets exhibited a somewhat high Tafel slope of 80 mV/dec, whereas the MoSe2-GO and MoSe2-rGO composites showed lower Tafel slopes of 57 and 67 mV/dec at ratios of 6:4 and 4:6, respectively. We attribute the improved catalytic effects to the better contact and faster carrier transfer between the edge of MoSe2 and the electrode due to the addition of GO or rGO.

Graphical Abstract

1. Introduction

Hydrogen has received significant attention as one of the most environmentally friendly and efficient energy sources to replace current traditional fossil fuels [1,2]. Electrocatalytic H2 production from water splitting is a widely studied H2 production technology [3,4,5,6]. Platinum is the best-known catalyst for the electrocatalytic hydrogen evolution reaction (HER) [7,8,9]. However, its large-scale application is limited by its scarcity and high cost. Therefore, much research has been done to find an earth-abundant, efficient catalyst material with an HER with performance comparable to that of Pt. Recently, two dimensional transitional metal dichalcogenides (2D-TMDs) have been intensively investigated and employed in various applications such as solar cells, light emitting diodes, gas sensors, and HER [10,11,12,13,14,15]. Especially, the performance of 2D-TMDs as catalysts for HER approaching Pt has been demonstrated by several groups, revealing their potential in practical applications [16,17,18,19,20,21,22,23].
MoSe2 is a typical TMD material with layered structure, in which one layer of Mo atoms is sandwiched between two layers of Se atoms, and the layers are bound by weak van der Waals interaction [24,25,26]. The excellent catalytic activity of MoSe2 has been found to arise from the unsaturated Se atoms on the edges rather than the basal planes, which are electrochemically inert toward the HER; this has been confirmed by both theoretical calculations and experimental investigation in previous research [5,26,27,28,29]. Therefore, intense efforts have been made to synthesize MoSe2 or other metal dichalcogenide nanostructures with a high density of active edge sites [28,29,30,31]. Another problem that limits the catalytic activity of MoSe2 is its low conductivity, which limits electron transport between the electrode and electrocatalyst. To solve this conductivity problem and improve the electrocatalytic performance of MoSe2, combining MoSe2 nanosheets with other highly conductive materials such as porous carbon [32], reduced graphene oxide (rGO) [33], and metal oxides [34] is thought to be an effective strategy and has been sufficiently demonstrated in previous research. However, this method generally involves in situ growth of nanosheets on a conductive carbon substrate, so it is hard to control the size of the nanostructure.
In this study, we successfully prepared MoSe2 nanosheets using a modified colloidal synthesis method. The as-synthesized MoSe2 was prone to aggregation and showed unsatisfactory HER performance, with a somewhat high Tafel slope of 80 mV/dec. However, after it was mixed with GO or rGO at different ratios, we discovered that the aggregation problem was solved, and the composites tended to be uniformly distributed on the substrate, which was confirmed by field emission scanning electron microscopy (FE-SEM). Owing to this uniformity, along with the conductivity of rGO, the HER performance of the composites was better than that of the bare MoSe2 nanosheets. In addition, the resistance between the catalyst material and electrode was decreased, as calculated by electrochemical impedance spectroscopy (EIS) analysis. We identified this as one of the reasons for the catalytic performance improvement of the MoSe2 composites.

2. Materials and Methods

2.1. Materials

All of the chemicals used in this work, including graphite powder, sodium nitrate (NaNO3), potassium permanganate (KMnO4), hydrogen peroxide (H2O2, 30%), l-ascorbic acid (L-AA, Sigma-Aldrich, Seoul, Korea), molybdenum hexacarbonyl (Mo(CO)6, Sigma-Aldrich), selenium (99.999%, Sigma-Aldrich), oleic acid (OA, 85%, Fluka, Mexico City, Mexico), oleylamine (OAm, 80–90%, Acros Organics, Geel, Belgium), and dodecanethiol were of analytical grade and used as received without further purification.

2.2. Preparation of GO-MoSe2 and rGO-MoSe2 Composites

2.2.1. Synthesis of GO and rGO

GO was prepared using natural graphite powder by a modified Hummers method [35], and rGO was prepared following a previously reported method [36]. Briefly, 0.5 g of graphite powder and 0.5 g of NaNO3 were placed in a 250 mL flask containing 23 mL of concentrated H2SO4 and 3 g of KMnO4. The mixture was kept in an ice bath under strong stirring for 2 h. Next, the temperature of the reaction mixture was raised to 95 °C and held there for another 1 h. After the reaction was complete, the suspension was treated with H2O2 (10 mL, 30%) to remove the unreacted KMnO4 and then washed with water (55 mL); this was followed by dispersion in dimethylformamide (DMF) and sonication to obtain a GO/DMF solution. To obtain rGO nanosheets, 50 mg of L-AA was added to 50 mL of an aqueous dispersion of GO under vigorous stirring. GO was reduced for 48 h to remove most of the oxygen functionalities.

2.2.2. Synthesis of MoSe2 Nanosheets

MoSe2 nanosheets were prepared via a solution-processed colloidal method with a few important modifications to a previously reported method [26]. The synthesis was carried out using a three-neck flask under continuous N2 atmosphere in a heating mantle. In a typical procedure, 1.2 mmol Se powder was added to a mixture of OAm and dodecanethiol (9:1 vol %) in a three-necked flask. Then, the mixed solution was kept at 120 °C for 10 min under vigorous magnetic stirring to remove any water and oxygen; it was then heated to 200 °C for 1 h to produce a clear, light-yellow, highly active Se precursor solution. A Mo precursor solution was prepared by dissolving 0.6 mmol Mo(CO)6 in 9 mL of OA and 12 mL of acetone; it was then injected into the flask using a syringe at 2 drops/s after the Se solution was cooled to approximately 150 °C. Next, the mixtures were heated to 200 °C again and held for 30 min; they were then held at 250 °C for 30 min before being cooled rapidly by removal of the flask from the heating mantle. Subsequently, a large amount of hexane was added to the mixture, and the products were separated by centrifugation and washed repeatedly with hexane and ethanol. To totally remove the organic molecules, the products were further treated by dissolution in 30 mL of acetic acid, and the solution kept at 85 °C for 12 h with stirring. The products were washed with alcohol and centrifuged three times; finally, they were dried in a vacuum oven at 50 °C for further characterization.

2.2.3. Synthesis of MoSe2-GO and MoSe2-rGO Composites

GO, rGO, and MoSe2 nanosheet powders were dissolved separately in DMF at a concentration of 1 mg/mL. Then, the GO and rGO solutions were each mixed separately with the MoSe2 nanosheet solution at volume ratios of 10:0 (no MoSe2 nanosheets), 8:2, 6:4, 4:6, 2:8, and 0:10 (only MoSe2 nanosheets). The mixtures were sonicated for approximately 1 h to ensure complete contact.

2.3. Material Characterization

The X-ray diffraction (XRD) patterns of the GO, rGO, and MoSe2 nanosheets were recorded on a powder X-ray diffractometer (Bruker New D8-Advance, Seoul, Korea) using Cu Kα radiation (λ = 0.154 nm). FE-SEM (Zeiss 300 VP, Seoul, Korea) images were obtained at an acceleration voltage of 10 kV to study the morphology of MoSe2 and the composites. Transmission electron microscopy (TEM, JEOL, Tokyo, Japan), along with energy-dispersive X-ray spectroscopy (EDX, JEOL, Tokyo, Japan) mapping, was performed using a JEOL (Tokyo, Japan) instrument to determine the size of the MoSe2 nanosheets and conduct elemental analysis. X-ray photoelectron spectroscopy (XPS, Thermo Fisher, K-Alpha, Seoul, Korea) was performed under a vacuum exceeding 1 × 10⁻⁵ mbar using Mg Kα radiation (1250 eV) and a constant pass energy of 40 eV to verify the presence of Mo and Se. Raman spectra (Horiba, Kyoto, Japan) were obtained at an excitation wavelength of 514 nm.

2.4. Electrochemical Measurements

HER measurements (Ivium Technologies, Nstat, Seoul, Korea) were made using a three-electrode system with a saturated calomel reference electrode, graphite rod counter electrode, and glassy carbon working electrode 3 mm in diameter in a 0.5 M H2SO4 standard electrolyte solution. The MoSe2 nanosheets and the composites dispersed in DMF were sonicated for 10 min before use. Then, 5 µL of catalyst ink was loaded onto the glassy carbon electrodes by drop casting and dried, followed by dropwise addition of 5 µL of Nafion solution (5 wt %) and further drying. Linear sweep voltammetry (LSV) curves were obtained at a sweep rate of 5 mV/s from 0.2 to 1.0 V versus reversible hydrogen electrode (RHE). EIS was performed by applying a constant potential of 0.27 V versus RHE in the frequency range of 100 kHz to 0.1 Hz with an amplitude of 10 mV.

3. Results and Discussion

3.1. Synthesis of MoSe2 Nanosheets

The MoSe2 nanosheets were synthesized by injecting the Mo precursor, which was prepared by dissolving Mo(CO)6 in OAm and acetone, into a colloidal solution containing a high-activity Se source. Elemental Se has limited solubility in most solvents, so it has low reactivity for many reactions. Dodecanethiol can reportedly facilitate the dissolution of Se powder in OAm and lower the surface energy of the basal edges to prevent overgrowth of the basal plane [30]. During preparation of the Se precursor solution, the Se powder first dissolved completely in OAm and formed a dark red solution, which then gradually became transparent and light yellow, and was considered to be the highly active Se precursor solution [26,37]. Instead of cooling the Se precursor solution and then injecting it into the reaction flask after decomposition of Mo(CO)6, which was generally the procedure in previous research [26,30], the dissolved Mo(CO)6 was slowly injected into the Se solution while it retained its high activity. It is reported that without the Se precursor, the Mo(CO)6 precursor would first thermally decompose into Mo atoms and CO (Mo(CO)6 → Mo + 6CO), and then the Mo atoms would be oxidized to Mo2C by CO (Mo + 3CO → 1/2Mo2C + 3/2CO2 + C) [38]. However, in our work, when the Mo(CO)6 precursor was slowly injected into the reaction system in the presence of the high-activity Se precursor, the metallic Mo would react with Se directly and quickly, as MoSe2 is thermodynamically more stable than molybdenum carbide [39]. This modification in our method was expected to ensure direct, rapid formation of MoSe2 nanosheets. Further, the mixed solvent of OAm and OA were expected to facilitate the formation of MoSe2 with porous nanostructure, which can increase the exposure of active edges.

3.2. Material Characterization

3.2.1. Characterization of GO and rGO

The GO and rGO were characterized using XRD, XPS, and Raman spectroscopy. Figure 1a shows the XRD patterns of the GO and rGO after reduction. A sharp diffraction peak clearly appears around 11° for the GO sheets; after GO was reduced to rGO, this peak disappeared, and instead a new broad diffraction peak appeared at 24°. This result confirms successful reduction of GO and is consistent with previously reported results [36]. In addition, the laser Raman spectra of GO and rGO are shown in Figure 1b; the D and G bands are centered at 1354 and 1598 cm−1 for GO and 1351 and 1602 cm−1 for rGO, respectively. The variation in the relative intensities of the G band (the E2g mode of sp2 carbon atoms) and D band (the symmetric A1g mode) in the Raman spectra of GO during reduction usually reveals a change in the electronic conjugation state [37]. In GO, the G band appeared slightly more intense than the D band; however, after reduction to rGO, the D band was more intense than that of GO, and the D/G intensity ratio increased significantly, indicating reduction of GO. In addition, the XPS spectra of GO and rGO further proved that most of the oxygen functionalities were removed after 48 h of reduction. As the C 1s XPS spectra of GO in Figure 1c show, the four characteristic peaks located at binding energies of 284. 5, 286.5, 287.7, and 288.7 eV correspond to the C=C/C–C, C–O, C=O, and O=C–H groups, respectively. After reduction, the intensity of the C–O, C=O, and O=C–H peaks, which indicate the existence of oxygen-containing groups, decreased greatly, as shown in Figure 1d.

3.2.2. Characterization of MoSe2

The XRD patterns of the synthesized MoSe2 nanosheets are shown in Figure 2a. The characteristic peaks at 2θ = 13.60°, 31.52°, 37.72°, and 55.67° are assigned to the (002), (100), (103), and (110) crystal planes of hexagonal MoSe2, respectively. These results well matched the reference pattern of hexagonal 2H-MoSe2 (PDF card number 29-0914), indicating the high purity of the as-synthesized product obtained by our method. Further, the broad diffraction peaks revealed the nanoscale dimensions of the products [40]. Further insight into the structure of the MoSe2 nanosheets was obtained from the Raman spectrum, as shown in Figure 2b. It shows two pronounced peaks centered at 246 and 284 cm−1, which were assignable to the out-of-plane A1g and in-plane E2g vibration modes of MoSe2, respectively, and show a red shift compared to those of MoSe2 bulk materials [41]. The surface elemental composition and binding energy of the as-synthesized MoSe2 nanosheets were further investigated by XPS. As shown in Figure 2c and d, the two characteristic peaks at binding energies of 232.15 and 229.08 eV can be assigned to the Mo 3d3/2 and Mo 3d5/2 orbitals, respectively, indicating that Mo is in the +4 valence state. In addition, the characteristic peaks arising from the Se 3d5/2 and Se 3d3/2 orbitals are located at 55.38 and 54.68 eV and reveal the −2 oxidation state of Se.
Figure 3a–c show TEM images of the as-obtained MoSe2 nanosheets at different magnifications. All the particles had nanoscale dimensions, and the diameter of the MoSe2 nanosheets was approximately 2–10 nm, which is consistent with the small size of the products indicated by the XRD results. More details about the size distribution of as-obtained MoSe2 nanosheets are shown in Figure S1. Moreover, the EDX elemental mapping results shown in Figure 3e,f reveal the existence of Mo and Se and their homogeneous distribution throughout the ultrathin nanosheets.

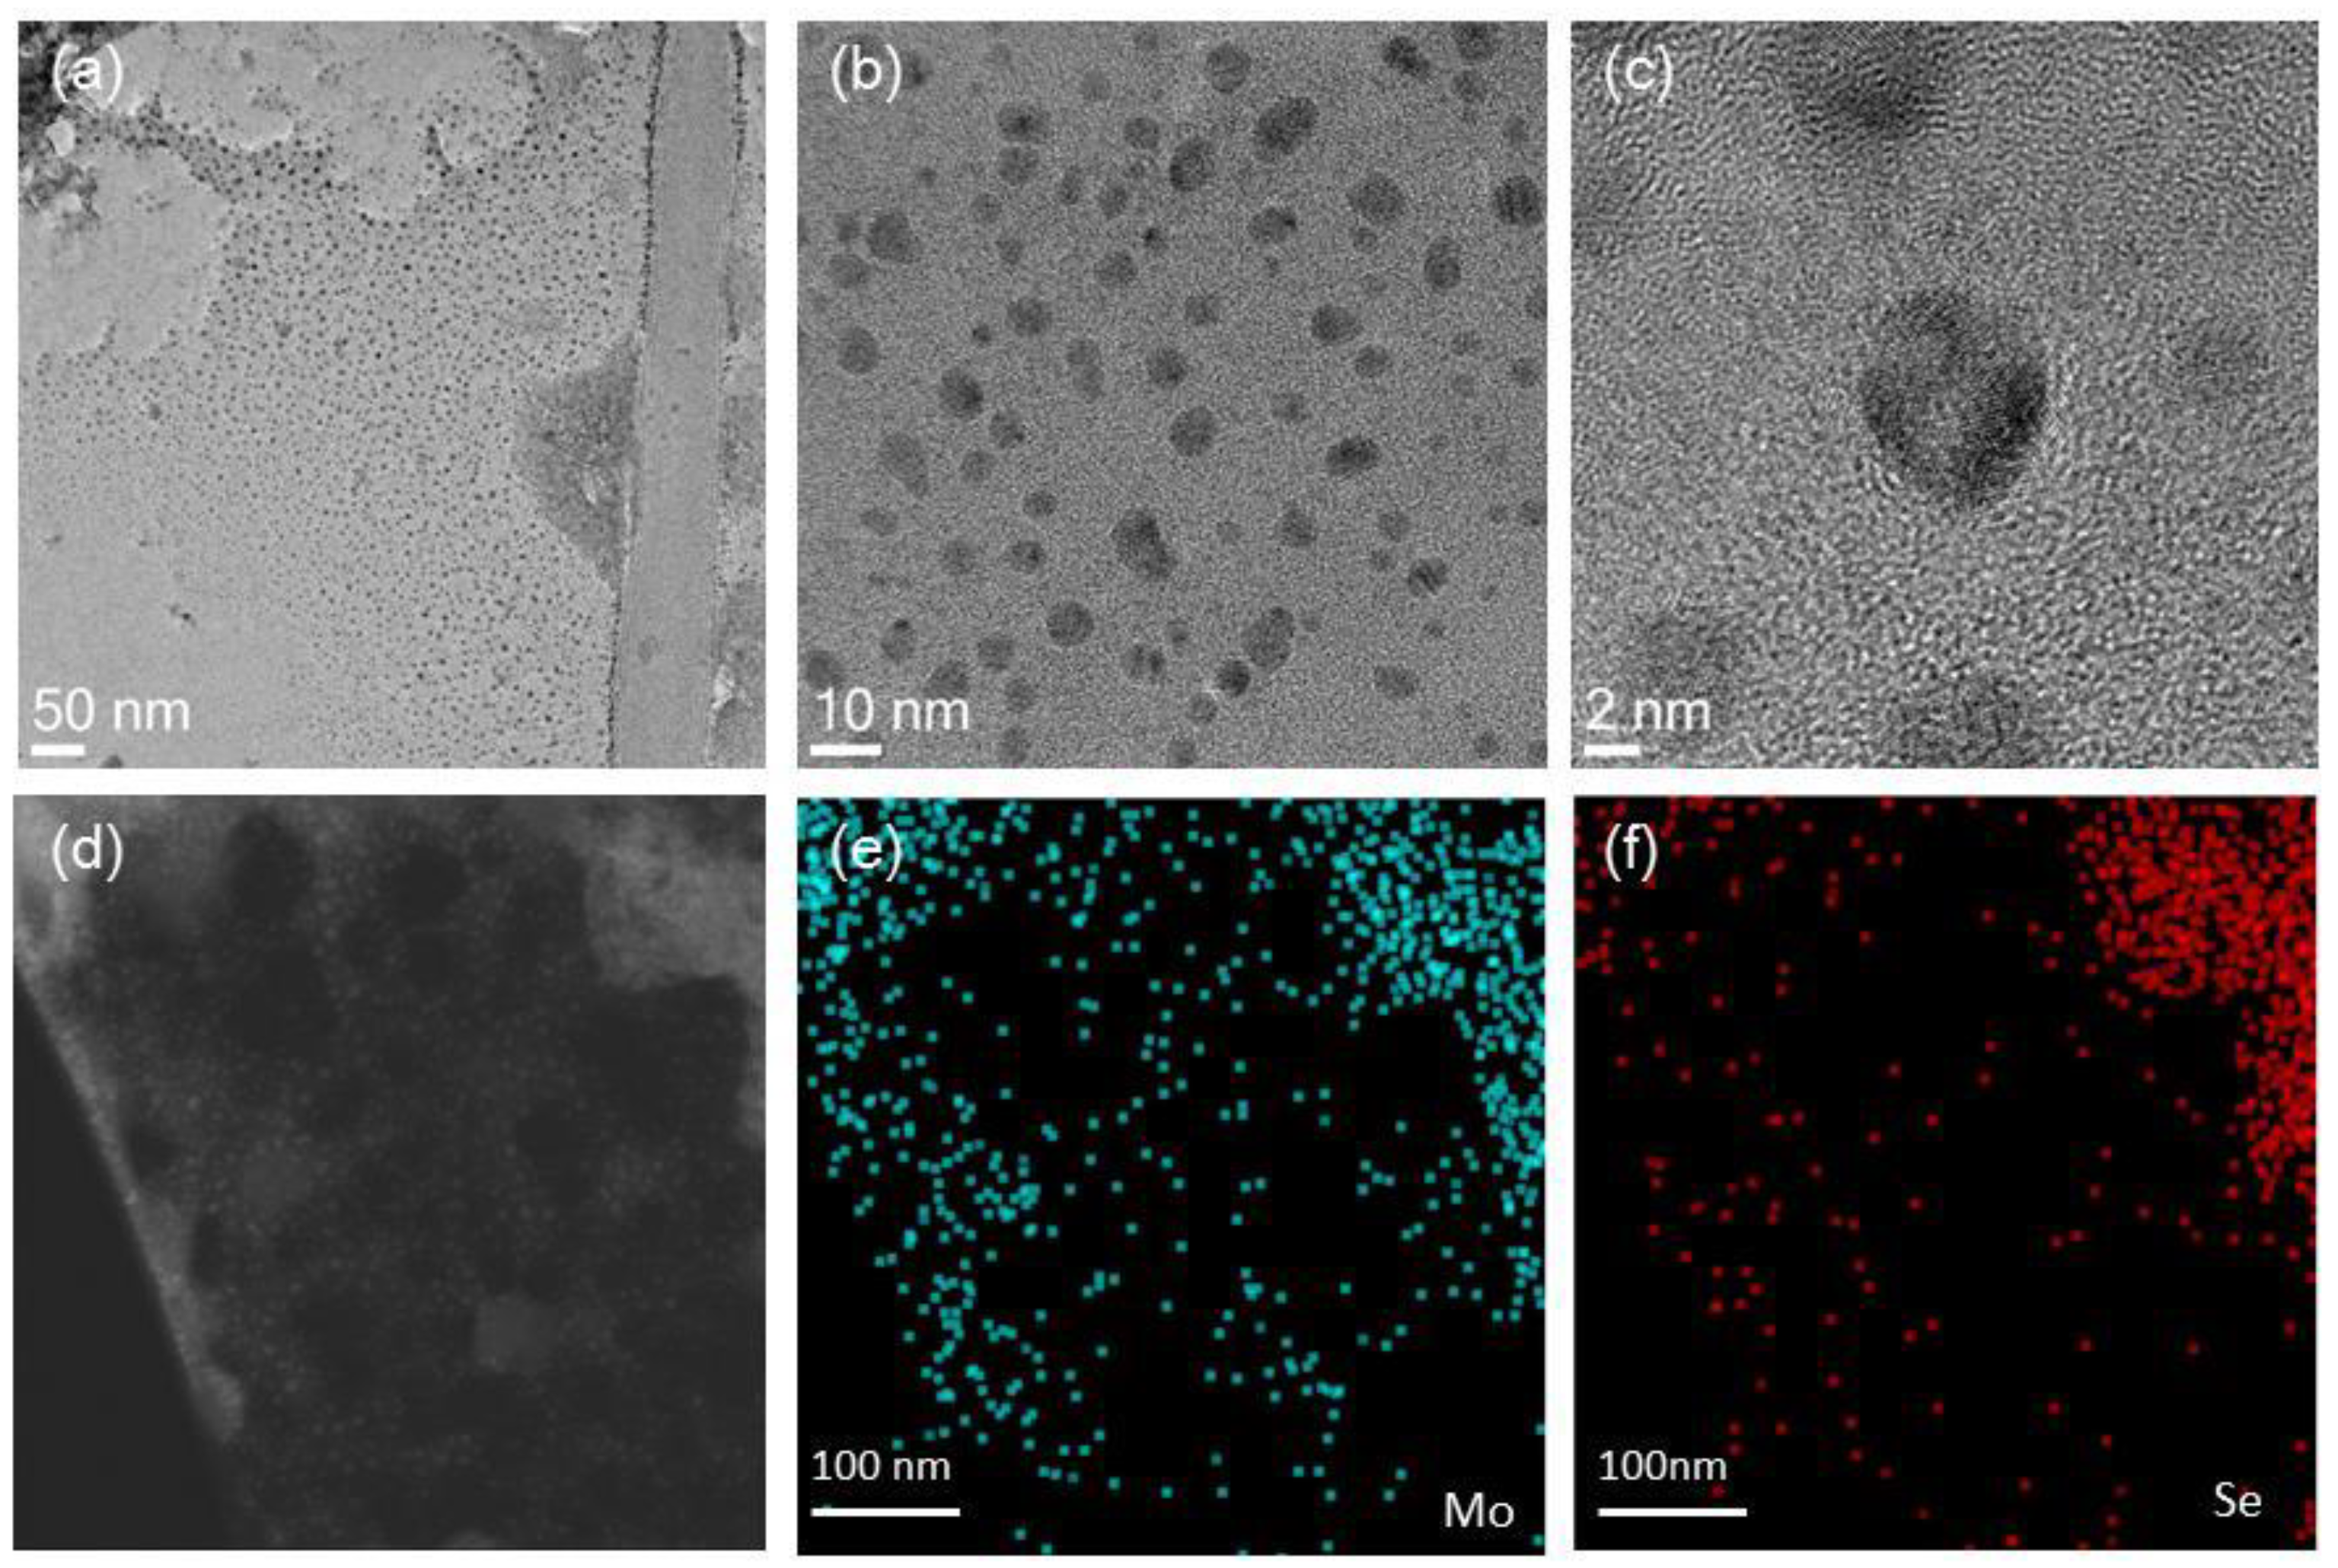
3.2.3. Characterization of MoSe2 Composites

FE-SEM measurement was conducted to investigate the morphological differences between the MoSe2 nanosheets before and after mixing with GO and rGO. Figure 4a–d shows FE-SEM images of pure MoSe2 nanosheets, GO, rGO, and the GO-MoSe2-6:4 and rGO-MoSe2-4:6 composites dried on a Si substrate. Images of the composites with other ratios are shown in Figures S2 and S3 (Supporting Information). The results showed that the pure MoSe2 nanosheets were prone to aggregation and formation of large particles. However, after mixing with GO and rGO, the composites showed a uniform distribution on the Si surface. Compared to other MoSe2 composites demonstrated by previous works, our mixing process is expected to be advantageous in terms of its efficiency and its ease of operability and scalability.

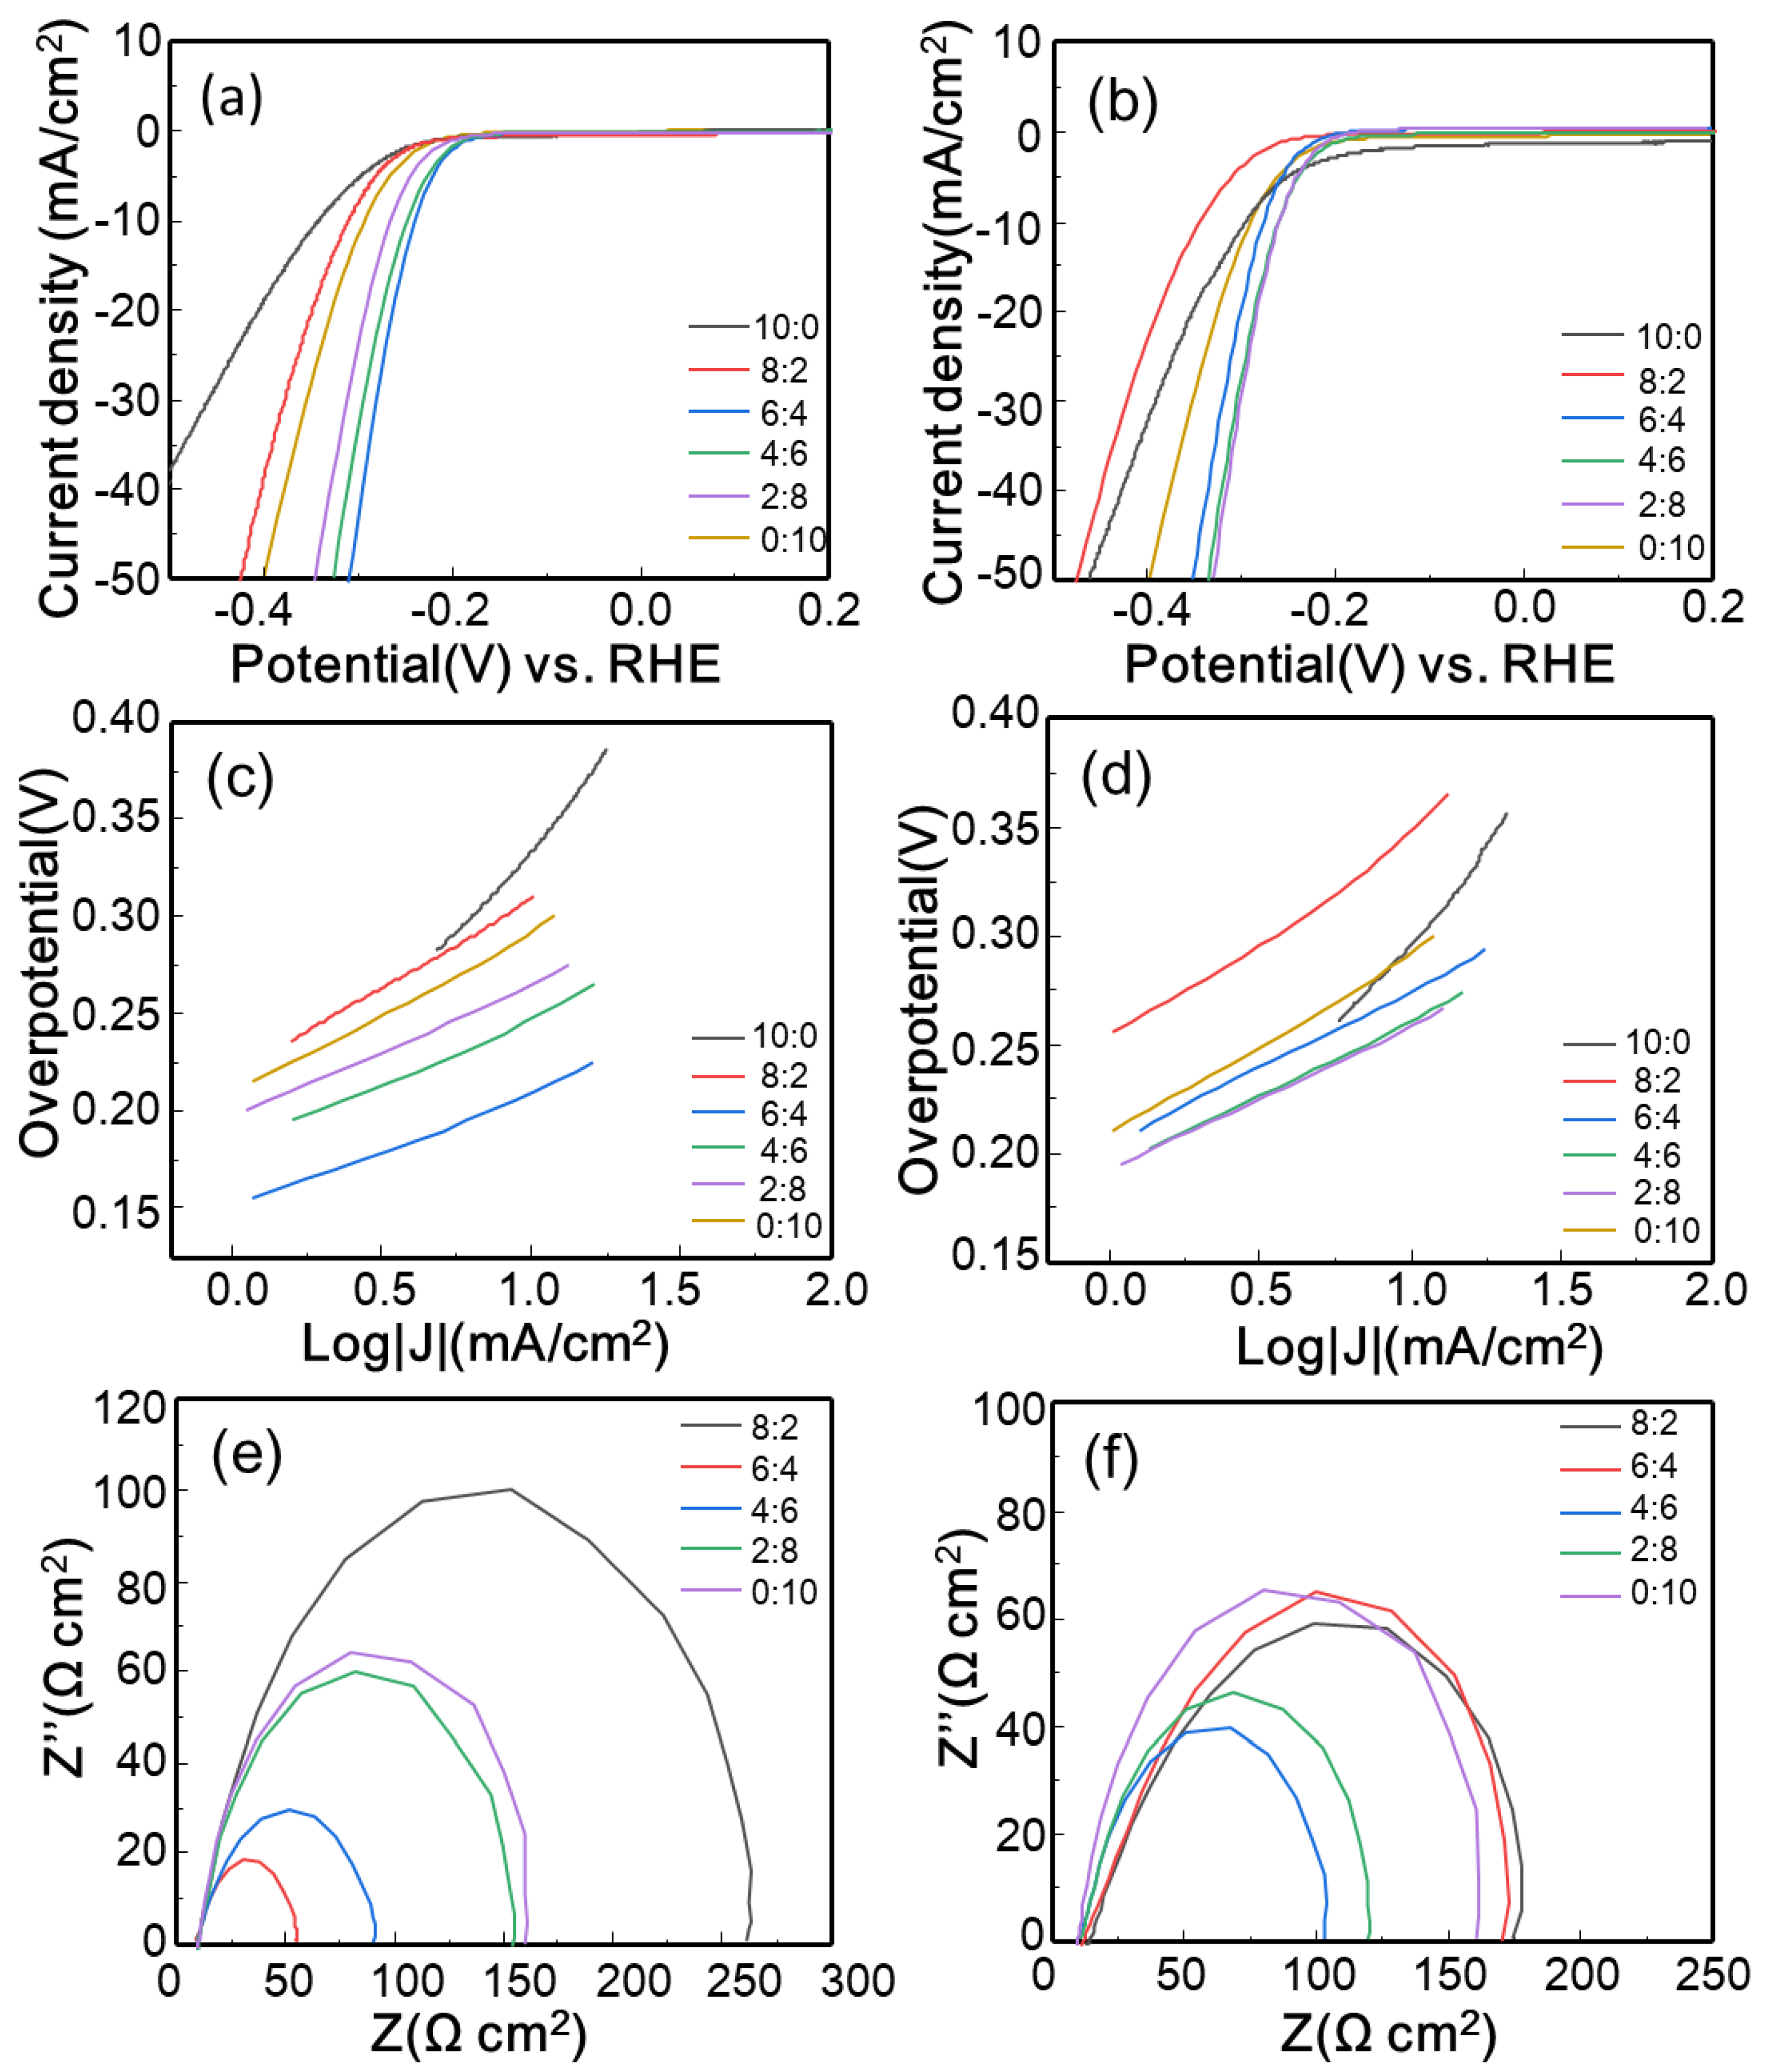
3.3. Electrocatalytic Properties

The HER electrocatalytic activities of MoSe2 mixed with GO or rGO at different ratios were evaluated using LSV. As shown in Figure 5a,b, pristine MoSe2 nanosheets (ratio of 0:10) exhibited a somewhat high overpotential of approximately 210 mV at a cathode current density of 1 mA/cm2 (η1), but the current density was substantially enhanced after GO or rGO was added. The η1 values of most of the GO-MoSe2 and rGO-MoSe2 composites (the sample with a ratio of 10:0 is not included among the composites here or in the following discussion) were lower than that of the pristine MoSe2. In particular, the GO-MoSe2-6:4 (GO-MoSe2 with a ratio of 6:4) and rGO-MoSe2-4:6 samples exhibited the lowest η1 values of 180 and 194 mV, respectively. To further investigate their HER catalytic activity, the overpotential at a cathode current density of 10 mA/cm2 (η10), which is usually regarded as an indicator of HER performance [8], was also recorded for the GO-MoSe2 and rGO-MoSe2 composites. Compared to the pure MoSe2 (295 mV versus RHE), the η10 values of GO-MoSe2-6:4 and rGO-MoSe2-2:8 decreased to 238 and 256 mV versus RHE, respectively. The η1 and η10 values of the other samples are summarized in Table 1. Tafel analysis was also performed to evaluate the HER performance of the catalyst. The results are derived from the polarization curve and fitted by the Tafel equation: η = blogj + a, where η, b, and j represent the overpotential, Tafel slope, and current density, respectively [29,42]. As shown in Figure 5c,d, the GO-MoSe2 and rGO-MoSe2 composites all exhibited smaller Tafel slope than the pure MoSe2 nanosheets (80 mV/dec), except for the one with a ratio of 8:2 (89 mV/dec for GO-MoSe2 and 88 mV/dec for rGO-MoSe2). Especially, the Tafel slopes were reduced to 57 and 66 mV/dec for GO-MoSe2-6:4 and rGO-MoSe2-4:6, respectively. The results are in agreement with the above LSV analysis and suggest that GO and rGO can improve the HER performance of MoSe2 nanosheets even when they are added by simple mixing. Additionally, both pristine MoSe2 and best-performed MoSe2 composites outperformed most of the previously reported MoSe2 or MoSe2-based HER electrocatalysts (detailed comparisons are provided in Table S1), which indicates the superiority of our method.
EIS was performed to study the reactions at the electrode/solution interface and the electron transfer kinetics in the HER process [42]. The Nyquist plots obtained from the impedance measurement were fitted with an equivalent circuit, as shown in Figure 5e,f, to determine the charge transfer resistance (Rct). Table 1 summarizes the Rct values of all the samples. All of the MoSe2 composites have smaller Rct values than pure MoSe2, except for the composites with a ratio of 8:2. Among them, GO-MoSe2-6:4 and rGO-MoSe2-4:6 showed the smallest Rct values of 35.4 and 79.1 Ω cm2, respectively. Rct is related to the electrocatalytic kinetics at the interface between MoSe2 and the electrolyte. Further, a lower Rct indicates faster electron transfer at the interfaces [43]. Therefore, it can be assumed that the conductive GO and rGO can promote electron transfer between MoSe2 and the electrolyte and hence improve the HER performance.
To assess the stability of the MoSe2 composites exhibiting the best performance (GO-MoSe2-6:4 and rGO-MoSe2-4:6), cyclic voltammetry tests between −0.4 and 0.2 V versus RHE were conducted at 50 mV/s for 1000 cycles. As shown in Figure 6a,b, the polarization curves of the MoSe2 composites before and after 1000 cycles almost overlap, indicating their stability in the HER.

4. Conclusions

In summary, we successfully synthesized MoSe2 nanosheets via a modified solution-processed method. GO and rGO were obtained by a previously reported method and applied to improve the HER performance of the as-synthesized MoSe2 nanosheets. XRD, XPS, Raman spectroscopy, FE-SEM, and TEM were used to characterize the structure and morphology of the nanosheets and composites. The results revealed that the MoSe2 nanosheets were in the 2H phase and had small sizes of approximately 2–10 nm, and the GO sheets were effectively reduced to rGO sheets. FE-SEM images suggested that the as-obtained MoSe2 nanosheets were prone to aggregation into large particles, but the aggregation issue was ameliorated in the GO-MoSe2 and rGO-MoSe2 composites. Moreover, electrochemical measurements further verified that the HER performance of the composites was better than that of the pristine MoSe2 nanosheets, and the GO-MoSe2-6:4 and rGO-MoSe2-4:6 composites showed low Tafel slopes of 57 and 66 mV/dec, respectively. This result suggests that the HER activity of MoSe2 nanosheets can be improved by adding GO or rGO at an appropriate ratio.

Supplementary Materials

The following are available online at https://www.mdpi.com/2073-4360/10/12/1309/s1: Figure S1. Size distribution of as-obtained MoSe2 nanosheets; Figure S2: SEM images of GO-MoSe2 with different ratios: (a) 8:2; (b) 6:4; (c) 4:6; and (d) 2:8; Figure S3: SEM images of rGO-MoSe2 with different ratios: (a) 8:2; (b) 6:4; (c) 4:6; and (d) 2:8; Table S1. Comparison of the hydrogen evolution reaction (HER) performance between previous works and our work.

Author Contributions

W.G. and Q.V.L. contributed equally to this work. W.G. and Q.V.L. carried out the synthesized materials and most of characterization. A.H. and T.H.L. analyzed materials and characterization. H.W.J., Z.L., and S.Y.K. supervised the experiment and prepared the manuscripts. S.Y.K. conceived the idea and designed the experiments. All authors were involved in writing the manuscript.

Funding

This research was funded by a Creative Materials Discovery Program through the NRF funded by the Ministry of Science and ICT, Grant Number 2017M3D1A1039379; the Basic Research Laboratory of the NRF funded by the Korean government, Grant Number 2018R1A4A1022647; and Chung-Ang University research grants in 2018.

Conflicts of Interest

The authors declare no conflict of interest.

References

  1. Dresselhaus, M.; Thomas, I. Alternative energy technologies. Nature 2001, 414, 332. [Google Scholar] [CrossRef] [PubMed]
  2. Cortright, R.D.; Davda, R.; Dumesic, J.A. Hydrogen from catalytic reforming of biomass-derived hydrocarbons in liquid water. Nature 2002, 418, 964–967. [Google Scholar] [CrossRef] [PubMed]
  3. Zhong, X.; Sun, Y.; Chen, X.; Zhuang, G.; Li, X.; Wang, J.G. Mo Doping Induced More Active Sites in Urchin-Like W18O49 Nanostructure with Remarkably Enhanced Performance for Hydrogen Evolution Reaction. Adv. Funct. Mater. 2016, 26, 5778–5786. [Google Scholar] [CrossRef]
  4. Walter, M.G.; Warren, E.L.; McKone, J.R.; Boettcher, S.W.; Mi, Q.; Santori, E.A.; Lewis, N.S. Solar water splitting cells. Chem. Rev. 2010, 110, 6446–6473. [Google Scholar] [CrossRef] [PubMed]
  5. Jaramillo, T.F.; Jørgensen, K.P.; Bonde, J.; Nielsen, J.H.; Horch, S.; Chorkendorff, I. Identification of active edge sites for electrochemical H2 evolution from MoS2 nanocatalysts. Science 2007, 317, 100–102. [Google Scholar] [CrossRef] [PubMed]
  6. Xie, J.; Xie, Y. Structural engineering of electrocatalysts for the hydrogen evolution reaction: Order or disorder? ChemCatChem 2015, 7, 2568–2580. [Google Scholar] [CrossRef]
  7. Kemppainen, E.; Bodin, A.; Sebok, B.; Pedersen, T.; Seger, B.; Mei, B.; Bae, D.; Vesborg, P.C.K.; Halme, J.; Hansen, O. Scalability and feasibility of photoelectrochemical H2 evolution: The ultimate limit of Pt nanoparticle as an HER catalyst. Energy Environ. Sci. 2015, 8, 2991–2999. [Google Scholar] [CrossRef] [Green Version]
  8. Zhang, L.; Sun, L.; Huang, Y.; Sun, Y.; Hu, T.; Xu, K.; Ma, F. Hydrothermal synthesis of N-doped RGO/MoSe2 composites and enhanced electro-catalytic hydrogen evolution. J. Mater. Sci. 2017, 52, 13561–13571. [Google Scholar] [CrossRef]
  9. Elezović, N.R.; Gajić-Krstajić, L.; Radmilović, V.; Vračar, L.; Krstajić, N.V. Effect of chemisorbed carbon monoxide on Pt/C electrode on the mechanism of the hydrogen oxidation reaction. Electrochim. Acta 2009, 54, 1375–1382. [Google Scholar] [CrossRef]
  10. Choi, G.J.; Van Le, Q.; Choi, K.S.; Kwon, K.C.; Jang, H.W.; Gwag, J.S.; Kim, S.Y. Polarized Light-Emitting Diodes Based on Patterned MoS2 Nanosheet Hole Transport Layer. Adv. Mater. 2017, 29, 1702598. [Google Scholar] [CrossRef] [PubMed]
  11. Van Le, Q.; Choi, J.-Y.; Kim, S.Y. Recent advances in the application of two-dimensional materials as charge transport layers in organic and perovskite solar cells. FlatChem 2017, 2, 54–66. [Google Scholar] [CrossRef]
  12. Kim, Y.G.; Kwon, K.C.; Le, Q.V.; Hong, K.; Jang, H.W.; Kim, S.Y. Atomically thin two-dimensional materials as hole extraction layers in organolead halide perovskite photovoltaic cells. J Power Sources 2016, 319, 1–8. [Google Scholar] [CrossRef]
  13. Kwon, K.C.; Kim, C.; Le, Q.V.; Gim, S.; Jeon, J.-M.; Ham, J.Y.; Lee, J.-L.; Jang, H.W.; Kim, S.Y. Synthesis of Atomically Thin Transition Metal Disulfides for Charge Transport Layers in Optoelectronic Devices. ACS Nano 2015, 9, 4146–4155. [Google Scholar] [CrossRef] [PubMed]
  14. Le, Q.V.; Nguyen, T.P.; Kim, S.Y. UV/ozone-treated WS2 hole-extraction layer in organic photovoltaic cells. Phys. Status Solidi Rapid Res. Lett. 2014, 8, 390–394. [Google Scholar] [CrossRef]
  15. Van Le, Q.; Nguyen, T.P.; Park, M.; Sohn, W.; Jang, H.W.; Kim, S.Y. Bottom-Up Synthesis of MeSx Nanodots for Optoelectronic Device Applications. Adv. Opt. Mater. 2016, 4, 1796–1804. [Google Scholar] [CrossRef]
  16. Yu, X.Y.; Hu, H.; Wang, Y.; Chen, H.; Lou, X.W. Ultrathin MoS2 Nanosheets Supported on N-doped Carbon Nanoboxes with Enhanced Lithium Storage and Electrocatalytic Properties. Angew. Chem. Int. Ed. 2015, 54, 7395–7398. [Google Scholar] [CrossRef] [PubMed]
  17. Xie, J.; Zhang, H.; Li, S.; Wang, R.; Sun, X.; Zhou, M.; Zhou, J.; Lou, X.W.; Xie, Y. Defect-rich MoS2 ultrathin nanosheets with additional active edge sites for enhanced electrocatalytic hydrogen evolution. Adv. Mater. 2013, 25, 5807–5813. [Google Scholar] [CrossRef] [PubMed]
  18. Wang, H.; Lu, Z.; Xu, S.; Kong, D.; Cha, J.J.; Zheng, G.; Hsu, P.-C.; Yan, K.; Bradshaw, D.; Prinz, F.B. Electrochemical tuning of vertically aligned MoS2 nanofilms and its application in improving hydrogen evolution reaction. Proc. Natl. Acad. Sci. USA 2013, 110, 19701–19706. [Google Scholar] [CrossRef] [PubMed]
  19. Voiry, D.; Yamaguchi, H.; Li, J.; Silva, R.; Alves, D.C.; Fujita, T.; Chen, M.; Asefa, T.; Shenoy, V.B.; Eda, G. Enhanced catalytic activity in strained chemically exfoliated WS2 nanosheets for hydrogen evolution. Nat. Mater. 2013, 12, 850. [Google Scholar] [CrossRef] [PubMed]
  20. Zhang, C.; Chen, X.; Peng, Z.; Fu, X.; Lian, L.; Luo, W.; Zhang, J.; Li, H.; Wang, Y.; Zhang, D. Phosphine-free synthesis and shape evolution of MoSe2 nanoflowers for electrocatalytic hydrogen evolution reactions. CrystEngComm 2018, 20, 2491–2498. [Google Scholar] [CrossRef]
  21. Tan, C.; Zhang, H. Two-dimensional transition metal dichalcogenide nanosheet-based composites. Chem. Soc. Rev. 2015, 44, 2713–2731. [Google Scholar] [CrossRef] [PubMed]
  22. Nguyen, T.P.; Le, Q.V.; Choi, S.; Lee, T.H.; Hong, S.-P.; Choi, K.S.; Jang, H.W.; Lee, M.H.; Park, T.J.; Kim, S.Y. Surface extension of MeS2 (Me = Mo or W) nanosheets by embedding MeSx for hydrogen evolution reaction. Electrochim. Acta 2018, 292, 136–141. [Google Scholar] [CrossRef]
  23. Hasani, A.; Nguyen, T.P.; Tekalgne, M.; Van Le, Q.; Choi, K.S.; Lee, T.H.; Jung Park, T.; Jang, H.W.; Kim, S.Y. The role of metal dopants in WS2 nanoflowers in enhancing the hydrogen evolution reaction. Appl. Catal. A 2018, 567, 73–79. [Google Scholar] [CrossRef]
  24. Lee, L.T.L.; He, J.; Wang, B.; Ma, Y.; Wong, K.Y.; Li, Q.; Xiao, X.; Chen, T. Few-layer MoSe2 possessing high catalytic activity towards iodide/tri-iodide redox shuttles. Sci. Rep. 2014, 4, 4063. [Google Scholar] [CrossRef] [PubMed]
  25. Nicolosi, V.; Chhowalla, M.; Kanatzidis, M.G.; Strano, M.S.; Coleman, J.N. Liquid exfoliation of layered materials. Science 2013, 340, 1226419. [Google Scholar] [CrossRef]
  26. Guo, W.; Chen, Y.; Wang, L.; Xu, J.; Zeng, D.; Peng, D.-L. Colloidal synthesis of MoSe2 nanonetworks and nanoflowers with efficient electrocatalytic hydrogen-evolution activity. Electrochim. Acta 2017, 231, 69–76. [Google Scholar] [CrossRef]
  27. Chhowalla, M.; Shin, H.S.; Eda, G.; Li, L.-J.; Loh, K.P.; Zhang, H. The chemistry of two-dimensional layered transition metal dichalcogenide nanosheets. Nat. Chem. 2013, 5, 263. [Google Scholar] [CrossRef] [PubMed]
  28. Kibsgaard, J.; Chen, Z.; Reinecke, B.N.; Jaramillo, T.F. Engineering the surface structure of MoS2 to preferentially expose active edge sites for electrocatalysis. Nat. Mater. 2012, 11, 963. [Google Scholar] [CrossRef] [PubMed]
  29. Xu, C.; Peng, S.; Tan, C.; Ang, H.; Tan, H.; Zhang, H.; Yan, Q. Ultrathin S-doped MoSe2 nanosheets for efficient hydrogen evolution. J. Mater. Chem. A 2014, 2, 5597–5601. [Google Scholar] [CrossRef]
  30. Kong, D.; Wang, H.; Cha, J.J.; Pasta, M.; Koski, K.J.; Yao, J.; Cui, Y. Synthesis of MoS2 and MoSe2 films with vertically aligned layers. Nano Lett. 2013, 13, 1341–1347. [Google Scholar] [CrossRef] [PubMed]
  31. Wang, H.; Kong, D.; Johanes, P.; Cha, J.J.; Zheng, G.; Yan, K.; Liu, N.; Cui, Y. MoSe2 and WSe2 nanofilms with vertically aligned molecular layers on curved and rough surfaces. Nano Lett. 2013, 13, 3426–3433. [Google Scholar] [CrossRef] [PubMed]
  32. Qu, B.; Li, C.; Zhu, C.; Wang, S.; Zhang, X.; Chen, Y. Growth of MoSe2 nanosheets with small size and expanded spaces of (002) plane on the surfaces of porous N-doped carbon nanotubes for hydrogen production. Nanoscale 2016, 8, 16886–16893. [Google Scholar] [CrossRef] [PubMed]
  33. Park, G.D.; Kim, J.H.; Park, S.-K.; Kang, Y.C. MoSe2 embedded CNT-reduced graphene oxide composite microsphere with superior sodium ion storage and electrocatalytic hydrogen evolution performances. ACS Appl. Mater. Interfaces 2017, 9, 10673–10683. [Google Scholar] [CrossRef] [PubMed]
  34. Chen, Z.; Cummins, D.; Reinecke, B.N.; Clark, E.; Sunkara, M.K.; Jaramillo, T.F. Core–shell MoO3–MoS2 nanowires for hydrogen evolution: A functional design for electrocatalytic materials. Nano Lett. 2011, 11, 4168–4175. [Google Scholar] [CrossRef] [PubMed]
  35. Xu, Y.-F.; Yang, M.-Z.; Chen, B.-X.; Wang, X.-D.; Chen, H.-Y.; Kuang, D.-B.; Su, C.-Y. A CsPbBr3 perovskite quantum dot/graphene oxide composite for photocatalytic CO2 reduction. J. Am. Chem. Soc. 2017, 139, 5660–5663. [Google Scholar] [CrossRef] [PubMed]
  36. Zhang, J.; Yang, H.; Shen, G.; Cheng, P.; Zhang, J.; Guo, S. Reduction of graphene oxide via l-ascorbic acid. Chem. Commun. 2010, 46, 1112–1114. [Google Scholar] [CrossRef] [PubMed]
  37. Sun, D.; Feng, S.; Terrones, M.; Schaak, R.E. Formation and interlayer decoupling of colloidal MoSe2 nanoflowers. Chem. Mater. 2015, 27, 3167–3175. [Google Scholar] [CrossRef]
  38. Huang, J.; Kelley, D. Synthesis and characterization of MoSe2 and WSe2 nanoclusters. Chem. Mater. 2000, 12, 2825–2828. [Google Scholar] [CrossRef]
  39. Pol, V.G.; Pol, S.V.; George, P.P.; Gedanken, A. Combining MoS2 or MoSe2 nanoflakes with carbon by reacting Mo(CO)6 with S or Se under their autogenic pressure at elevated temperature. J. Mater. Sci. 2008, 43, 1966–1973. [Google Scholar] [CrossRef]
  40. Tang, H.; Dou, K.; Kaun, C.-C.; Kuang, Q.; Yang, S. MoSe2 nanosheets and their graphene hybrids: Synthesis, characterization and hydrogen evolution reaction studies. J. Mater.Chem. A 2014, 2, 360–364. [Google Scholar] [CrossRef]
  41. Sekine, T.; Izumi, M.; Nakashizu, T.; Uchinokura, K.; Matsuura, E. Raman scattering and infrared reflectance in 2H-MoSe2. J. Phys. Soc. Jpn. 1980, 49, 1069–1077. [Google Scholar] [CrossRef]
  42. Voiry, D.; Yang, J.; Chhowalla, M. Recent strategies for improving the catalytic activity of 2D TMD nanosheets toward the hydrogen evolution reaction. Adv. Mater. 2016, 28, 6197–6206. [Google Scholar] [CrossRef] [PubMed]
  43. Wang, K.; Ye, Z.; Liu, C.; Xi, D.; Zhou, C.; Shi, Z.; Xia, H.; Liu, G.; Qiao, G. Morphology-controllable synthesis of cobalt telluride branched nanostructures on carbon fiber paper as electrocatalysts for hydrogen evolution reaction. ACS Appl. Mater. Interfaces 2016, 8, 2910–2916. [Google Scholar] [CrossRef] [PubMed]
Figure 1. Characterization of graphene oxide (GO) and reduced graphene oxide (rGO): (a) X-ray diffraction (XRD) patterns; (b) Raman spectra; and (c) C 1s XPS spectra of GO and (d) C 1s XPS spectra of rGO.
Polymers 10 01309 g001
Figure 2. Compositional characterization of MoSe2 nanosheets: (a) XRD pattern; (b) Raman spectrum; and high-resolution (c) Mo 3d; and (d) Se 3d X-ray photoelectron spectroscopy (XPS) spectra.
Polymers 10 01309 g002
Figure 3. Microscopic characterization of MoSe2 nanosheets: transmission electron microscopy (TEM) images of MoSe2 nanosheets at (a) low; (b) medium; and (c) high magnification; (d) TEM image of MoSe2 nanosheet and corresponding elemental maps of (e) Mo and (f) Se.
Polymers 10 01309 g003
Figure 4. SEM images of (a) as-obtained MoSe2; (b) GO; (c) rGO; (d) GO-MoSe2-6:4; and (e) rGO-MoSe2-4:6.
Polymers 10 01309 g004
Figure 5. Electrochemical measurements: polarization curves of (a) GO-MoSe2 composites; (b) rGO-MoSe2 composites; and (c) and (d) corresponding Tafel plots; electrochemical impedance spectra of (e) GO-MoSe2 and (f) rGO-MoSe2.
Polymers 10 01309 g005
Figure 6. Stability tests: polarization curves of (a) GO-MoSe2-6:4 and (b) rGO-MoSe2-4:6 initially and after 1000 cycles.
Polymers 10 01309 g006
Table 1. Summary of η1, η10, Tafel slope, and Rct of GO-MoSe2 and rGO-MoSe2, with different ratios.
GO-MoSe2 rGO-MoSe2
η1 (mV)η10 (mV)Tafel Slope (mV/dec)Rct (Ω cm2)η1 (mV)η10 (mV)Tafel Slope (mV/dec)Rct (Ω cm2)
10:0−43333164819−304295166476
8:22102938917625534988148
6:41802385735.420227470134
4:61902486354.71942616679.1
2:8195264671181942566789.6
0:102102958013421029580134

