Exploring Structure–Property Relationships in Aromatic Polybenzoxazines Through Molecular Simulation


Abstract
1. Introduction
2. Experimental Section
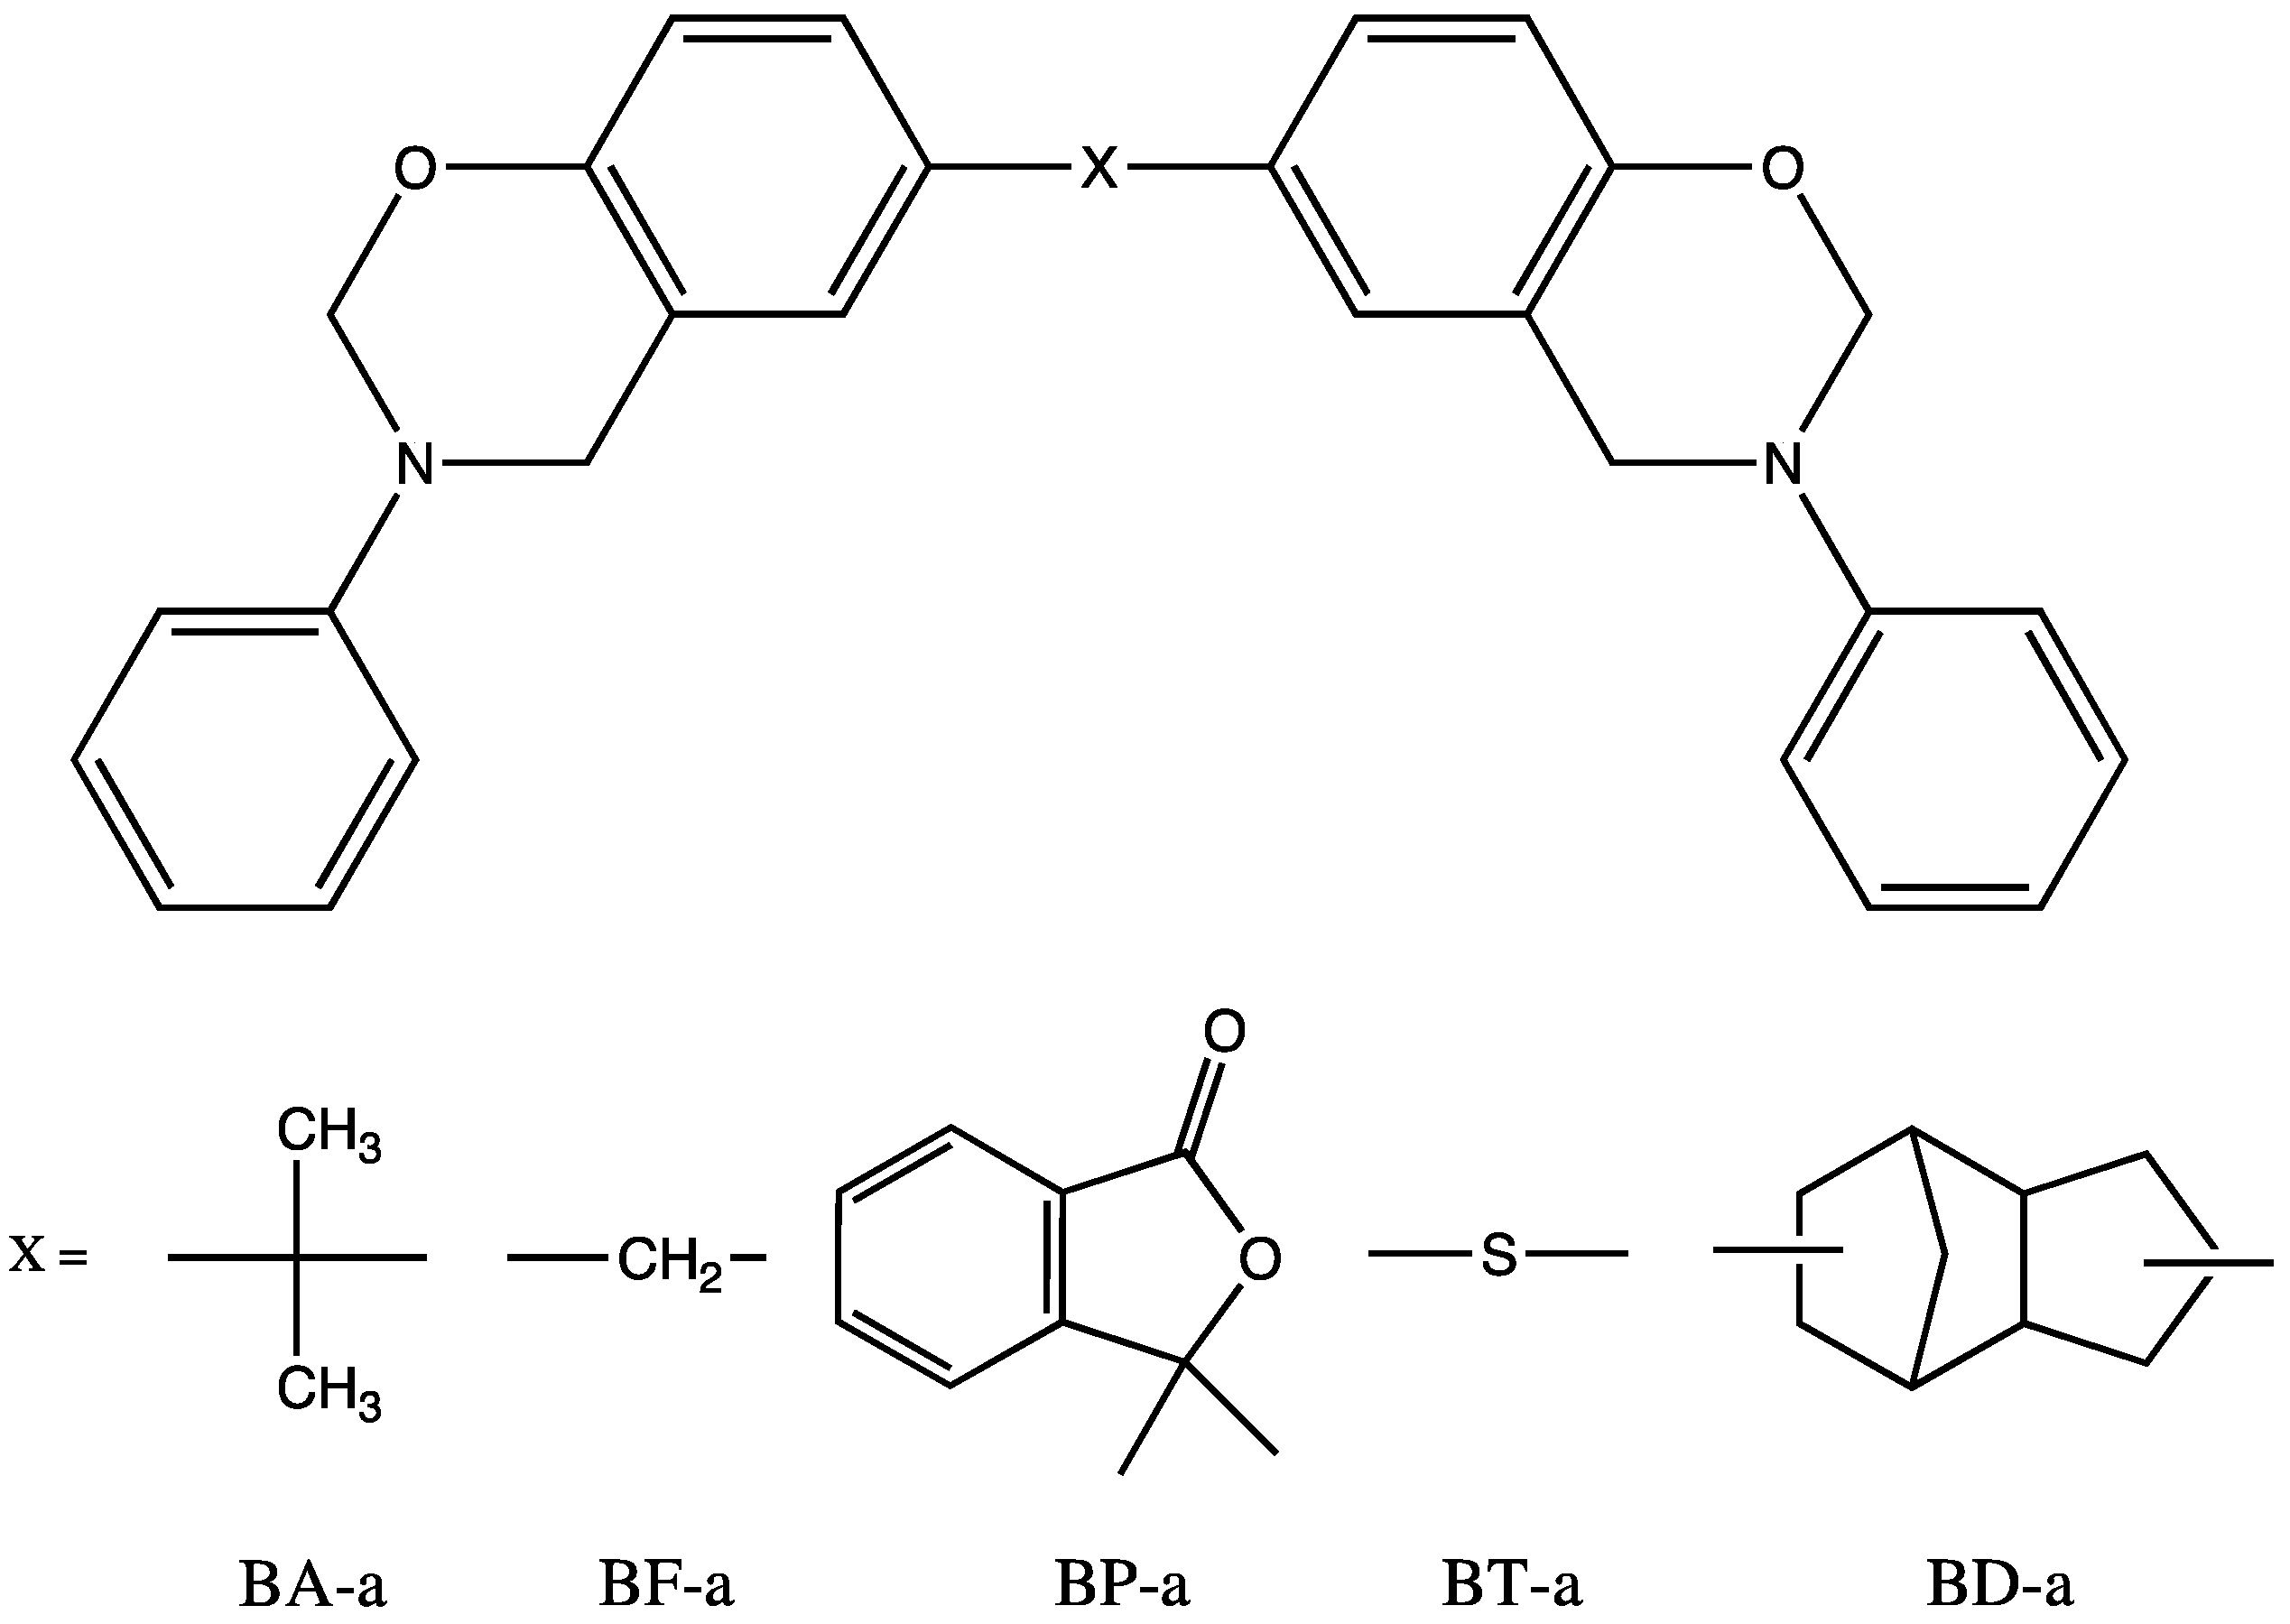
2.1. Materials
2.2. Instrumentation
2.3. Molecular Simulation
2.4. Construction of the Benzoxazines Using Molecular Mechanics
2.5. Construction of the Cured Polybenzoxazines Using the Automated Cure Program
2.6. Simulation of the Cured Polybenzoxazine Properties Using Molecular Dynamics
3. Results and Discussion
3.1. Thermal Analysis of the Homopolymerization Reactions
3.2. Determination of Glass Transition Temperature Using DSC
3.3. Determination of Degree of Cure
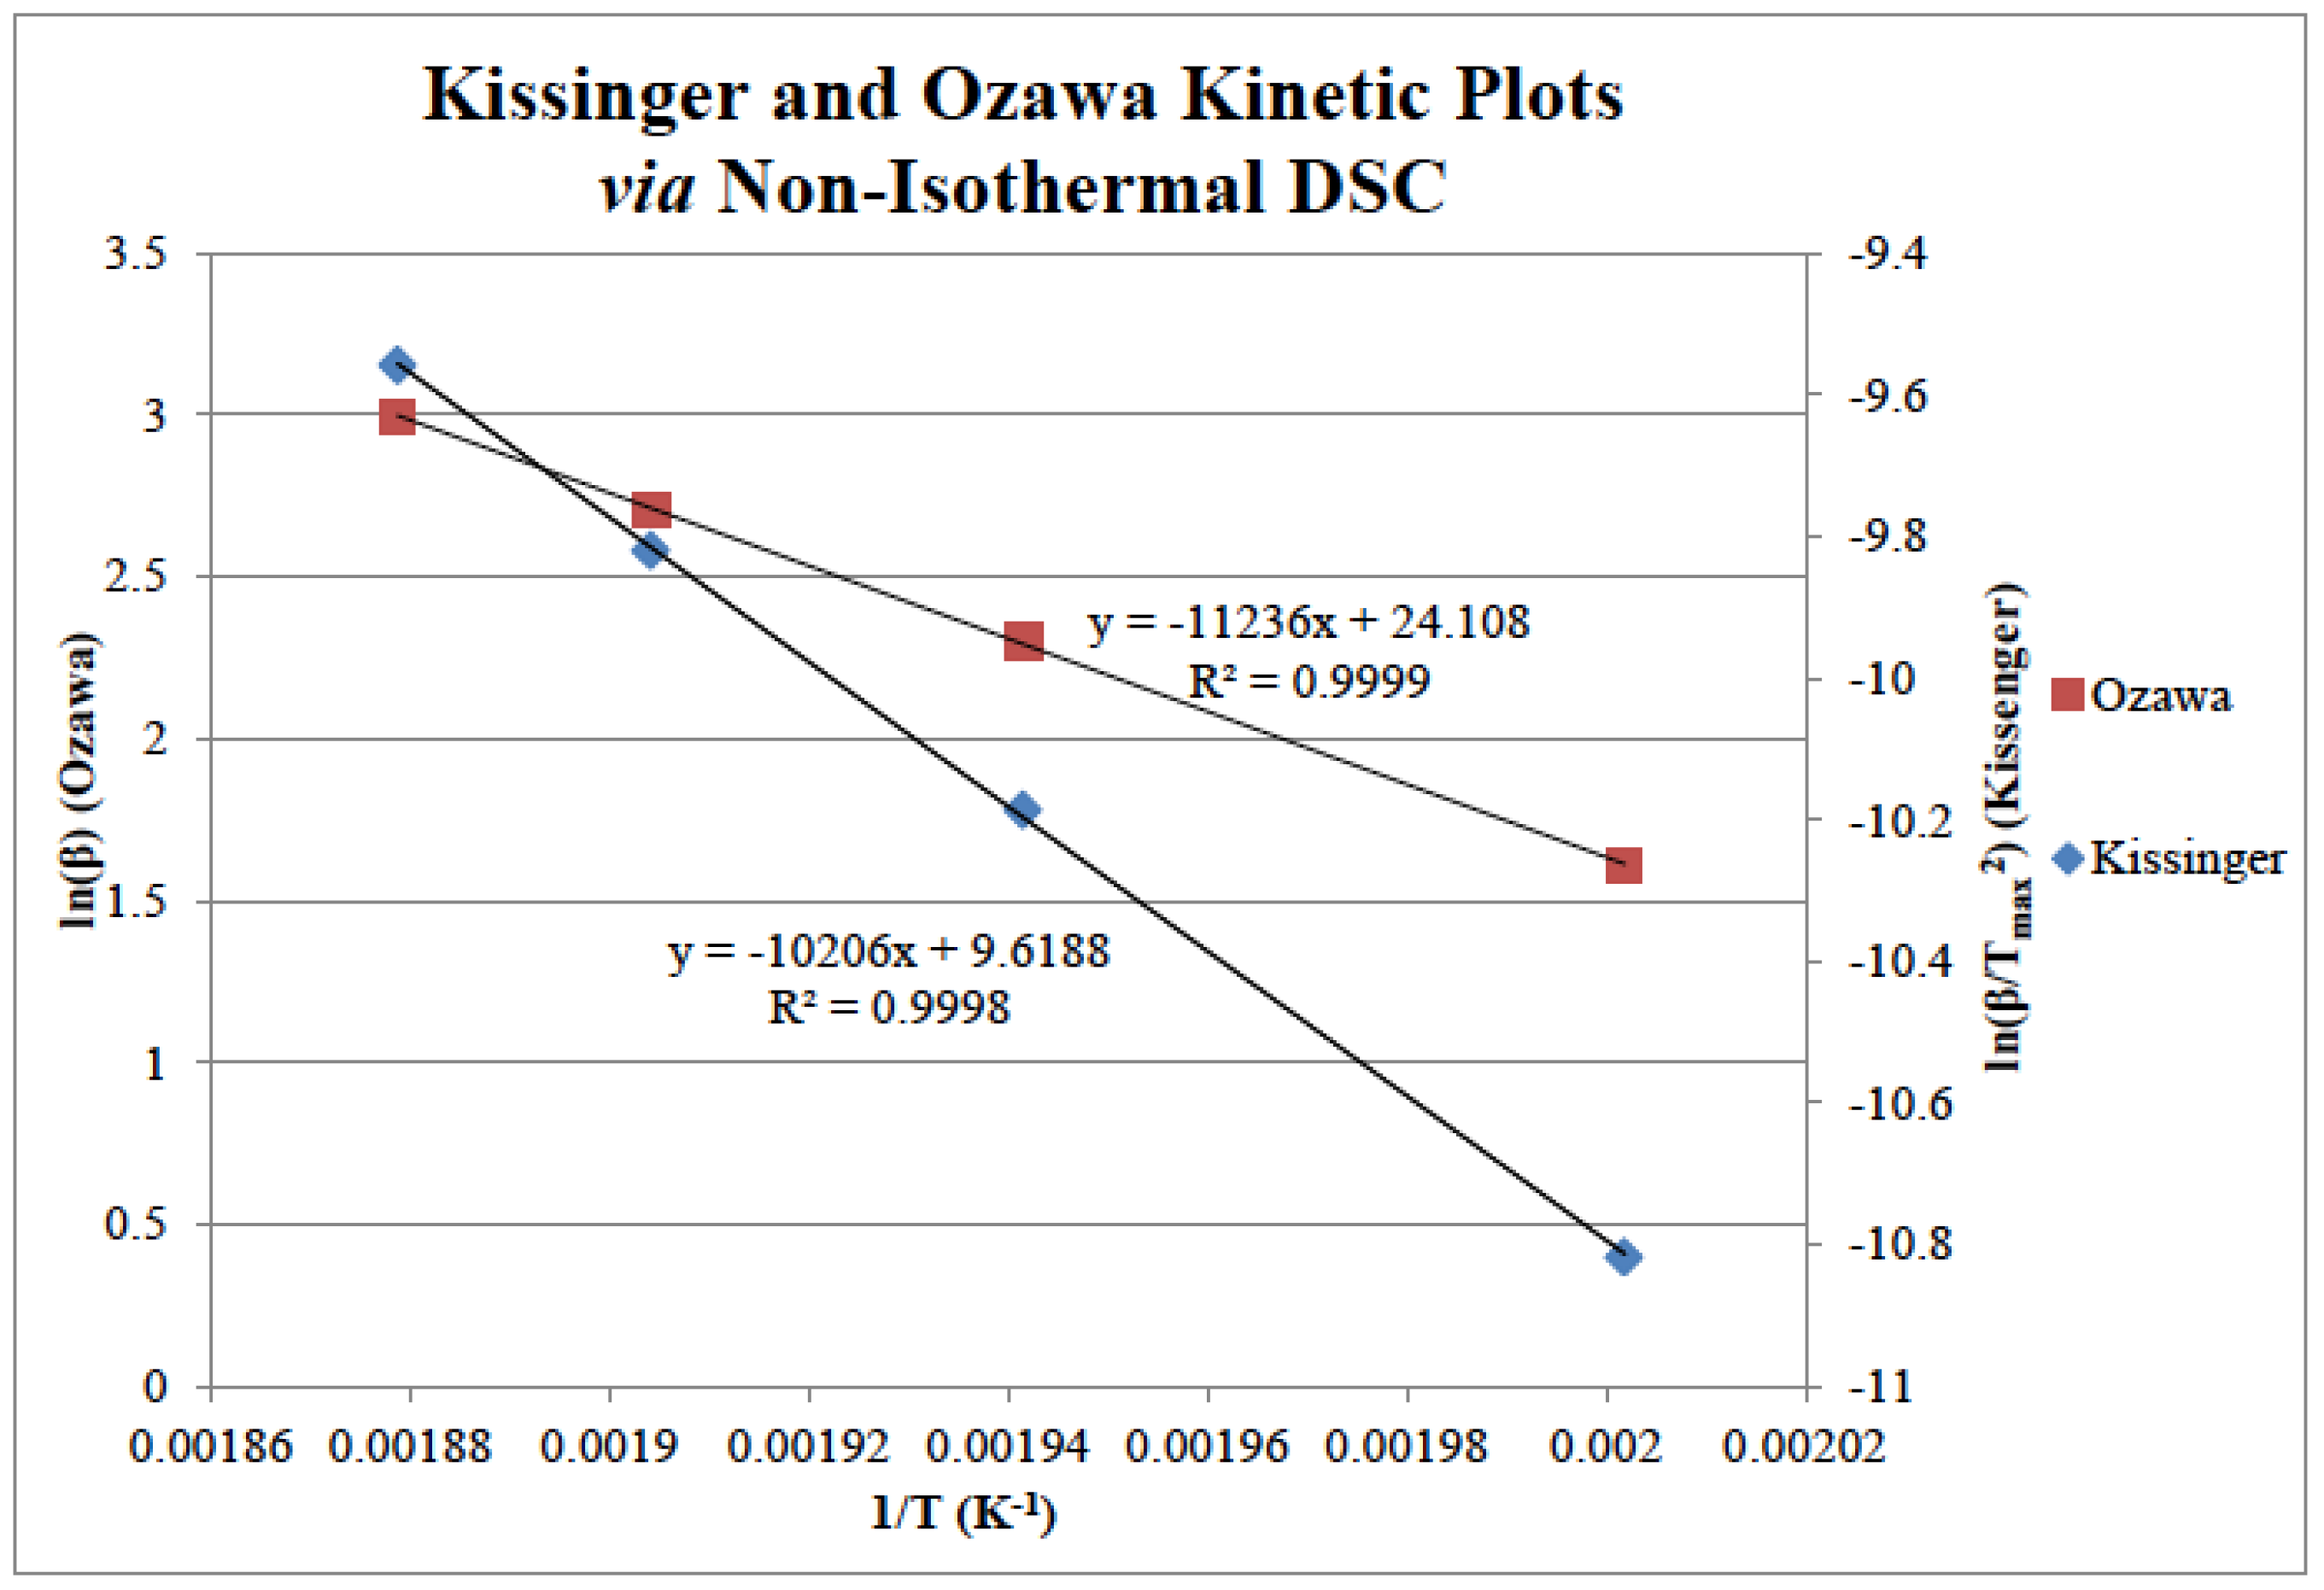
3.4. Determination of Cure Kinetics Using DSC
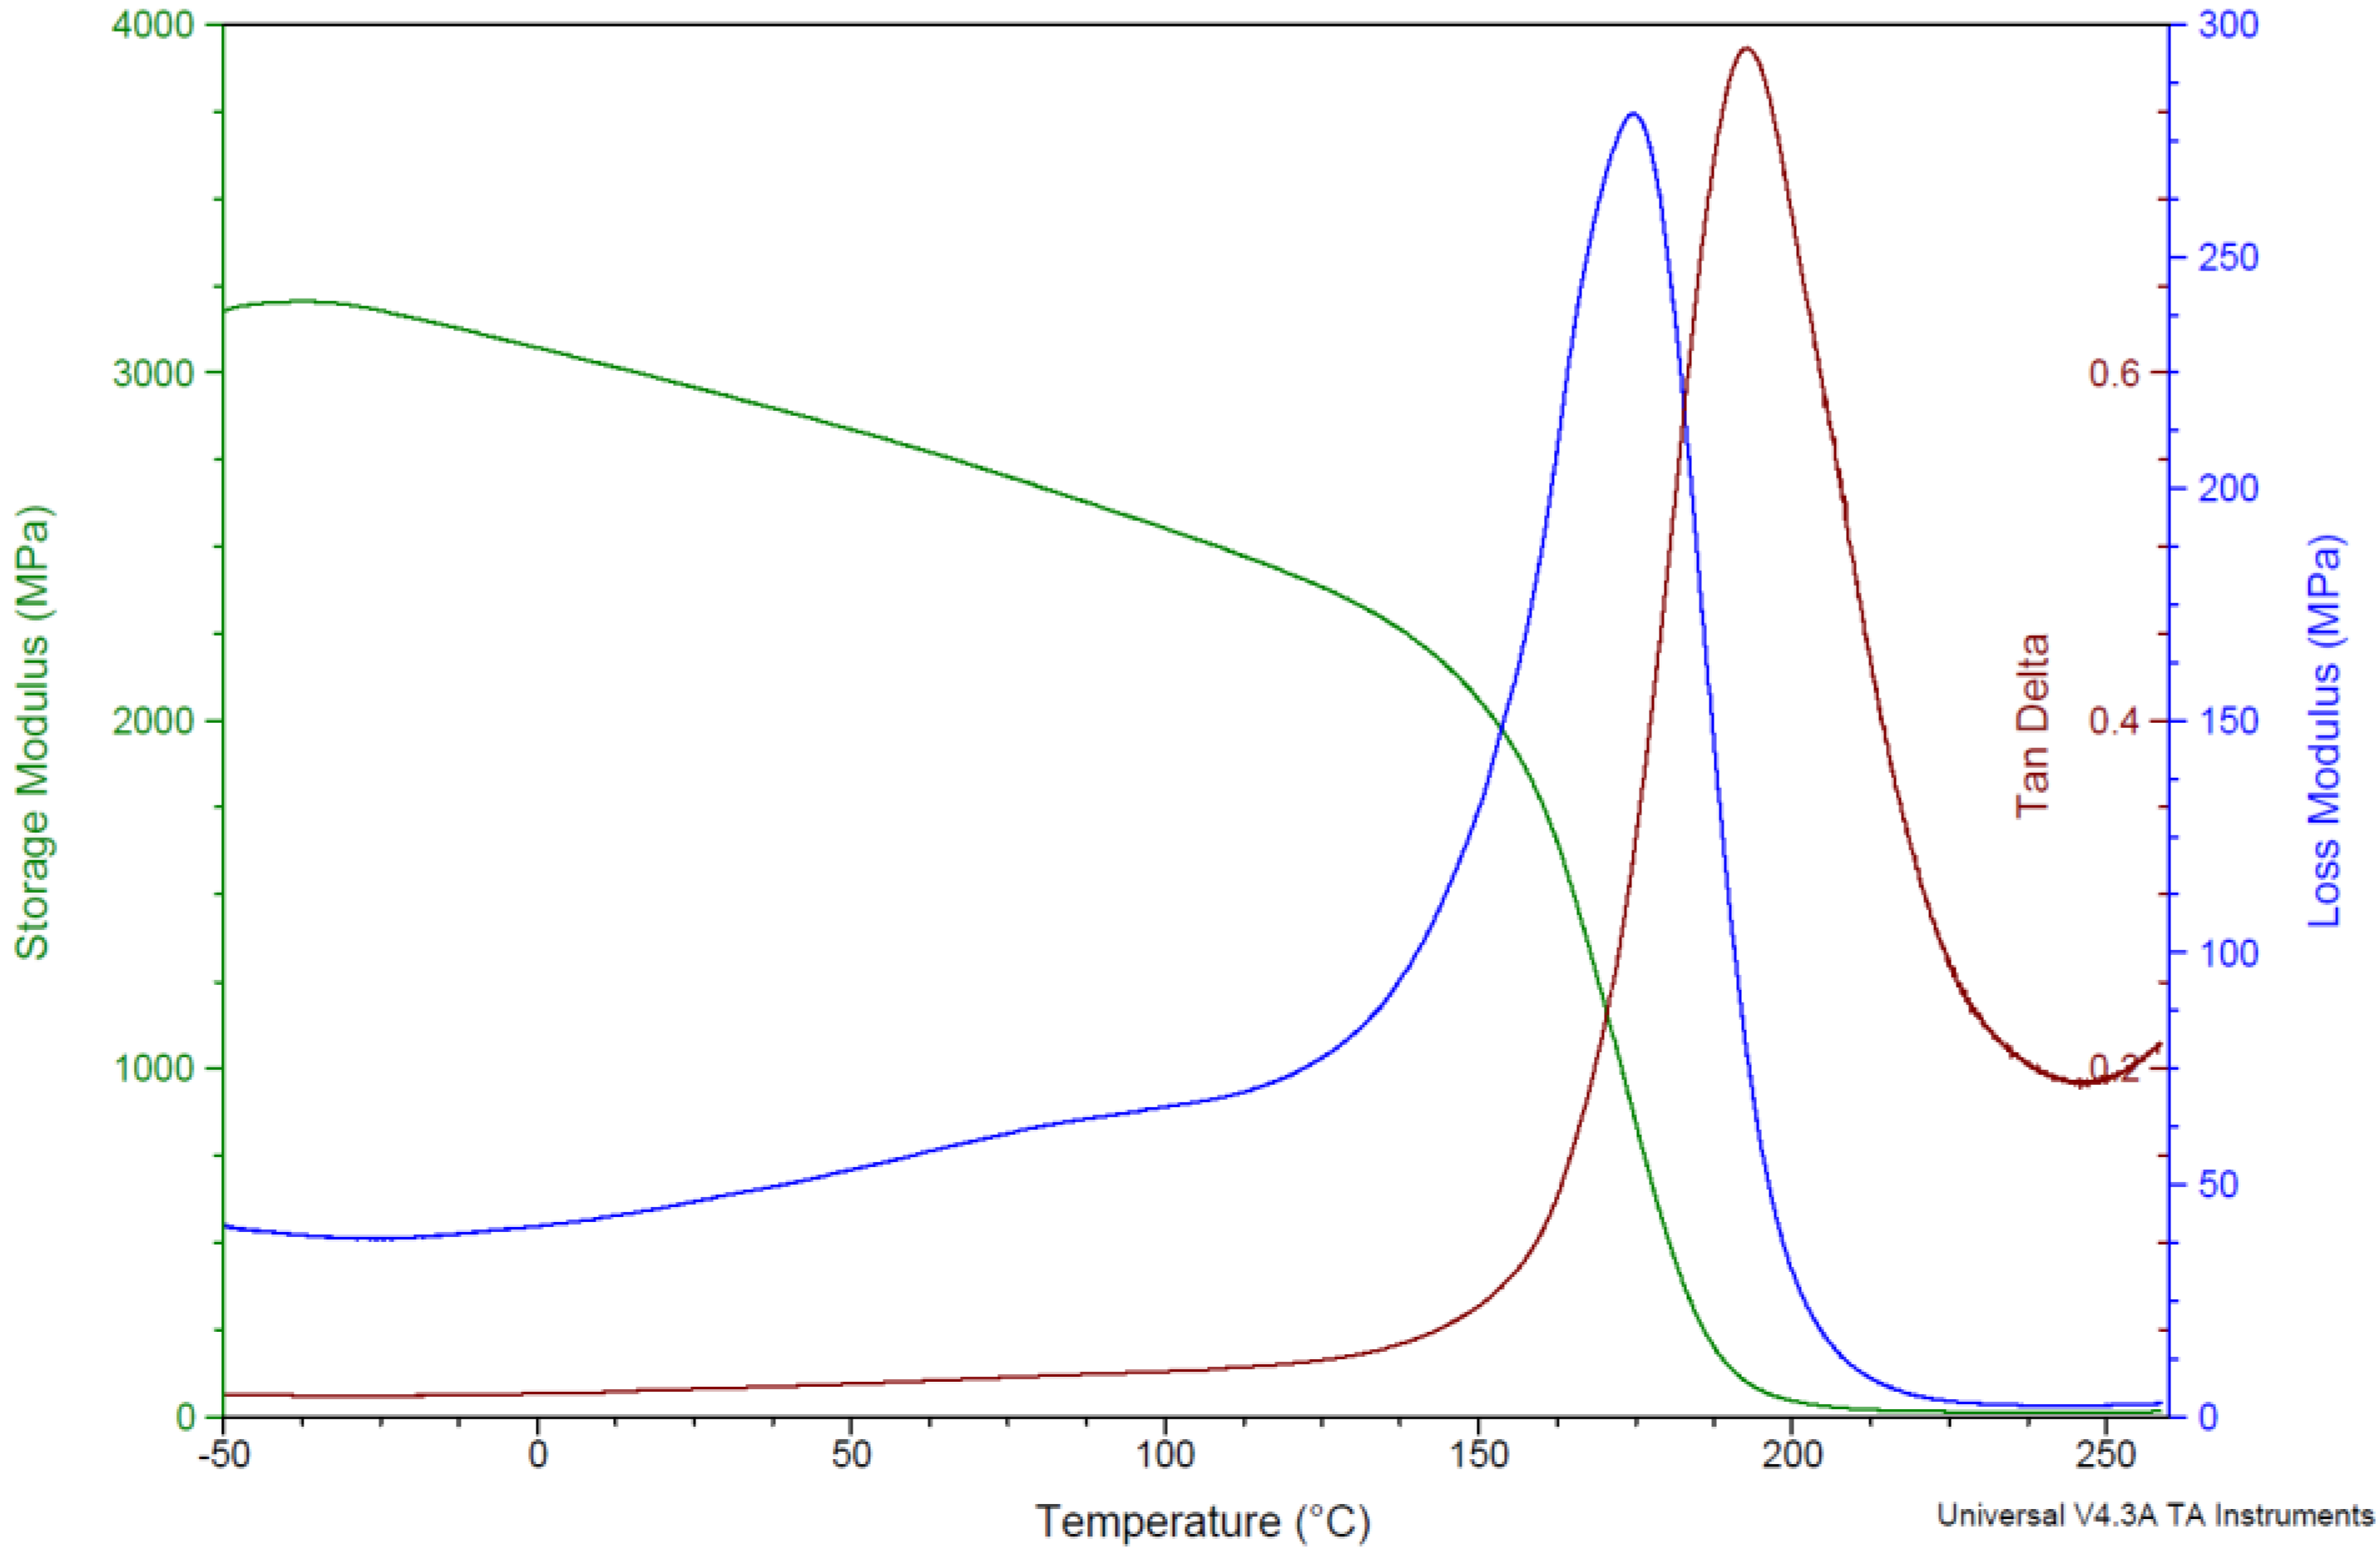
3.5. Determination of the Glass Transition Temperature Using Dynamic Mechanical Thermal Analysis
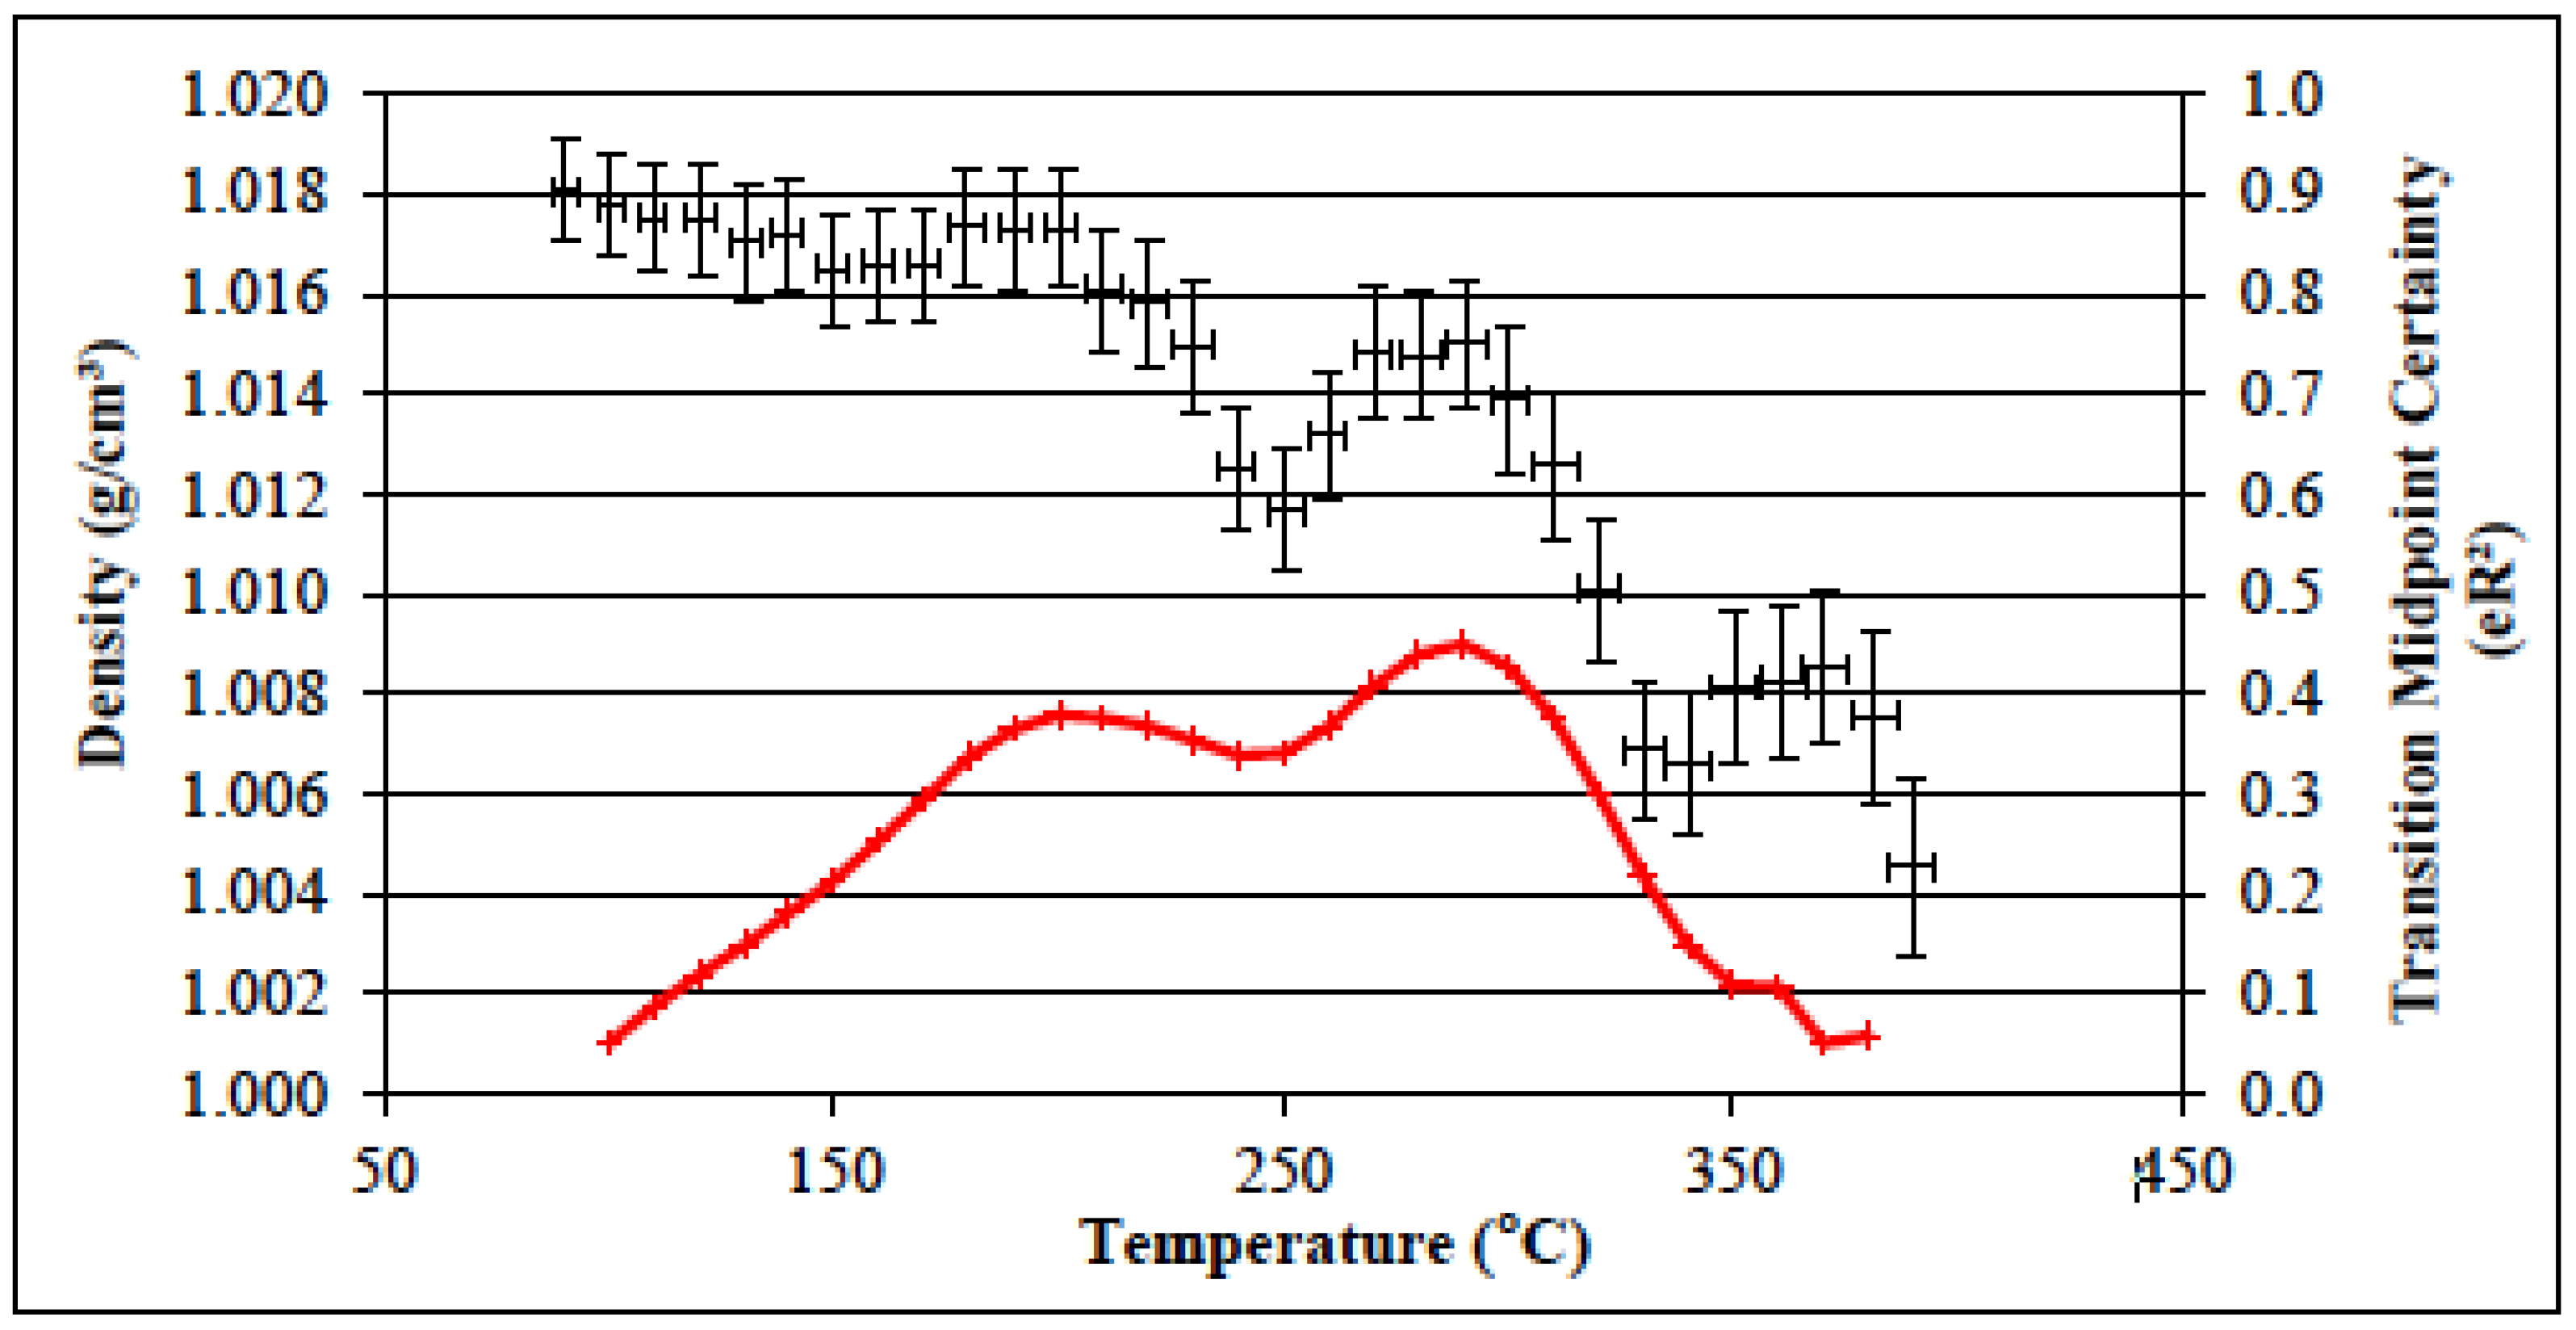
3.6. Determination of the Glass Transition Temperature Using Molecular Dynamics Simulation
4. Conclusions
Author Contributions
Funding
Acknowledgments
Conflicts of Interest
References
- Ishida, H.; Agag, T. (Eds.) Handbook of Polybenzoxazine Resins; Elsevier: New York, NY, USA, 2011. [Google Scholar]
- Gardziella, A.; Pilato, L.A.; Knop, A. Phenolic Resins: Chemistry, Applications, Standardisation, Safety and Ecology; Springer: Berlin, Germany, 2000. [Google Scholar]
- Hamerton, I. Recent Developments in Epoxy Resins; Rapra Review Reports Volume 8; Rapra: Shawbury, UK, 1996. [Google Scholar]
- Henkel Benzoxazine Resins. Available online: http://www.henkelepsilonresin.com/pdf/Henkel%20BZ%20Summary%20US.ppt.pdf (accessed on 20 February 2014).
- Jubsilp, C.; Punson, K.; Takeichi, T.; Rimdusit, S. Curing kinetics of benzoxazine–epoxy copolymer investigated by non-isothermal differential scanning calorimetry. Polym. Degr. Stab. 2010, 95, 918–924. [Google Scholar] [CrossRef]
- Hamerton, I.; McNamara, L.T.; Howlin, B.J.; Smith, P.A.; Cross, P.; Ward, S. Toughening mechanisms in aromatic polybenzoxazines using thermoplastic oligomers and telechelics. Macromolecules 2014, 47, 1946–1958. [Google Scholar] [CrossRef]
- Ishida, H.; Ohba, O. Synthesis and characterization of maleimide and norbornene functionalized benzoxazines. Polymer 2005, 46, 5588–5595. [Google Scholar] [CrossRef]
- Sudo, A.; Sudo, R.; Nakayama, H.; Arima, K.; Endo, T. Selective formation of poly(N,O-acetal) by polymerization of 1,3-benzoxazine and its main chain rearrangement. Macromolecules 2008, 41, 9030–9034. [Google Scholar] [CrossRef]
- Hamerton, I.; McNamara, L.T.; Howlin, B.J.; Smith, P.A.; Cross, P.; Ward, S. Examining the initiation of the polymerization mechanism and network development in aromatic polybenzoxazines. Macromolecules 2013, 46, 5117–5132. [Google Scholar] [CrossRef] [PubMed]
- Wan Hassan, W.A. Characterisation and Molecular Modelling of Selected Benzoxazines and Their Polymers. Ph.D. Thesis, University of Surrey, Surrey, UK, 2014. [Google Scholar]
- Accelrys Inc. Accelrys Materials Studio Versions v 5.5.0.0 (2010) and v 6.0.0.0 (2012), Accelrys Inc.: San Diego, CA, USA, 2012.
- Sun, H.; Mumby, S.J.; Maple, J.R.; Hagler, A.T. An ab initio CFF93 all-Atom force field for polycarbonates. J. Amer. Chem. Soc. 1994, 116, 2978–2987. [Google Scholar] [CrossRef]
- Burkert, U.; Allinger, N.L. Molecular Mechanics, ACS Monograph 177; American Chemical Society: Washington, DC, USA, 1982. [Google Scholar]
- Goodman, J.M. Chemical Applications of Molecular Modelling; Royal Society of Chemistry: Cambridge, UK, 1998; pp. 31–60. [Google Scholar]
- Allen, F.H.; Watson, D.G.; Brammer, L.; Opren, A.G.; Taylor, R. Typical interatomic distances: Organic compounds. In International Tables for Crystallography; Springer: Dordrecht, The Netherlands, 2006; pp. 790–811. [Google Scholar]
- Toukmaji, A.Y.; Board, J.A., Jr. Ewald summation techniques in perspective: a survey. Comput. Phys. Commun. 1996, 95, 73–92. [Google Scholar] [CrossRef]
- Hall, S.A.; Howlin, B.J.; Hamerton, I.; Baidak, A.; Billaud, C.; Ward, S. Solving the Problem of Building Models of Crosslinked Polymers: An Example Focussing on Validation of the Properties of Crosslinked Epoxy Resins. PLoS ONE 2012, 7, e42928. [Google Scholar] [CrossRef] [PubMed]
- Ishida, H.; Low, H.Y. A study on the volumetric expansion of benzoxazine-based phenolic resin. Macromolecules 1997, 30, 1099–1106. [Google Scholar] [CrossRef]
- Sun, H.J. Force field for computation of conformational energies, structures, and vibrational frequencies of aromatic polyesters. Comput. Chem. 1994, 15, 752. [Google Scholar] [CrossRef]
- Berendsen, H.; Postma, J.; van Gunsteren, W.; Dinolaand, A.; Haak, J.J. Molecular dynamics with coupling to an external bath. Chem. Phys. 1984, 81, 3684–3690. [Google Scholar] [CrossRef]
- Ishida, H.; Rodriguez, Y. Curing kinetics of a new benzoxazine-based phenolic resin by differential scanning calorimetry. Polymer 1995, 36, 3151. [Google Scholar] [CrossRef]
- Takeichi, T.; Kano, T.; Agag, T. Synthesis and thermal cure of high molecular weight polybenzoxazine precursors and the properties of the thermosets. Polymer 2005, 46, 12172. [Google Scholar] [CrossRef]
- Ning, X.; Ishida, H.J. Phenolic materials via ring-opening polymerization: Synthesis and characterization of bisphenol-A based benzoxazines and their polymers. Polym. Sci. Part A Polym. Chem. 1994, 32, 1121. [Google Scholar] [CrossRef]
- Hwang, H.-J.; Lin, C.-Y.; Wang, C.-S. Flame retardancy and dielectric properties of dicyclopentadiene-based benzoxazine cured with a phosphorus-containing phenolic resin. J. Appl. Polym. Sci. 2008, 110, 2413. [Google Scholar] [CrossRef]
- Jubsilp, C.; Damrongsakkul, S.; Takeichi, T.; Rimdusit, S. Curing kinetics of arylamine-based polyfunctional benzoxazine resins by dynamic differential scanning calorimetry. Thermochim. Acta 2006, 447, 131. [Google Scholar] [CrossRef]
- Nair, C.P.R.; Kumar, K.S.S.; Ninan, K.N.; Kulkarni, A.D.; Wadgaonkar, P.P. Synthesis and properties of new polybenzoxazines containing (substituted) cyclohexyl moieties. Polym. Adv. Technol. 2009, 20, 1107. [Google Scholar]
- Hamerton, I.; Thompson, S.; Howlin, B.J.; Stone, C.A. New method to predict the thermal degradation behavior of polybenzoxazines from empirical data using structure property relationships. Macromolecules 2013, 46, 7605–7615. [Google Scholar] [CrossRef]
- Ishida, H.; Sanders, D.P.J. Physical and mechanical characterization of near-zero shrinkage polybenzoxazines. Polym. Sci. Part B Polym. Phys. 1996, 34, 1019. [Google Scholar] [CrossRef]
- Ishida, H.; Liu, J.-P. Benzoxazine chemistry in solution and melt. In Phenolic Resins: Chemistry, Applications, Standardisation, Safety and Ecology; Chapter 2 in Reference 2; Springer: Berlin, Germany, 2000; pp. 85–102. [Google Scholar]
- Li, Y.; Zhou, J.J.; Zhang, X.; Wang, L.; Mia, Z. Product distribution of tricyclopentadiene from cycloaddition of dicyclopentadiene and cyclopentadiene: A theoretical and experimental study. Fuel 2010, 89, 2522–2527. [Google Scholar] [CrossRef]


| Monomer | Tm (°C) | ∆Hm (J/g) | Tmax (°C) | ∆Hp | Tg (°C) | |
|---|---|---|---|---|---|---|
| (J/g) | kJ/mol Bz | |||||
| BA-a | 36 | 3 | 241 | 309 | 70 | 151 |
| BF-a | - | - | 240 | 298 | 65 | 174 |
| BP-a | 70 | 12 | 228 | 266 | 74 | 239 |
| BP-a batch 2 | 80 | 7 | 234 | 239 | 66 | 256 |
| BT-a | - | - | 220 | 326 | 74 | 172 |
| BD-a | 57 | 14 | 234 | 184 | 51 | 187 |
| PBZ | Cure exotherm (J/g) | Degree of Cure (%) | |
|---|---|---|---|
| Monomer | Cured Sample (rescan) | ||
| PBA-a | 309.30 | 31.11 | 89.9 |
| PBF-a | 298.30 | 23.24 | 92.2 |
| PBP-a | 265.37 | 24.08 | 90.9 |
| PBP-a (Batch 2) | 238.83 | 36.63 | 84.7 |
| PBT-a | 326.97 | 20.23 | 93.8 |
| PBD-a | 183.50 | 4.84 | 97.4 |
| Monomer | Kissinger Method | Ozawa Method | ||||
|---|---|---|---|---|---|---|
| Ea (kJ mol−1) | k × 10−2 (s−1) | A × 108 (s−1) | R2 Value | Ea (kJ mol−1) | R2 Value | |
| BA-a | 85 | 21 | 1.53 | 0.9998 | 89 | 0.9999 |
| BF-a | 86 | 22 | 1.99 | 0.9995 | 90 | 0.9995 |
| BP-a | 135 | 50 | 559,425.15 | 0.9920 | 136 | 0.9929 |
| BT-a | 86 | 55 | 5.76 | 0.9998 | 90 | 0.9999 |
| BD-a | 108 | 34 | 602.97 | 0.9997 | 110 | 0.9997 |
| PBZ | Glass Transition Temperature (°C) | ||
|---|---|---|---|
| Storage Modulus | Loss Modulus | Tan δ | |
| PBA-a | 173 | 174 | 191 |
| PBA-a (Batch 2) | 175 | 176 | 195 |
| PBF-a | 166 | 167 | 186 |
| PBF-a (Batch 2) | 161 | 161 | 179 |
| PBP-a | 196 | 201 | 225 |
| PBP-a (Batch 2) | 202 | 204 | 230 |
| PBT-a | 197 | 199 | 213 |
| PBD-a | 146 | 147 | 164 |
| Sample | Te (K) | Ge (MPa) | v (×10−3 mol cm−3) |
|---|---|---|---|
| PBA-a | 497 | 15.0 | 3.6 |
| PBA-a (Batch 2) | 498 | 15.2 | 3.7 |
| PBF-a | 490 | 15.4 | 3.8 |
| PBF-a (Batch 2) | 484 | 19.8 | 4.9 |
| PBP-a | 525 | 24.2 | 5.5 |
| PBP-a (Batch 2) | 527 | 80.8 | 18.4 |
| PBT-a | 522 | 28.7 | 6.6 |
| PBD-a | 470 | 5.4 | 1.4 |
| Sample | Glass transition temperature (°C) | |||
|---|---|---|---|---|
| Storage Modulus | Loss modulus | Tan δ | Simulation | |
| PBA-a | 173 | 174 | 191 | 160–190 |
| PBF-a | 166 | 167 | 186 | 170–190 |
| PBP-a | 196 | 201 | 225 | 190–220 |
| PBT-a | 197 | 199 | 213 | 180–220 |
| PBD-a | 146 | 147 | 164 | 150–160 |
© 2018 by the authors. Licensee MDPI, Basel, Switzerland. This article is an open access article distributed under the terms and conditions of the Creative Commons Attribution (CC BY) license (http://creativecommons.org/licenses/by/4.0/).
Share and Cite
Thompson, S.; Stone, C.A.; Howlin, B.J.; Hamerton, I. Exploring Structure–Property Relationships in Aromatic Polybenzoxazines Through Molecular Simulation. Polymers 2018, 10, 1250. https://doi.org/10.3390/polym10111250
Thompson S, Stone CA, Howlin BJ, Hamerton I. Exploring Structure–Property Relationships in Aromatic Polybenzoxazines Through Molecular Simulation. Polymers. 2018; 10(11):1250. https://doi.org/10.3390/polym10111250
Chicago/Turabian StyleThompson, Scott, Corinne A. Stone, Brendan J. Howlin, and Ian Hamerton. 2018. "Exploring Structure–Property Relationships in Aromatic Polybenzoxazines Through Molecular Simulation" Polymers 10, no. 11: 1250. https://doi.org/10.3390/polym10111250
APA StyleThompson, S., Stone, C. A., Howlin, B. J., & Hamerton, I. (2018). Exploring Structure–Property Relationships in Aromatic Polybenzoxazines Through Molecular Simulation. Polymers, 10(11), 1250. https://doi.org/10.3390/polym10111250