Article

High Magnetic Field ESR in S = 1 Skew Chain Antiferromagnet Ni2V2O7 Single Crystal

Wuhan National High Magnetic Field Center & School of Physics, Huazhong University of Science and Technology, Wuhan 430074, China
*
Author to whom correspondence should be addressed.
Crystals 2019, 9(9), 468; https://doi.org/10.3390/cryst9090468
Submission received: 24 July 2019 / Revised: 24 August 2019 / Accepted: 5 September 2019 / Published: 7 September 2019
(This article belongs to the Special Issue Magnetic Field-induced Phase Transition)

Abstract

:
We report electron spin resonance (ESR) in S = 1 skew chain antiferromagnet Ni2V2O7, which exhibits a spin-flop transition and a well-defined 1/2 magnetization plateau. The antiferromagnetic (AFM) ordering at TN = 7 K can be reflected by the temperature-dependent ESR spectra at low frequency for the easy axis. At 2 K, at the spin-flop transition fields along the easy a and b axes, anomalies are observed from the frequency‒field relationship. However, these modes cannot be understood by the conventional two-sublattice AFM resonance theory with uniaxial anisotropy. For the easy b axis, an unusual resonance mode is observed and its resonance field increases with decreasing frequency. This ESR mode becomes softening at ~8 T, corresponding to the onset of the 1/2 magnetization plateau.

1. Introduction

Low-dimensional spin systems have been attracting a lot of attention in condensed matter physics due to their exotic ground states and non-classical effects caused by spin fluctuation and magnetic frustration [1,2,3,4]. In particular, the transition metal pyrovanadate compounds have been extensively studied, and these systems exhibit complicated and intriguing physical properties, such as field-induced spin-flop-like transition [5,6], magnetization plateau [7], magnetoelectric coupling [8], and magnetic-field induced ferroelectric behavior [9].
The recently studied vanadate oxide Ni2V2O7 is a good example of low-dimensional antiferromagnets; it belongs to the family of T2X2O7 (T = Cu, Co, Ni, Fe, Mn; X = P, As, V) [10,11,12,13,14,15,16,17]. Ni2V2O7 crystallizes in a monoclinic-type structure with space group P21/c [17]. The schematic of the crystal structure is shown in Figure 1. The magnetic Ni2+ ions have two different crystallographic sites, Ni1 and Ni2. The skew chains are formed by two different edge-sharing NiO6 octahedra along the c axis, which are isolated by embedding the corner-shared nonmagnetic tetrahedrons VO4. This results in a quasi-one-dimensional structural arrangement. There have been several reports on the magnetic properties of this compound [18,19,20]. It was found that the compound undergoes long-range antiferromagnetic (AFM) ordering at TN = 7 K without a broad peak, showing the absence of one-dimensional magnetism despite the quasi-one-dimensional chain structure. When a magnetic field is applied along the a and b axes, a field-induced spin-flop-like transition takes place at the field of Hsf = 2.7 T and 1.3 T, respectively [20]. This shows that both a and b are easy axes. A further increase in the magnetic field results in the appearance of a nematic-like phase and a wide 1/2 magnetization plateau starting at Hc = 5.5, 8.0, and 7.1 T along the a, b, and c axes, respectively [20]. Recently, the magnetization plateaus were found to be strongly correlated with ferroelectricity in Ni2V2O7 as well as its isostructural compound Co2V2O7 [21].
The high field/frequency electron spin resonance (ESR) is a powerful technique to investigate the magnetic properties of the transition metal oxides, especially the magnetic anisotropy and field-induced magnetic phase transitions [22,23]. Recently, our ESR results on polycrystalline samples of Ni2V2O7 demonstrate the presence of AFM resonances below TN [19]. However, no ESR on a single crystal sample was reported. Here, we performed high-field/frequency ESR measurements of Ni2V2O7. Strong correlations between magnetism and the ESR data are described in detail. We find that the observed AFM resonance modes cannot be interpreted by the conventional two-sublattice AFM resonance theory with uniaxial anisotropy. In particular, we find an unusual softening of the ESR mode at ~8 T, corresponding to the onset of the 1/2 magnetization plateau of the easy b axis.

2. Experimental Details

A high-quality single crystal of Ni2V2O7 was grown by the flux method by mixing polycrystalline Ni2V2O7 and V2O5 at a ratio of 2:1 in a commercial electric furnace. The homogenized mixture was transferred to an alumina crucible. The crucible was heated to 1173 K and held for 10 h, then cooled down to 873 K at the rate of 1 K/h, and finally quickly cooled to room temperature. The Ni2V2O7 single crystals were obtained by mechanical separation and washing the product in dilute nitric acid. Single-crystal X-ray diffraction (XRD) data were collected at room temperature using the program SHELXL-2016 on an XtaLAB Mini II diffractometer (Tokyo, Japan) equipped with Rigaku Mo X-ray source (see Appendix A). The details of the crystal growth, characterization of the structure, and crystallographic axes can be found in the published procedures [18,20]. The chemical compositions were checked by Micro X-ray fluorescence (Micro-XRF) (see Appendix A). High-field magnetization measurements were conducted at the magnetic field up to 40 T (see Appendix B). High-field/frequency ESR measurements were performed using pulsed high magnetic fields at Wuhan National High Magnetic Field Center, Huazhong University of Science and Technology, China. Gunn oscillators and backward wave oscillators (BWOs) were employed as the light sources. The temperature-dependent ESR spectra at representative frequencies were collected in the temperature region from 40 to 2 K. The frequency-dependent ESR measurements were carried out at 2 K in the frequency range from 54 to 260 GHz.

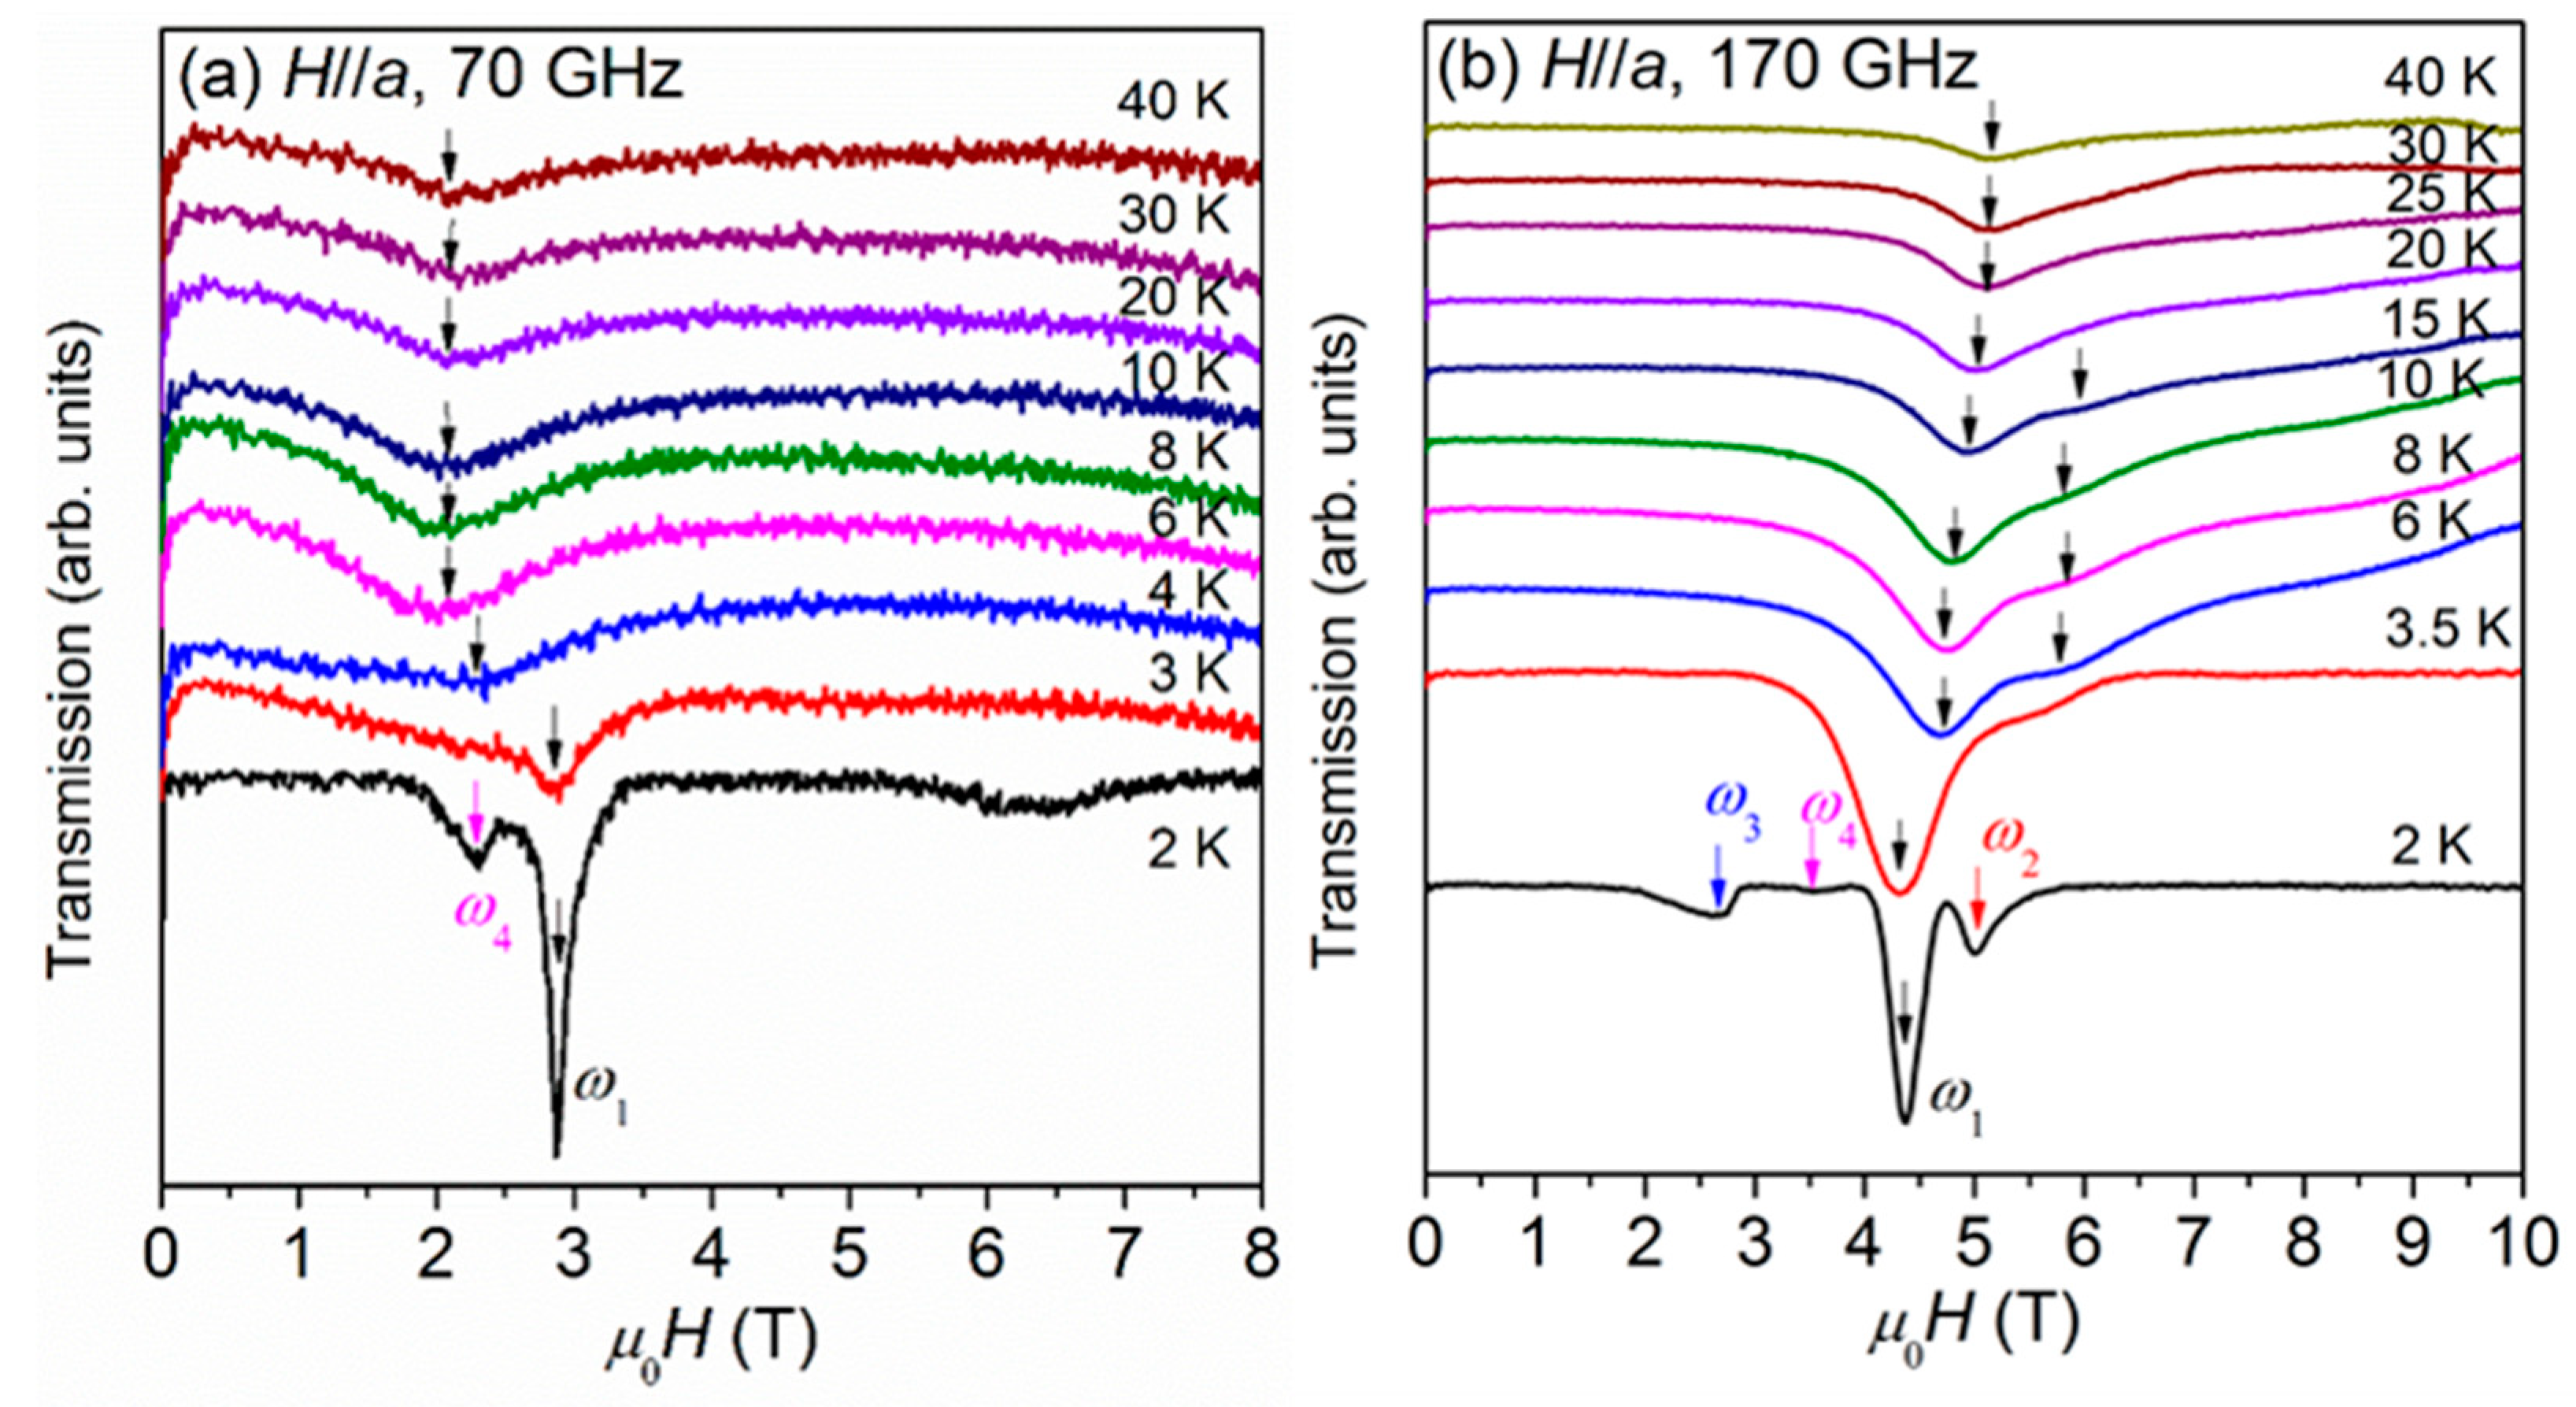
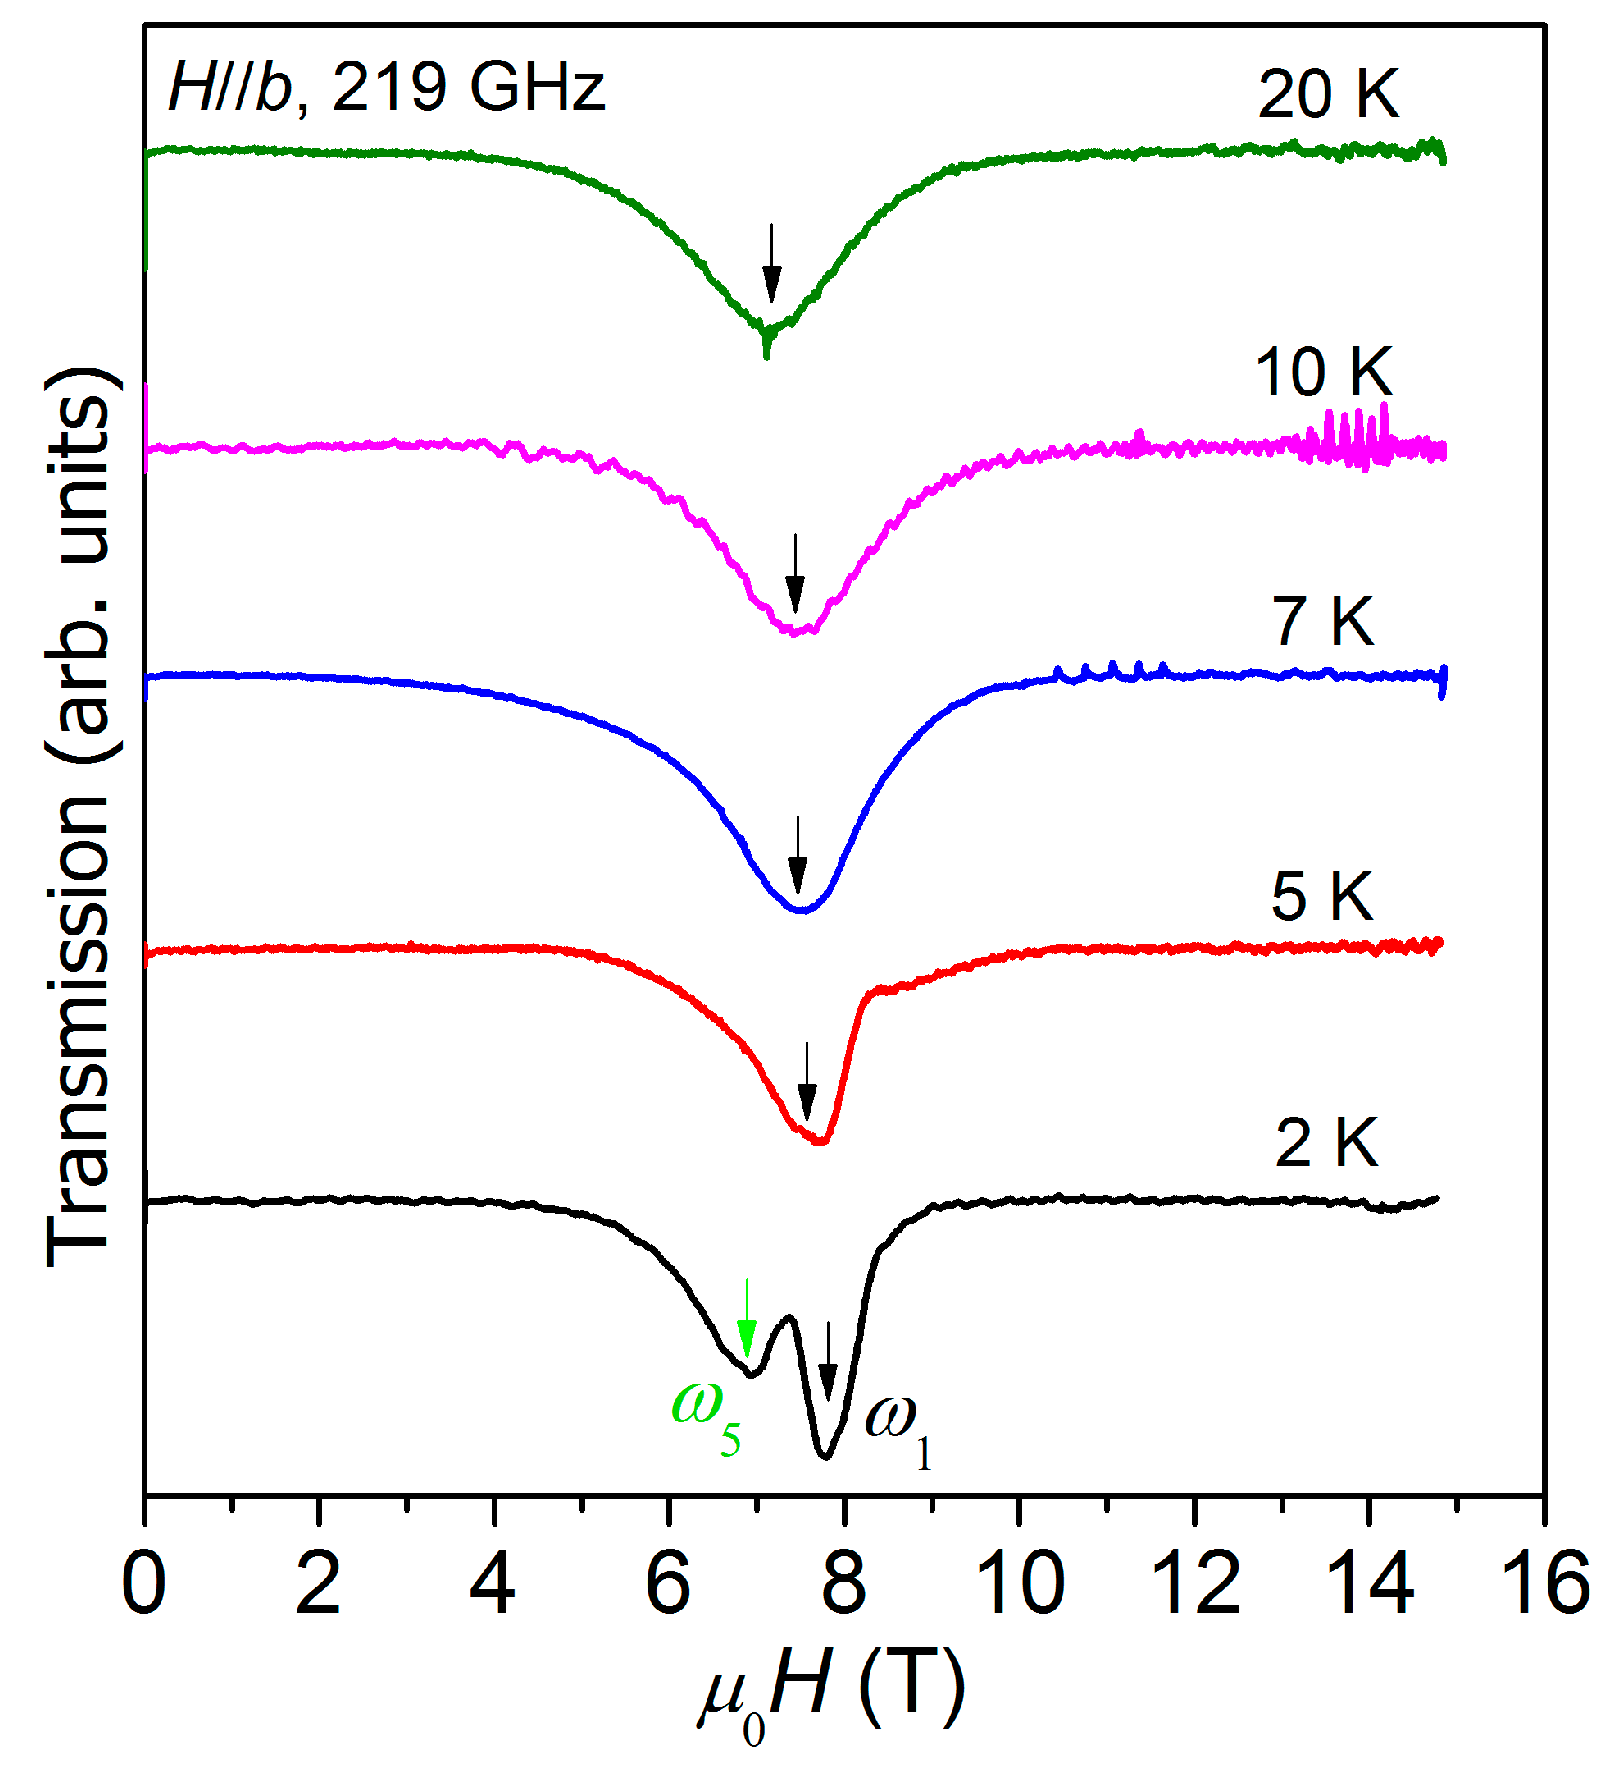
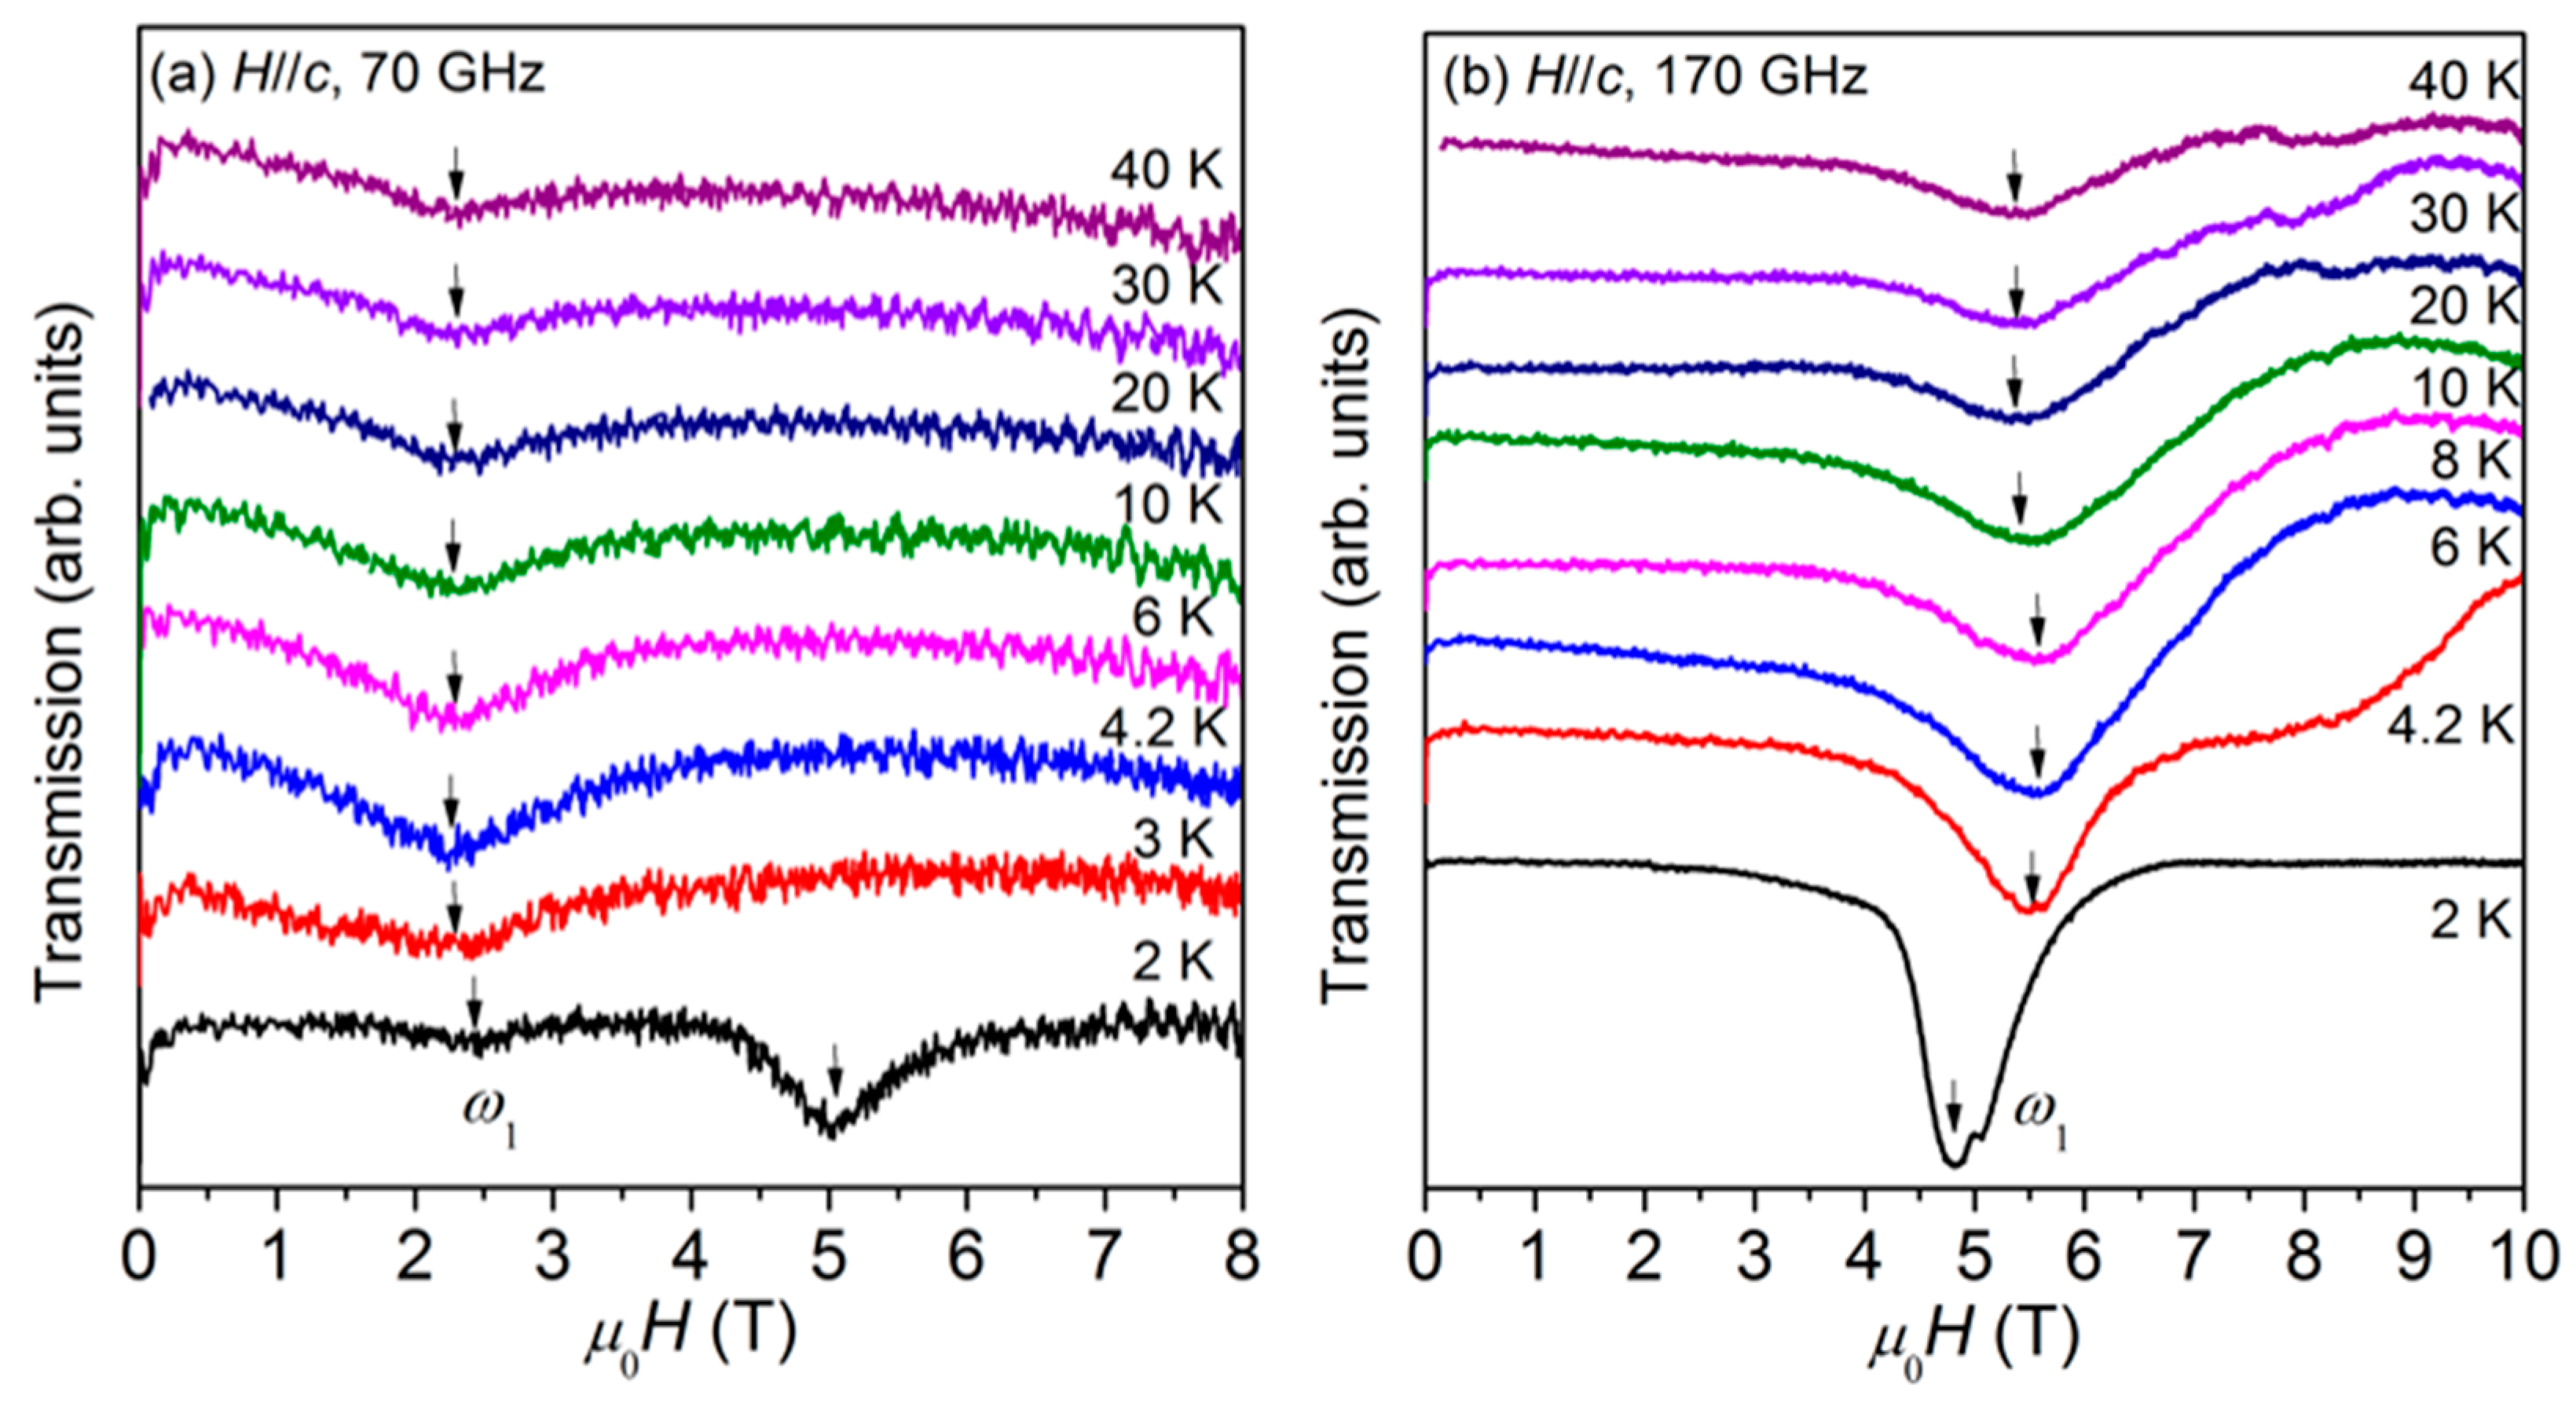
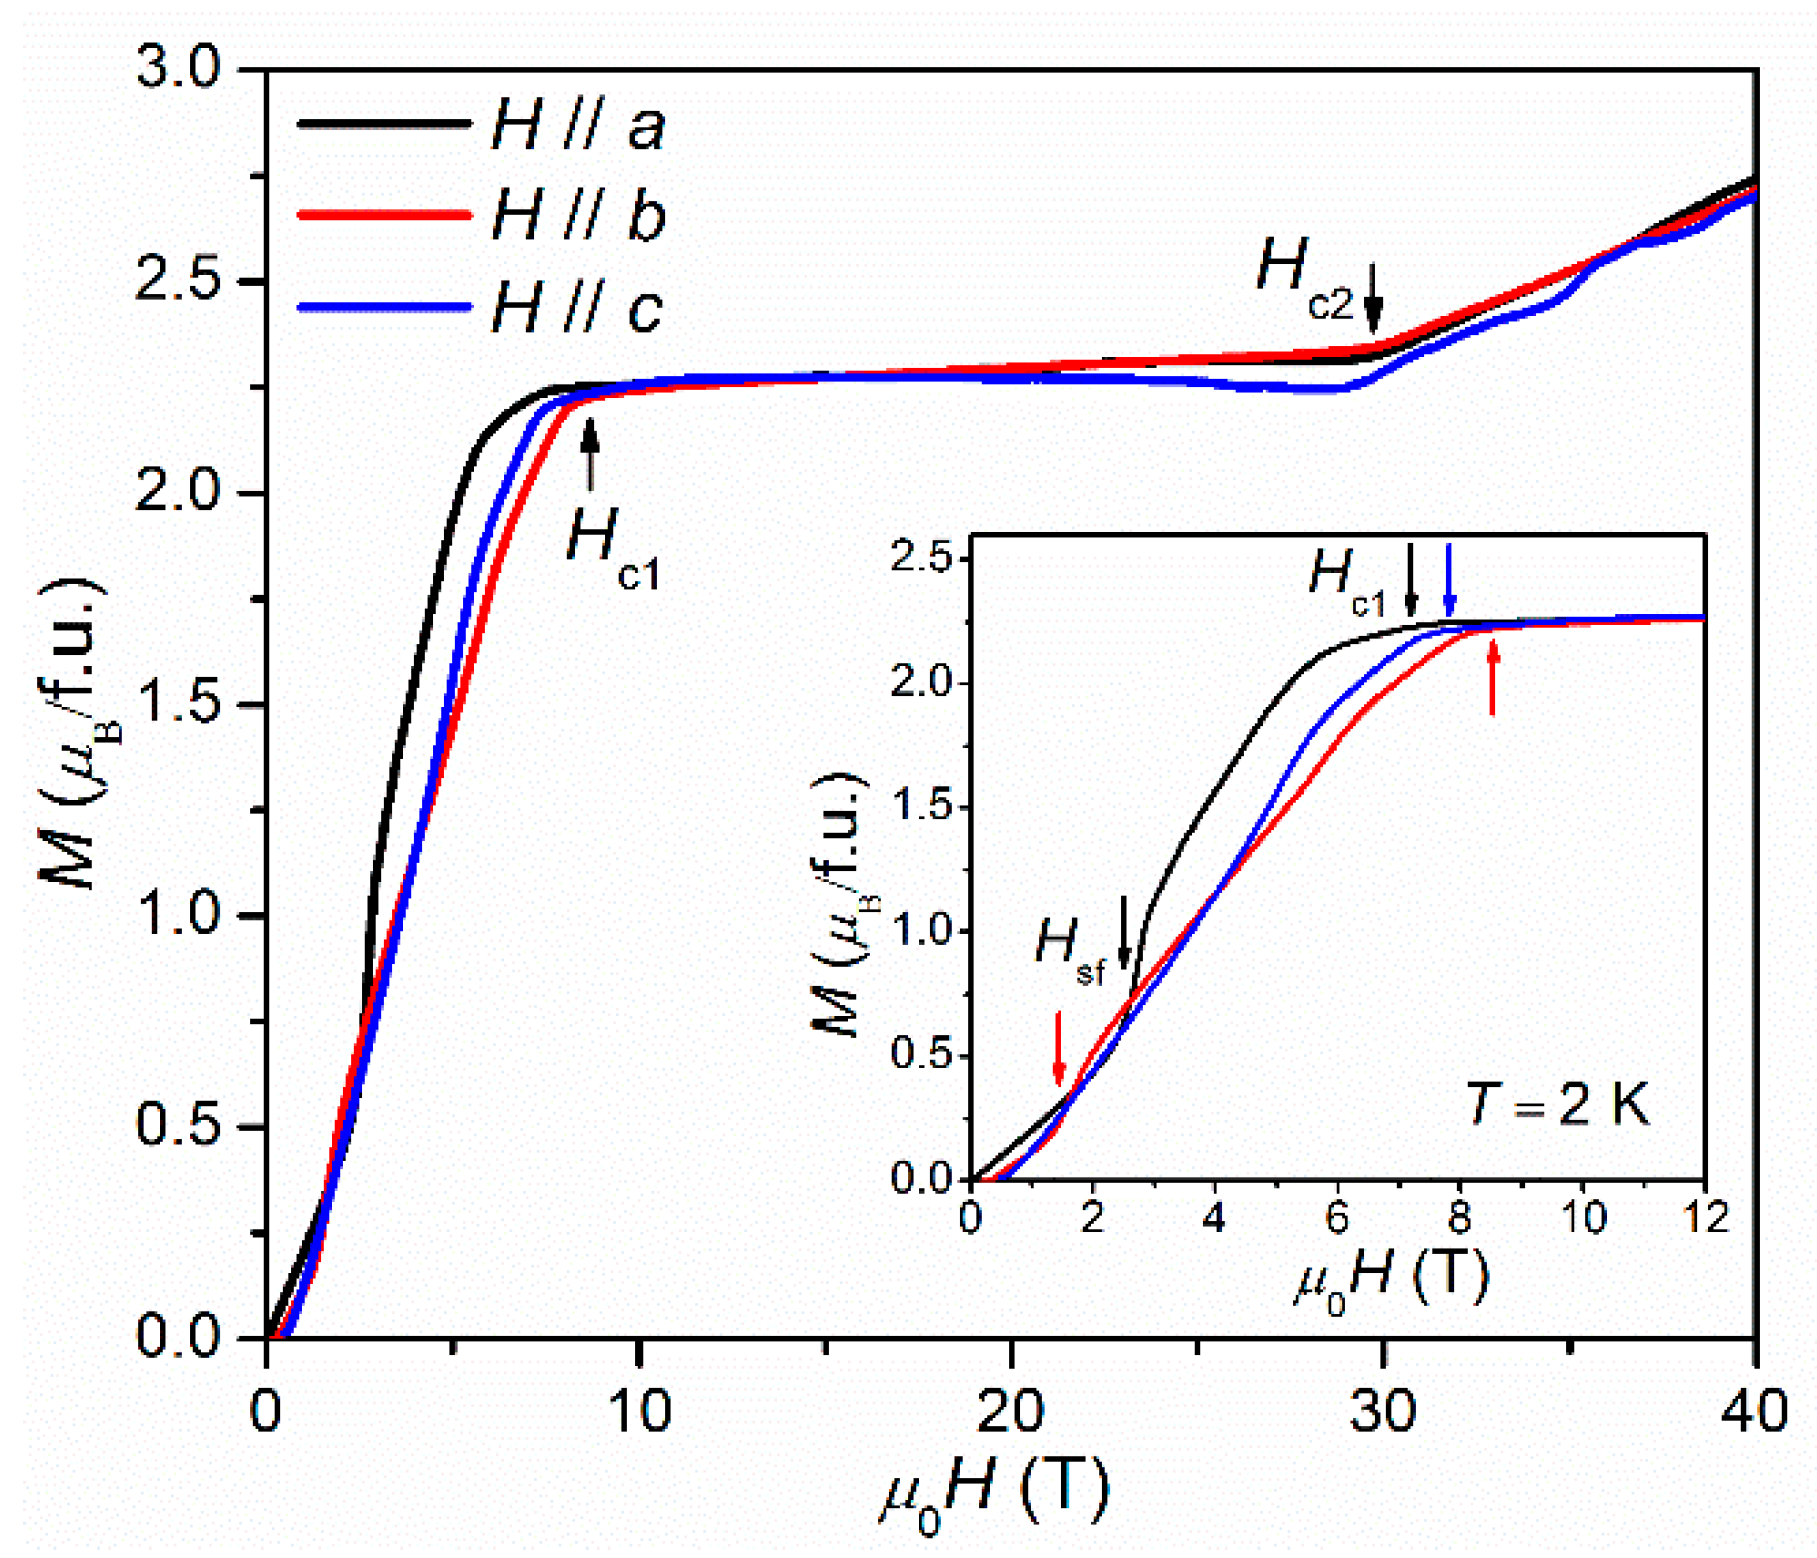
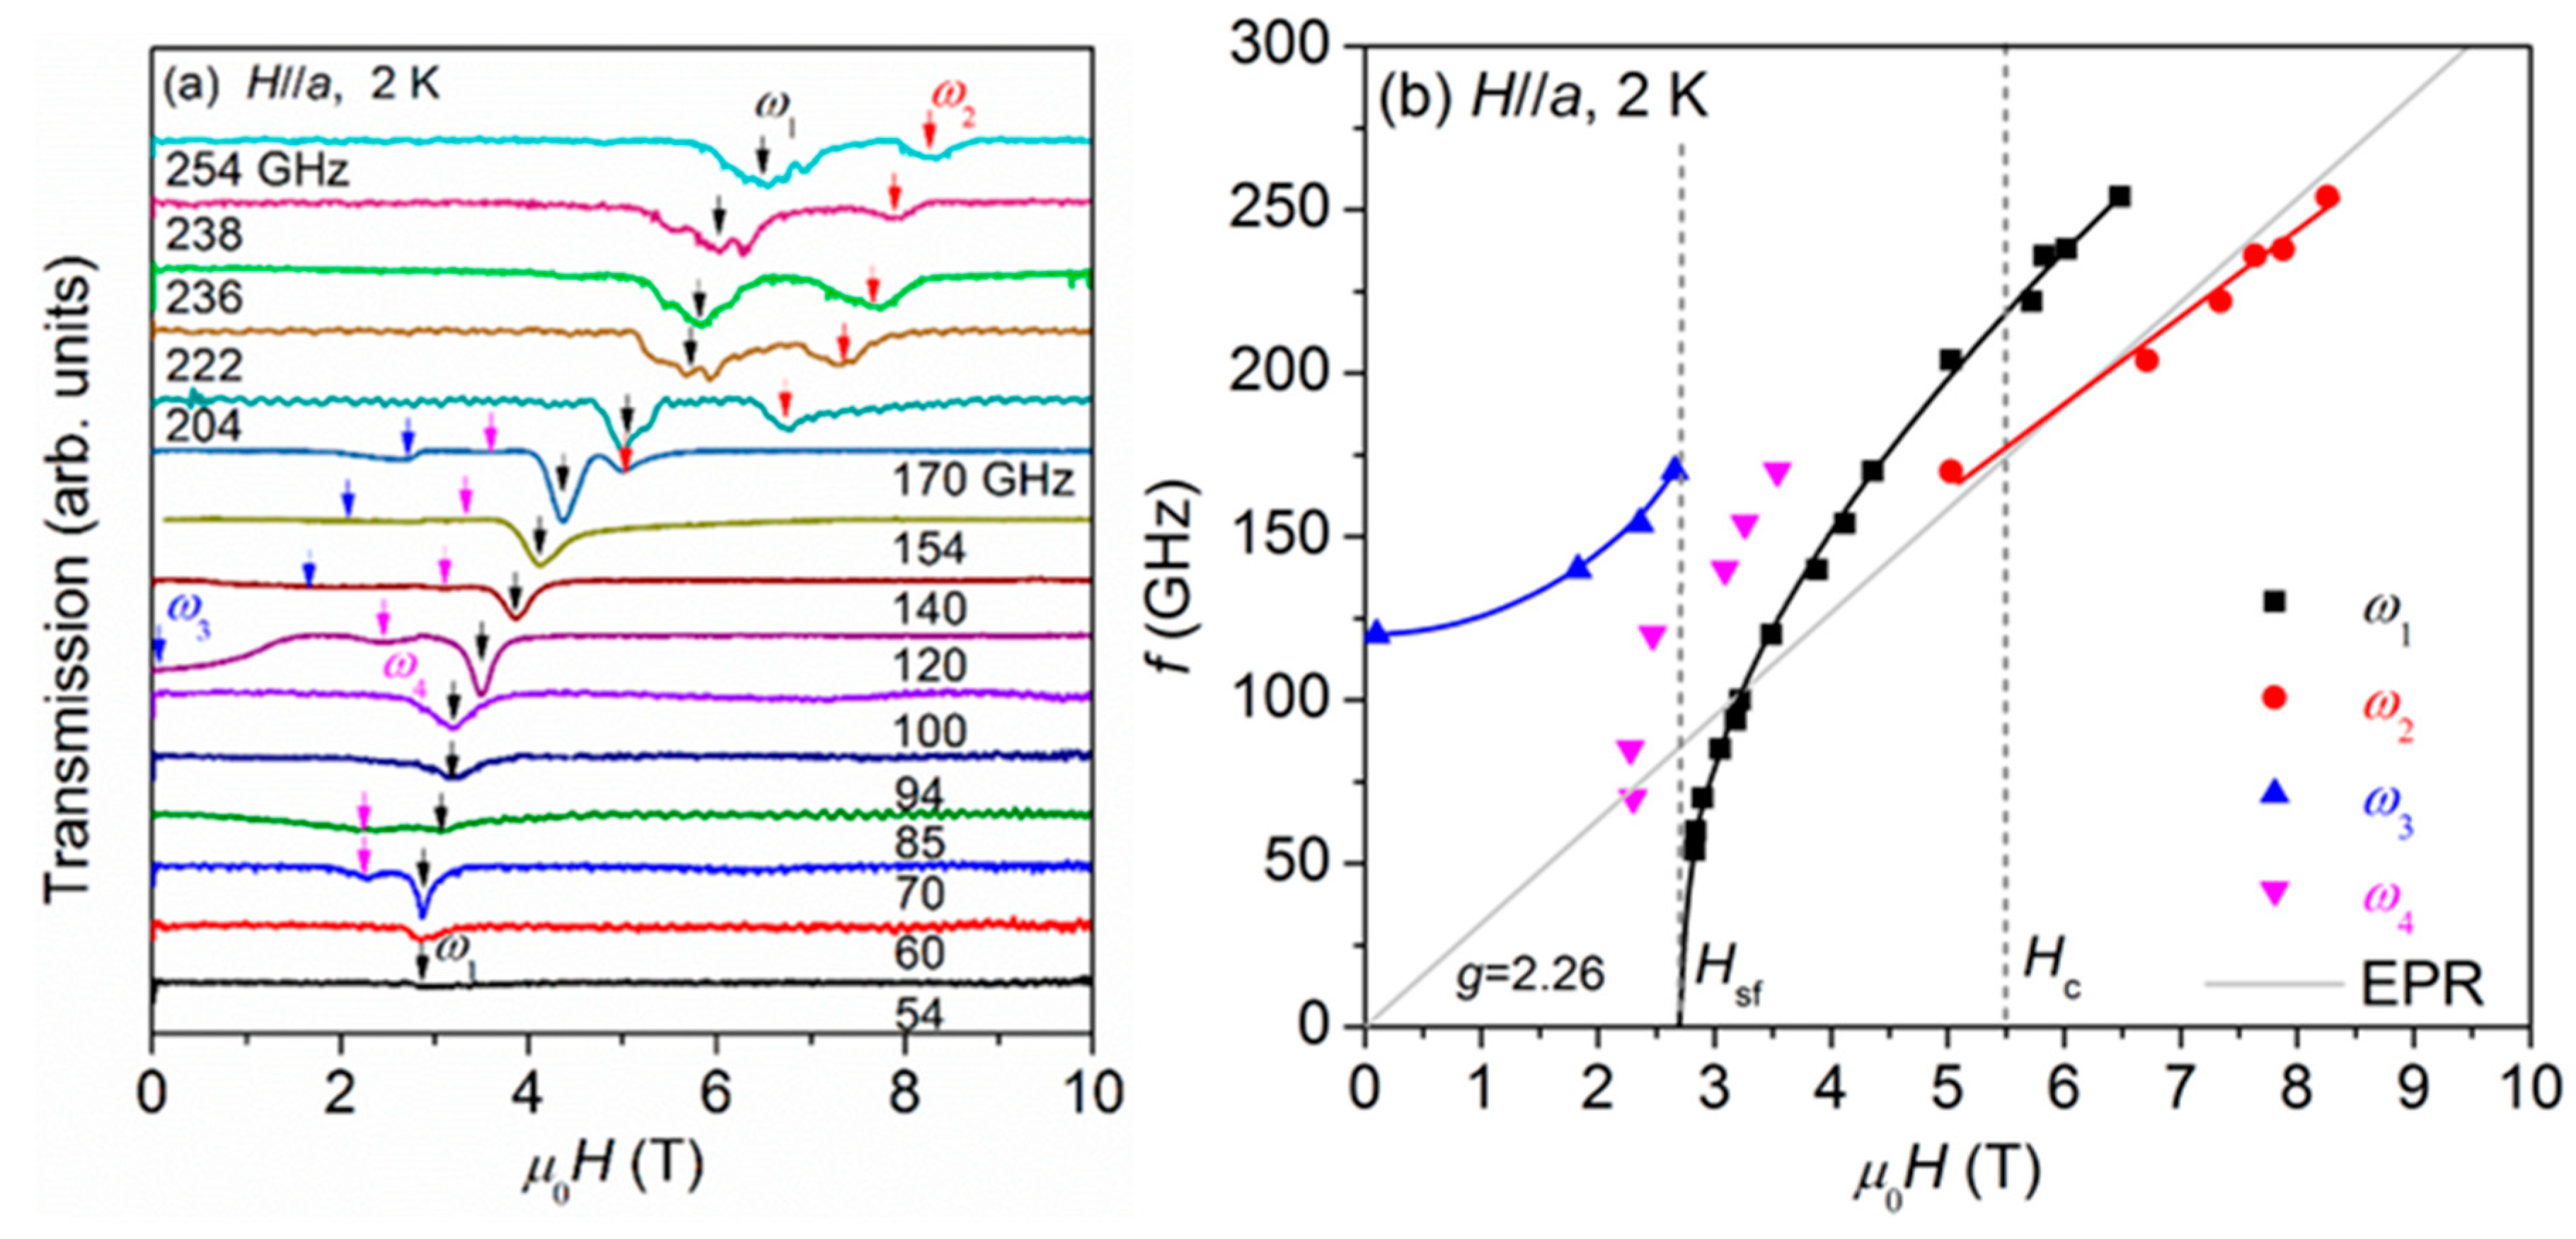
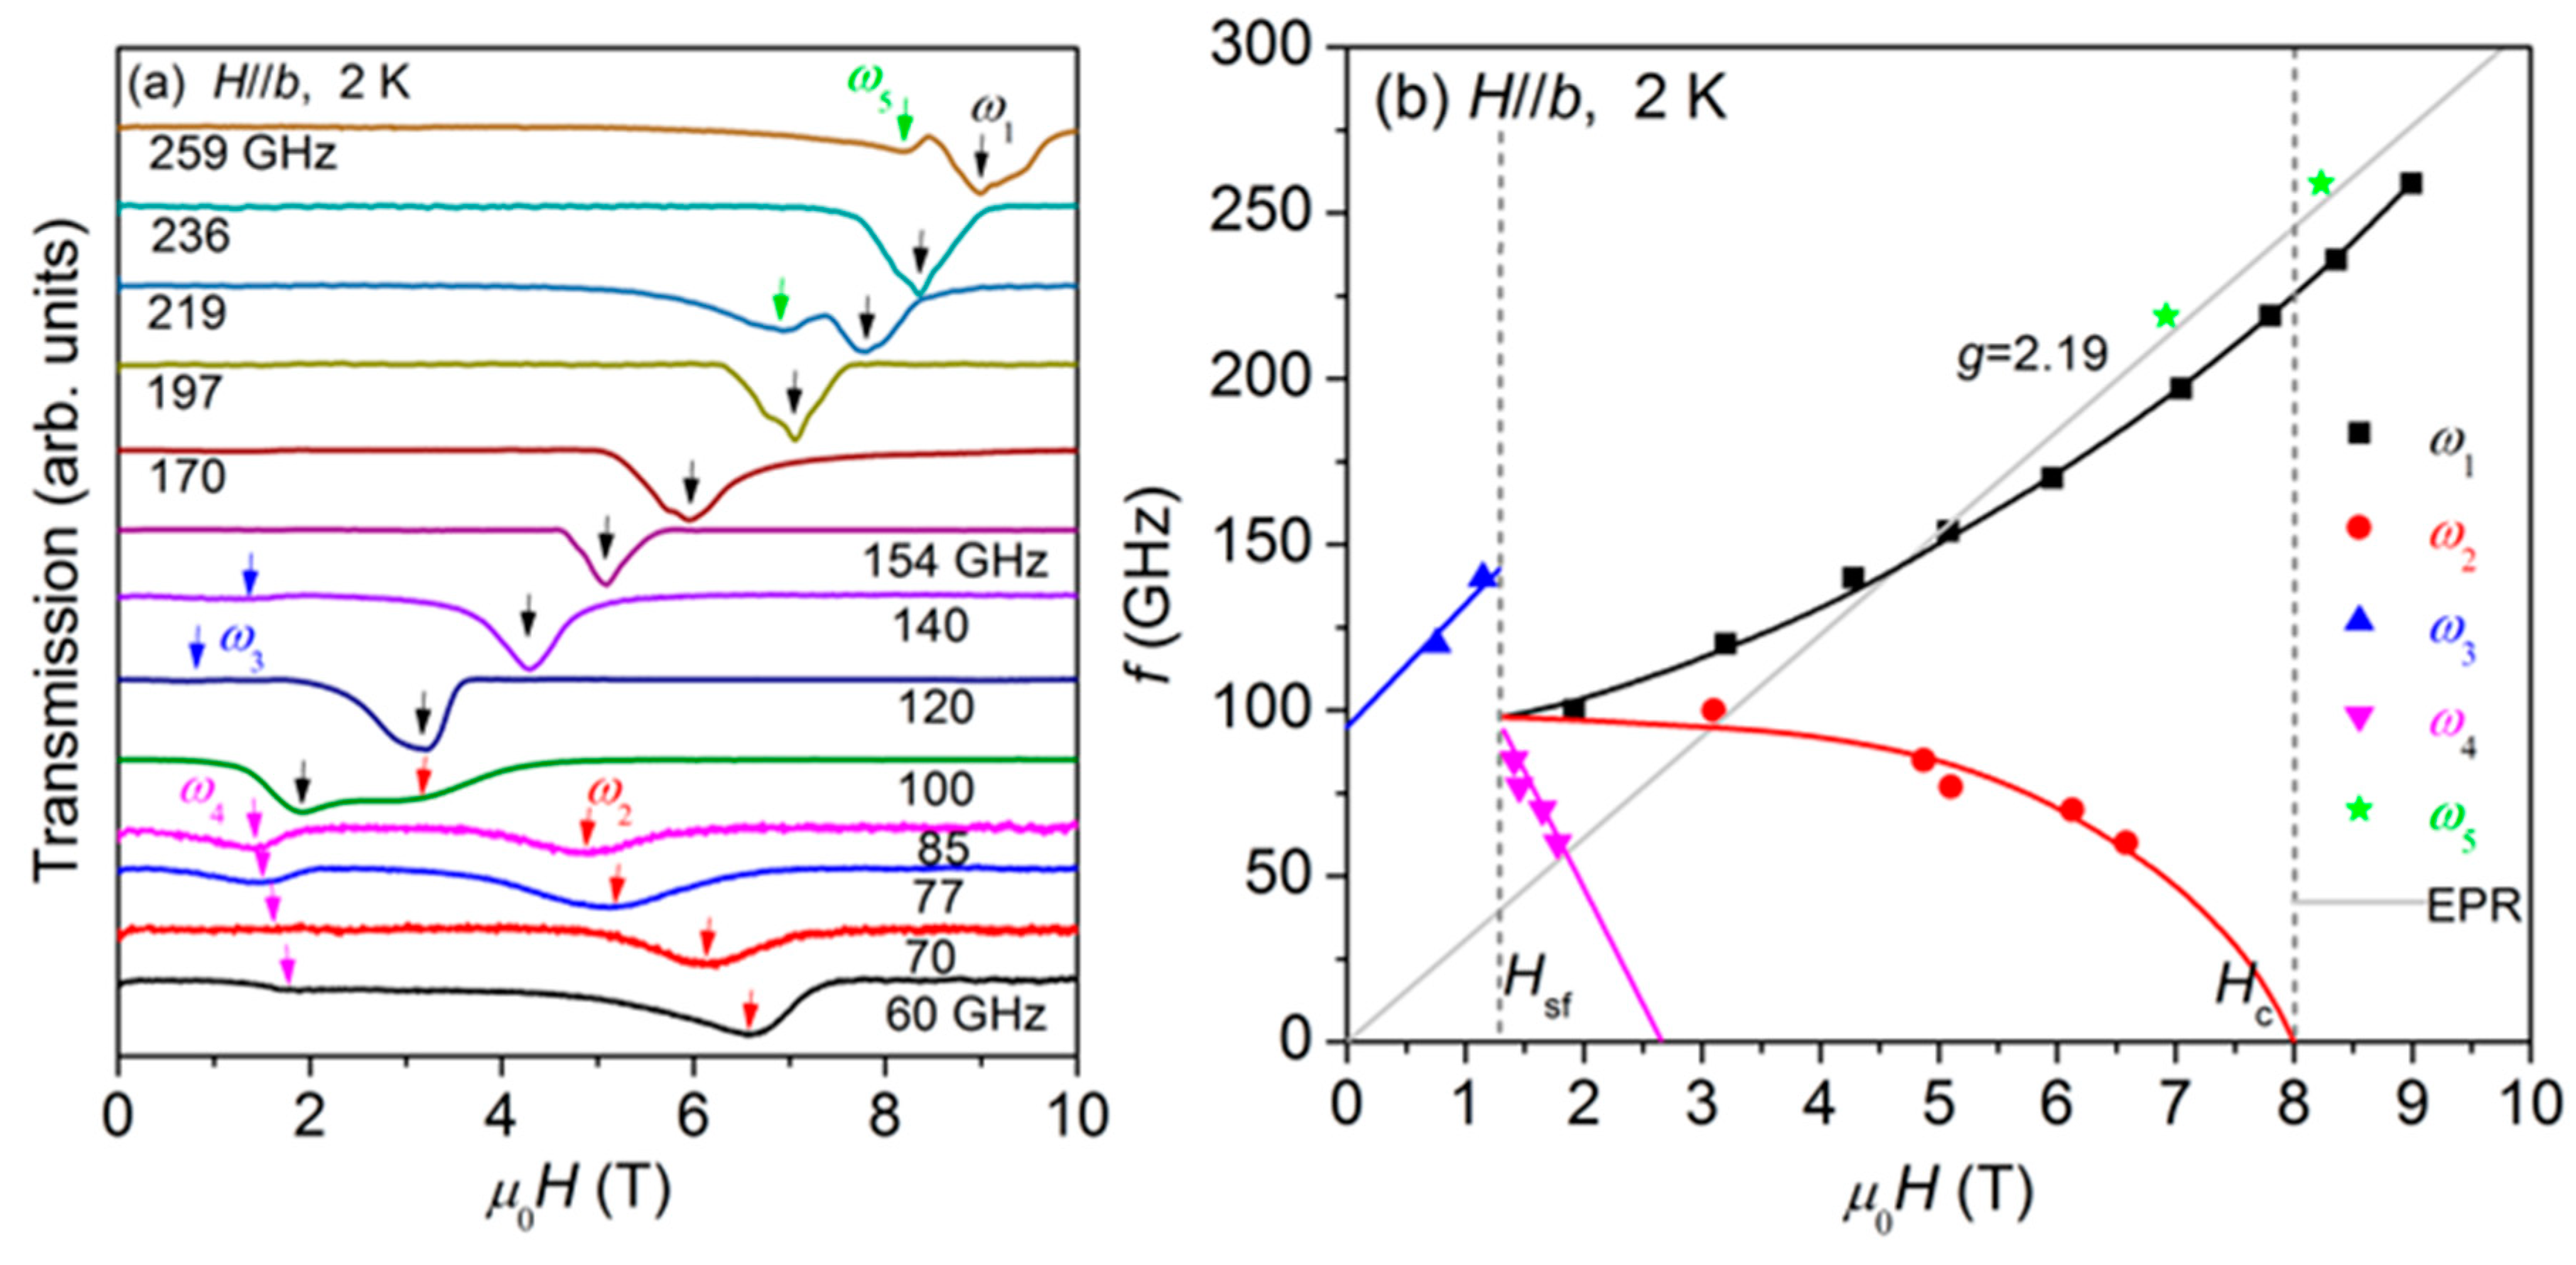
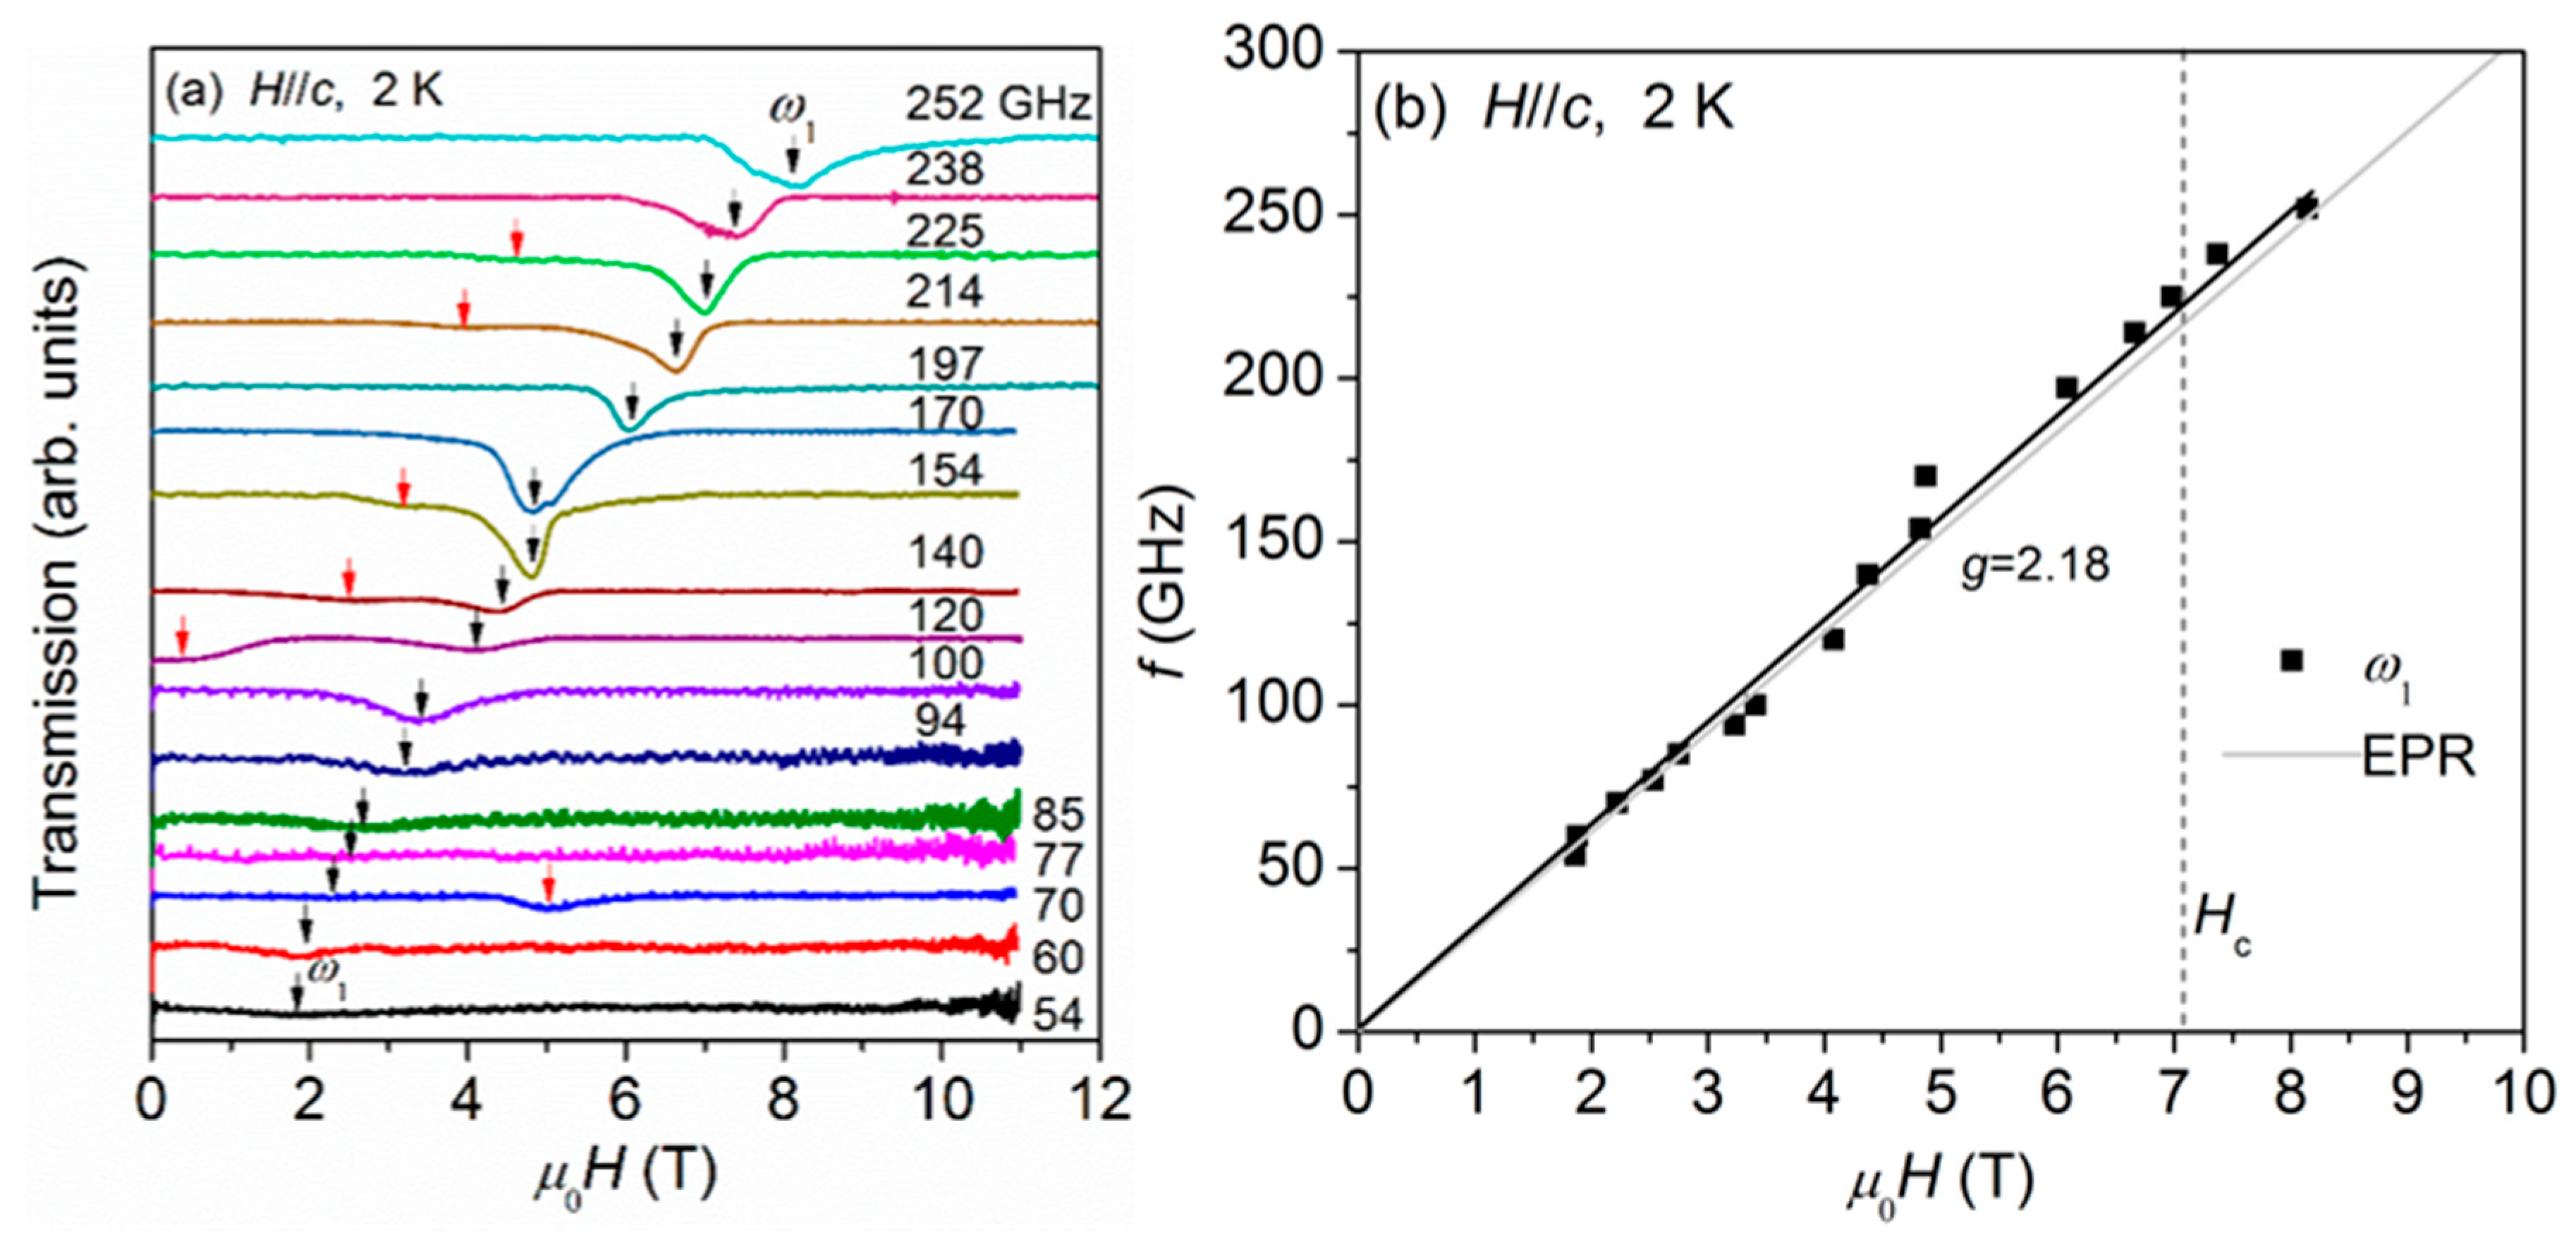
3. Results and Discussion

Figure 2 shows the temperature dependence of ESR spectra measured at two representative frequencies along the easy a axis of Ni2V2O7. At a high temperature of 40 K, a single resonance peak is observed and can be ascribed to the electron paramagnetic resonance (EPR) of Ni2+ ions. The resonance peak is very broad, with a half-height width of ~1 T, which might be a signature of the enhanced exchange interaction between different Ni2+ ions. Based on the resonance formula hf = BH (is the Planck constant and μB is the Bohr magneton), the g factor is derived to be ga = 2.26, a typical value of paramagnetic resonance of Ni2+. As the temperature is lowered, the peak intensity is increased, but there are some differences between low frequency and high frequency. At 70 GHz (Figure 2a), no significant shift of the peak is observed until TN = 7 K, below which the peak shifts to a higher field due to the onset of AFM ordering. At 2 K, the spectra consist of two peaks, with the low-field peak being weaker than the high-field peak. At 170 GHz (Figure 2b), however, with the decrease in temperature, the resonance peak gradually moves towards a lower field, accompanied by an appearance of a weak peak at a high field. At 2 K, the resonance is composed of four peaks, in which ω1 is much stronger than the other three modes (ω2, ω3, and ω4).
To further investigate the resonance modes at low temperature, we performed frequency-dependent ESR measurements at 2 K along the a axis. The results are shown in Figure 3a. It can be seen that the main resonance mode ω1 is always observed. At a high frequency, this mode is broadened and seems to split into multiple peaks. Another mode, ω2, appears at a higher field and higher frequency. As the frequency is reduced to 170 GHz, ω2 tends to disappear, accompanying the emergence of two new but weak modes, ω3 and ω4. Below 120 GHz, mode ω3 becomes invisible.
The frequency‒field relationship (fH) of resonance peaks along the a axis is summarized in Figure 3b, where the spin-flop transition field Hsf = 2.7 T and the critical field Hc = 5.5 T for the onset of the 1/2 magnetization plateau are also shown [20]. The resonance field increases with increasing frequency for all the modes. Mode ω1 is nonlinear and extends to the region above Hc. By extrapolating from the fH relationship to a low field, we see that ω1 will disappear at Hsf = 2.7 T. Mode ω3 is also nonlinear and tends to disappear at Hsf. There is a zero-field AFM spin gap of 120 GHz. Mode ω2 is mainly observed above Hc. The fH relationship seems to be linear, but deviates from the EPR line, showing the presence of a small zero-field spin gap. Mode ω4 can be observed below and above Hsf; its origin is not clear at this moment.
For the other easy axis, i.e., the b axis [20], Figure 4 gives the ESR spectra measured at 219 GHz at several temperatures. The spectrum at 20 K exhibits a symmetric resonance peak with a half-height width of ~2 T and a g value of gb = 2.19. With decreasing temperature, the peak becomes asymmetric, shifting slightly towards a higher field and finally splitting into two modes at 2 K, with the low-field mode being weaker than the high-field mode.
Figure 5a shows the frequency-dependent ESR spectra measured at 2 K for the b axis. Five resonances are observed and their variations with frequency are quite different from the case of the easy a axis. The fH relationships for these resonances are plotted in Figure 5b. Clearly, ω1 and ω2 start to appear at spin-flop transition field Hsf = 1.3 T [20], and both modes are nonlinear. For ω1, the resonance field increases with increasing frequency, with a tendency to extending into the region above Hc = 8.0 T [20]. For ω2, however, the resonance field increases with decreasing frequency. An extrapolation of the fH relationship to a high field suggests that ω2 will become softening at Hc = 8.0 T. Modes ω3 and ω4 are weak resonance modes; ω3 has a zero-field gap of 100 GHz and disappears at Hsf, whereas ω4 starts to appear at Hsf. Mode ω5 is observed only at high frequency and its origin is not clear at this moment.
In Figure 6, we display the temperature-dependent ESR spectra measured at 70 and 170 GHz along the c axis, i.e., the hard axis of Ni2V2O7. At 70 GHz (Figure 6a), a broad EPR line is observed at 40 K with gc = 2.18. The evolution of the spectra with temperature is similar to that of the a axis—namely, the peak shifts towards a higher field at low temperature. At 170 GHz (Figure 6b), however, the peak first moves to a higher field with decreasing temperature and then shifts towards a lower field below TN.
The frequency-dependent ESR spectra at 2 K are shown in Figure 7a. Besides the main resonance, ω1, several weak modes are seen. These modes might come from the contribution from the easy a and b axes due to the imperfect arrangement of the tiny single crystal along the external magnetic field during the measurements. As shown in Figure 7b, the fH relationship of ω1 is nearly linear and passes through the origin, very close to the EPR line. No anomaly is found at the critical field Hc = 7.1 T for the 1/2 magnetization plateau [20].
We now make a qualitative discussion by combining the observed ESR spectra and the reported magnetic properties of Ni2V2O7 [18,19,20]. First, the AFM ordering temperature of TN = 7 K can be characterized by the temperature-dependent ESR spectra at low frequency. This is clearly seen from the data at 70 GHz for the easy a axis (Figure 2a), where the resonance peak significantly moves to a higher field below TN. In this case, the resonance fields are smaller than Hsf = 2.7 T (Figure 3b), below which the system is in the AFM ground state. For the easy b axis, Hsf = 1.3 T (Figure 5b). To observe any resonances below 1.3 T, the required frequency must be lower than 36 GHz, which is beyond the low-frequency limit (54 GHz) of our facility. Thus, in Figure 4 no temperature-dependent ESR spectra are shown at low frequency. Second, the AFM ordering at TN = 7 K cannot be characterized by the high-frequency ESR spectra. This is probably because the resonances at high frequency occur above Hsf, corresponding to the spin-flop AFM state (see Figure 2b and Figure 4), or because the resonances correspond to the hard axis (see Figure 5b).
The fH phase diagram is rather complicated, details of which depend on the crystallographic direction. Even for the easy a and b axes, differences in the phase diagram are also evident. Obviously, like our previous report on a polycrystalline sample [19], the fH relationship along the three axes cannot be described by the conventional AFM resonance theory with easy-axis anisotropy within the framework of the two-sublattice mean-field model. Even so, we can see that at the spin-flop transition fields Hsf, anomalies are observed in the fH relationship. The zero-field AFM gaps of 120 GHz for the a axis (Figure 3b) and 100 GHz for the b axis (Figure 5b) reflect the presence of exchange interaction and magnetic anisotropy, which are the origin of the complex ESR spectra of Ni2V2O7. Interestingly, for the b axis, mode ω2 becomes softening at Hc = 8 T for the onset of 1/2 plateau [20]. If a resonance mode becomes softening at a transition field, its frequency will tend to zero because the rotation of the magnetic moment costs no energy. Similar resonance modes were reported in the quasi-one-dimensional AFM spin system BaCu2Si2O7, exhibiting successive spin-reorientation transitions [24], and Y2Cu2O5, showing successive metamagnetic transitions [25]. It is worth noting that Ni2V2O7 is a three-dimensional antiferromagnet including complicated intrachain and interchain exchange interactions [18,19,20]. This leads to complicated ESR modes, which deviate from the conventional two-sublattice AFM resonance modes with uniaxial anisotropy. To quantitatively describe the complicated ESR modes, a multi-sublattice AFM resonance theory is desired.

4. Conclusions

In summary, we present the high field/frequency ESR spectra of S = 1 skew chain antiferromagnet Ni2V2O7. The temperature-dependent ESR spectra at low frequency are intimately correlated with the AFM ordering process at TN = 7 K. At 2 K, the AFM resonance modes are rather complicated and cannot be interpreted by the conventional two-sublattice AFM resonance theory with uniaxial anisotropy. Even so, at the field-induced spin-flop transition fields along the easy a and b axes, anomalies are clearly seen from the fH relationships. In particular, an unusual resonance mode is observed along the easy b axis, which becomes softening at ~8 T, which is the critical field associated with the onset of the 1/2 magnetization plateau.

Author Contributions

Conceptualization, Z.O.; Methodology, L.Y. and X.Y.; Formal Analysis, Z.O.; Investigation, L.Y.; Resources, Z.O., Z.W., and Z.X.; Data Curation, L.Y. and X.Y.; Writing—Original Draft Preparation, L.Y. and Z.O.; Writing—Review & Editing, L.Y. and Z.O.; Funding Acquisition, Z.O., Z.W. and Z.X.

Funding

This work was supported by the National Natural Science Foundation of China (Grant Nos. 11874023 and 11674115) and by the Fundamental Research Funds for the Central Universities (Grant Nos. 2019kfyXKJC008).

Conflicts of Interest

The authors declare no conflict of interest.

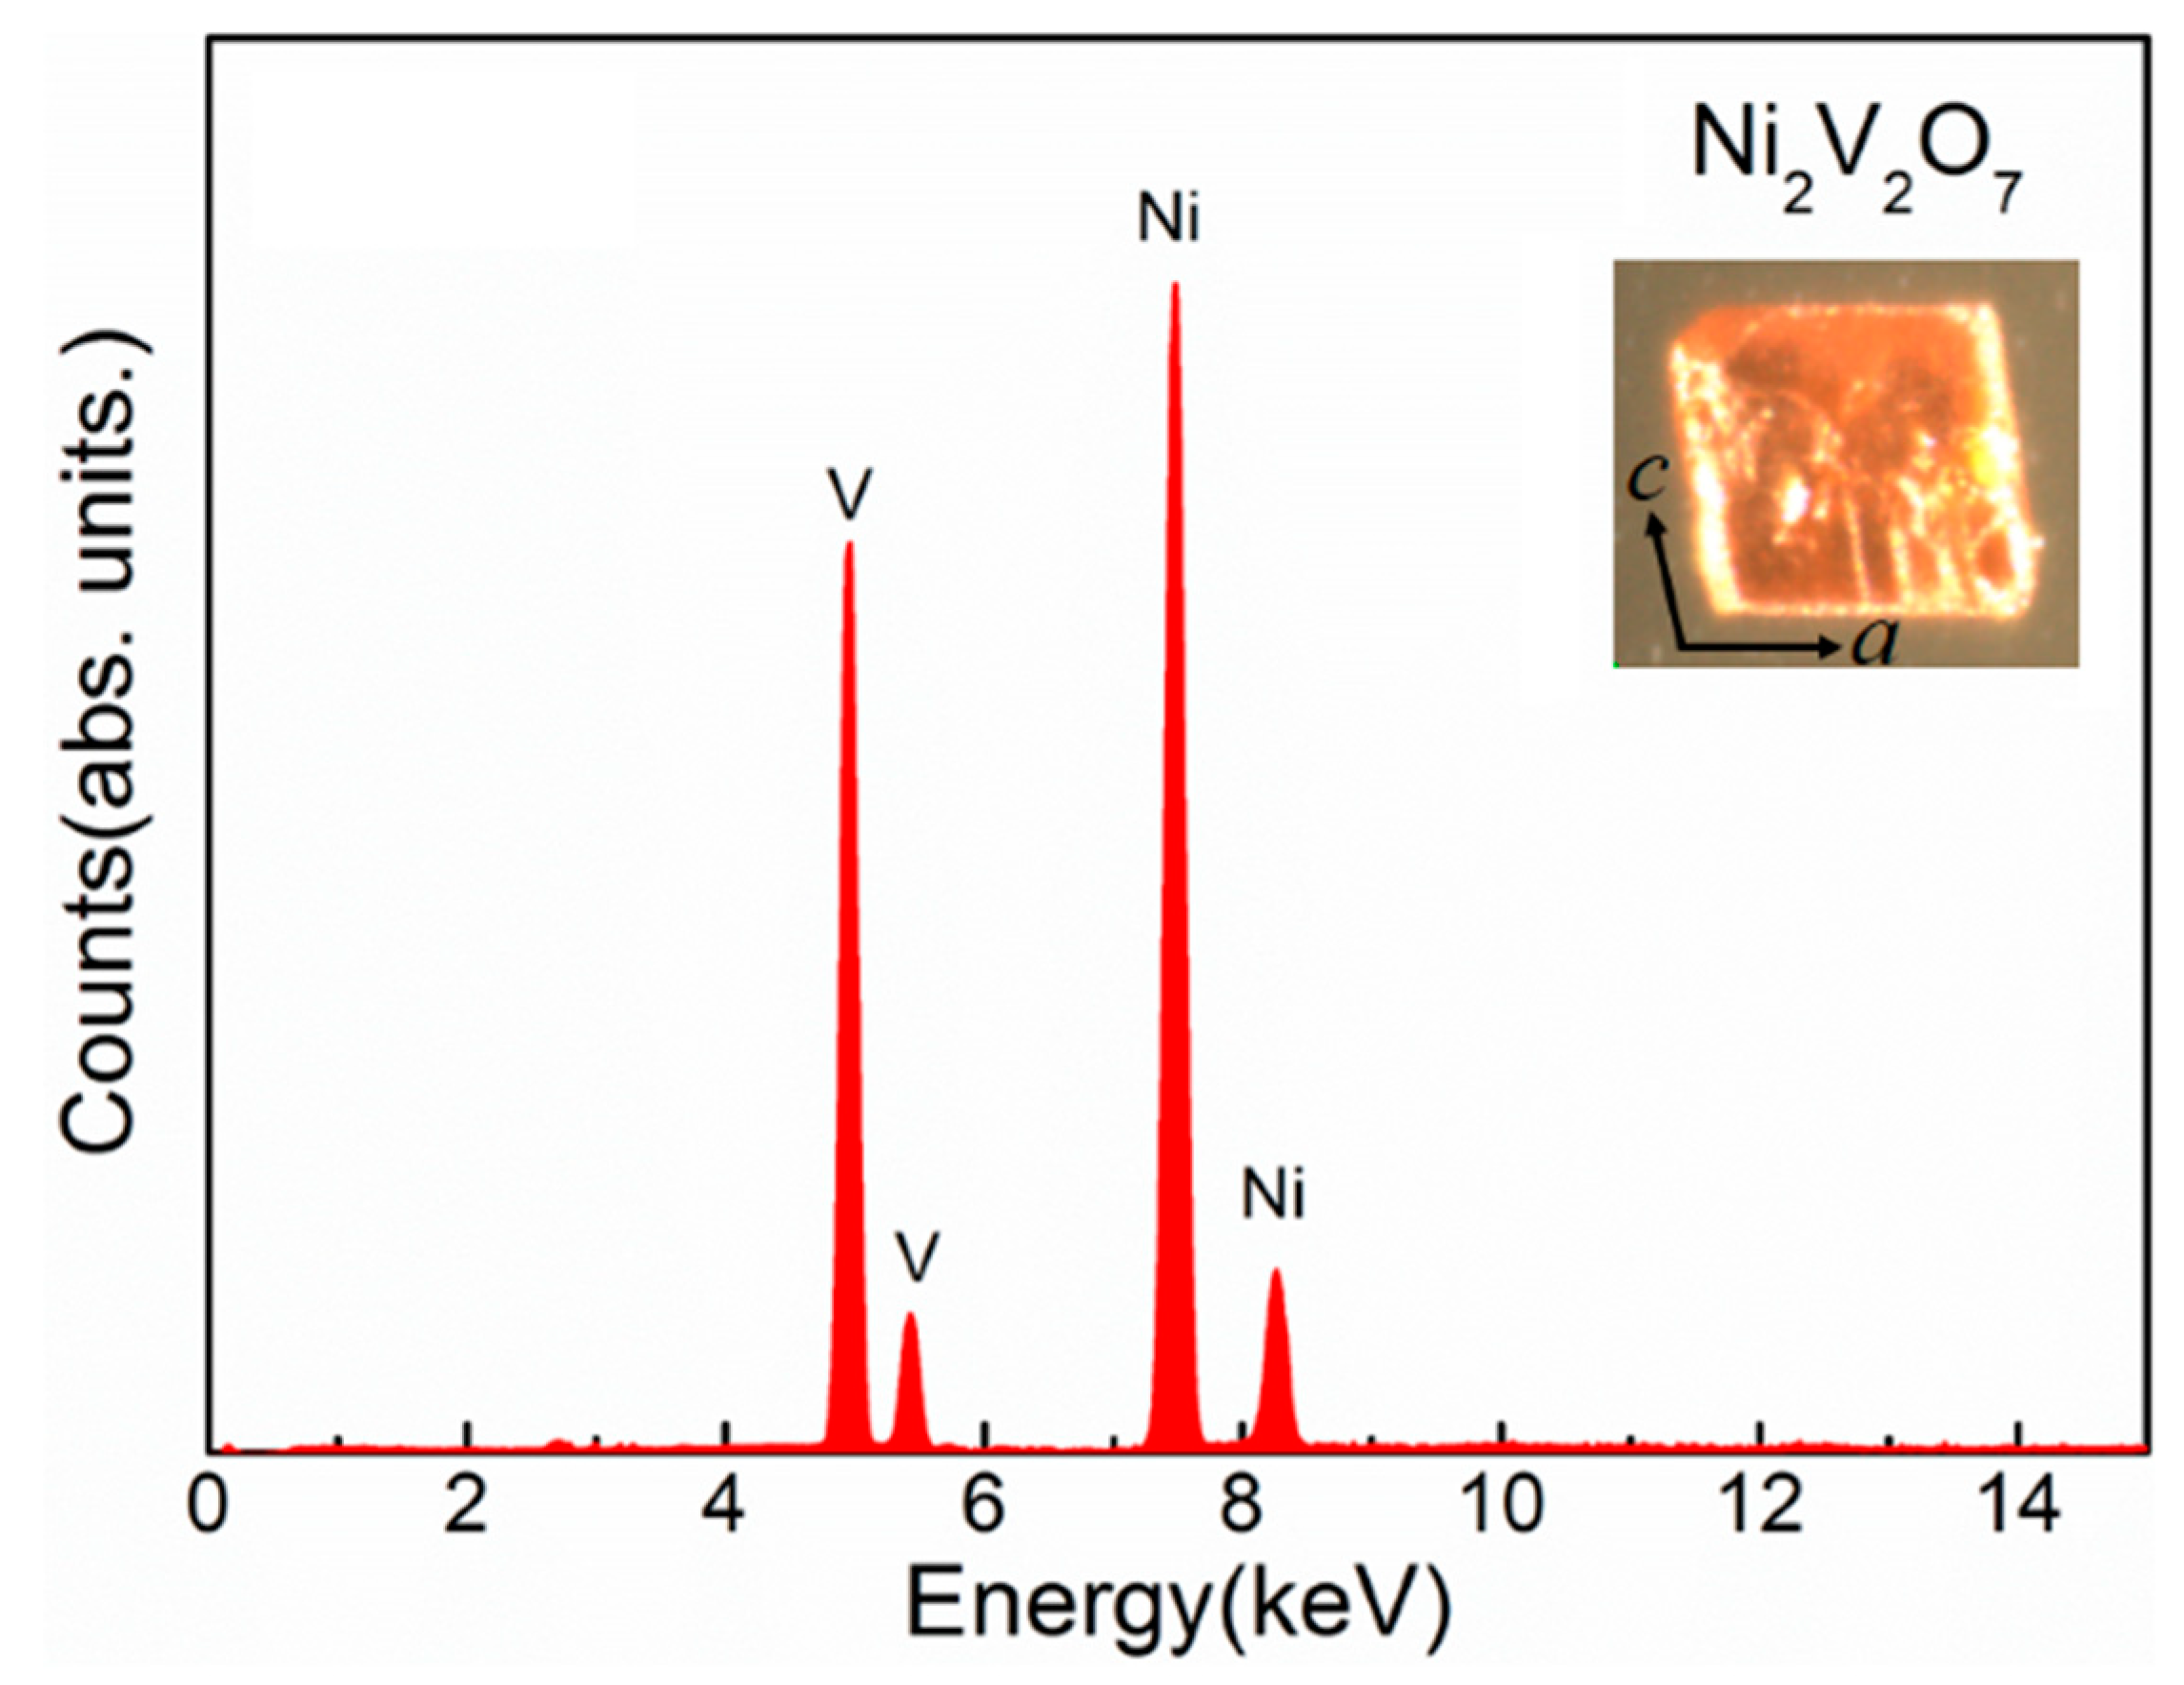
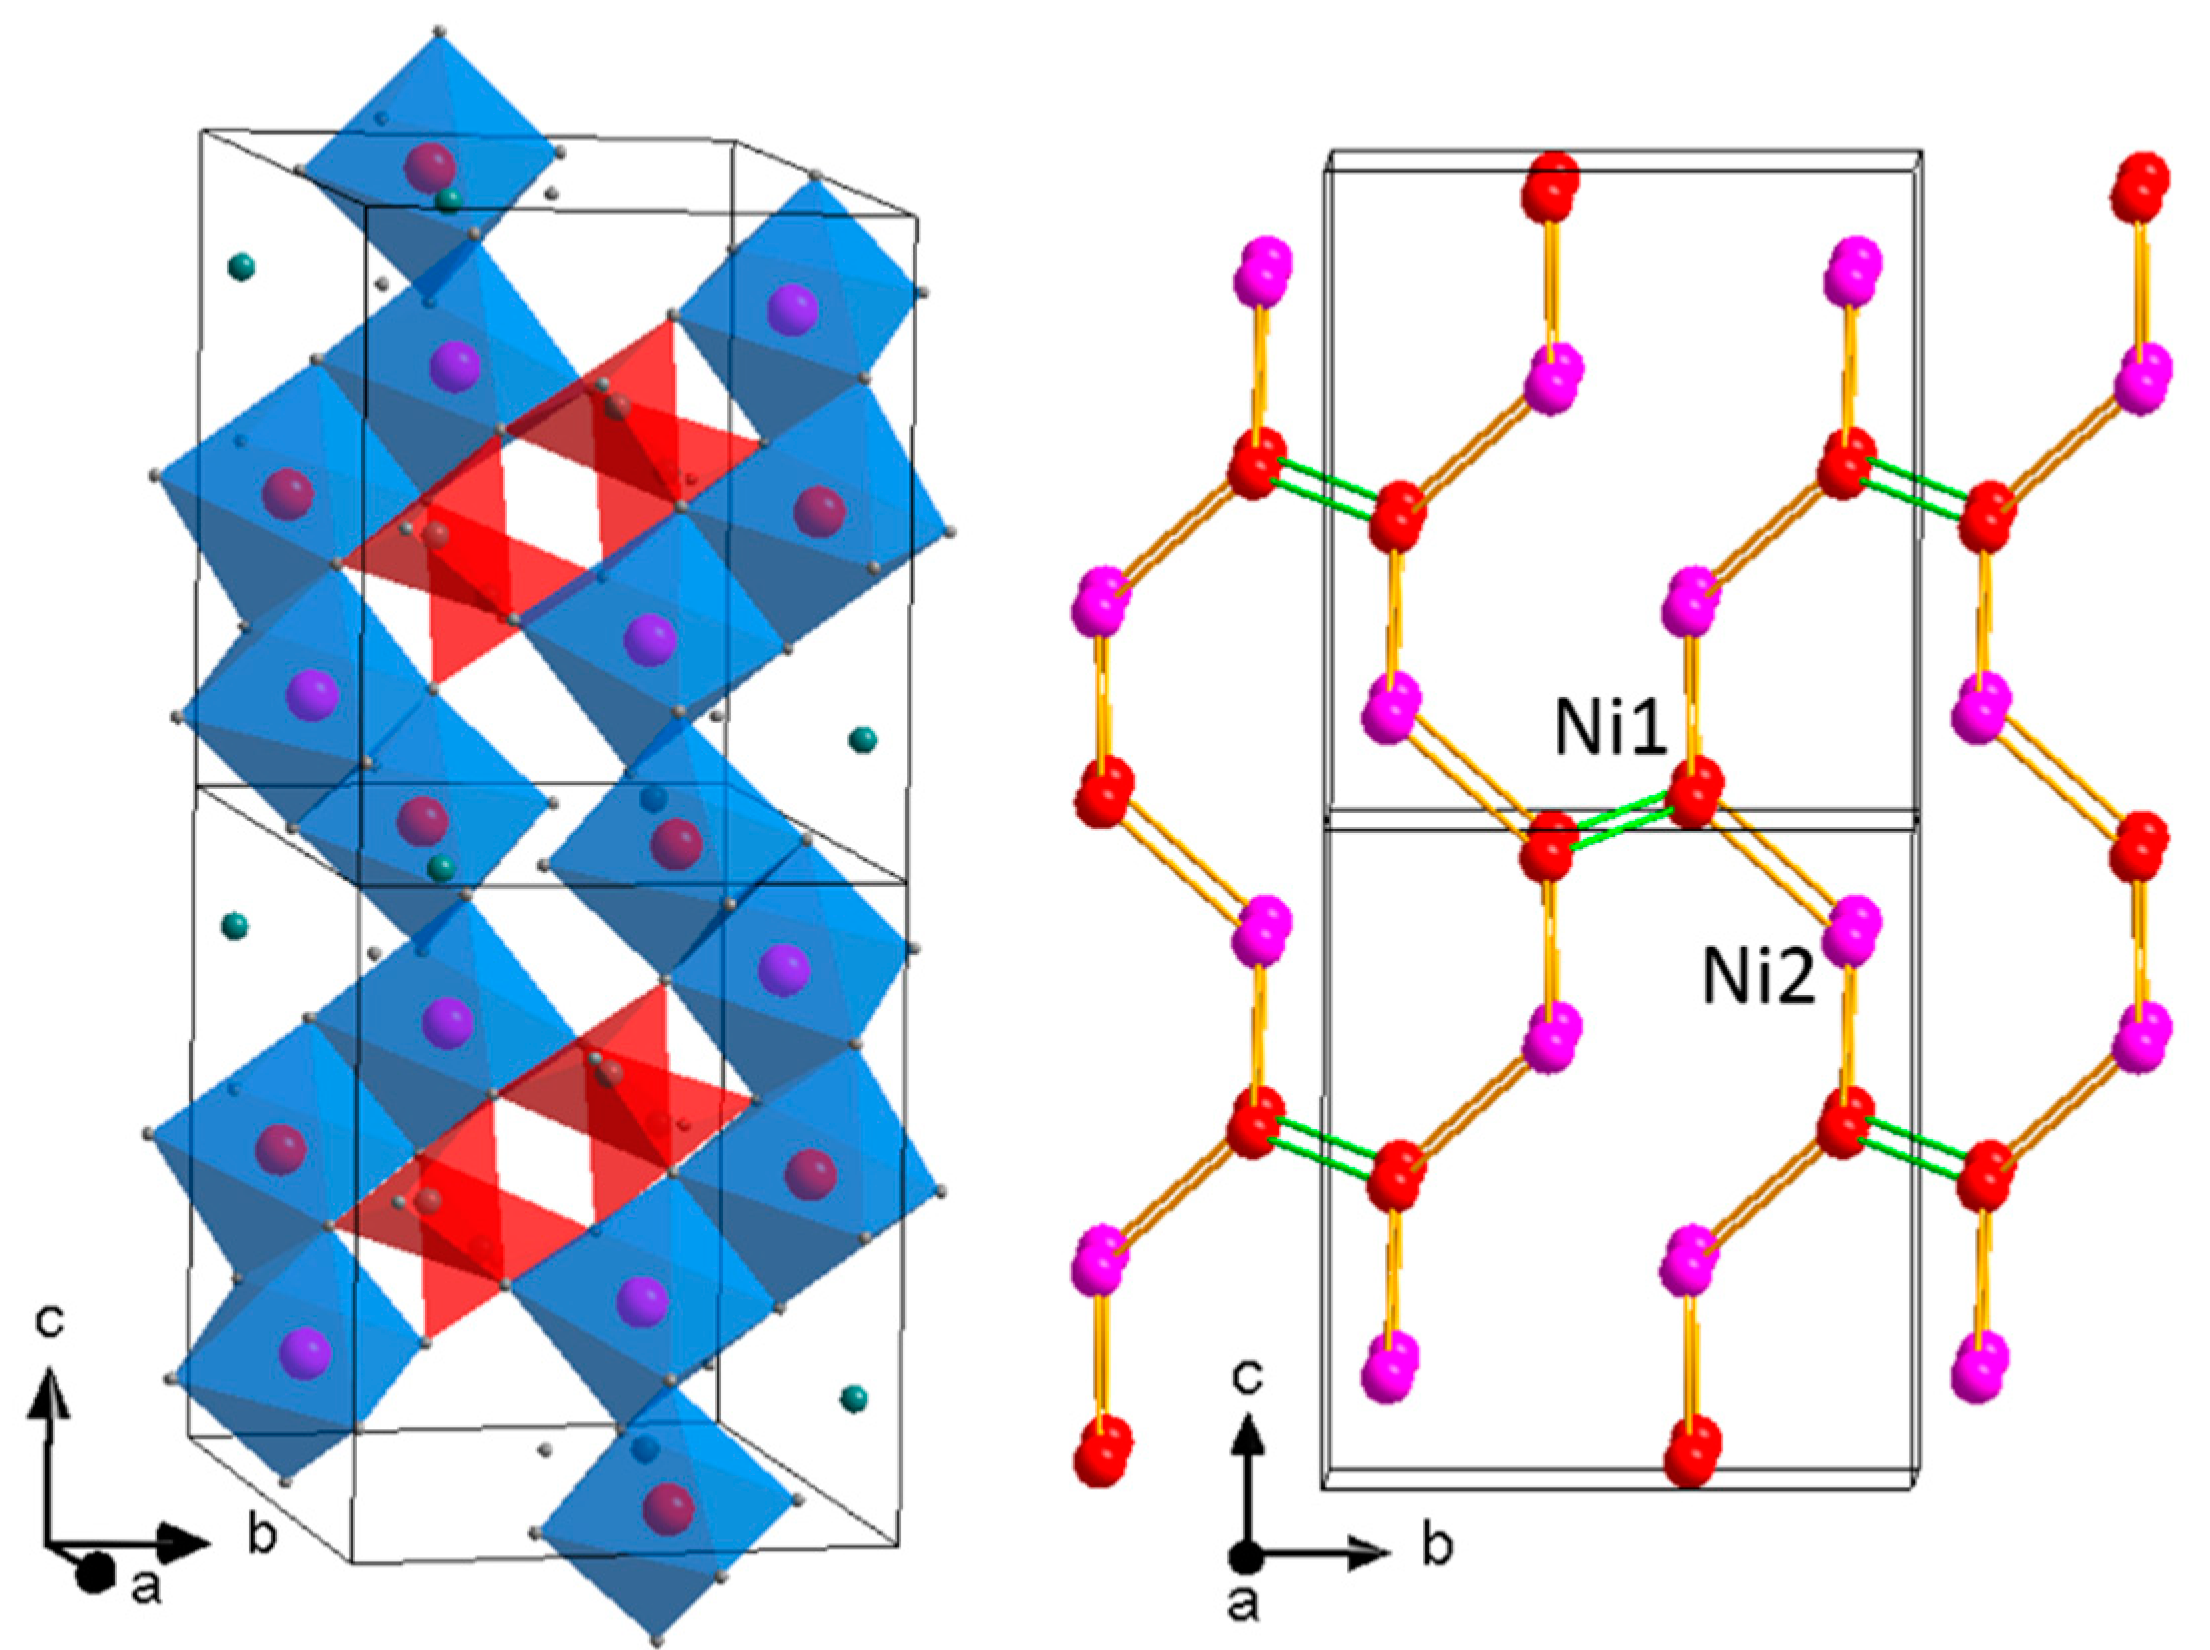
Appendix A. Crystal Structure and Chemical Composition Analysis

Single-crystal XRD analysis using the program SHELXL-2016 shows that Ni2V2O7 crystallizes in the monoclinic crystal system with space group P21/c (No. 14). The parameters a = 6.525(2)Å, b = 8.299(6)Å, c = 9.361(7)Å, β = 99.928(7)Å, V = 499.41(6) Å3, and Z = 4 are obtained at room temperature, in good agreement with previous reports [18,20]. The atomic positions of Ni2V2O7 are shown in Table A1, in accordance with a previous report [17]. The final R1 is 0.0283 (I > 2σ(I)) and wR2 is 0.0598 (all data), indicating the high quality of the single crystal. Figure A1 shows the energy-dispersive spectrum measured by Micro-XRF as well as a photograph of the single crystal. No impurities are detected. The average chemical composition is 51.14% and 48.86% for Ni and V, respectively. The Ni:V ratio is quite close to the nominal ratio of 2:2, again showing the high quality of our single crystal.
Figure A1. Energy-dispersive spectrum measured by Micro-XRF for a single crystal. The inset shows a photograph of the single crystal.
Crystals 09 00468 g0a1
Table A1. Atomic positions of Ni2V2O7 obtained from single-crystal XRD analysis.
Atomxyz
Ni10.146380.121210.46311
Ni20.305030.386770.67946
V10.361960.739790.53114
V20.194500.018730.81306
O10.602270.130730.12422
O20.426970.125170.39468
O30.168640.369270.45918
O40.256230.359370.18158
O50.680360.372870.34927
O60.028330.084230.24732
O70.854570.379530.00762

Appendix B. High-Field Magnetization Curves

Figure A2 shows the high-field magnetization curves at 2 K along the three crystallographic axes. Clearly, a field-induced spin-flop transition is observed at Hsf = 2.7 T for H//a and at 1.3 T for H//b, but not observed for H//c. As the magnetic field increases, a wide 1/2 magnetization plateau appears at Hc1 = 5.5, 8.0, and 7.1 T along the a, b, and c axes, respectively. The magnetization is unchanged until Hc2 = 30 T. Above Hc2, the magnetization starts to increase linearly up to 40 T, with an identical slope for all the three axes.
Figure A2. High-field M(H) curves at 2 K along the three crystallographic axes. The inset shows M(H) curves in the field of 0–12 T.
Crystals 09 00468 g0a2

References

  1. Narumi, Y.; Kindo, K.; Hagiwara, M.; Nakano, H.; Kawaguchi, A.; Okunishi, K.; Kohno, M. High-field magnetization of S = 1 antiferromagnetic bond-alternating chain compounds. Phys. Rev. B 2004, 69, 174405. [Google Scholar] [CrossRef]
  2. Ono, T.; Tanaka, H.; Aruga Katori, H.; Ishikawa, F.; Mitamura, H.; Goto, T. Magnetization plateau in the frustrated quantum spin system Cs2CuBr4. Phys. Rev. B 2003, 67, 104431. [Google Scholar] [CrossRef]
  3. Choi, K.Y.; Lemmens, S.; Do, P.; van Tol, J.; Shin, J.; Jeon, G.S.; Skourski, Y.; Rhyee, J.S.; Berger, H. Coexistence of localized and collective magnetism in the coupled-spin-tetrahedra system Cu4Te5O12Cl4. Phys. Rev. B 2014, 90, 184402. [Google Scholar] [CrossRef]
  4. Hase, M.; Matsumoto, M.; Matsuo, A.; Kindo, K. Magnetism of the antiferromagnetic spin-1/2 tetramer compound CuInVO5. Phys. Rev. B 2016, 94, 174421. [Google Scholar] [CrossRef]
  5. Gitgeatpong, M.; Suewattana, S.; Zhang, A.; Miyake, M.; Tokunaga, P.; Chanlert, N.; Kurita, H.; Tanaka, T.J.; Sato, Y.; Zhao, G.; et al. High-field magnetization and magnetic phase diagram of α-Cu2V2O7. Phys. Rev. B 2017, 95, 245119. [Google Scholar] [CrossRef]
  6. He, Z.Z.; Ueda, Y. Paramagnetic anisotropy and spin-flop transition in single crystals of the quasi-one-dimensional system β-Cu2V2O7. Phys. Rev. B 2008, 77, 052404. [Google Scholar] [CrossRef]
  7. Yin, L.; Ouyang, Z.W.; Wang, J.F.; Yue, X.Y.; Chen, R.; He, Z.Z.; Wang, Z.X.; Xia, Z.C.; Liu, Y. Anisotropic magnetization plateaus in Seff = 1/2 skew-chain single-crystal Co2V2O7. Phys. Rev. B 2019, 99, 134434. [Google Scholar] [CrossRef]
  8. Wang, L.; Werner, J.; Ottmann, A.; Weis, R.; Abdel-Hafiez, M.; Sannigrahi, J.; Majumdar, S.; Koo, C.; Klingeler, R. Magnetoelastic coupling and ferromagnetic-type in-gap spin excitations in multiferroic α-Cu2V2O7. New J. Phys. 2018, 20, 063045. [Google Scholar] [CrossRef]
  9. Zhang, J.T.; Wang, J.L.; Ji, C.; Guo, B.X.; Xia, W.S.; Lu, X.M.; Zhu, J.S. Magnetism and spin-driven ferroelectricity in the multiferroic material α-Cu2V2O7. Phys. Rev. B 2017, 96, 165132. [Google Scholar] [CrossRef]
  10. Ponomarenkoa, L.A.; Vasil’eva, A.N.; Antipovb, E.V.; Velikodnyb, Y.A. Magnetic properties of Cu2V2O7. Phys. B 2000, 1459, 284–288. [Google Scholar] [CrossRef]
  11. Pommer, J.; Kataev, V.; Choi, K.-Y.; Lemmens, P.; Ionescu, A.; Pashkevich, Y.; Freimuth, A.; Güntherodt, G. Interplay between structure and magnetism in the spin-chain compound (Cu,Zn)2V2O7. Phys. Rev. B 2003, 67, 214410. [Google Scholar] [CrossRef]
  12. Touaiher, M.; Rissouli, K.; Benkhouja, K.; Taibi, M.; Aride, J.; Boukhari, A.; Heulin, B. Crystal structures and magnetic properties of M2V2O7 (M = Co, Ni and Cu) compounds. Mater. Chem. Phys. 2004, 85, 41–46. [Google Scholar] [CrossRef]
  13. Parada, C.; Perles, J.; Sáez-Puche, R.; Ruiz-Valero, C.; Snejko, N. Crystal growth, structure, and magnetic properties of a new polymorph of Fe2P2O7. Chem. Mater. 2003, 15, 3347–3351. [Google Scholar] [CrossRef]
  14. Dojčilović, J.; Novaković, L.; Napijalo, M.M.; Napijalo, M.L. Structural phase transitions in Co (II) and Ni (II) diphosphates in the temperature range 290–1000 K. Mater. Chem. Phys. 1994, 39, 76–79. [Google Scholar] [CrossRef]
  15. Weil, M.; Lengauer, C.; Füglein, E.; Baran, E.J. The reversible α→β phase transition of Cu2As2O7. Cryst. Growth Des. 2004, 4, 1229–1235. [Google Scholar] [CrossRef]
  16. Liao, J.H.; Leroux, F.; Piffard, Y.; Guyomard, D.; Payen, C. Synthesis, structures, magnetic properties, and phase transition of manganese (II) divanadate: Mn2V2O7. J. Solid State Chem. 1996, 121, 214–224. [Google Scholar] [CrossRef]
  17. Sauerbrei, E.E.; Faggiani, F.; Calvo, C. Cobalt Vanadate, Co2V2O7, and Nickel Vanadate, Ni2V2O7. Acta Crystallogr. Sect. B 1974, 30, 2907–2909. [Google Scholar] [CrossRef]
  18. He, Z.; Yamaura, J.I.; Ueda, Y.; Cheng, W.D. Crystal growth and multiple magnetic transitions of the spin-1 chain system Ni2V2O7. Phys. Rev. B 2009, 79, 092404. [Google Scholar] [CrossRef]
  19. Sun, Y.C.; Ouyang, Z.W.; Wang, J.F.; Wang, Z.X.; Xia, Z.C.; Rao, G.H. Breaking of 1D magnetism in a spin-1 chain antiferromagnet Ni2V2O7: ESR and first-principles studies. Eur. Phys. J. Plus 2016, 131, 343. [Google Scholar] [CrossRef]
  20. Ouyang, Z.W.; Sun, Y.C.; Wang, J.F.; Yue, X.Y.; Chen, R.; Wang, Z.X.; He, Z.Z.; Xia, Z.C.; Liu, Y.; Rao, G.H. Novel half-magnetization plateau and nematiclike transition in the S = 1 skew chain Ni2V2O7. Phys. Rev. B 2018, 97, 144406. [Google Scholar] [CrossRef]
  21. Chen, R.; Wang, J.F.; Ouyang, Z.W.; He, Z.Z.; Wang, S.M.; Lin, L.; Liu, J.M.; Lu, C.L.; Liu, Y.; Dong, C.; et al. Magnetic field induced ferroelectricity and half magnetization plateau in polycrystalline R2V2O7 (R = Ni, Co). Phys. Rev. B 2018, 98, 184404. [Google Scholar] [CrossRef]
  22. Arango, Y.C.; Vavilova, E.; Abdel-Hafiez, M.; Janson, O.; Tsirlin, A.A.; Rosner, H.; Drechsler, S.-L.; Weil, M.; Nénert, G.; Klingeler, R.; et al. Magnetic properties of the low-dimensional spin-1/2 magnet α-Cu2As2O7. Phys. Rev. B 2011, 84, 134430. [Google Scholar] [CrossRef]
  23. Susuki, T.; Kurita, N.; Tanaka, T.; Nojiri, H.; Matsuo, A.; Kindo, K.; Tanaka, H. Magnetization Process and Collective Excitations in the S = 1/2 Triangular-Lattice Heisenberg Antiferromagnet Ba3CoSb2O9. Phys. Rev. Lett. 2013, 110, 267201. [Google Scholar] [CrossRef] [PubMed]
  24. Glazkov, V.N.; Smirnov, A.I.; Revcolevschi, A.; Dhalenne, G. Magnetic resonance study of the spin-reorientation transitions in the quasi-one-dimensional antiferromagnet BaCu2Si2O7. Phys. Rev. B 2005, 72, 104401. [Google Scholar] [CrossRef]
  25. Kimura, S.; Ohta, H.; Mitsudo, S.; Motokawa, M.; Jang, W.J.; Hasegawa, M.; Takei, H. Submillimetre-wave electron spin-resonance measurements for single-crystal Y2Cu2O5. J. Phys. Condens. Matter 1996, 8, 546. [Google Scholar] [CrossRef]
Figure 1. (Left) Crystallographic structure of Ni2V2O7 (red, Ni1; pink, Ni2; green, V; gray, O). The different Ni‒O octahedra (blue) are isolated by V‒O tetrahedrons (red). (Right) The bonds with different colors present three possible interactions.
Crystals 09 00468 g001
Figure 2. Temperature-dependent ESR spectra measured at 70 GHz (a) and 170 GHz (b) along the easy a axis.
Crystals 09 00468 g002
Figure 3. (a) Frequency-dependent ESR spectra measured at 2 K for the easy a axis. (b) Frequency‒field (fH) relationship at 2 K as well as the EPR line. The solid lines are guides for the eyes.
Crystals 09 00468 g003
Figure 4. Temperature-dependent ESR spectra measured at 170 GHz along the easy b axis.
Crystals 09 00468 g004
Figure 5. (a) Frequency-dependent ESR spectra measured at 2 K for the easy b axis. (b) Frequency‒field (fH) relationship at 2 K as well as the EPR line. The solid lines are guides for the eyes.
Crystals 09 00468 g005
Figure 6. Temperature-dependent ESR spectra measured at 70 GHz (a) and 170 GHz (b) along the hard c axis.
Crystals 09 00468 g006
Figure 7. (a) Frequency-dependent ESR spectra measured at 2 K for the hard c axis. (b) Frequency‒field (fH) relationship at 2 K as well as the EPR line. The solid line is a guide for the eyes.
Crystals 09 00468 g007

