Article

Low-Temperature Polymorphic Transformation of β-Lactam Antibiotics

1
National Key Laboratory of Science and Technology on Micro/Nano Fabrication, Department of Micro/Nano-electronics, Shanghai Jiao Tong University, Shanghai 200240, China
2
Shanghai Engineering Research Center of Molecular Therapeutics and New Drug Development, School of Chemistry and Molecular Engineering, East China Normal University, Shanghai 200062, China
3
Key Laboratory of Functional Molecular Solids, Ministry of Education, Anhui Laboratory of Molecule-Based Materials, College of Chemistry and Materials Science, Anhui Normal University, Wuhu, Anhui 241000, China
4
NYU-ECNU Center for Computational Chemistry at NYU Shanghai, Shanghai 200062, China
*
Authors to whom correspondence should be addressed.
Crystals 2019, 9(9), 460; https://doi.org/10.3390/cryst9090460
Submission received: 2 August 2019 / Revised: 26 August 2019 / Accepted: 31 August 2019 / Published: 2 September 2019
(This article belongs to the Special Issue Crystallography of Structural Phase Transformations)

Abstract

:
Polymorphic screening and transformation of molecular crystals are presently popular research areas in pharmaceutical studies. In this study, we developed an ab initio method to examine the structures, spectra, and stabilities of β-lactam (trans-13-azabicyclo[10.2.0]tetradecan-14-one), an important component of antibiotics. Based on the density functional theory (DFT) and second-order Møller-Plesset perturbation (MP2) methods, the present work demonstrated that forms I and II have isomorphic structures but can be distinguished by their Gibbs free energies and vibrational spectra. Forms I and II show a low-temperature polymorphic transformation at 308 K, where form I is stable below 308 K and form II is stable above 308 K. The proposed method suggests that the theoretical calculation can be used as a tool to effectively distinguish the isomorphic structures, and temperature-induced polymorphic transformation has far-reaching significance for drug storage and design.

1. Introduction

With the continuous improvement of drug design technology, research on the crystal structure of pharmaceutical molecules has become increasingly important. [1,2,3]. Modern industrial manufacturers place great importance on drug storage and transportation to avoid the structural changes and polymorphic transformations caused by external environments, using tailored operating conditions. A detailed understanding of temperature-induced polymorphic transformation for pharmaceutical molecules, therefore, is vital for researchers in pharmacy and crystallization to respond to and realize this objective. Various methods have been proposed to predict crystal structures, and the most commonly used is crystal structure prediction (CSP) [4,5,6,7]. CSP is generally used for screening crystal structures and predicting the most stable structure, and there have been many important discoveries in the fields of computational materials discovery, drug design, high-pressure chemistry, and mineralogy of the earth’s and planetary interiors. CSP provides greater potential for rational crystal design, but it is difficult to distinguish polymorphic structures according to their tiny differences in energy and spatial distribution. In this context, an advanced model that can distinguish polymorphs and predict their temperature-induced polymorphic transformation could eliminate this barrier to entry and promote widespread adoption to advance drug storage technology into the next generation [8,9].
In the present study, we applied an ab initio method to study an isostructural β-lactam (trans-13-azabicyclo[10.2.0]tetradecan-14-one) which has been commercially used as antibiotics in the most commonly used penicillin and cephalosporin until 2003 [10]. β-lactams are a class of antibiotics consisting of all antibiotic agents that contain a β-lactam ring in their molecular structures, which have the advantages of strong bactericidal activity, low toxicity, wide indications, and good clinical efficacy. β-lactams were demonstrated to have three polymorphs (forms I–III) by Fábián et al. [4]. Forms I and II have ordered structures, while form III has a disordered structure and has not been determined in laboratory. Form I is crystallized from methanol, whereas the twinned crystals of form II grow from acetone [11]. Figure 1 shows the chemical structure of β-lactams. As reported by Fábián et al., the difference of forms I and II lies in the topographical orientation of a given NH…O hydrogen bond [11]. Therefore, the structural difference of forms I and II is very small, as they can only be distinguished by the orientation of a given hydrogen bond with respect to the β-lactam bond. In this study, based on the density functional theory (DFT) and second-order Møller–Plesset perturbation (MP2) methods, we used the Gibbs free energy rather than the lattice energy to consider the entropy and temperature effects of β-lactams, which can be used to compare the stability of forms I and II via their energy difference [7]. MP2 is capable of describing covalent, ionic, hydrogen bond, and dispersion interactions, which makes the structure and stability prediction more accurate than the classical force field method and DFT. The crystal structure optimizations were calculated at the DFT level using ωB97XD/6-31G* [12], while the single-point energy of enthalpy was calculated at the MP2 level on the optimized crystal structure. The implementation of the MP2 calculation was to improve the calculation accuracy and make the results closer to reality. By comparing the Gibbs free energy and Raman spectra, forms I and II can be distinguished via the theoretical calculations, and a low-temperature polymorphic transformation is predicted to occur from form I to form II at 308 K. The discovery of this low-temperature polymorphic transformation will greatly enhance our understanding of the preparation of β-lactam polymorphs.

2. Methods

Gibbs Free Energy Calculation

The study of the properties of molecules by first principles [13] has always been a major goal in the field of theoretical and computational chemistry. Due to the limitation of calculation accuracy and resources, it is difficult to perform conventional quantum mechanical (QM) calculations such as DFT on macromolecular systems. Therefore, researchers have devoted considerable effort to develop various linear scaling QM methods, so that accurate quantum chemical methods can be applied to macromolecular systems. In recent years, fragment-based quantum chemical methods have become increasingly popular as an effective and reliable means of studying macromolecular systems. The fragment-based QM method is based on the locality of physical and chemical properties of macromolecules, which are mainly affected by the local chemical environment of macromolecules, while the remote part has a weaker effect on the local region of interest. Therefore, one can divide a macromolecular system into a series of molecular fragments according to a certain criterion [14,15]. Based on the embedded fragment QM method [16,17,18,19,20,21], the internal energy of a unit cell ( E e ) can be calculated by Equation (1):
E e = i E i 0 + i , j , i < j R i j λ E i 0 j 0 E i 0 E j 0 + 1 2 N = S S 1 δ n 0 i , j R i j λ E i 0 j n E i 0 E j n + E LR
where n is the three-integer index of a unit cell; λ is the distance threshold, and the distance between molecule i and molecule j is R i j ; and E i 0 j n is the energy of the dimer for the ith molecule in the central unit cell and the jth molecular in the nth unit cell. The first term of Equation (1) calculates the energy of all the monomers in the central unit cell. The second term calculates the two-body QM interactions within the distance threshold λ in the central unit cell. The third term gives the QM interactions between two molecules, with one in the central unit cell and the other in the nth unit cell, that have a shorter distance than the cutoff distance λ . λ was set to 4 Å in this work [14,18]. Those three terms calculate the short-range QM interactions. In this study, the calculation was first carried out at the DFT level using ωB97XD/6-31G* [12]. Considering the long-range interaction of the dimer, the distance of which between two molecules is larger than λ , charge–charge Coulomb interactions were calculated. We took the background charges in the 11 × 11 × 11 supercell into account. The last term ( E LR ) gives the long-range electrostatic interactions in the 41 × 41 × 41 supercell.
The enthalpy ( H e ) per unit cell can be calculated by Equation (2):
H e = E e + P V
where P is the external pressure and V is the unit cell volume. For geometry optimization, 0.001 Hartree/Bohr was set as the convergence criterion for the maximum atomic force.
The Gibbs free energy ( G e ) of a unit cell is calculated by Equation (3):
G e = H e + U v T S v
where T is the temperature, U v and S v are the zero-point vibrational energy and entropy per unit cell, respectively. For molecular crystals, the zero-point energy (ZPE) U v (including the internal thermal energy resulting from molecular vibrations) and the entropy S v are obtained by Equations (4) and (5) with harmonic approximation:
U v = 1 K n k ω n k 1 2 + 1 e β ω n k 1
S v = 1 β T K n k β ω n k e β ω n k 1 ln 1 e β ω n k
where k is the wave vector, k 0 is the Boltzmann constant, β = 1 / k 0 T , and the phonon frequency in the nth phonon branch is denoted as ω n k . Here, the k-grid we used was 21 × 21 × 21 (K = 9261).
Firstly, the crystal structure optimization was calculated at the DFT level using ωB97XD/6-31G*. Then, we calculated the single-point energy of enthalpy at the MP2/6-31G* level on the optimized crystal structure. Therefore, the calculations of H e were performed at the MP2/6-31G* level on the ωB97XD/6-31G*-optimized crystal structure, while the U v (ZPEs) and S v (entropies) were calculated at the DFT level using ωB97XD/6-31G*.

3. Results and Discussion

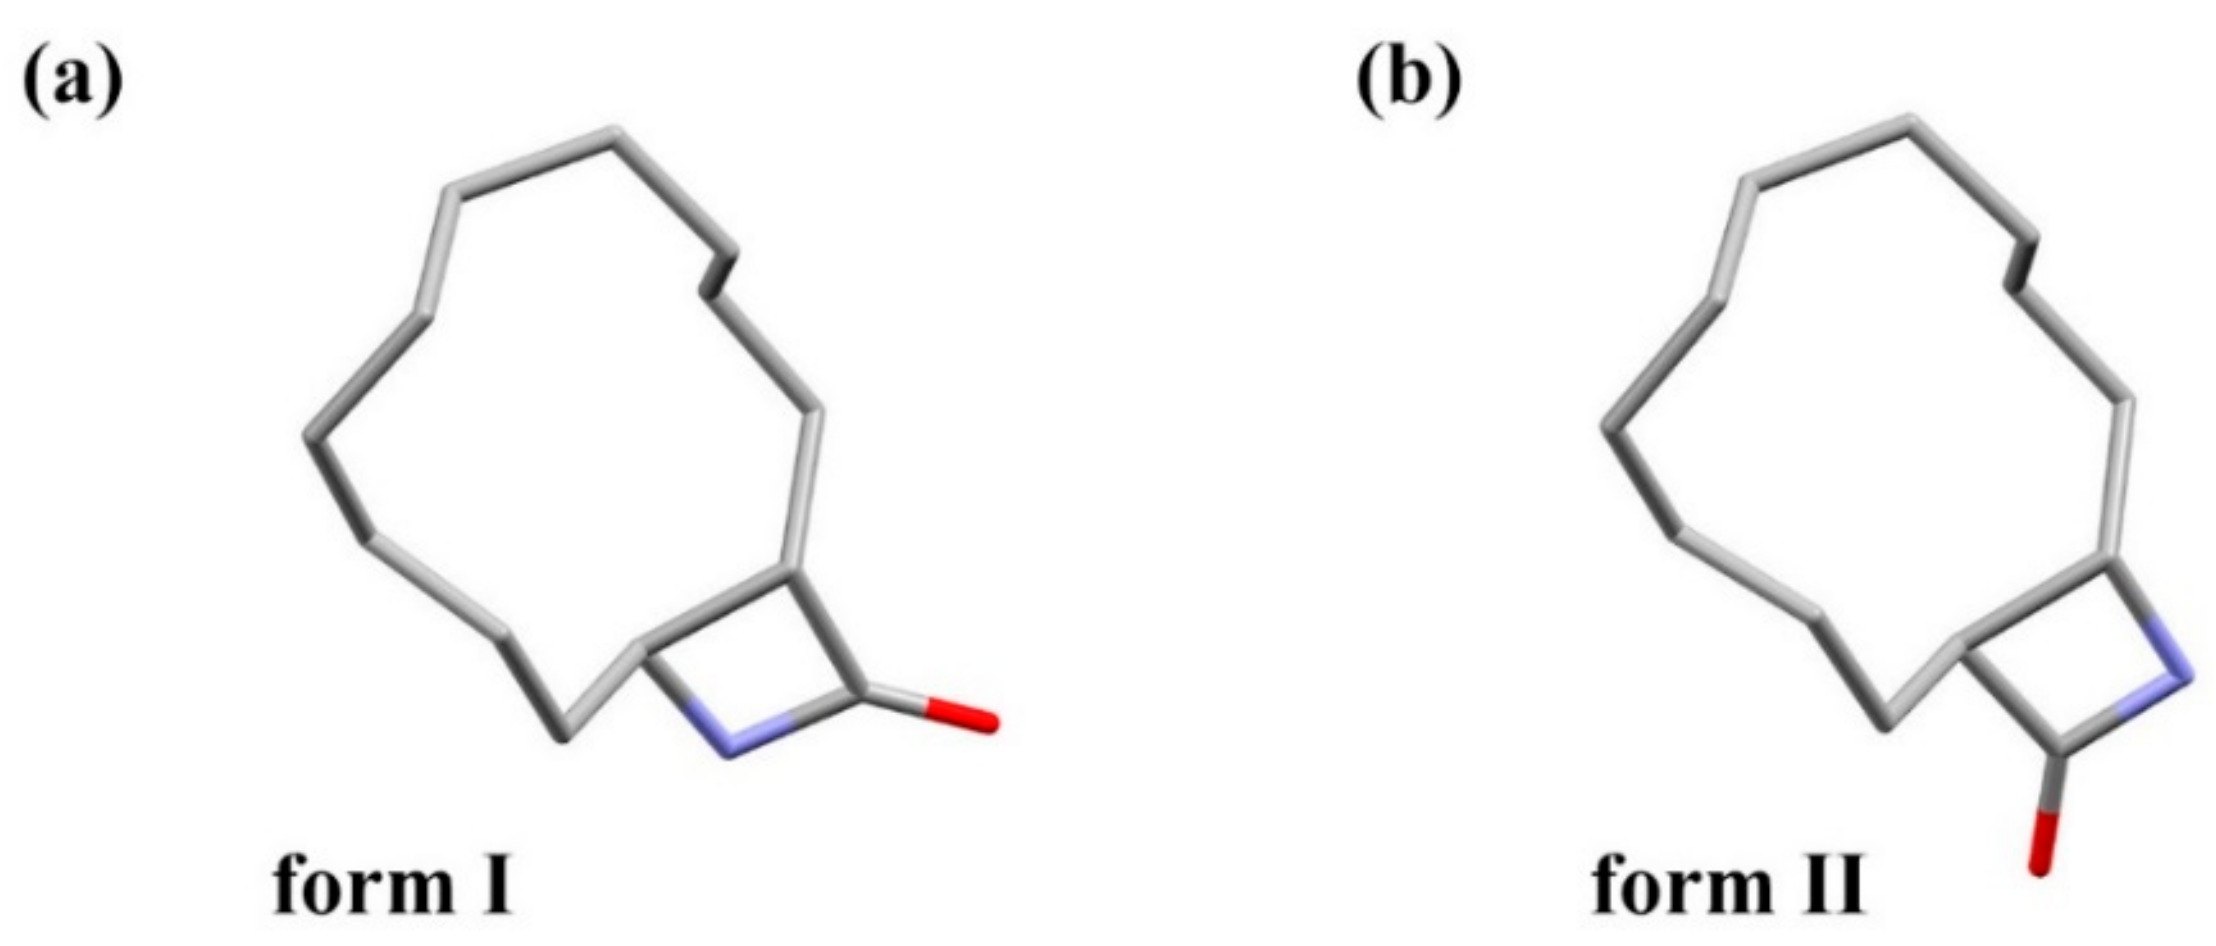
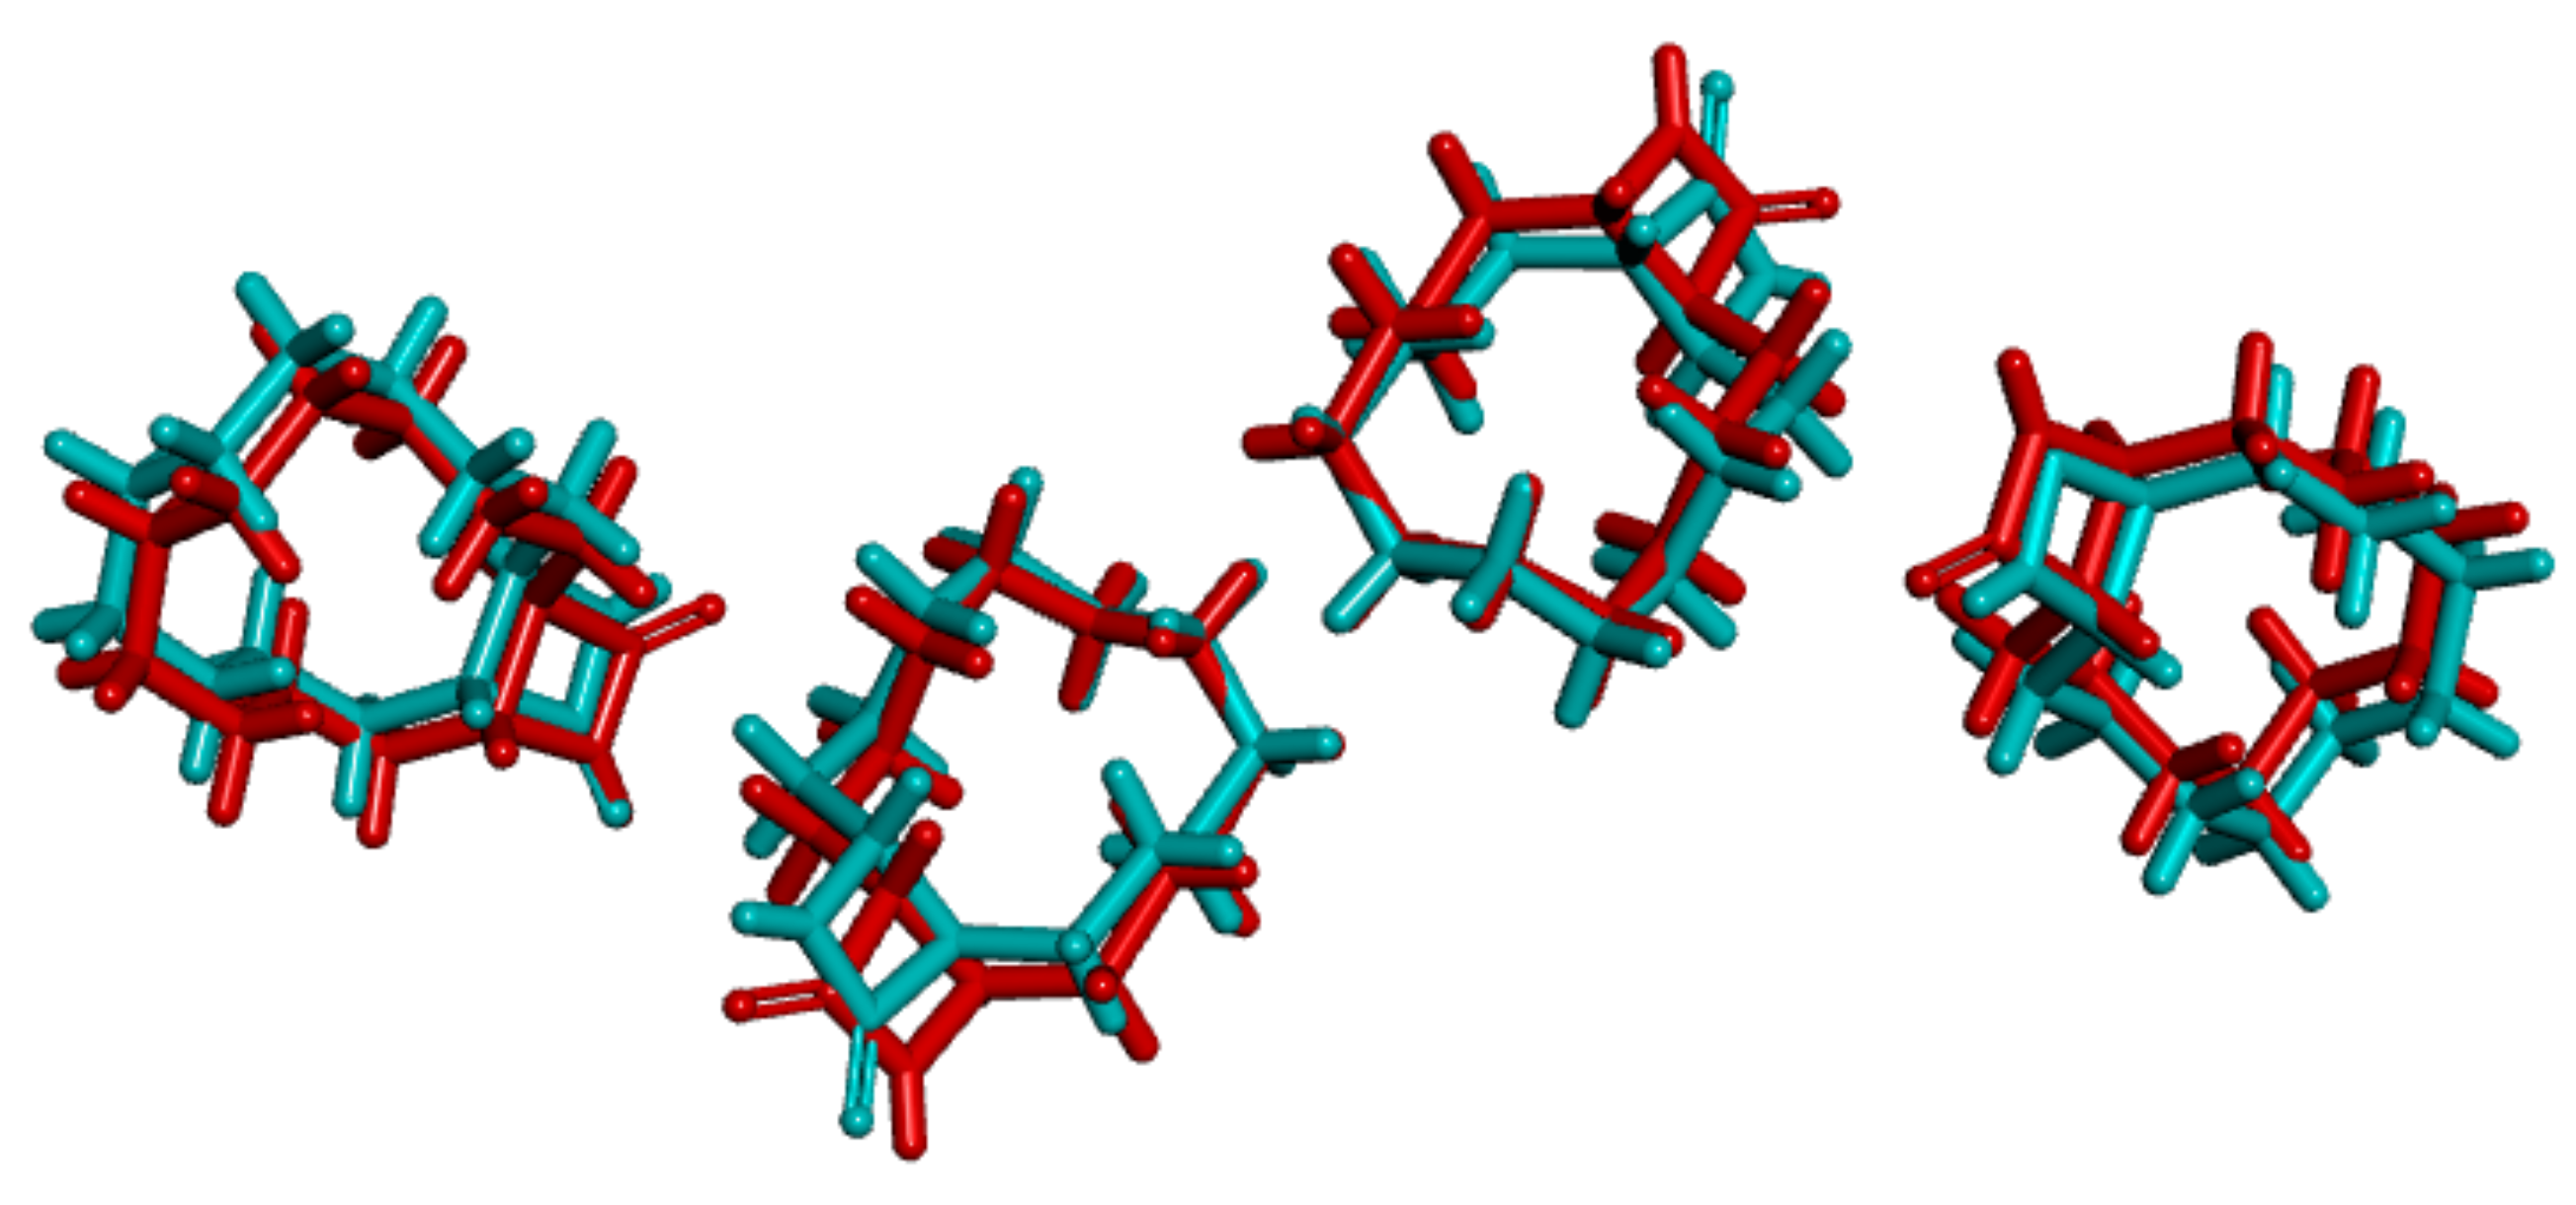
3.1. Crystal Structure Comparison between Forms I and II

Table 1 shows the observed lattice parameters between forms I and II, which were taken from the work by László et al. [11] (CCDC entry: 241104–241105). As shown in Table 1, the lattice parameters of these two forms are very similar to the space group of both P21/c, and the b axis is considerably longer in I (7.629 Å) than in II (7.267 Å).
Figure 2 shows the molecular overlay of forms I and II, where the red and blue molecules represent the forms I and II, respectively. Root-mean-square deviation (RMSD) is a commonly used approach to measure the structural differences between molecular crystals. In general, the smaller the RMSD, the higher the similarity of two structures. From Figure 2, the overlay of the two forms has a slight offset, with an RMSD of 3.7891 Å.
Table 2 shows a comparison of the observed and calculated lattice constants between forms I and II, where we can find that the optimized lattice constants in the present paper are in good agreement with the experimental results. For example, for lattice constants a and b, the deviation between calculation and observation of forms I and II is about 0.2 Å, while for lattice constant c, the deviation between calculation and observation is 0.287 Å for form II and 0.282 Å for form I.

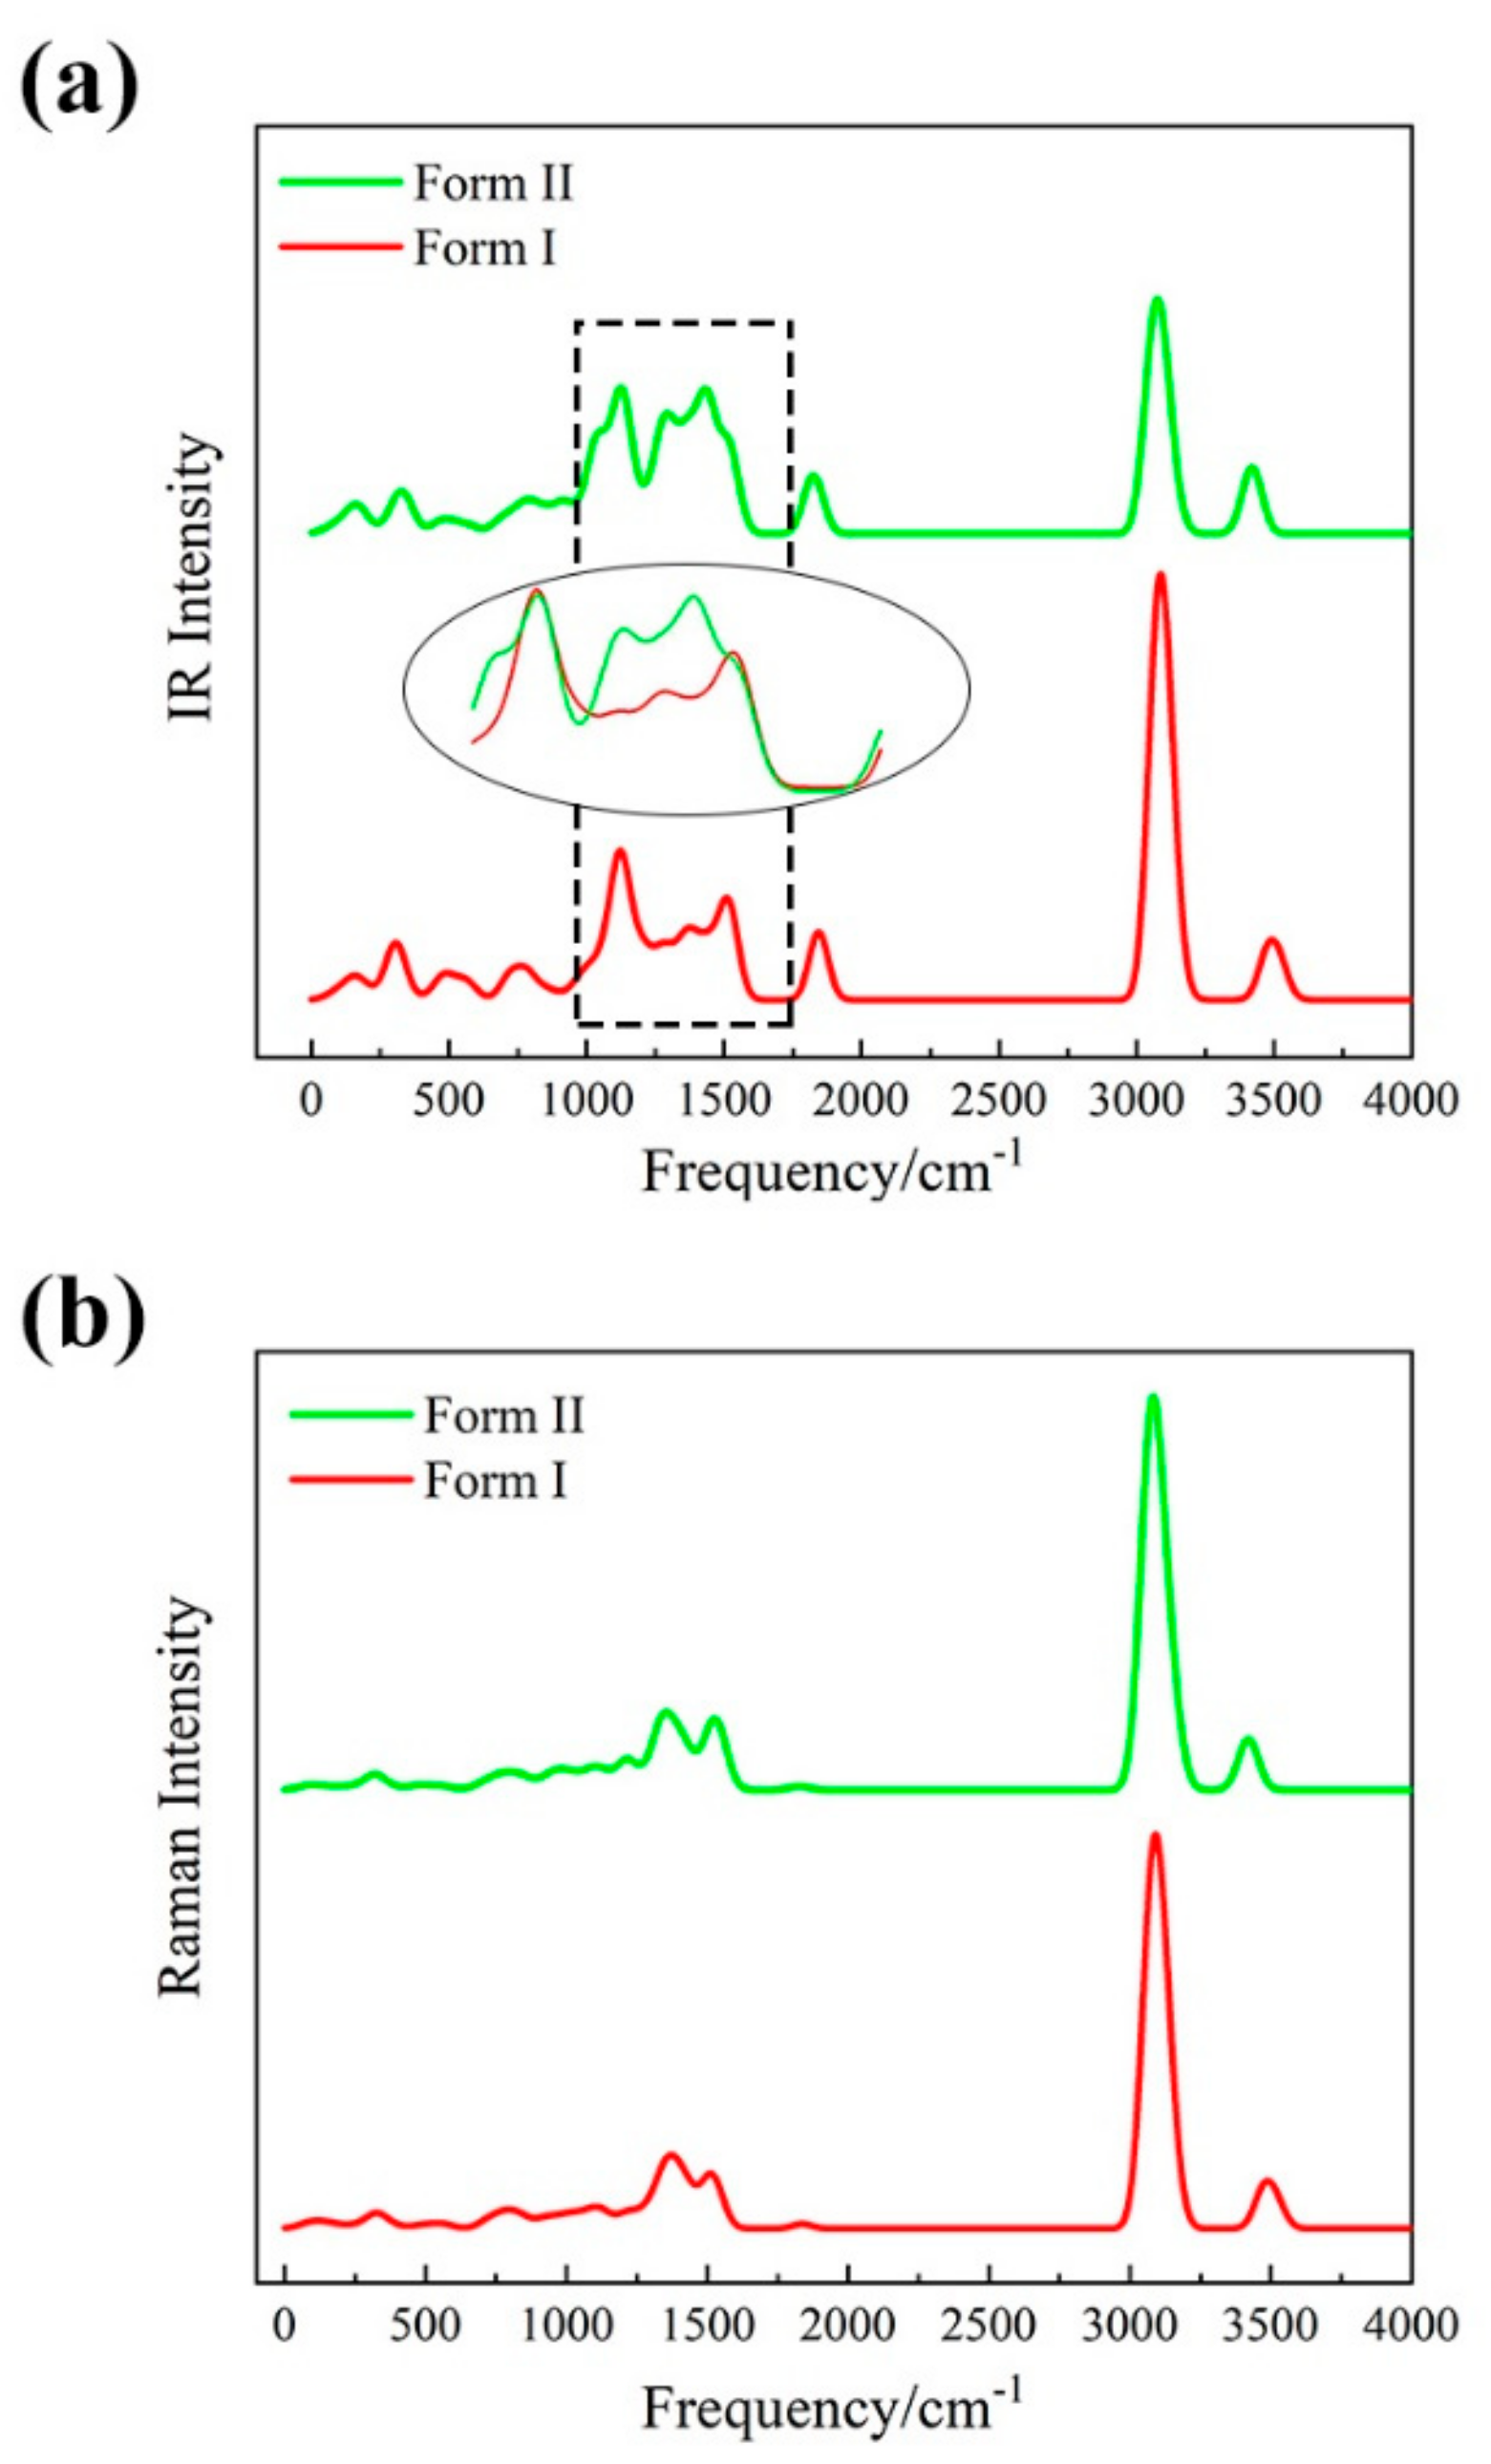
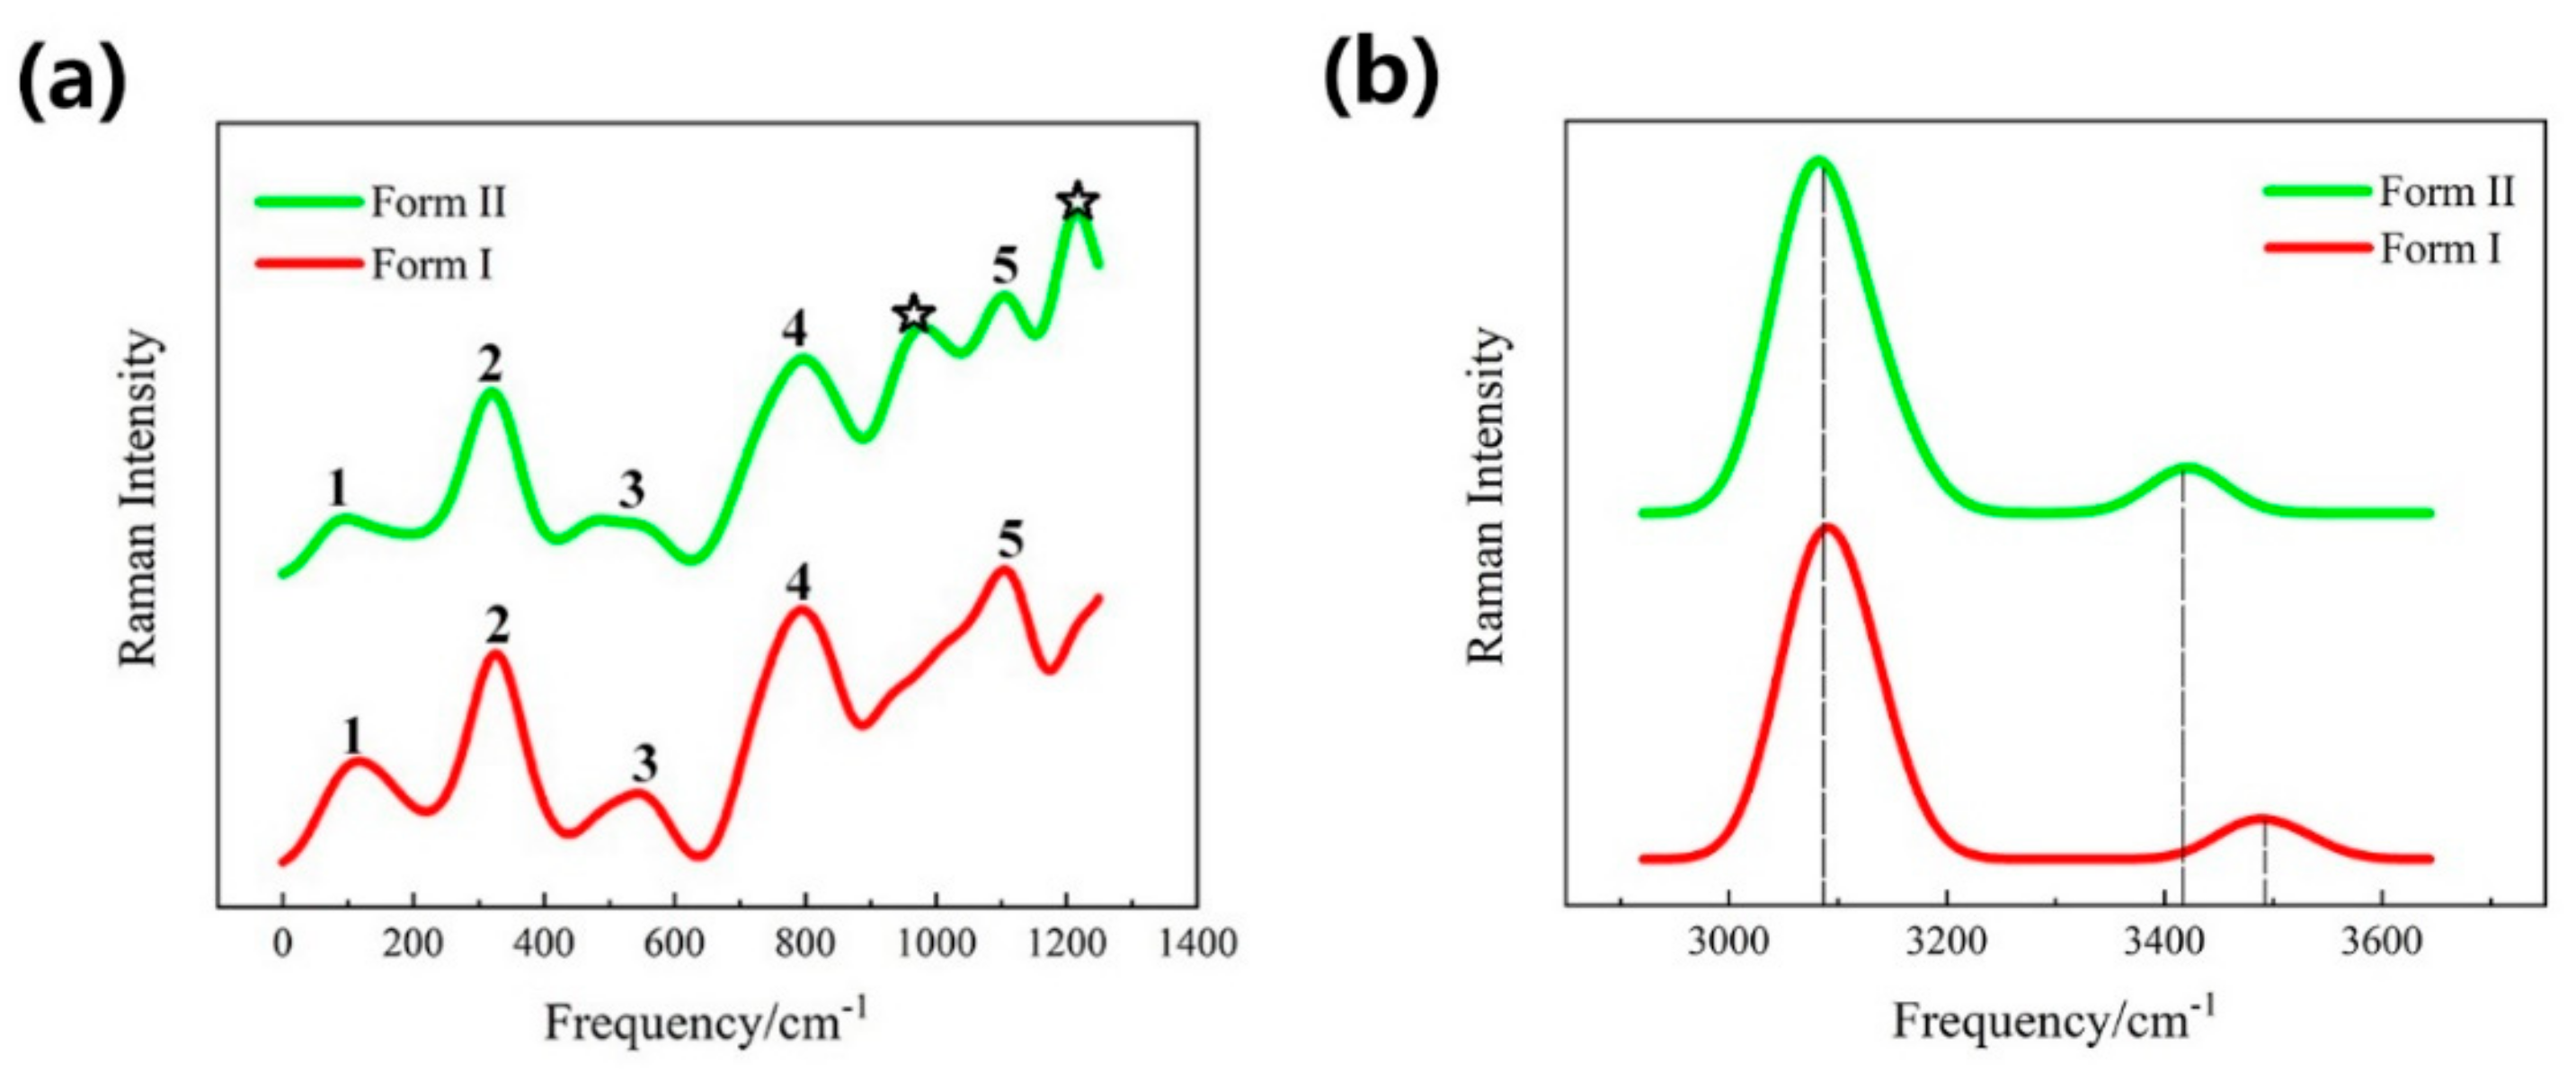
3.2. Vibrational Spectra

The vibrational spectrum is an effective method for distinguishing the crystal structures of different molecules based on the positions of the characteristic peaks [20,21,22]. Figure 3 displays the calculated IR and Raman frequency of β-lactam forms I and II from 0 to 4000 cm−1. The half-width at half-maximum (HWHM) used for the Lorentz broadenings of the spectra lines was set to 40 cm−1. Forms I and II show similar IR and Raman spectra, but the spectral difference can be found if we take part of the frequency region and analyze it carefully. In Figure 3a, the area highlighted by the dotted line is the characteristic peak area on which we focused. In order to distinguish the IR spectra difference between forms I and II in this region, we overlay the two spectra, as shown in the oval of the figure. Obviously, there are clear differences between these two forms. Because the Raman spectra of these two forms in Figure 3b are a bit difficult to distinguish, we divide them into low- and high-frequency regions, respectively, as shown in Figure 4. Figure 4 shows the calculated Raman spectra of β-lactam forms I and II at low-frequency (a) and high-frequency (b) regions, respectively. The red and green curves represent forms I and II, respectively. The calculations were performed at the DFT level using ωB97XD/ 6-31G*. In Figure 4b, the numbers of Raman peaks for the two forms are the same in the high-frequency region, with the first peak appearing around 3090 cm−1, and the second peak of form II has a red shift compared with form I. However, the numbers of Raman peaks are different in the low-frequency region (Figure 4a), with five and seven Raman peaks for forms I and II, respectively. In Figure 4a, two Raman peaks (labeled as star signs) absent in form I can be identified as the characteristic peaks for form II, which can be used to distinguish β-lactam forms II and I. By comparing the difference in the number and position of the characteristic peaks of forms I and II, we could determine that they are different crystal forms. If the two are the same crystal form, the Raman spectrum will be the same, but this is not the case. The spectra can reflect the structural features very well.

3.3. The Calculation of Gibbs Free Energy Difference

Figure 5 shows the calculated Gibbs free energy difference between forms I and II (form I minus form II). During the calculation, the single-point energy of enthalpy was performed at the MP2/6-31G* level on the ωB97XD/6-31G*-optimized crystal structure, while the U v (ZPEs) and S v (entropies) were calculated at the DFT level using ωB97XD/6-31G*. As shown in Figure 5, the Gibbs free energy of form I is higher than that of form II below 308 K and lower than II above 308 K. Therefore, 308 K is the polymorphic transformation point for β-lactam forms I and II, and form II will transform into form I at 308 K. Presently, no such transition of β-lactam has been observed either theoretically or experimentally, and we hope that our work will be instructive for future experiments.

4. Conclusions

In this work, we accurately reproduced the lattice parameters and obtained Raman spectra of β-lactam forms I and II by the embedded fragment-based QM method. We used DFT and MP2 theories to study the structures of different forms of β-lactam antibiotics and accurately calculated their Gibbs free energy. By comparing the calculated Gibbs free energy differences and the characteristic peak positions of the Raman spectra of the two molecular crystal structures, the two forms of β-lactam can be distinguished and undergo a low-temperature polymorphic transformation at 308 K. We hope that the proposed temperature-induced polymorphic transformation of β-lactam antibiotics can be verified in laboratory, which will be beneficial for drug design and storage and provide a new platform for the development of new pharmaceutical molecules.

Author Contributions

Conceptualization, J.L. (Jinjin Li); formal analysis, H.L.; investigation, J.L. (Jinyun Liu); methodology, X.H. and J.L. (Jinjin Li); project administration, H.L., X.H. and J.L. (Jinjin Li); software, X.H.; supervision, J.L. (Jinyun Liu), X.H. and J.L. (Jinjin Li); validation, J.L. (Jinyun Liu); writing-original draft, H.L.; writing-review & editing, X.H. and J.L. (Jinjin Li).

Funding

The authors are grateful for the financial support provided by the National Natural Science Foundation of China (Nos. 51672176, 21901157, 21922301, 21673074, and 21761132022), the Intergovernmental International Scientific and Technological Cooperation of Shanghai (No. 17520710200), the National Key R&D Program of China (No. 2016YFA0501700), the Shanghai Municipal Natural Science Foundation (No. 18ZR1412600), the Science and Technology Major Project of Anhui Province (18030901093), Key Research and Development Program of Wuhu (2019YF07), Foundation of Anhui Laboratory of Molecule-Based Materials (FZJ19014), the Young Top-Notch Talent Support Program of Shanghai, and the NYU-ECNU Center for Computational Chemistry at NYU Shanghai. We also thank the Supercomputer Center of East China Normal University (ECNU Multifunctional Platform for Innovation 001) for providing us computational time.

Conflicts of Interest

The authors declare no conflict of interest.

References

  1. Ryan, K.; Lengyel, J.; Shatruk, M. Crystal structure prediction via deep learning. J. Am. Chem. Soc. 2018, 140, 10158–10168. [Google Scholar] [CrossRef] [PubMed]
  2. Neumann, M.A.; van de Streek, J.; Fabbiani, F.P.A.; Hidber, P.; Grassmann, O. Combined crystal structure prediction and high-pressure crystallization in rational pharmaceutical polymorph screening. Nat. Commun. 2015, 6, 7793. [Google Scholar] [CrossRef] [PubMed] [Green Version]
  3. Woodley, S.M.; Catlow, R. Crystal structure prediction from first principles. Nat. Mater. 2008, 7, 937–946. [Google Scholar] [CrossRef] [PubMed]
  4. Price, S.L. The computational prediction of pharmaceutical crystal structures and polymorphism. Adv. Drug Deliv. Rev. 2004, 56, 301–319. [Google Scholar] [CrossRef] [PubMed]
  5. Braga, D.; Grepioni, F.; Maini, L. The growing world of crystal forms. Chem. Commun. 2010, 46, 6232–6242. [Google Scholar] [CrossRef]
  6. Verwer, P.; Leusen, F.J.J. Computer simulation to predict possible crystal polymorphs. Rev. Comput. Chem. 1998, 12, 327–365. [Google Scholar]
  7. Luo, H.Y.; Hao, X.; Gong, Y.Q.; Zhou, J.H.; He, X.; Li, J.J. Rational crystal polymorph design of olanzapine. Cryst. Growth Des. 2019, 19, 2388–2395. [Google Scholar] [CrossRef]
  8. Fábián, L.; Kálmán, A. Volumetric measure of isostructurality. Acta. Cryst. 2010, B55, 1099–1108. [Google Scholar] [CrossRef]
  9. László, F.; Alajos, K. Isostructurality in one and two dimensions: Isostructurality of polymorphs. Acta. Cryst. 2004, B60, 547–558. [Google Scholar]
  10. Elander, R.P. Industrial production of β-lactam antibiotics. Appl. Microbiol. Biotechnol. 2003, 61, 385–392. [Google Scholar] [CrossRef]
  11. Fábián, L.; Kalman, A.; Argay, G.; Bernath, G.; Gyarmati, Z.C. Two polymorphs of a beta-lactam (trans-13-azabicyclo[10.2.0]tetradecan-14-one). Concomitant crystal polymorphism and isostructurality. Chem. Commun. 2004, 18, 2114–2115. [Google Scholar] [CrossRef] [PubMed]
  12. Jeng-Da, C.; Martin, H.G. Long-Range corrected hybrid density functionals with damped atom-atom dispersion corrections. Chem. Phys. 2008, 10, 6615–6620. [Google Scholar]
  13. Maddox, J. Crystals from first principles. Nature 1988, 335, 201. [Google Scholar] [CrossRef]
  14. He, X.; Zhu, T.; Wei, X.W.; Liu, J.F.; Zhang, J.Z.H. Fragment quantum mechanical calculation of proteins and its applications. Acc. Chem. Res. 2014, 47, 2748. [Google Scholar] [CrossRef]
  15. Liu, J.F.; He, X. Accurate prediction of energetic properties of ionic liquid clusters using a fragment-based quantum mechanical method. Chem. Phys. 2017, 19, 20657–20666. [Google Scholar] [CrossRef] [PubMed]
  16. Liu, J.F.; He, X.; Zhang, J.Z.H. Structure of liquid water—A dynamical mixture of tetrahedral and ‘ring-and-chain’ like structures. Chem. Phys. 2017, 19, 11931–11936. [Google Scholar]
  17. Li, J.J.; Sode, O.; Voth, G.A.; Hirata, S. A solid-solid phase transition in carbon dioxide at high pressures and intermediate temperatures. Nat. Commun. 2013, 4, 141–155. [Google Scholar] [CrossRef]
  18. Liu, J.F.; He, X.; Zhang, J.Z.H.; Qi, L.W. Hydrogen-bond structure dynamics in bulk water: Insights from ab initio simulations with coupled cluster theory. Chem. Sci. 2017, 9, 2065–2073. [Google Scholar] [CrossRef] [PubMed]
  19. Liu, J.F.; Qi, L.W.; Zhang, J.Z.H.; He, X. Fragment quantum mechanical method for large-sized ion-water clusters. J. Chem. Theory Comput. 2017, 13, 2021–2034. [Google Scholar] [CrossRef]
  20. He, X.; Sode, O.; Xantheas, S.S.; Hirata, S. Second-order many-body perturbation study of ice Ih. J. Chem. Phys. 2012, 137, 15864–18468. [Google Scholar] [CrossRef]
  21. Hirata, S.; Gilliard, K.; He, X.; Li, J.J.; Sode, O. Ab initio molecular crystal structures, spectra, and phase diagrams. Acc. Chem. Res. 2014, 47, 2721–2730. [Google Scholar] [CrossRef] [PubMed]
  22. Sun, Y.Y.; Tilbury, C.J.; Reutzel-Edens, S.M.; Bhardwaj, R.M.; Li, J.J.; Doherty, M.F. Modeling olanzapine solution growth morphologies. Cryst. Growth Des. 2018, 18, 905–911. [Google Scholar] [CrossRef]
Figure 1. The molecular structures of β-lactam forms I and II. For easy identification, the hydrogen atom has been deleted, and the red color represents the oxygen atom.
Crystals 09 00460 g001
Figure 2. Conformational overlays of β-lactam unit cells, where the red and blue molecules represent forms I and II, respectively, with a root-mean-square deviation (RMSD) of 3.7891 Å.
Crystals 09 00460 g002
Figure 3. The IR (a) and Raman (b) spectra of β-lactam in form I (red curves) and form II (green curves) under standard atmospheric pressure (100 KPa). The inset in (a) shows the characteristic IR peaks for forms I and II.
Crystals 09 00460 g003
Figure 4. The comparison of Raman spectra of β-lactam form I (red curves) and form II (green curves) under standard atmospheric pressure (100 KPa) in low-frequency (a) and high-frequency (b) regions, respectively. The characteristic peaks for form II are labeled by the black star signs.
Crystals 09 00460 g004
Figure 5. The calculated Gibbs free energy differences of β-lactam per unit cell between forms I and II (form I–form II) from 0 to 500 K at standard atmospheric pressure (100 KPa), where the temperature-induced polymorphic transformation occurs at 308 K.
Crystals 09 00460 g005
Table 1. The lattice constants of β-lactam, which were taken from [11].
FormulaSpace Groupa (Å)b (Å)c (Å)α (deg)β (deg)γ (deg)V (Å3)Z
Form IC13H23NOP21/c5.8587.62928.2379097.97901249.74
Form IIC13H23NOP21/c5.9627.26728.6899094.90901238.44
Table 2. The observed and calculated lattice constants (Å) of forms I and II under standard atmospheric pressure (100 KPa). The calculation is based on the ωB97XD/6-31G* optimization.
ParametersExpt. Form IDFT Form IExpt. Form IIDFT Form II
a5.8585.6455.9625.781
b7.6297.4517.2677.327
c28.23728.51928.68928.402

