Article

Monte Carlo Optical Simulations of a Small FoV Gamma Camera. Effect of Scintillator Thicknesses and Septa Materials

1
Department of Industrial Engineering and Mathematical Sciences (DIISM), Università Politecnica delle Marche, 60131 Ancona, Italy
2
BioEmission Technology Solutions, 11472 Athens, Greece
3
Department of Medical Physics, University of Patras, 26504 Rion, Greece
4
Department of Biomedical Engineering, University of West Attica, 12210 Athens, Greece
5
Department of Materials, Environmental Sciences and Urban Planning (SIMAU), Università Politecnica delle Marche, 60131 Ancona, Italy
*
Author to whom correspondence should be addressed.
Crystals 2019, 9(8), 398; https://doi.org/10.3390/cryst9080398
Submission received: 28 June 2019 / Revised: 27 July 2019 / Accepted: 29 July 2019 / Published: 1 August 2019

Abstract

:
Optical Monte Carlo simulations have been extensively used for the accurate modeling of light transport in scintillators for the improvement of detector designs. In the present work, a GATE Monte Carlo toolkit was used to study the effect of scintillator thicknesses and septa materials in the performance parameters evaluation of a commercially available small animal gamma-optical camera, named “γ-eye”. Firstly, the simulated γ-eye system was validated against experimental data. Then, part of the validated camera was modeled defining all of the optical properties by means of the UNIFIED model of GATE. Different CsI:Na scintillator crystals with varying thicknesses (from 4 mm up to 6 mm) and different reflector (septa) materials were simulated and compared in terms of sensitivity, light output and spatial resolution. Results have demonstrated the reliability of the model and indicate that the thicker crystal array presents higher sensitivity values, but degraded spatial resolution properties. Moreover, the use of black tape around crystals leads to an improvement in spatial resolution values compared to a standard white reflector material.

1. Introduction

Scintillation detectors are used as radiation converting media in various applications, from medical imaging to high-energy physics experiments. Nuclear medicine devices use such detectors in Single-Photon Emission Computed Tomography (SPECT) and Positron Emission Tomography (PET). Due to the progress that has been made in computer science over the years, Monte Carlo simulations can boost the research in such activities. Experimental parameters can be modified easily in such simulations, in comparison to real experiments. Moreover, the evaluation of any system’s parameter can be done without the added cost of modifying the system or any of its components [1,2,3].
When an ionizing particle deposits energy in a scintillating crystal, electrons are being excited. The relaxation process of the excited states results in the emission of optical photons, which are transported through the scintillator to a photodetector (Photomultiplier Tubes—PMTs, Avalanche Photodiodes—APDs, Silicon Photomultipliers—SiPMs), and finally converted to an electric signal (pulse). Therefore, optical photons are the primary information carriers in any scintillation detector, and there is need to be studied in detail, using Monte Carlo models, to extend our understanding in the performance of the scintillation detectors [4,5].
Nowadays, GATE Monte Carlo simulation software [6,7] is extensively used in the field of Nuclear Medicine to simulate SPECT and PET medical and preclinical small field of view detectors. GATE allows the user to perform optical simulations with accurate modeling of optical photons interactions with the crystal surface. Τwo simulation models are available to describe the optical properties at boundary conditions of the surface: the recently implemented Look-Up-Table (LUT) Davis model [1,2,3,4,5,6,7,8] and the traditional UNIFIED model [9,10].
Recently, many studies [2,5,11,12] have exploited GATE optical photons simulations, to model the light transportation in scintillators, according to their surface properties. One of the most important parameters that have been used to assess the performance of a scintillation camera is the spatial resolution. More specifically, variables of particular interest are the influence of the crystal thickness on the spread of scintillation light that degrades the spatial resolution [13,14,15], as well as the reflective material used to wrap the crystals [16,17].
In this work, a GATE simulation toolkit was used to simulate all the physics of the interactions that are produced inside the small animal gamma camera, named “γ-eye” using the UNIFIED model. Firstly, the simulated γ-eye system was validated against experimental data and then, part of the validated camera was modeled in order to analyze the performance of the small animal system, when different scintillator detector array configurations were applied. The parameters that were considered are:
(a)
Different thicknesses for the CsI:Na scintillating crystal,
(b)
Several types of material for the reflector and
(c)
Different colors of reflective material.

2. Materials and Methods

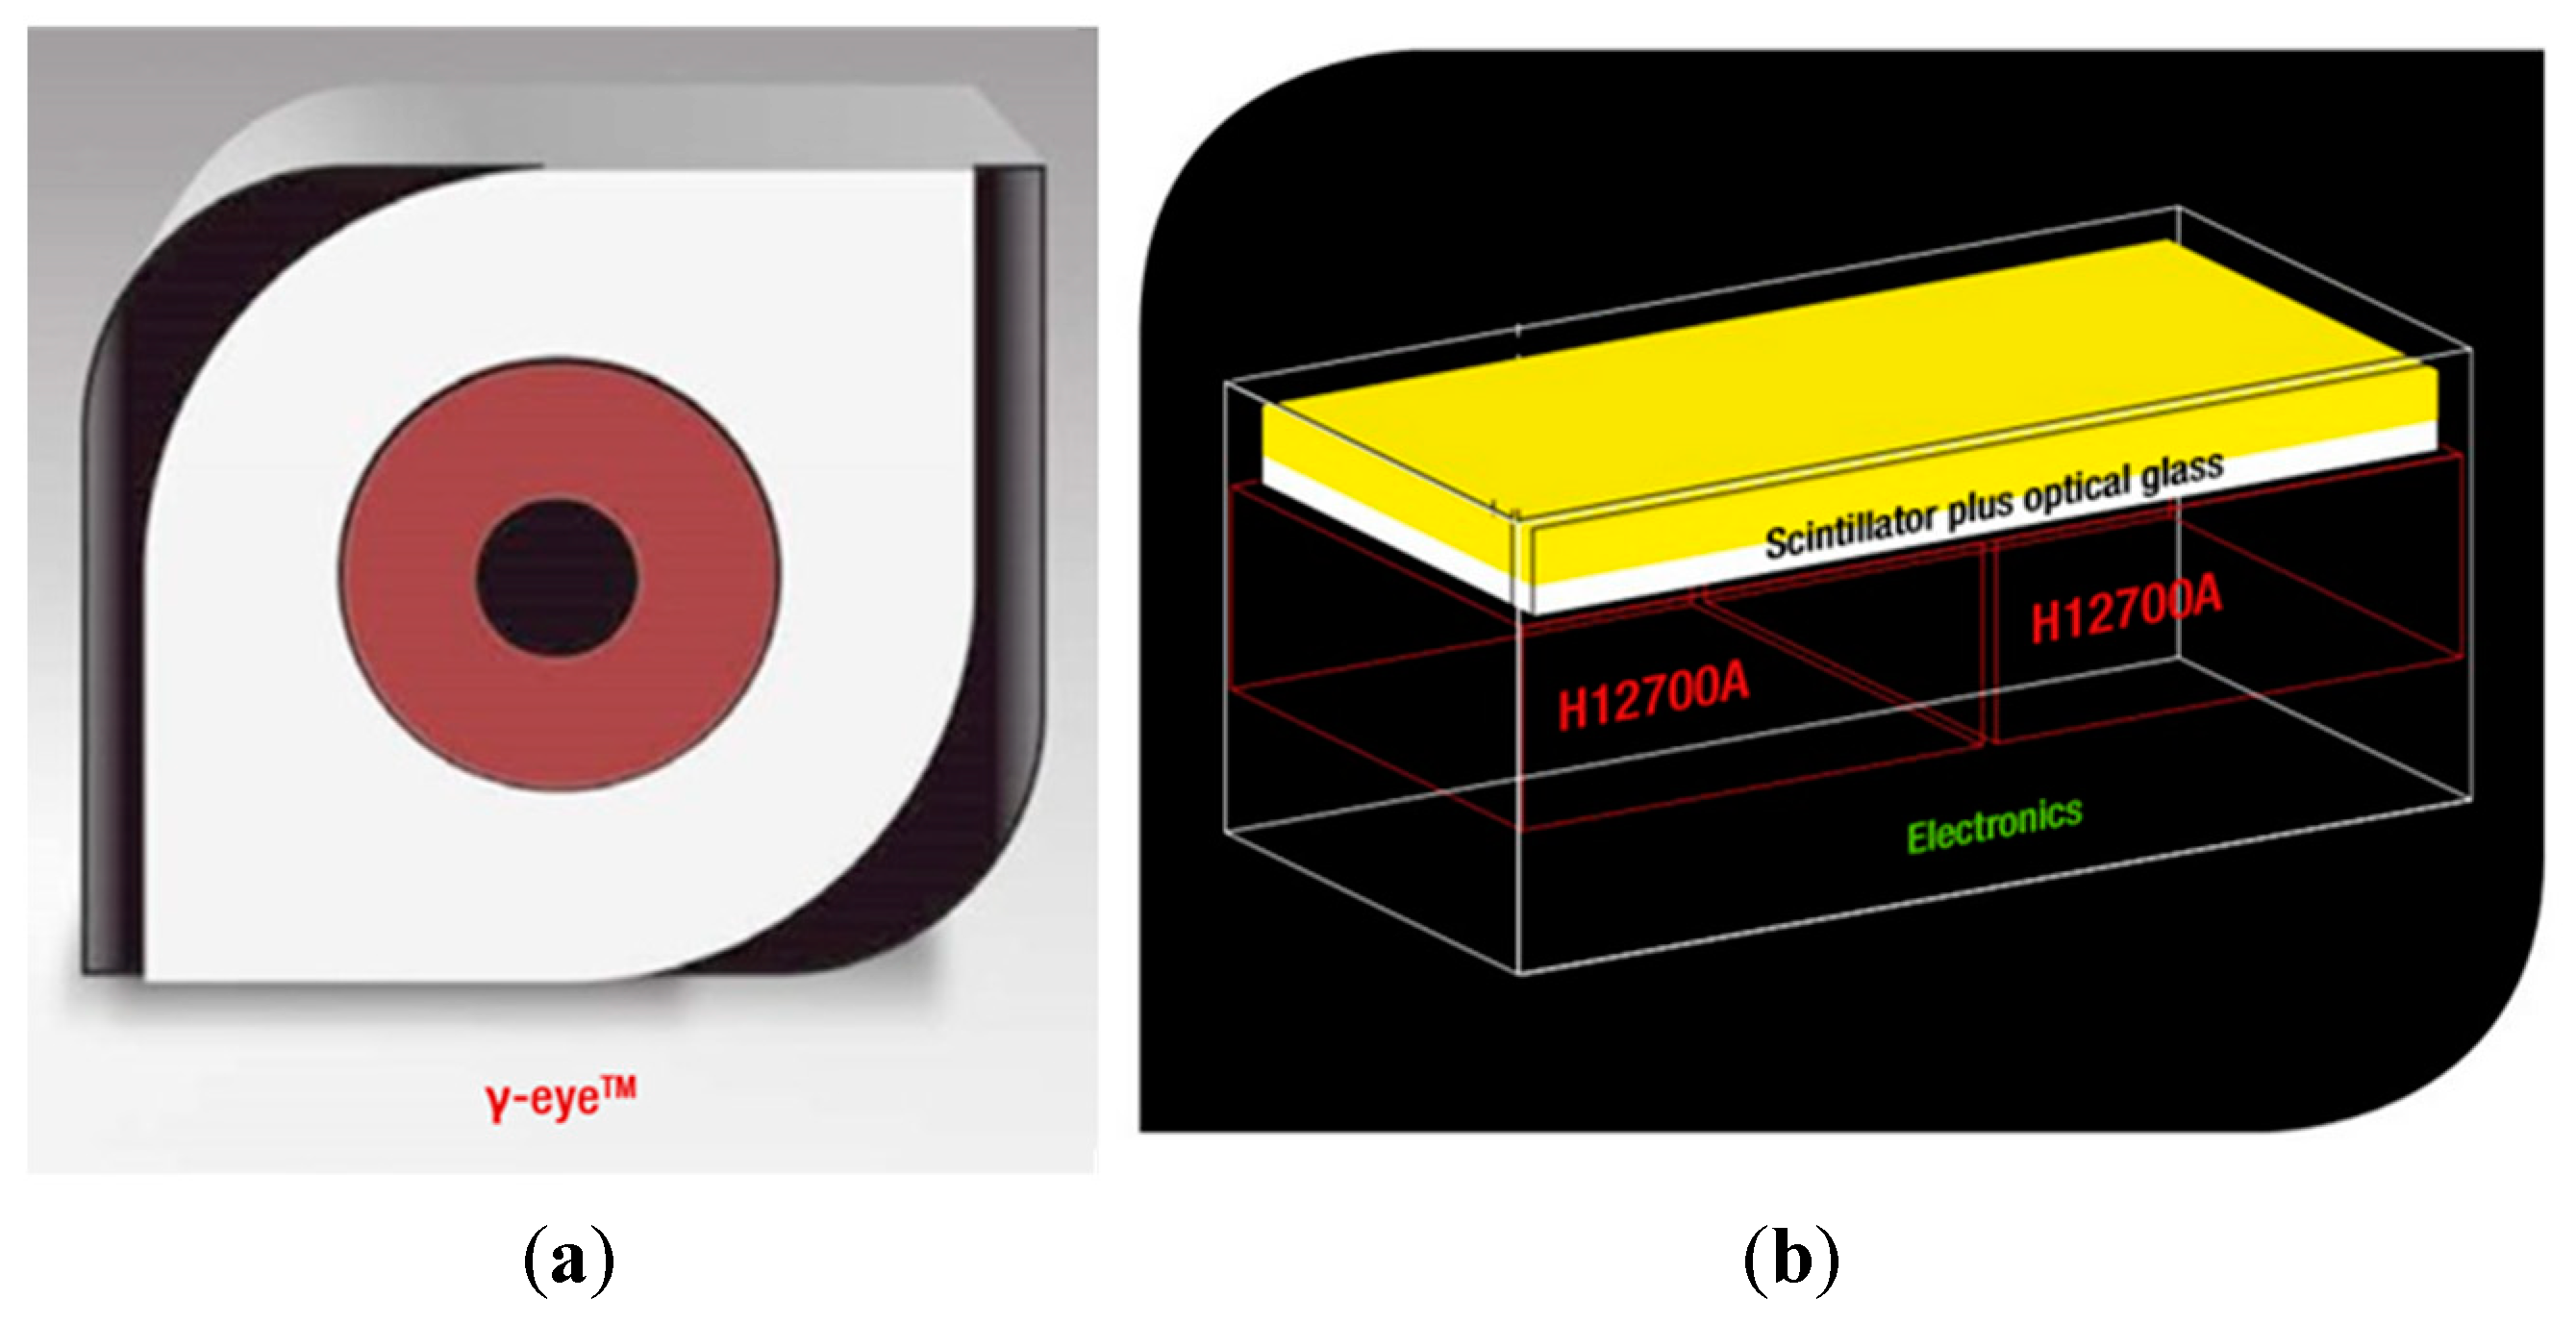
2.1. Standard Model Description and Validation

In this work, a specific device, called the “γ-eye” [18,19], was modeled in GATE. The “γ-eye” is a benchtop preclinical scintigraphic camera, which is produced by BIOEMTECH (http://bioemtech.com/) and is suitable for in vivo molecular imaging of radiolabeled biomolecules and nanoparticles providing a screening tool for pharmacokinetics studies. The user is able to acquire whole-body small animal static and dynamic images using a variety of tracers and probes labeled with SPECT radioisotopes. Figure 1a presents a photograph of the benchtop system, while a schematic drawing of its detector is illustrated in Figure 1b.
The “γ-eye” detector consists of a 29 × 58 pixelated sodium activated cesium iodide CsI:Na scintillator crystal array (1.45 mm pixel elements, 1.7 mm pitch) with 5 mm thickness, coupled to two H12700A [20] multichannel Position Sensitive Photomultiplier Tubes (PSPMTs) for scintillation light detection. A borosilicate glass window, 2 mm thick, covered with optical grease is used for optical coupling. A 27 mm thick, parallel hole lead collimator, with 1.2 mm diameter hexagonal holes and 0.15 septa is used for photon alignment. The specification properties of the γ-eye detector system are summarized in Table 1.
The “γ-eye” detector was first simulated in GATE and validated for its spatial resolution and sensitivity properties comparing experimental and simulated data. Simulations were implemented with the open-source GATE v8.0 software (Laboratoire de Physique de Clermont UMR 6533 CNRS/IN2P3 - Université Clermont Auvergne, avenue Blaise Pascal 4, TSA 60026 CS 60026 63178 - Aubière Cedex, FRANCE) [6,7]. All of the appropriate electromagnetic and physical processes were included in the performed modeling simulations, while no cuts or variance reduction techniques were applied.
Concerning the experimental evaluation study, the system’s spatial resolution and sensitivity values were determined by linearly stepping a 60 mm long capillary tube source, with 0.6 mm inner diameter (1.4 mm external diameter), filled with 150 uCi 99mTc solution, at different distances (from 0 mm to 75 mm) away from the collimator. All images were created after using the Look-Up-Table (LUT) calibration files and by applying a ±20% energy window. The acquisition time was set to 300 seconds for each measurement, in order to ensure good statistics. The same conditions were then modeled and simulated with GATE. The FWHM values (in mm) of the capillary tube profiles were calculated using a Gaussian fit. The system sensitivity was defined (in cps/MBq) as the ratio of the gamma ray photons recorded within the defined photopeak energy window per experiment duration divided by the gamma rays incident on the detector surface. The system spatial resolution and sensitivity values were calculated and simulated for all varying distances.

2.2. Implementation of the Optical Model in GATE

In this work, only a part of the validated camera (8.5 × 8.5 mm2) was modeled defining all of the optical properties by means of the UNIFIED model of GATE. In this way we could study the effect of scintillator thicknesses and septa materials in performance parameters evaluation, in a time efficient manner, due to the huge amount of time that would be needed in order to follow all the optical photons produced inside the real dimensions scintillator detector of “γ-eye” (48 × 98 mm2). Thousands of optical photons are produced when a γ-photon interacts with scintillator mass, leading to a dramatic increase of the processing time (thousands of times slower than standard simulations). Therefore, a standard simulation (using standard physics and no optical photons) with the existing model was performed, using only a 5 × 5 array of scintillator crystal elements, to produce data that would be comparable with optical simulation output. The geometry of the implemented “optical” model is shown in Figure 2, on an unrealistic scale. Its dimensions are 8.5 mm × 8.5 mm × 37.6 mm and it includes:
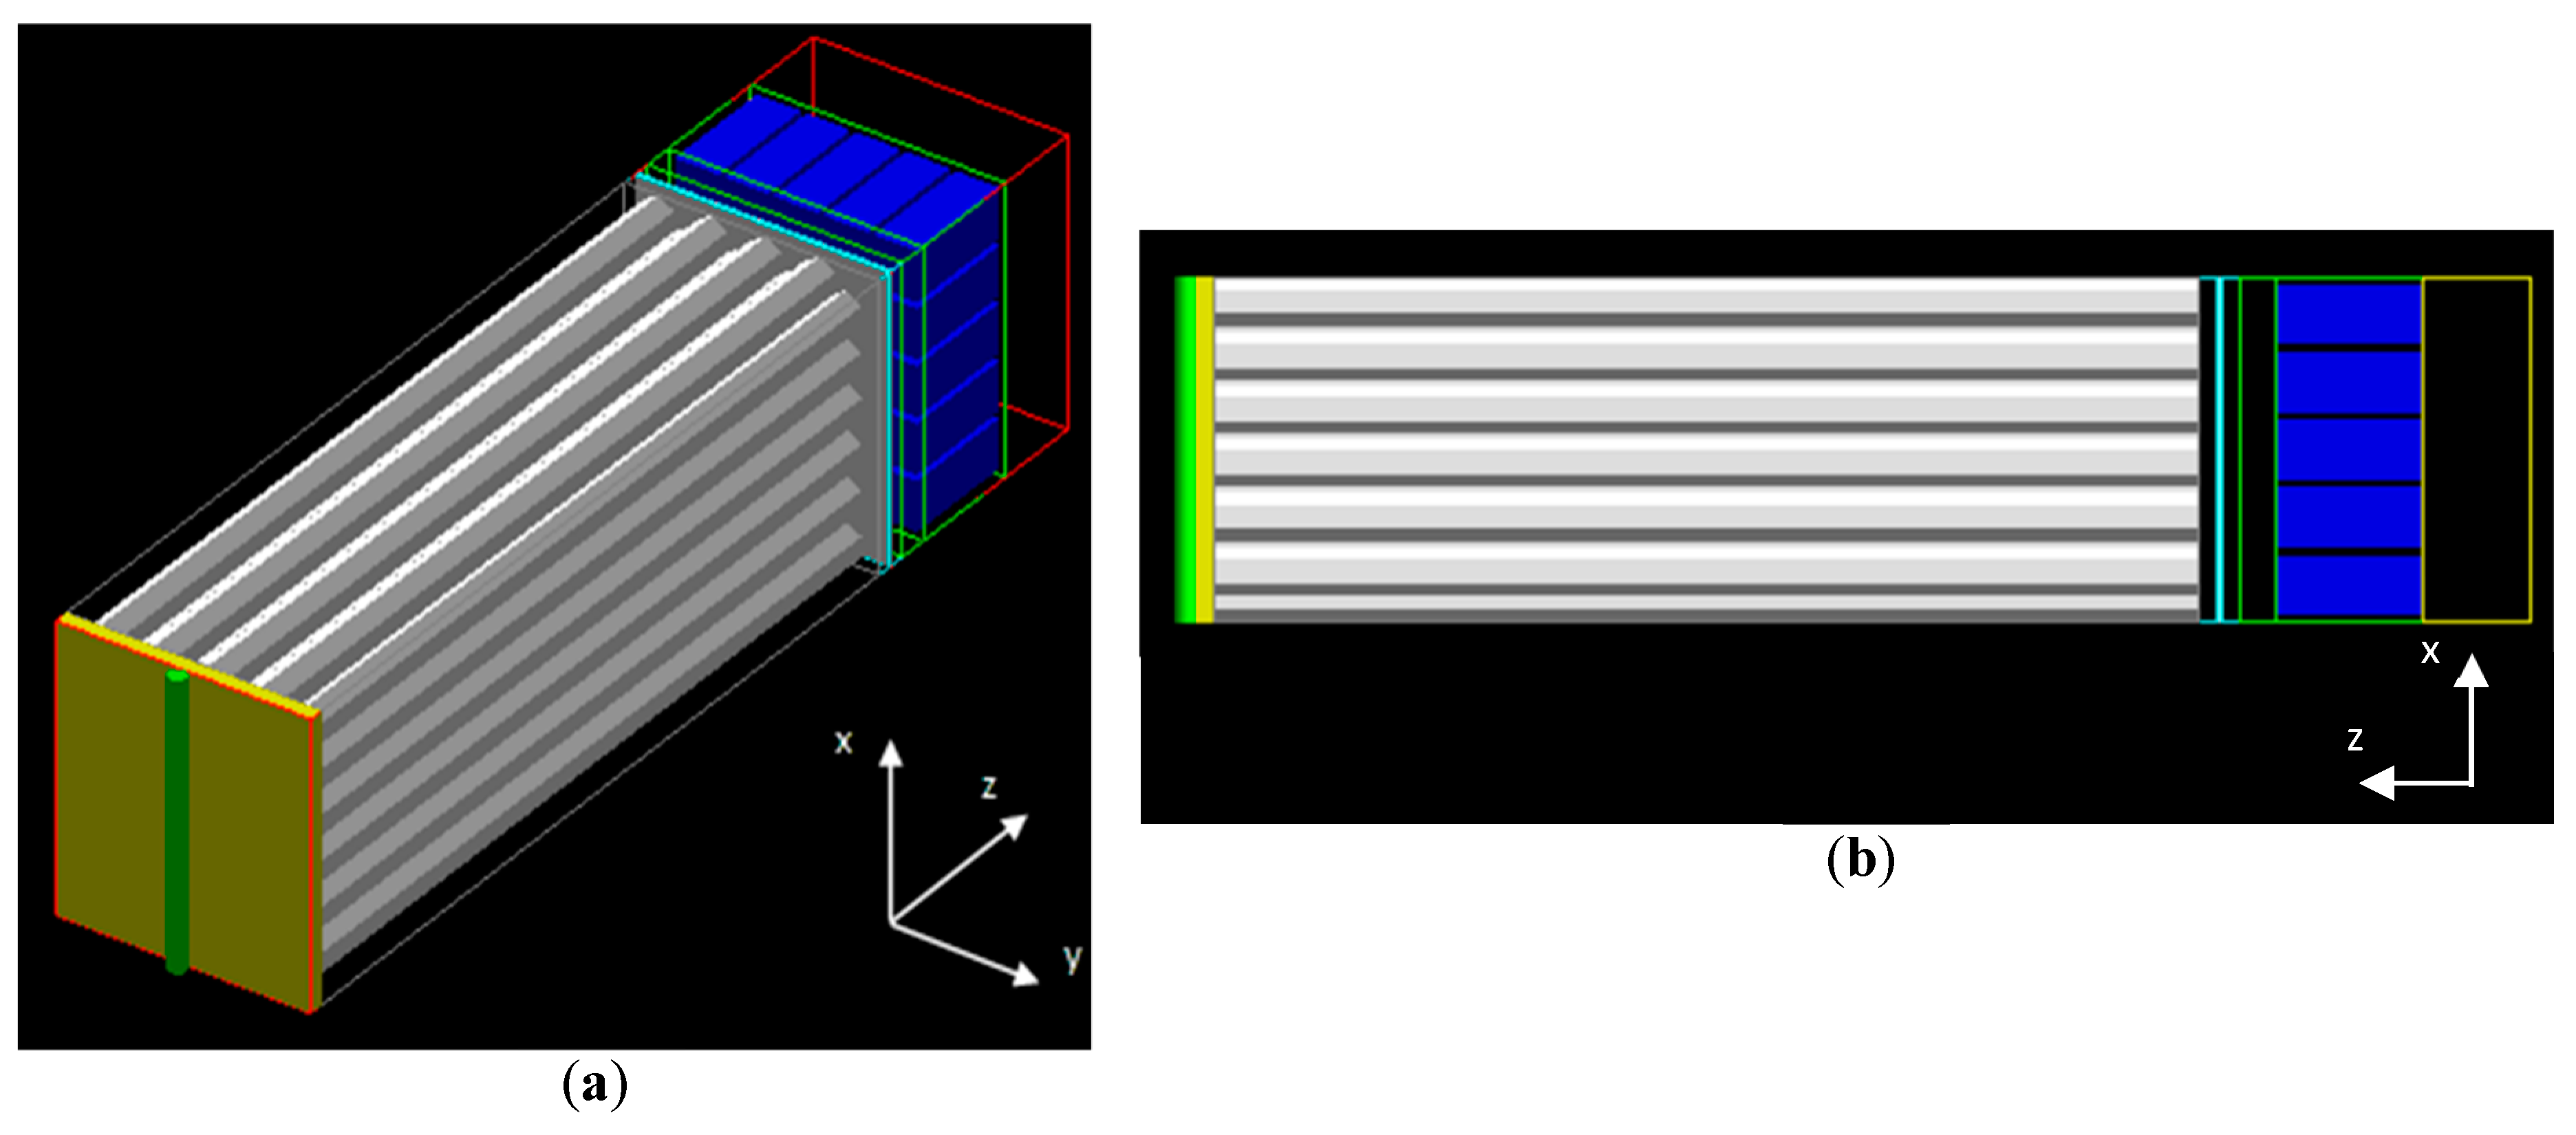
  • A front-collimator aluminum layer, 0.5 mm thick;
  • A parallel lead hole collimator, 27 mm thick, with a 1.2 mm diameter hexagonal holes and 0.15 mm septa;
  • Two aluminum layers of 0.5 mm thickness, separated by an air layer of 0.1 mm;
  • A front-crystals reflector layer made of dioxide titanium (TiO2), of 1 mm thickness;
  • A 5 × 5 pixelated CsI:Na scintillator crystals array (1.45 mm × 1.45 mm × 5 mm), with TiO2 septa 0.25 mm thick; with external dimensions equal to (8.5 × 8.5 mm2).
  • A glass layer of 2 mm thickness, for the detector coupling with PSPMTs.
Ιn the optical model, the shielding material that surrounds the standard “γ-eye” detector was not included, since it led to a substantial increase of the simulation time duration without affecting the parameters examined.
For accurate simulation of the optical photon interactions, all the materials’ properties must be defined, according to the UNIFIED model. For each material, included in the model, the refractive index and the absorption length were determined. Additionally, for the CsI:Na scintillator, the scintillation yield, the resolution scale, the fast time constant, the yield ratio and the fast component were also defined. These properties are discussed in databases and in published research [21,22,23,24,25,26], and have been added in the Materials.xml file (only the air properties were presented in the file). Table 2 and Table 3 show the materials’ properties used in the GATE optical model of the study [27].
Regarding the surface characterization, a total number of 16 surfaces were defined that correspond to the number of the interfaces between different materials in the model. All the surfaces were set as rough: they are characterized by a ground finish, a Sigmaalpha value of 6 (i.e., roughness value, which defines the standard deviation of the Gaussian distribution of micro-facets around the average surface normal) and a specular lobe reflection for energies of 1.84 eV to 4.08 eV.
To evaluate the energy resolution of the system, a reference value of the energy resolution (usually given by experiments or by the manufacturer) needs to be set. In this case, the energy resolution reference value was set to 0.245 (i.e., 24.5%, given by experimental results), while the energy reference value was set to 140 keV (i.e., the radioactive source energy of 99mTc).

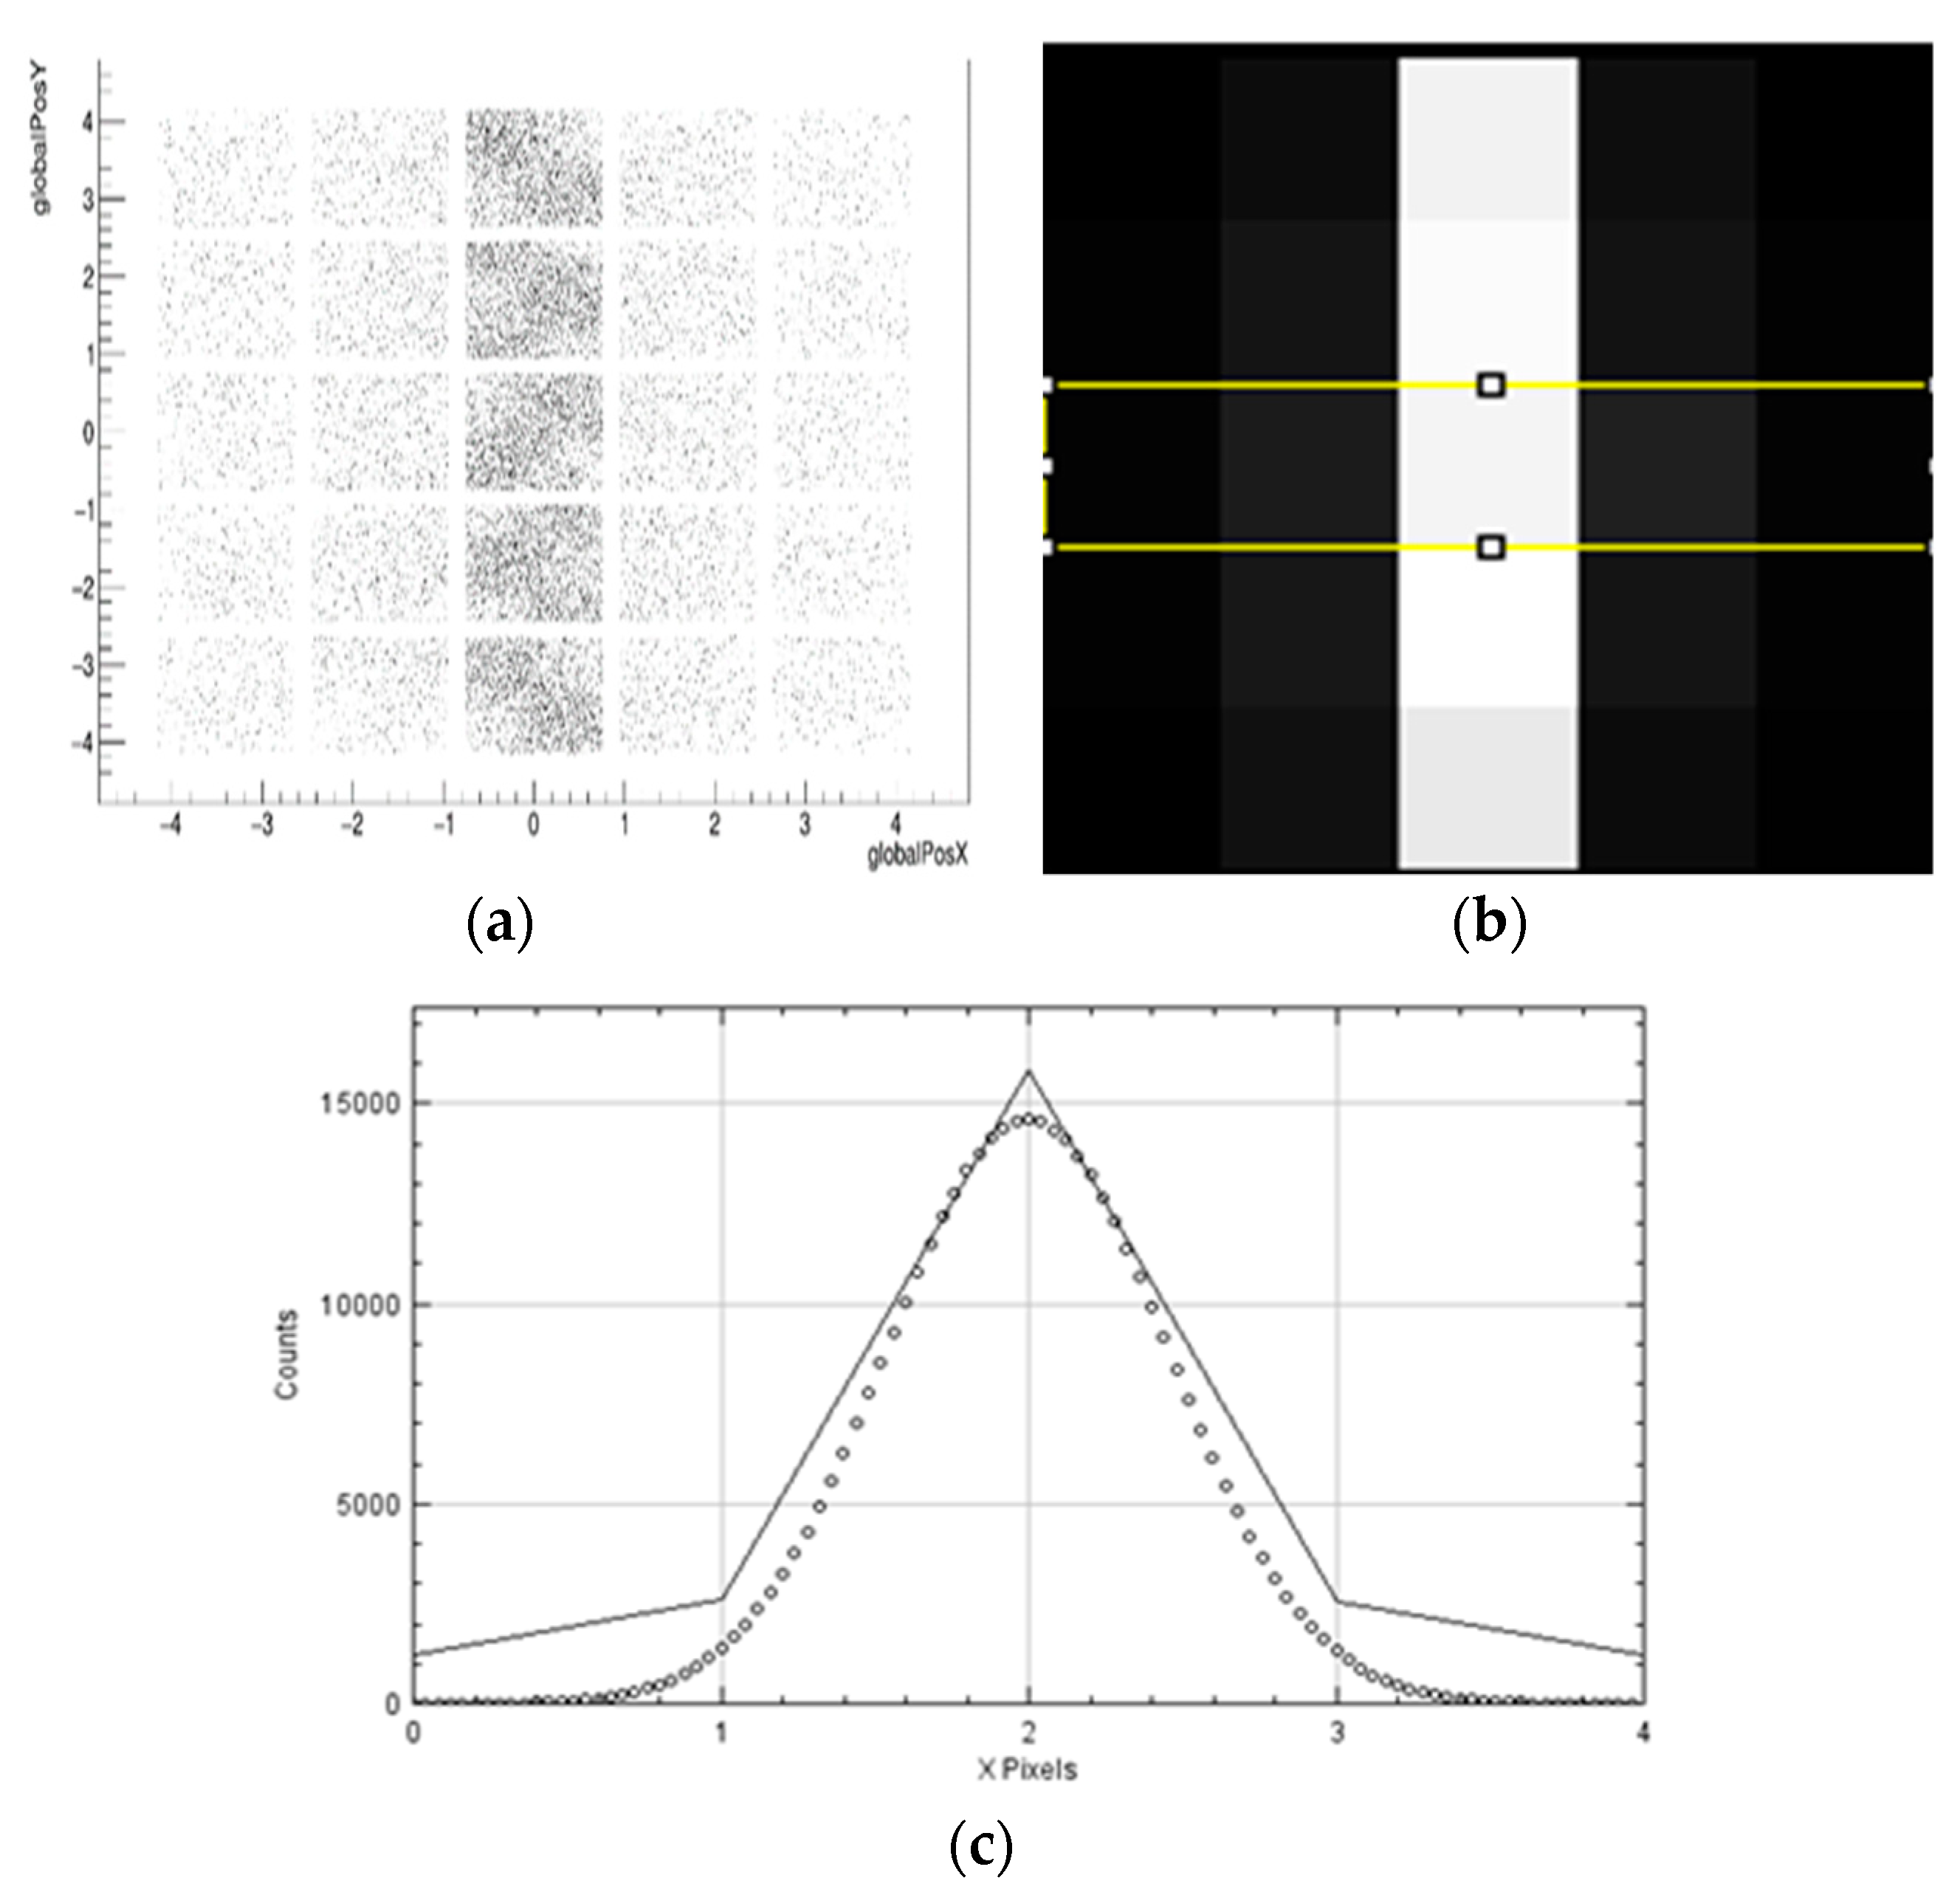
2.3. Validation of the Optical Model

After the implementation of the optical model in GATE, the first step was its validation. For this purpose, the geometry of the optical model was used for simulating a capillary source in two different occasions:
(a)
Using the physics of optical photons
(b)
Using the standard physics (no optical photons)
As already said, the standard model was validated with the experimental results, but in order to be comparable with the optical model, some modifications were applied. In particular, only part of the pixelated scintillator crystal array was used (i.e., 5 × 5) to be comparable with the optical model. Moreover, the capillary source was modified to emit gamma rays only in the direction of the model, and not isotropically, as the optical simulation duration would otherwise be increased dramatically.
Table 4 shows the main characteristics of these simulations. It can be seen that the simulation time is different for each simulation; this is due to the actual time needed for each one (i.e., one second for GATE does not always correspond to an actual second, especially for optical simulations; this also depends on the computer performance). Choosing the listed values, the number of collected optical photons is about 105, which is enough to ensure low uncertainty of the results.
After the completion of the simulations, the energy resolution and the spatial resolution values were calculated and considered for the evaluation of the model’s validity (see Section 2.5).

2.4. Optical Simulations

Once the optical model was validated, two parameters were modified: the thickness of the scintillator’s crystal and the reflector’s material. A total number of fifteen simulations were performed, with the same simulation time, in order to be able to collect, for all of them, at least 105 optical photons. The radioactive source was a capillary tube with 0.6 mm diameter, 8.7 mm height, filled with 2000 Bq of 99mTc radioisotope. The CsI:Na scintillator crystals have varying thicknesses equal to 4 mm, 4.5 mm, 5 mm, 5.5 mm and 6 mm. For each crystal thickness, three different configurations were considered with respect to the reflector material:
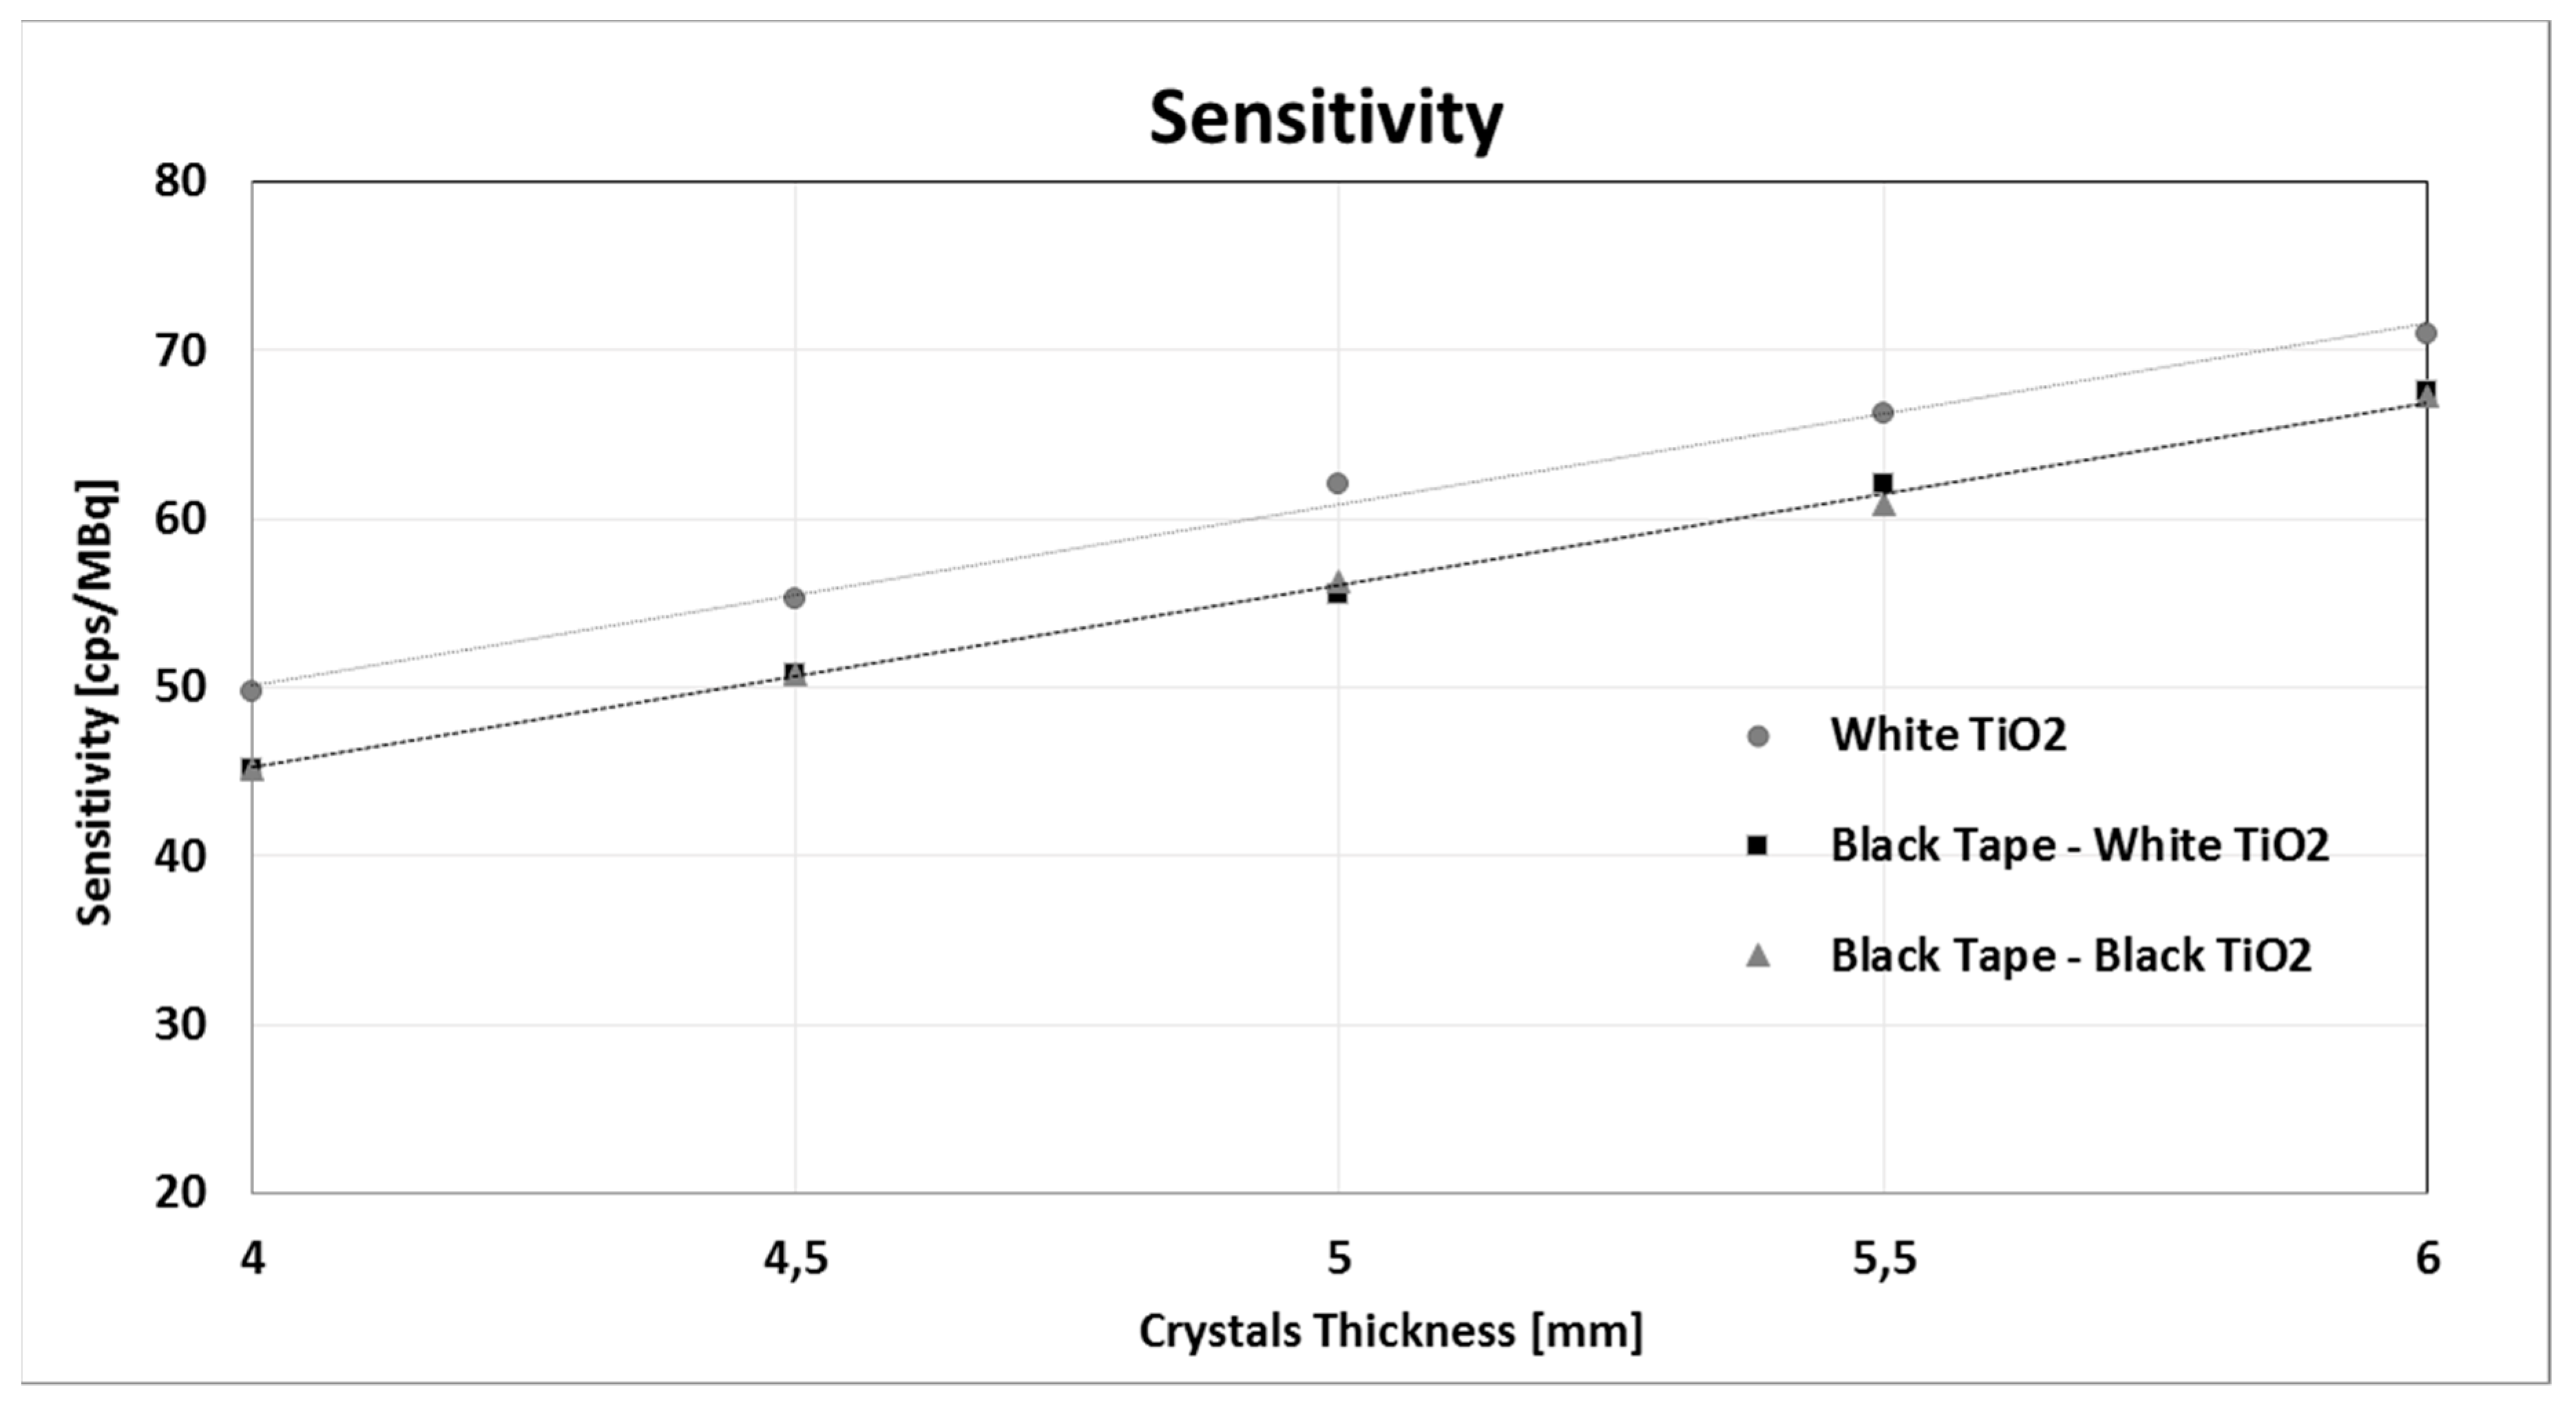
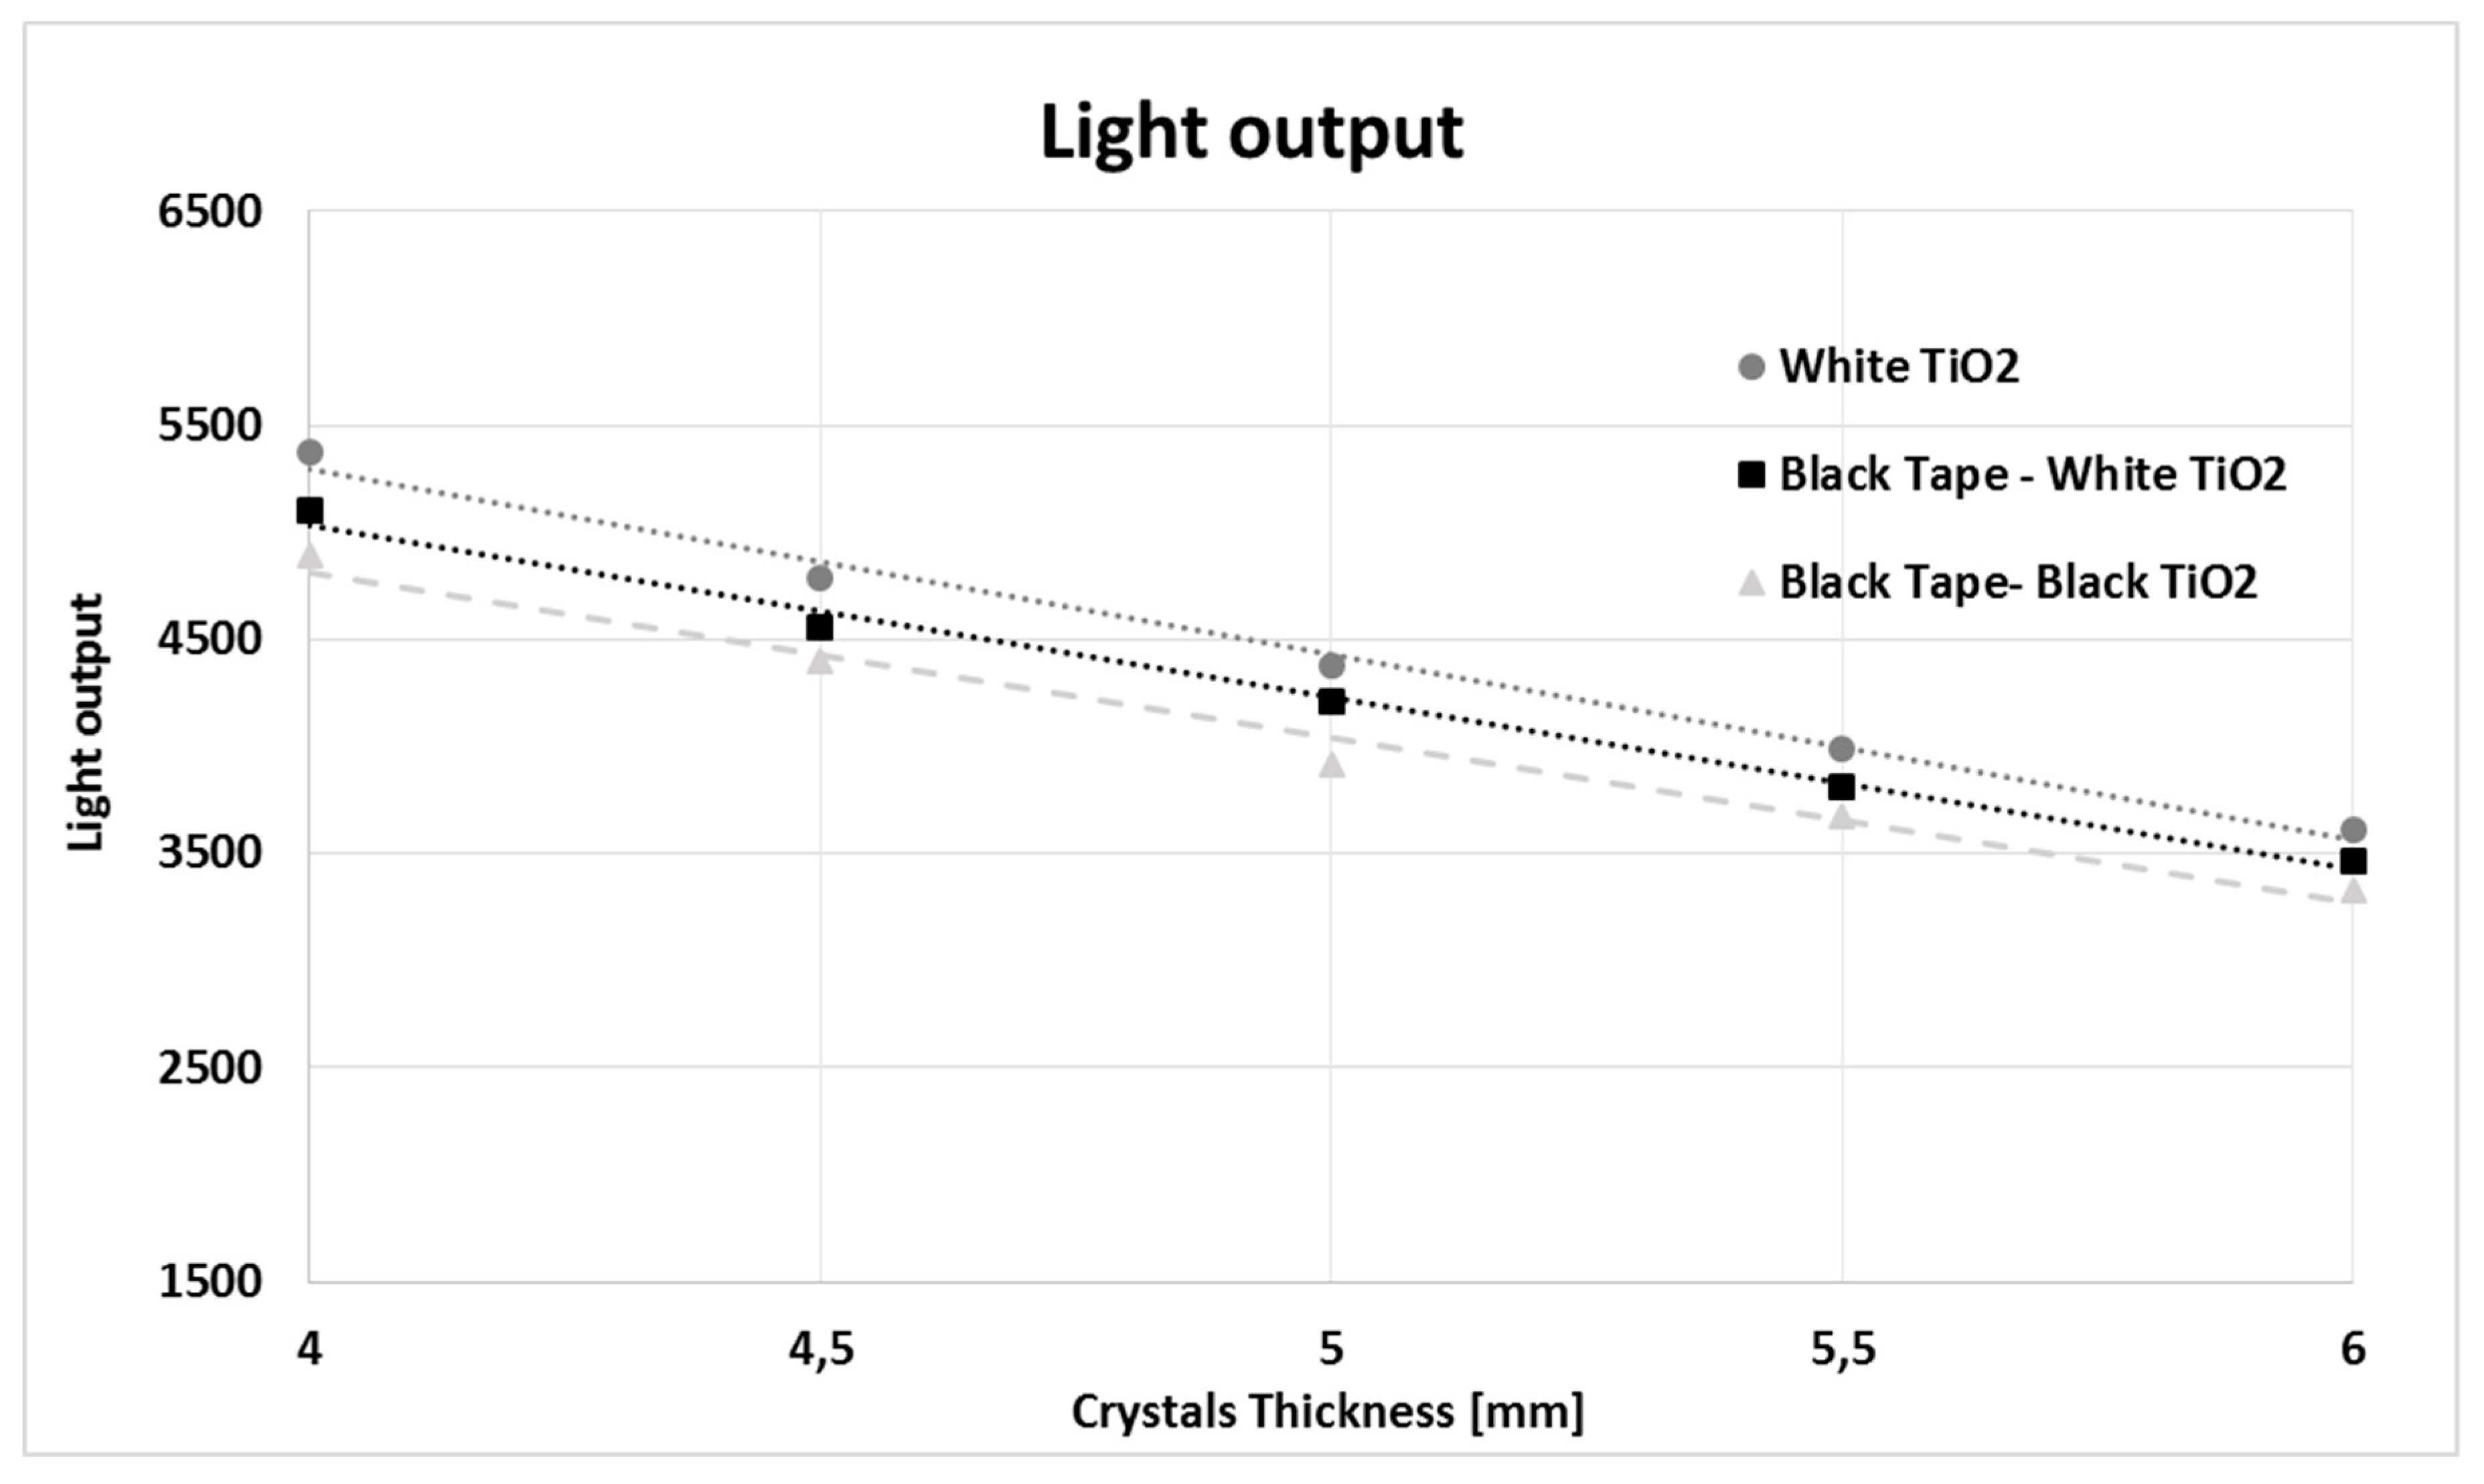
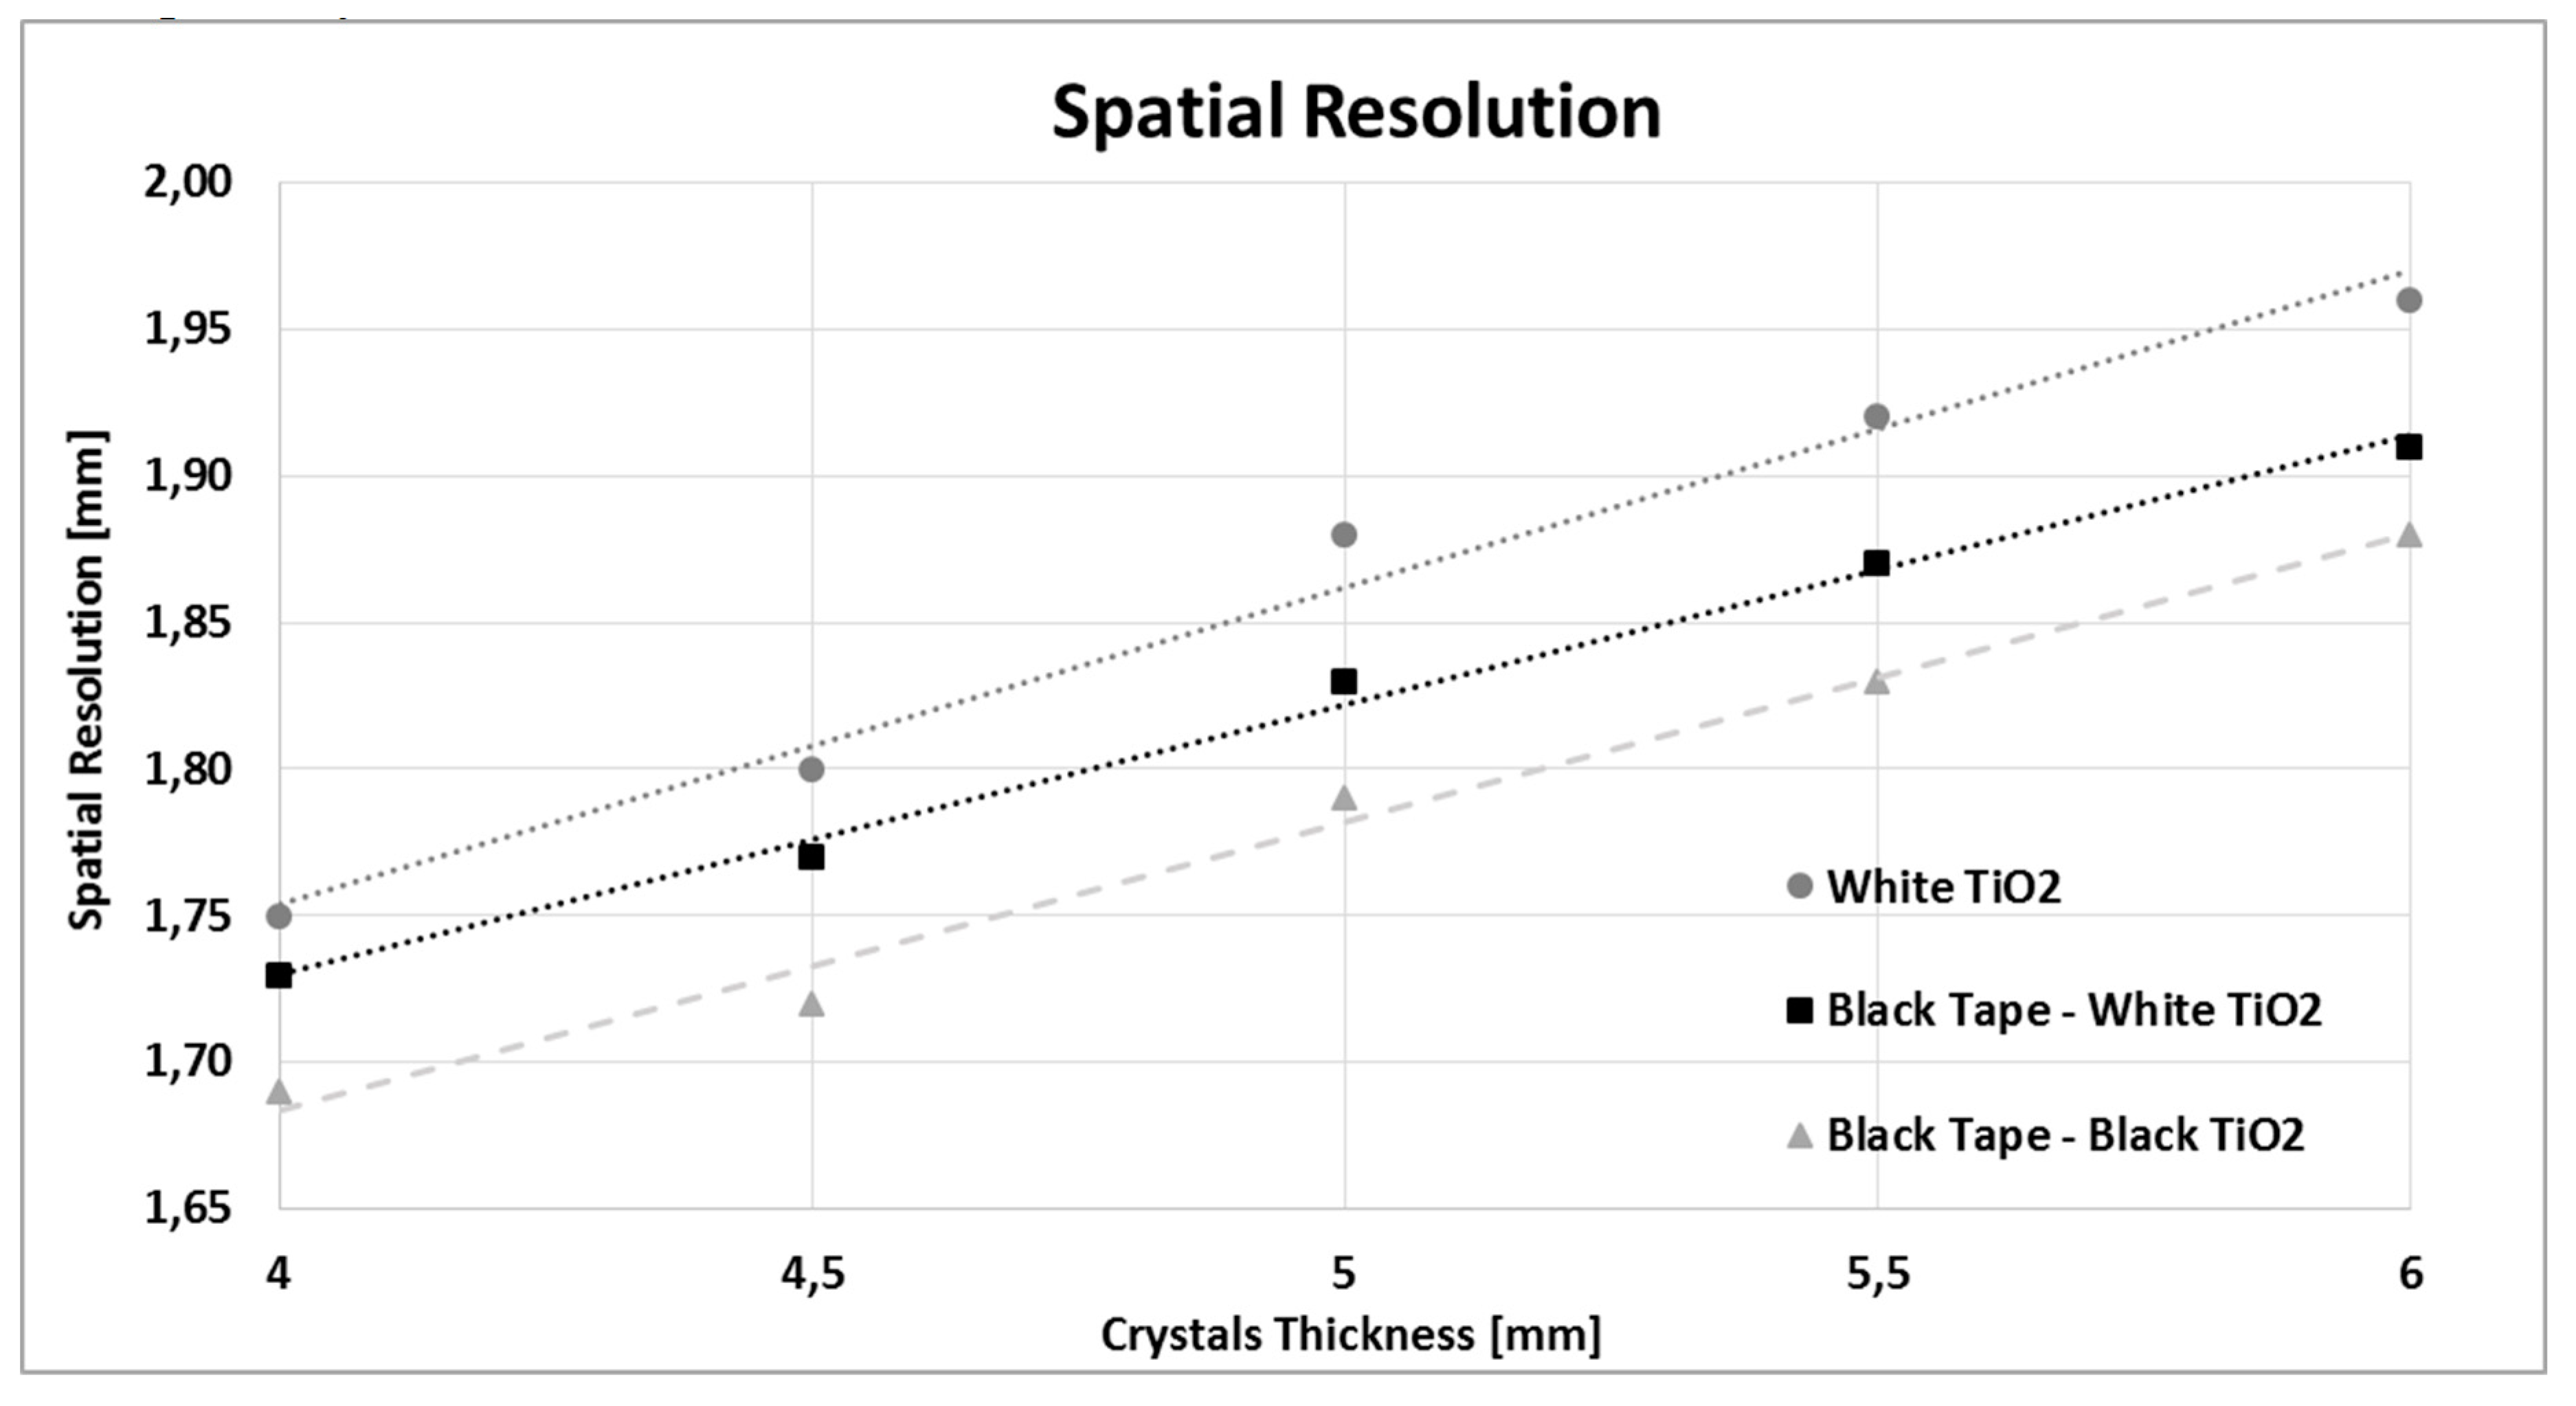
  • The first configuration involved white TiO2 reflector material around each element and in front of the crystal surfaces;
  • The second configuration consisted of white TiO2 in front of the crystal surface and black tape wrapping of the surrounding faces;
  • The third configuration involved black TiO2 in front of the crystal surface and black tape wrapping of the surrounding crystal sides.
Before proceeding to the simulations, we defined in the Materials.xml file (Table 2) all the optical properties of a black tape, using validated data [25]. The optical properties of the white TiO2 had already been defined in the optical model implementation (Table 2). Regarding the black TiO2, no information was found on its optical properties, since it does not exist in nature. Thus, in order to perform the simulations with black TiO2 as front reflector layer, the TiO2 used in the previous simulations was considered as a “black” surface in the surfaces definition. This means that the interface between the crystals and the front reflector layer is no longer “rough” but “black”. In the latter case, the surface finish is ground as in the previous case, but the value of Sigmaalpha is 0 and the specular lobe reflection occurs for different values of energy (1.97 eV and 2.34 eV).

2.5. Performance Measurements

For the performance evaluation of the system, the sensitivity, the light output, the spatial resolution and the energy resolution values were investigated. The experimental procedures to measure these parameters were based on previously published literature of small field of view gamma cameras with pixelated detectors [28,29,30,31,32,33].
The sensitivity was computed for the fifteen optical simulations as the recorded counts per second, recorded inside the energy window of the photopeak (±20%), divided by the activity of the source (counts/s/MBq). The simulation time and the source activity were the same for all simulations, thus the sensitivity was calculated as:
Sensitivity = counts/simulation time/activity (in counts/s/MBq)
The light output was computed for the fifteen optical simulations as the ratio of optical photons reaching the photomultiplier optical detector divided by the gamma photons fully absorbed by the crystal elements.
The system’s spatial resolution was measured by taking advantage of the capillary source geometry (0.6 mm diameter and 8.7 mm length). It was calculated as the full width at half maximum (FWHM) of the line spread function (LSF), measured by the simulation’s outcome from the line profile of the capillary source. In particular, the horizontal line profile along the x-axis was considered.
GATE produced a raw pixelated image of the capillary source profile with gaps between the pixels (see Section 3.3). However, to calculate the system spatial resolution, a continuous final image without gaps was needed. Thus, a 5 × 5 table was created, to represent a continuous distribution of the crystal elements. Each cell of this table was filled with the number of optical photons recorded by GATE. The continuous image of the capillary profile was investigated by the ImageJ open source software [34,35]. Five horizontal profiles of the 5 × 5 image were considered separately and for each one of them, the FWHM was computed after applying a Gaussian fit. The area covered by the five pixels in the crystal array was 8.5 × 8.5 mm (1.45 mm crystal width with 0.25 mm septa = 1.7 mm crystal pitch). Thus, each pixel dimension of the final image has dimensions equal to 1.7 × 1.7 mm. The spatial resolution was thereafter calculated as:
Spatial Resolution = FWHM × 1.7 (crystal pitch) (in mm)
Then, the mean value and the standard deviation of the five FWHM values of the LSFs were computed, obtaining the mean spatial resolution of the entire profile image.

3. Results

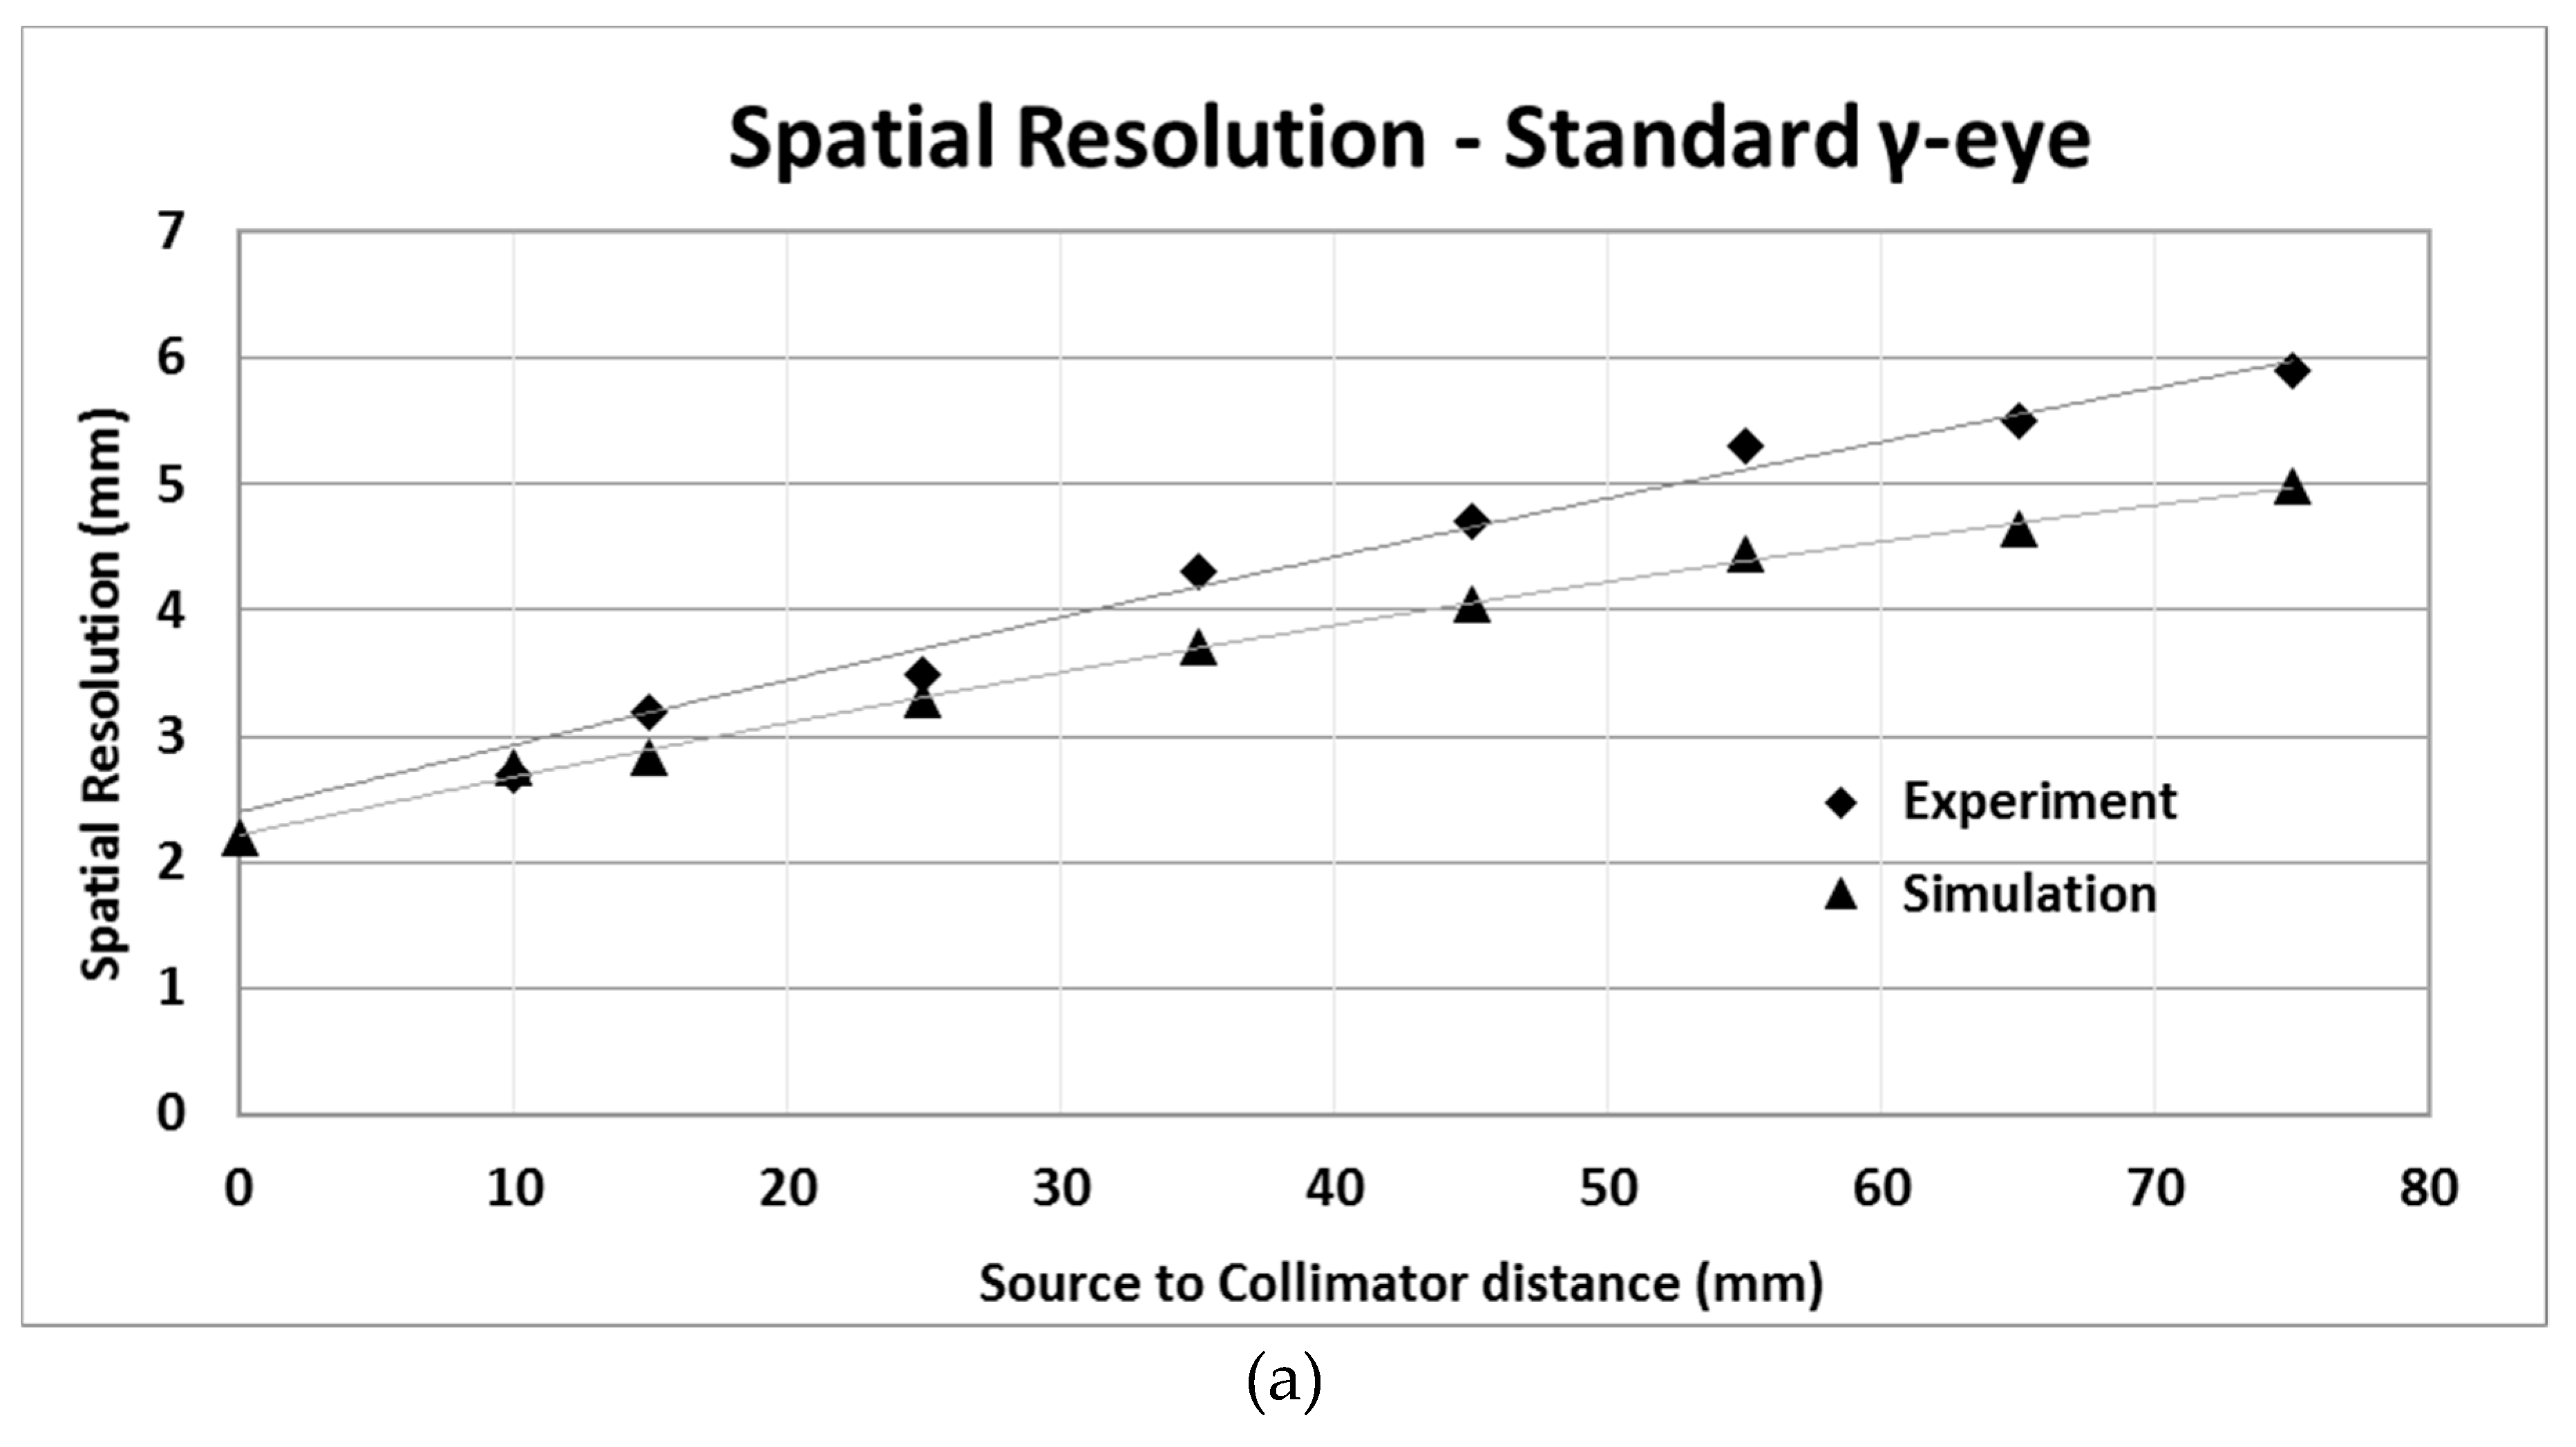
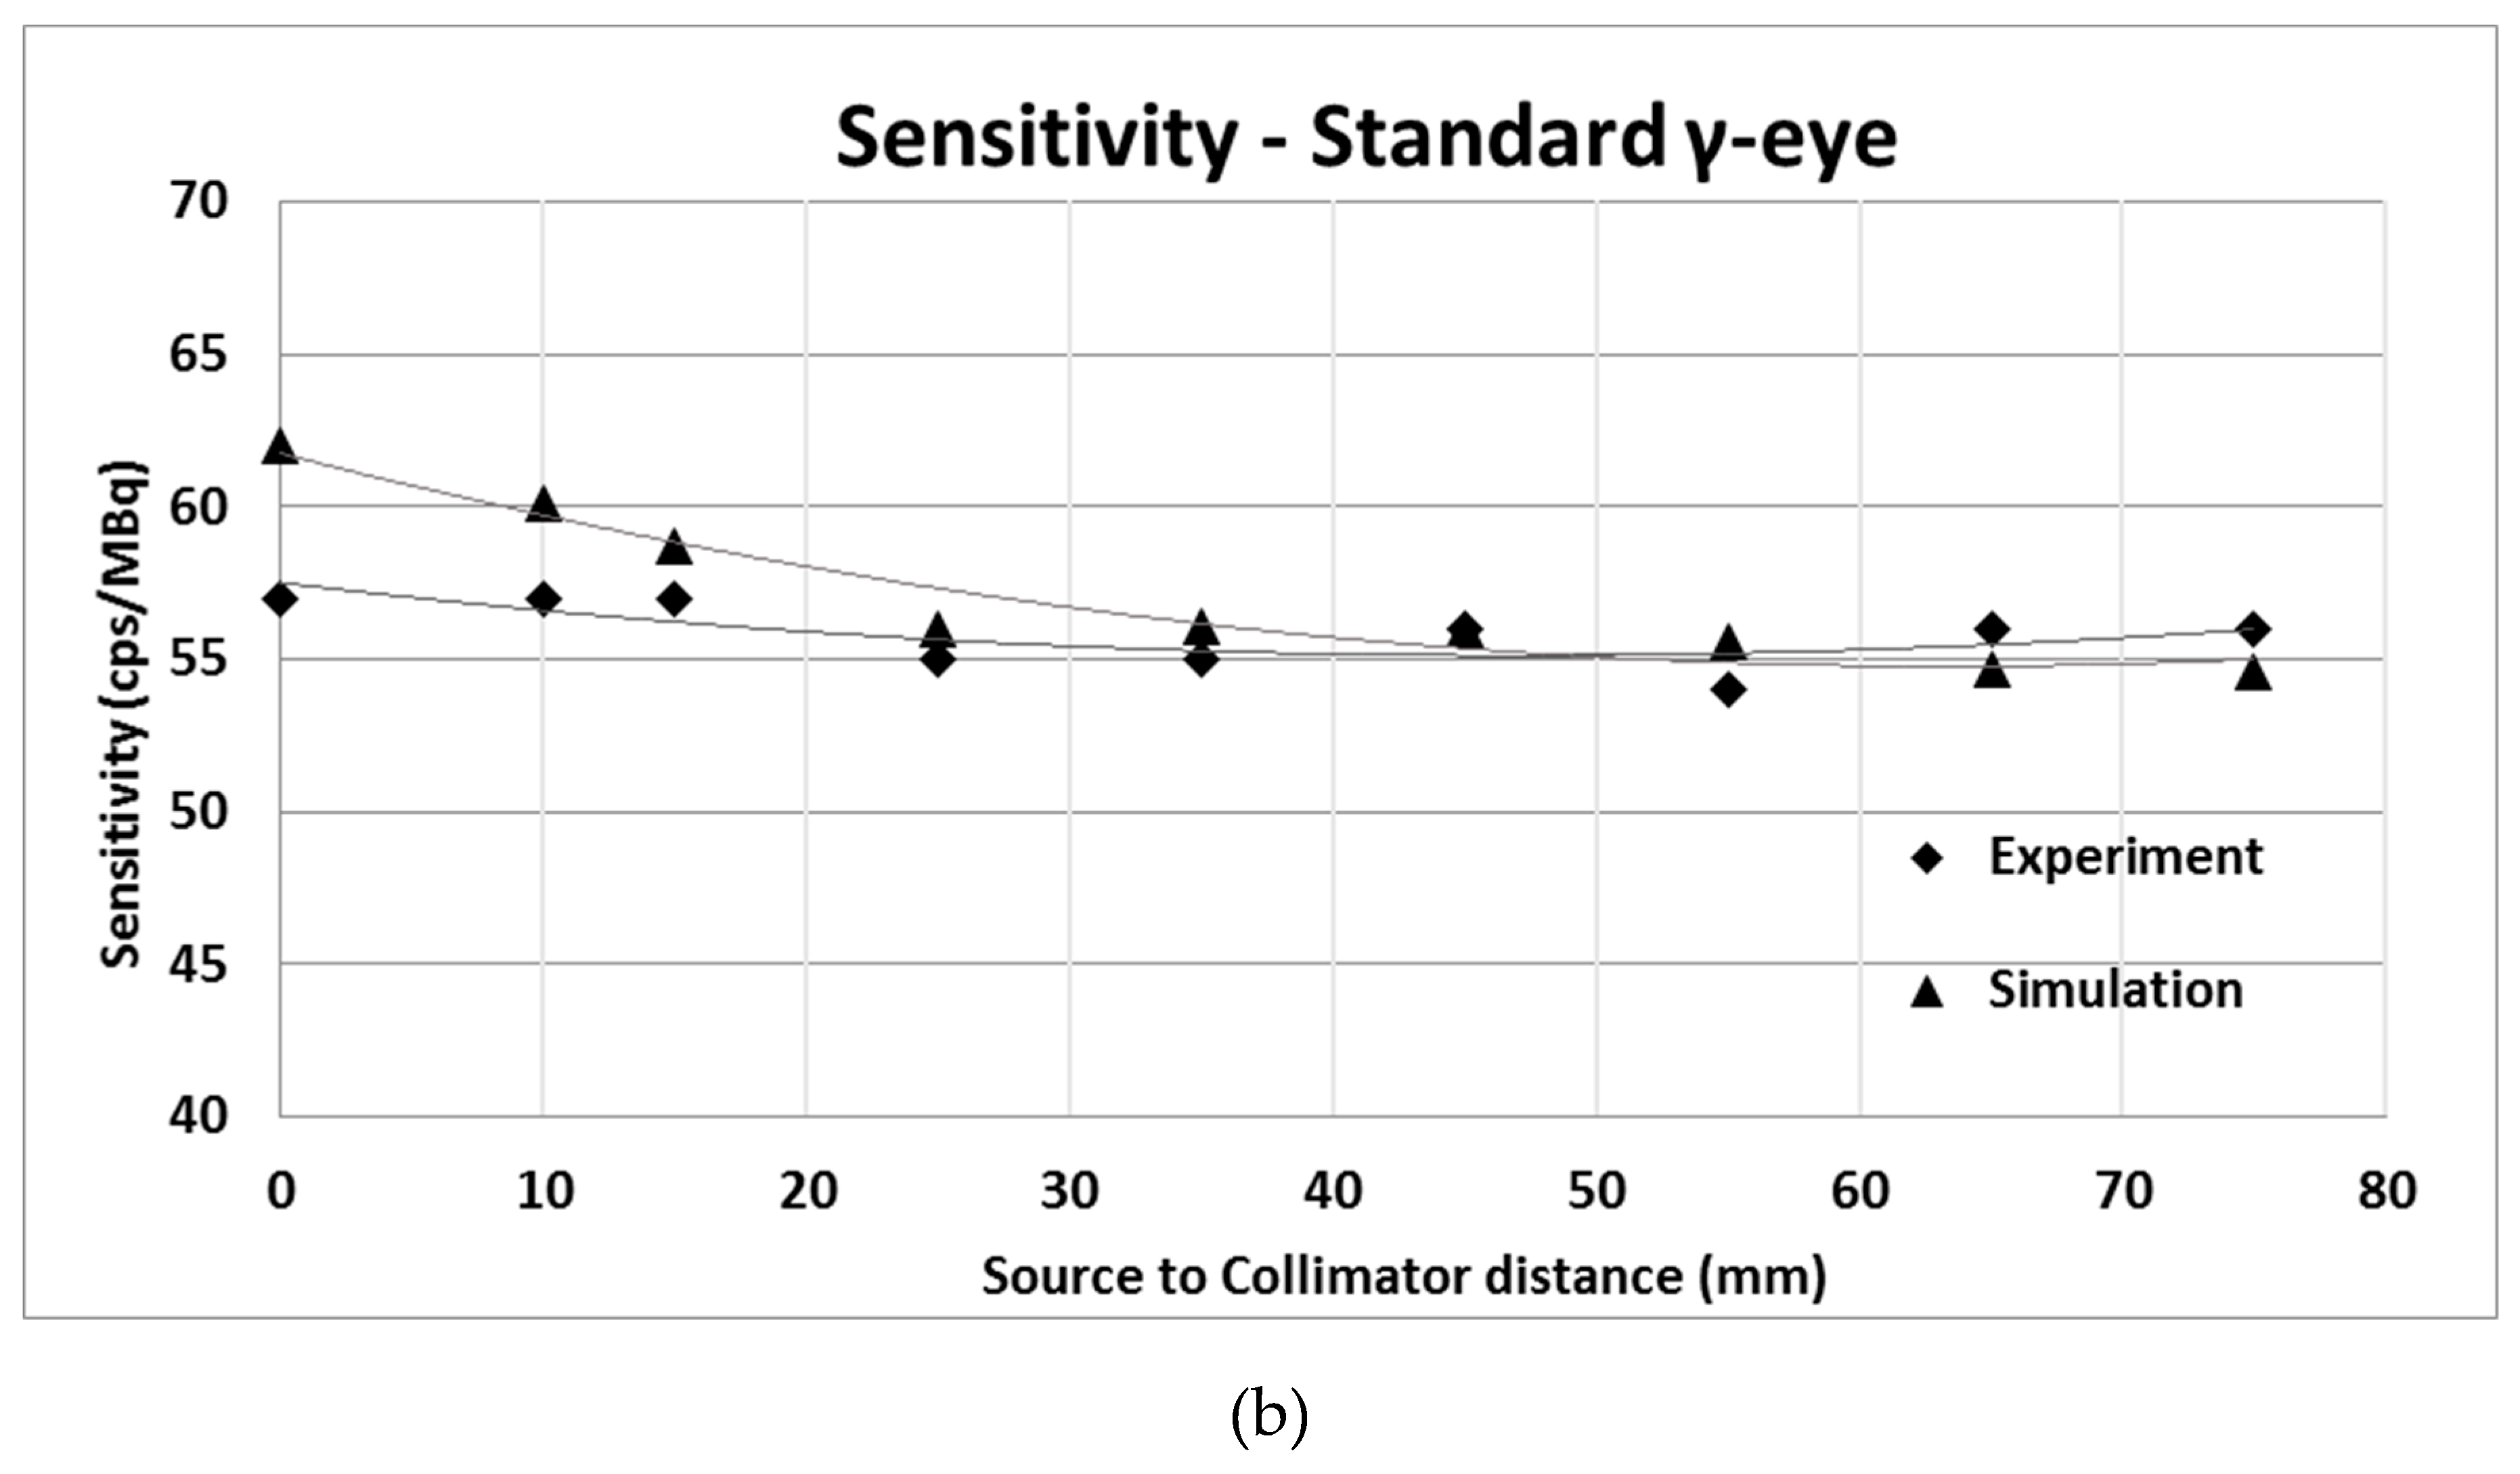
3.1. Standard Model Validation

Sensitivity and spatial resolution values were calculated and compared for both the experiment and the simulation, in accordance to the source to collimator distance and the results are illustrated in Figure 3. Simulation results of spatial resolution show a tendency to give slightly better values in all the distances examined with the maximum difference observed at 7.5 mm distance (5.85 mm experimental value versus 4.9 mm simulation value) that is equal to ~16%. In the case of sensitivity, the difference recorded in zero mm source-to-collimator distance (57 cps/MBq versus 63 cps/MBq) was ~10.5%. For all the other distances the difference in sensitivity was smaller and very close to the mean value of 56 cps/MBq.

3.2. Optical Model Validation

For the validation of the optical model, two simulations were performed, using the same radioactive capillary tube source (see Table 4) for both the optical and the standard model. Table 5, shows the results of energy resolution and spatial resolution values achieved by these simulations.
In particular, for the optical simulation, the energy resolution at zero source-to-collimator distance is calculated equal to 24.19% and 25.35% for the standard one, with a difference equal to ~4.6%. The calculated spatial resolution is equal to 1.88 mm for the optical simulation and 1.98 mm for the standard one, with a difference equal to ~5%. These values can be considered acceptable, due to some dissimilarities in the built geometries of the two simulation models. The optical model is only a portion of the real “γ-eye” system, which corresponds to the 5 × 5 pixelated crystals array portion. Moreover, the shielding structure that surrounds the γ-eye was not included in the optical model. Thus, the difference between the two models’ results was considered acceptable, validating the optical model.

3.3. Optical Simulations

The aim of this study was to analyze the performance of the optical model, built in GATE, by modifying the CsI:Na crystals thickness and the crystal reflector wrapping material (type and colour). Using three different configurations for the reflector material and five values of crystals thicknesses, a total of fifteen simulations were performed. The spatial resolution, the sensitivity and the light output parameters were calculated, and are summarized in Table 6.
Figure 4a,b show the raw image produced by the GATE and the modified image, after the integration of septa in the final image’s pixel. Figure 4c illustrates the capillary’s source profile along the x-axis for the central line.
The numerical results of the fifteen optical simulations are listed in the following table, while in Figure 5, Figure 6 and Figure 7 the measured parameters expressed as a function of CsI:Na crystal varying thicknesses are illustrated.
Regarding the sensitivity, the configuration with white TiO2 as a reflector material around the crystal elements has the best outcomes. In all cases, it records ~5 cps/MBq additional counts compared with the other two configurations examined, which instead have approximately similar values. It can also be noticed that the sensitivity improves as the crystals’ thickness increases in all three configurations as expected, due to the increased length of CsI:Na scintillator elements.
Concerning the light output, the configuration with only white TiO2 as a reflector material has the best outcomes. It can also be noticed that the light output value decreases as the crystals’ thickness increases in all three configurations as expected, due to the increase of scintillation light self-absorption by the CsI:Na scintillator mass.
Regarding the spatial resolution, as shown in Table 6 and in Figure 7, there is a remarkable difference between the different wrapping configurations. With black tape wrapping on the sides of the crystal and black TiO2 as a front reflector, there is a significant improvement in spatial resolution (3.4% improvement for 4 mm thick CsI:Na and 4.8% improvement for 5 mm thick CsI:Na). For the case of white TiO2 coating on the all sides of the crystals, the measured values in spatial resolution are degraded (increased) in all cases.

4. Discussion

In the present study, a GATE Monte Carlo optical model was built to examine the effect of scintillator crystals thicknesses, as well as the effect of different reflector (septa) materials in the main performance parameters of the imaging system. The study has been carried out on a commercially available gamma camera of small dimensions and specifically designed for animal, named “γ-eye”. Within these parameters, the simulated “γ-eye” system was firstly validated against experimental data. Then, part of the validated camera was modeled, defining all of the optical properties by means of the UNIFIED optical model of GATE. Finally, different CsI:Na scintillator crystals, with varying thicknesses (from 4 mm up to 6 mm), and different reflector (septa) materials (TiO2, Black Tape), were simulated and compared in terms of: sensitivity, crystal’s light output and spatial resolution. The simulation results can be utilized by other researchers that work in gamma detectors that use CsI:Na pixelated scintillator arrays.
Results have demonstrated the reliability of the model and indicate that the thicker CsI:Na crystal array (6 mm thick) presents higher sensitivity values, but with lower light output and slightly degraded spatial resolution properties. The sensitivity value is a very important parameter and must be very high in small animal imaging systems in order to perform a fast planar imaging of the radiopharmaceuticals. Moreover, the use of black tape around crystals leads to an improvement in spatial resolution values compared to a standard white TiO2 reflector. By the simulations outcome, it can be seen that using the white TiO2 as wrapping reflector of the crystals has increased the number of detected events producing signals inside the energy window of the photopeak, while using the black tape decreases this number. The color of the front reflector layer did not significantly affect the sensitivity. As the white TiO2 wrapping reflector allows for having more events in the energy window, accordingly at the same activity source, the sensitivity is increased.
Regarding the spatial resolution, the best value was obtained in the configuration of black tape coating and in the case of a thinner crystal array (4 mm thick). As shown in Table 6, there is a light output difference of some hundreds of photons between the white TiO2 reflector material and the use of black tape. This difference suggests that the amount of the multi reflected optical photons that travel towards the edges of the crystal, in the case of white TiO2, degrades the spatial resolution, since the light is spread over a higher angle, and reduces the useful field of view (FoV) of the gamma cameras [17]. The FoV was reduced, because the amount of the reflected light collected near the edges of the crystals is enough to mislead, from the correct position of gamma events, the position algorithm that is used to readout the PSPMT. Since small gamma cameras commonly suffer from excessively small FoVs, the crystal sides should be treated with a nonreflective coating such as black tape, sacrificing the light collection for improved spatial resolution and larger useful FoV. This problem is higher in the scintillator crystals placed at the edges of the scintillator array, which are usually very difficult to be distinguished and mapped.
Measuring how the sensitivity changes as a function of the spatial resolution should help in deciding whether the potential improvement in spatial resolution is worth the potential loss in sensitivity or light output of the crystals. For example, the “γ-eye” system can improve its performance using the 6 mm thick CsI:Na scintillator array with nonreflective material for all crystals surfaces (black tape as crystals sides reflector and a black surface as crystals front reflector material) increasing its sensitivity from 62.00 to 67.24 cps/MBq (+8.5%), keeping the spatial resolution value stable at 1.88 mm with no distance between the source and the collimator. However, in this case, the crystal’s light output is reduced: the optical photons that reach the photodetector decrease by 24% (from 4377 to 3326).

Author Contributions

Conceptualization, S.D.; Investigation, R.R., K.C. and L.M.; Methodology, T.K., E.F., L.M., L.S., D.R. and S.D.; Supervision, L.S. and S.D.; Validation, E.F.; Writing—original draft, R.R., T.K. and K.C.; Writing—review & editing, R.R., E.F., G.L., L.M., D.R. and S.D.

Funding

This research received no external funding.

Acknowledgments

This work was partially supported by an Erasmus Plus Traineeship educational program between the Department of Biomedical Engineering of the University of West Attica in Athens and the Faculty of engineering of the Università Politecnica delle Marche, Ancona.

Conflicts of Interest

The authors declare no conflict of interest.

References

  1. Roncali, E.; Cherry, S.R. Simulation of light transport in scintillators based on 3D characterization of crystal surfaces. Phys. Med. Biol. 2013, 58, 2185–2198. [Google Scholar] [CrossRef] [PubMed] [Green Version]
  2. Stockhoff, M.; Jan, S.; Dubois, A.; Cherry, S.R.; Roncali, E. Advanced optical simulation of scintillation detectors in GATE V8.0: First implementation of a reflectance model based on measured data. Phys. Med. Biol. 2017, 62, L1. [Google Scholar] [CrossRef] [PubMed]
  3. Berg, E.; Roncali, E.; Cherry, S.R. Optimizing light transport in scintillation crystals for time-of-flight PET: An experimental and optical Monte Carlo simulation study. Biomed. Opt. Express 2015, 6, 2220–2230. [Google Scholar] [CrossRef] [PubMed]
  4. van der Laan, D.J.; Schaart, D.R.; Maas, M.C.; Beekman, F.J.; Bruyndonckx, P.; van Eijk, C.W.E. Optical simulation of monolithic scintillator detectors using GATE/GEANT4. Phys. Med. Biol. 2010, 55, 1659–1675. [Google Scholar] [CrossRef] [PubMed] [Green Version]
  5. Roncali, E.; Stockhoff, M.; Cherry, S.R. An integrated model of scintillator-reflector properties for advanced simulations of optical transport. Phys. Med. Biol. 2017, 62, 4811–4830. [Google Scholar] [CrossRef] [PubMed]
  6. Agostinelli, S.; Allisona, J.; Amako, K.; Apostolakis, J.; Araujo, H.; Arce, P.; Asai, M.; Axen, D.; Banerjee, S.; Barrand, G. GEANT4—A simulation toolkit. Nucl. Instrum. Methods A 2003, 506, 250–303. [Google Scholar] [CrossRef]
  7. Jan, S.; Allison, J.; Amako, K.; Apostolakis, J.; Araujo, H.; Arce, P.; Asai, M.; Axen, D.; Banerjee, S.; Barrand, G.; et al. GATE: A simulation toolkit for PET and SPECT. Phys. Med. Biol. 2004, 49, 4543–4561. [Google Scholar] [CrossRef] [PubMed]
  8. Janecek, M.; Moses, W. Simulating scintillator light collection using measured optical reflectance. IEEE Trans. Nucl. Sci. 2010, 57, 964–970. [Google Scholar] [CrossRef]
  9. Nayar, S.K.; Ikeuchi, K.; Kanade, T. Surface reflection: Physical and geometrical perspectives. IEEE Trans. Pattern Anal. Mach. Intell. 1991, 13, 611–634. [Google Scholar] [CrossRef]
  10. Nilsson, J.; Cuplov, V.; Isaksson, M. Identifying key surface parameters for optical photon transport in GEANT4/GATE simulations. Appl. Radiat. Isot. 2015, 103, 15–24. [Google Scholar] [CrossRef]
  11. Taherparvar, P.; Sadremomtaz, A. Development of GATE Monte Carlo simulation for a CsI pixelated gamma camera dedicated to high resolution animal SPECT. Phys. Eng. Sci. Med. 2018, 41, 31–39. [Google Scholar] [CrossRef]
  12. Ghabriala, A.; Franklin, D.; Zaidi, H. A Monte Carlo simulation study of the impact of novel scintillation crystals on performance characteristics of PET scanners. Phys. Med. Eur. J. Med Phys. 2018, 50, 37–45. [Google Scholar] [CrossRef] [PubMed] [Green Version]
  13. Ghazanfari, N.; Sarkar, S.; Loudos, G.; Ay, M.R. Quantitative assessment of crystal material and size on the performance of rotating dual head small animal PET scanners using Monte Carlo modeling. Hell. J. Nucl. Med. 2012, 15, 33–39. [Google Scholar] [PubMed]
  14. Inoue, T.; Oriuchi, N.; Koyama, K.; Ichikawa, A.; Tomiyoshi, K.; Sato, N.; Matsubara, K.; Suzuki, H.; Aoki, J.; Endo, K. Usefulness of dual-head coincidence gamma camera with thick NaI crystals for nuclear oncology: Comparison with dedicated PET camera and conventional gamma camera with thin NaI crystals. Ann. Nucl. Med. 2001, 15, 141–148. [Google Scholar] [CrossRef] [PubMed]
  15. Surti, S.; Werner, M.E.; Karp, J.S. Study of PET scanner designs using clinical metrics to optimize the scanner axial FOV and crystal thickness. Phys. Med. Biol. 2013, 58, 3995–4012. [Google Scholar] [CrossRef] [Green Version]
  16. Smith, T.; Jasani, B.M. Assessment of various reflectors used with rectangular scintillation detectors. J. Phys. E 1972, 5, 1083–1088. [Google Scholar] [CrossRef]
  17. McElroy, D.P.; Huang, S.C.; Hoffman, E.J. The Use of Retro-Reflective Tape for Improving Spatial Resolution of Scintillation Detectors. IEEE Trans. Nucl. Sci. 2002, 49, 165–171. [Google Scholar] [CrossRef]
  18. Bioemtech. Available online: http://bioemtech.com/γ-eye/ (accessed on 31 July 2019).
  19. Georgiou, M.; Fysikopoulos, E.; Mikropoulos, K.; Fragogeorgi, E.; Loudos, G. Characterization of “γ-Eye”: A Low-Cost Benchtop Mouse-Sized Gamma Camera for Dynamic and Static Imaging Studies. Mol. Imaging Biol. 2016, 19, 398–407. [Google Scholar] [CrossRef]
  20. Calvi, M.; Carniti, P.; Cassina, L.; Gotti, C.; Maino, M.; Matteuzzi, C.; Pessina, G. Characterization of the Hamamatsu H12700A-03 and R12699-03 multi-anode photomultiplier tubes. J. Instrum. 2015, 10, P09021. [Google Scholar] [CrossRef]
  21. Rakić, A.D. Algorithm for the determination of intrinsic optical constants of metal films: Application to aluminium. Appl. Opt. 1995, 34, 4755–4767. [Google Scholar] [CrossRef]
  22. Nelson, G.; Reilly, D. Gamma-Ray Interactions with Matter. In Passive Non-Destructive Analysis of Nuclear Materials; Los Alamos National Laboratory: Los Alamos, NM, USA, 1991; pp. 27–42. Available online: http://faculty.washington.edu/agarcia3/phys575/Week2/Gamma%20ray%20interactions.pdf (accessed on 31 July 2019).
  23. DeVore, J.R. Refractive index of Rutile and Sphalerite. J. Opt. Soc. Am. 1951, 41, 416–419. [Google Scholar] [CrossRef]
  24. Kim, S.Y. Simultaneous determination of refractive index, extinction coefficient, and void distribution of titanium dioxide thin film by optical methods. Appl. Opt. 1996, 35, 6703–6707. [Google Scholar] [CrossRef]
  25. Liu, T.; Henderson, C.L.; Samuels, R. Quantitative Characterization of the Optical Properties of Absorbing Polymer Films: Comparative Investigation of the Internal Reflection Intensity Analysis Method. J. Polym. Sci. Part B Polym. Phys. 2003, 41, 842–855. [Google Scholar] [CrossRef]
  26. SCHOTT. Optical glass Data Sheets. Available online: https://www.schott.com/advanced_optics (accessed on 31 July 2019).
  27. AMCRYS. Scintillation Material Data Sheet—Alkali Halide Scintillation Crystals. 2009. Available online: http://www.amcrys.com/pdf/4281_.pdf (accessed on 31 July 2019).
  28. NEMA. Standard Publication NU 1-2007 Performance Measurements of Gamma Cameras; National Electrical Manufacturers Association: Rosslyn, VA, USA, 2007. [Google Scholar]
  29. Sajedi, S.; Zeraatkar, N.; Moji, V.; Farahani, M.H.; Sarkar, S.; Arabi, H.; Teymoorian, B.; Ghafarian, P.; Rahmim, A.; Ay, R.M. Design and development of a high resolution animal SPECT scanner dedicated for rat and mouse imaging. Nucl. Instrum. Methods Phys. Res. Sect. A Accel. Spectrometers Detect. Assoc. Equip. 2014, 741, 169–176. [Google Scholar] [CrossRef]
  30. Bhatia, B.S.; Bugby, S.L.; Lees, J.E.; Perkins, A.C. A scheme for assessing the performance characteristics of small field-of-view gamma cameras. Phys. Med. 2015, 31, 98–103. [Google Scholar] [CrossRef]
  31. Loudos, G.; Majewski, S.; Wojcik, R.; Weisenberger, A.; Sakellios, N.; Nikita, K.; Uzunoglu, N.; Bouziotis, P.; Xanthopoulos, S.; Varvarigou, A. Performance evaluation of a dedicated camera suitable for dynamic radiopharmaceuticals evaluation in small animals. IEEE Trans. Nucl. Sci. 2007, 54, 454–460. [Google Scholar] [CrossRef]
  32. Bugby, S.L.; Lees, J.E.; Bhatia, B.S.; Perkins, C.A. Characterisation of a high resolution small field of view portable gamma camera. Phys. Med. 2014, 30, 331–339. [Google Scholar] [CrossRef]
  33. Moji, V.; Zeraatkar, N.; Farahani, M.H.; Aghamiri, M.R.; Sajedi, S.; Teimourian, B.; Ghafarian, P.; Sarkar, S.; Ay, M.R. A Performance evaluation of a newly developed high-resolution, dual-head animal SPECT system based on the NEMA NU1-2007 standard. J. Appl. Clin. Med Phys. 2014, 15, 267–278. [Google Scholar] [CrossRef]
  34. Abramoff, M.; Magalhaes, P.; Ram, S. Image processing with ImageJ. Biophotonics Int. 2004, 11, 36–42. [Google Scholar]
  35. Collins, T.J. ImageJ for microscopy. Biotechniques 2007, 43, 25–30. [Google Scholar] [CrossRef]
Figure 1. (a) Photograph of the γ-eye benchtop system; (b) Schematic illustration of its detector.
Crystals 09 00398 g001
Figure 2. (a) A 3D geometry illustration of the “γ-eye” optical model implemented in GATE (on an unrealistic scale). (b) Model section in the z, x plane. The green cylinder represents the capillary radioactive tube source; the yellow plane represents the aluminum layer; the collimator is illustrated in grey; the two aluminum layers separated by an air layer with borders in light blue; the reflector layer with borders in green; the pixelated crystals array in blue with reflector septa in black; and the glass layer with red borders in panel (a) and in yellow in panel (b).
Crystals 09 00398 g002
Figure 3. Experimental and simulation results of (a) spatial resolution and (b) sensitivity values as a function of the source to collimator distance of the “γ-eye”. The values obtained from experiments are represented with dots with rhombuses while the ones obtained from the GATE simulations have triangular points.
Crystals 09 00398 g003aCrystals 09 00398 g003b
Figure 4. (a) Example of the capillary source raw image produced by GATE and (b) final image obtained after the removal of the gaps between pixels of the raw image of GATE. (c) The capillary’s source profile along the x-axis from the central line. Dots line represent the Gaussian fitting.
Crystals 09 00398 g004
Figure 5. Sensitivity of the optical simulations expressed as a function of the CsI:Na varying crystal thicknesses with three different configurations for the reflector materials. The values obtained with white TiO2 as a reflector material are represented with circle dots; square dots used for the values obtained with black tape around and white TiO2 as a front reflector of scintillator elements; triangular points used for values acquired with black tape surround and black TiO2 as a front reflector materials.
Crystals 09 00398 g005
Figure 6. Light output of the optical simulations expressed in function of the crystal thickness.
Crystals 09 00398 g006
Figure 7. Spatial resolution of the optical simulations expressed in function of the crystal thickness.
Crystals 09 00398 g007
Table 1. Specification properties of the commercially available γ-eye device. The spatial resolution value refers to a scenario in which the distance between source and collimator is zero; the energy resolution value refers to an emission of 140 keV.
Propertiesγ-Eye
Useful Field of View (UFoV)48 mm × 98 mm
Sensitivity within ±20% energy window56 cps/MBq
Spatial resolution2.2 mm @ 0 mm
Energy resolution24.5% @ 140 keV
Table 2. Values of refractive index (RI) and absorption length (AL) for the materials of the optical model. Each value is associated with a given optical photon energy value.
MaterialRefractive Index (RI)Energy Value (RI) [eV]Absorption Length (AL) [m]Energy Value (AL) [keV]
Aluminium1.19782.11 0.029288
0.030864
0.044052
100
200
500
Lead3.6371.95930 0.000154
0.000869
0.004672
100
200
500
Air1.00027
1.00027
1.84
4.08
50
50
1.84
4.08
TiO22.36
2.39
2.43
2.51
2.71
1.55
1.77
2.06
2.48
3.09
0.02 3.02
Black Tape1.522.28332 0.0000036 2.28332
Glass1.51401.85883 1000 1.23984
Table 3. Properties of the scintillator CsI:Na. The relevant values included between brackets (Italic style) represent the energy values associated with the corresponded property.
Refractive IndexAbsorption Length
[m]
Scintillation Yield
[photons/MeV]
Resolution ScaleFast Time Constant [ns]Yield RatioFast Component
1.84
(2.95 eV)
0.02
(0.51 eV)
0.33
(3.99 eV)
420005.2563011
(2.95 eV)
Table 4. Parameters and Characteristics used for the simulations performed for the validation of the optical model.
ParametersOptical Simulation with Linear SourceStandard Simulation with Linear Source
Scintillator detector 5 × 5 crystal
array
5 × 5 crystal
Array
Reflector material TiO2TiO2
Source dimensions
[mm]
Height: 8.7
Diameter: 0.6
Height: 8.7
Diameter: 0.6
Source activity [Bq]20006,216,000
Source energy [keV]140140
Source distance from collimator [mm]00
Simulation time
[s]
20,000349
Table 5. Energy resolution and spatial resolution values computed for the simulations performed for the optical model validation.
SimulationEnergy Resolution [%]Spatial Resolution [mm]
Optical simulation 24.191.88
Standard simulation 25.351.98
Table 6. Results of spatial resolution, sensitivity and light output values of the optical simulations.
Crystals Thickness [mm]Crystals Sides ReflectorCrystals Front ReflectorSensitivity [cps/MBq]Light OutputSpatial Resolution [mm]
4White TiO2White TiO249.6653811.75 ± 0.03
4Black TapeWhite TiO245.1851051.73 ± 0.02
4Black TapeTiO2 as black surface45.1548951.69 ± 0.05
4.5White TiO2White TiO255.2847871.80 ± 0.04
4.5Black TapeWhite TiO250.7845521.77 ± 0.05
4.5Black TapeTiO2 as black surface50.8243971.72 ± 0.04
“γ-eye” 5 White TiO2White TiO262.0043771.88 ± 0.03
5Black TapeWhite TiO255.5042151.83 ± 0.04
5Black TapeTiO2 as black surface56.3039191.79 ± 0.05
5.5White TiO2White TiO266.1939911.92 ± 0.03
5.5Black TapeWhite TiO262.0838151.87 ± 0.02
5.5Black TapeTiO2 as black surface60.8836711.83 ± 0.05
6White TiO2White TiO271.0036131.96 ± 0.04
6Black TapeWhite TiO267.4934611.91 ± 0.05
6Black TapeTiO2 as black surface67.2433261.88 ± 0.04

