An Accurate Method for Crystallographic Reconstruction of Parent Austenite from Inherited Martensite in a Low-Alloy Steel


Abstract
:1. Introduction
2. Experiment
3. Reconstruction Method
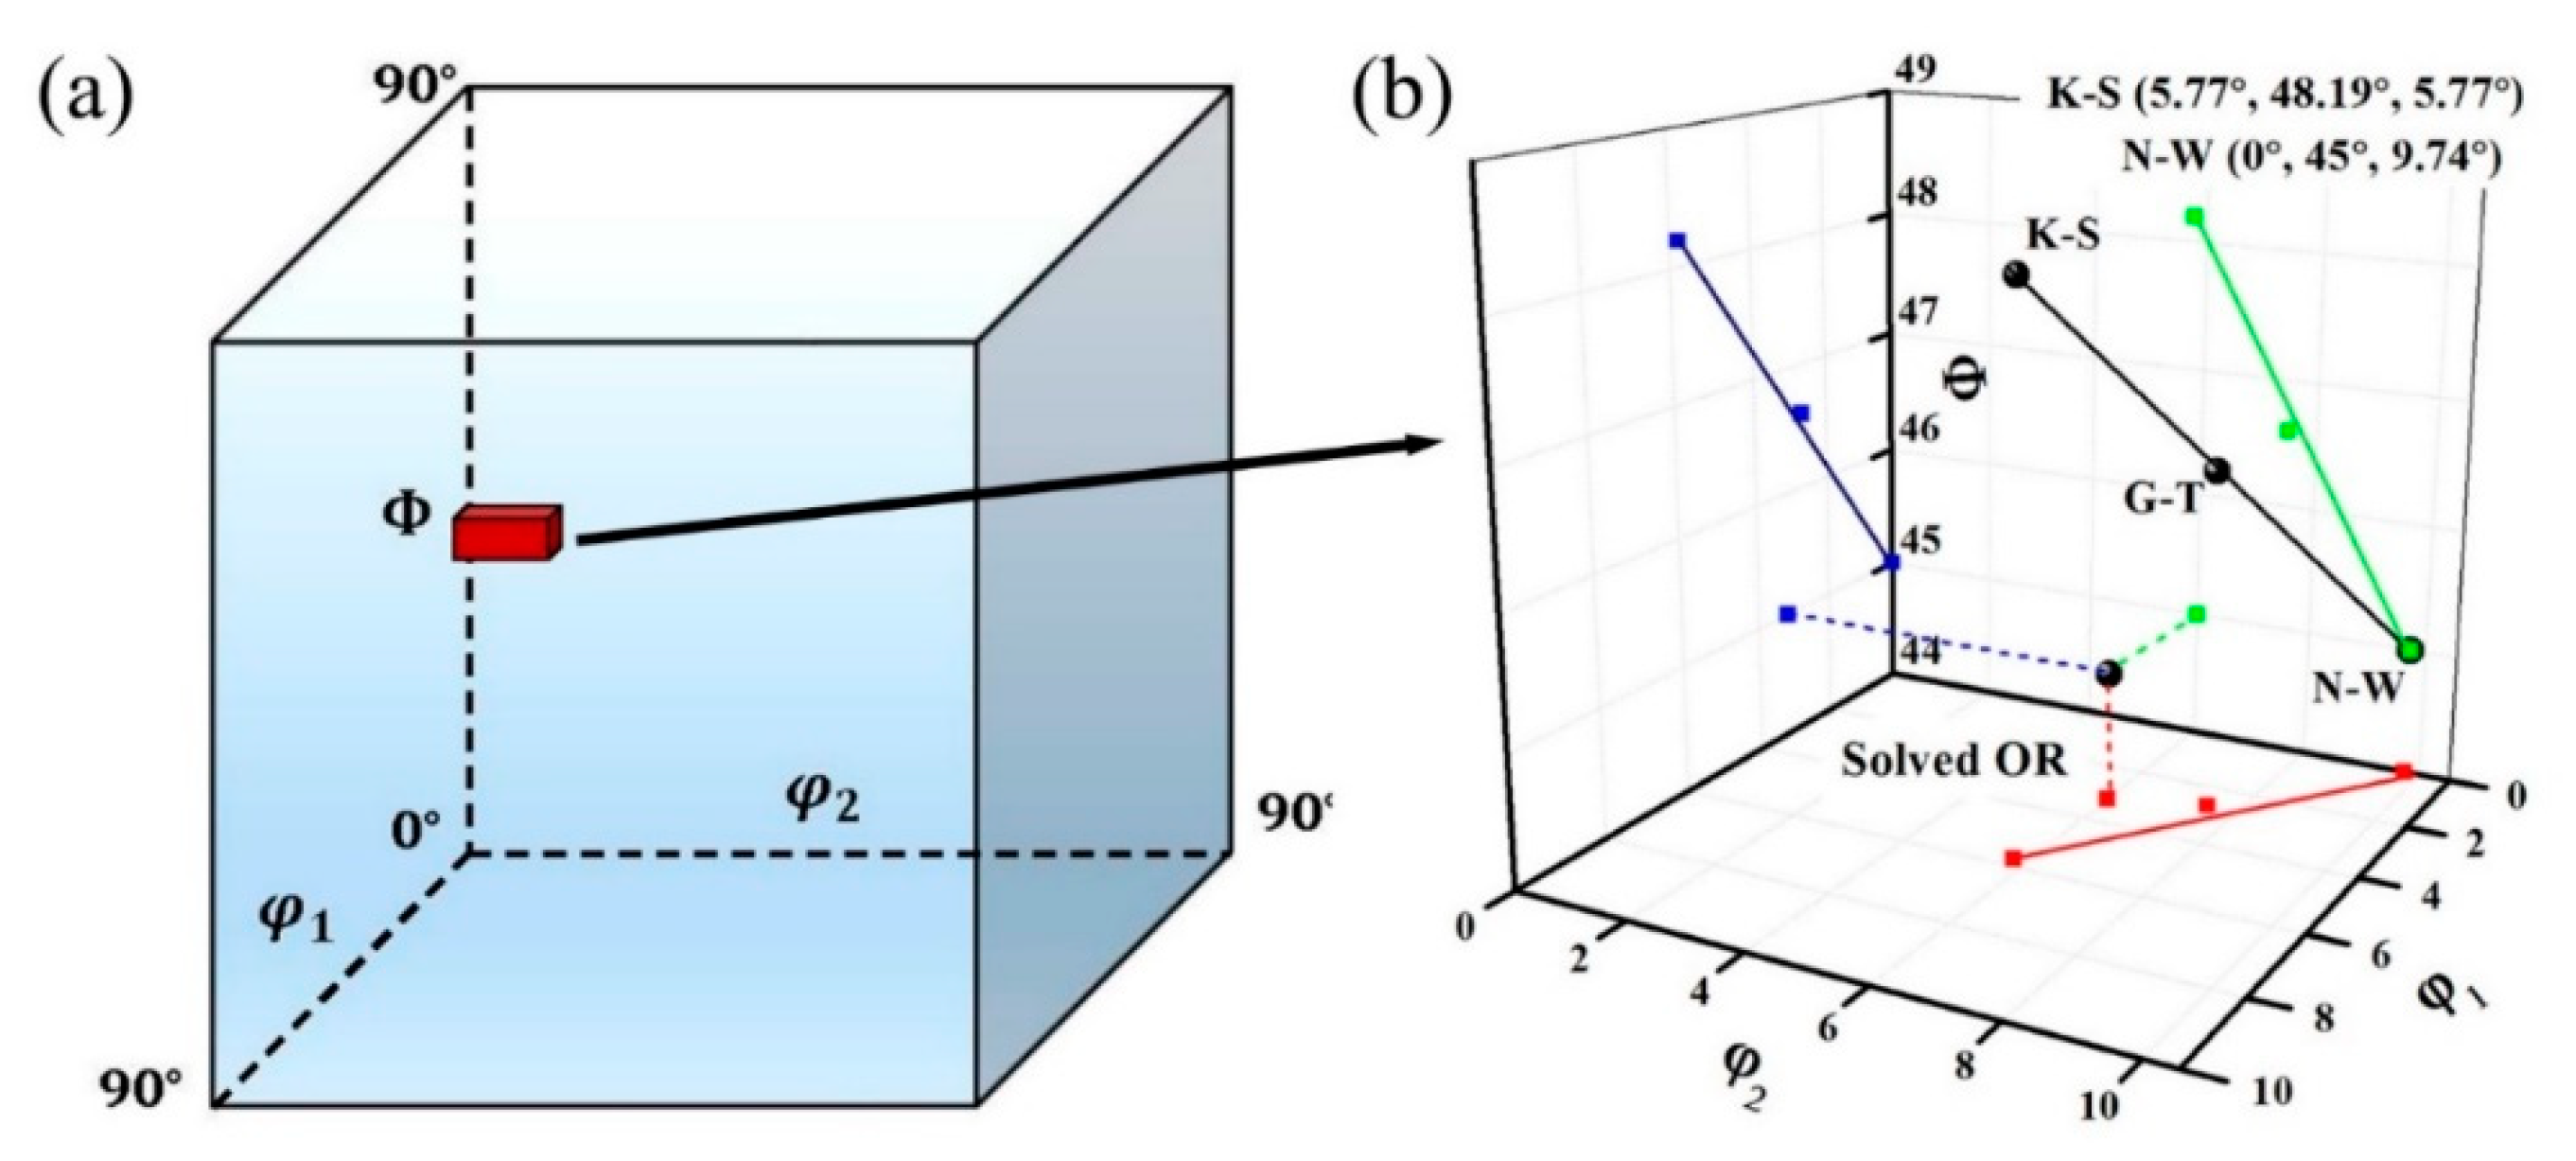
3.1. Precise Solution of the OR
3.2. Determination of the Local Orientation
4. Experimental Verification and Application
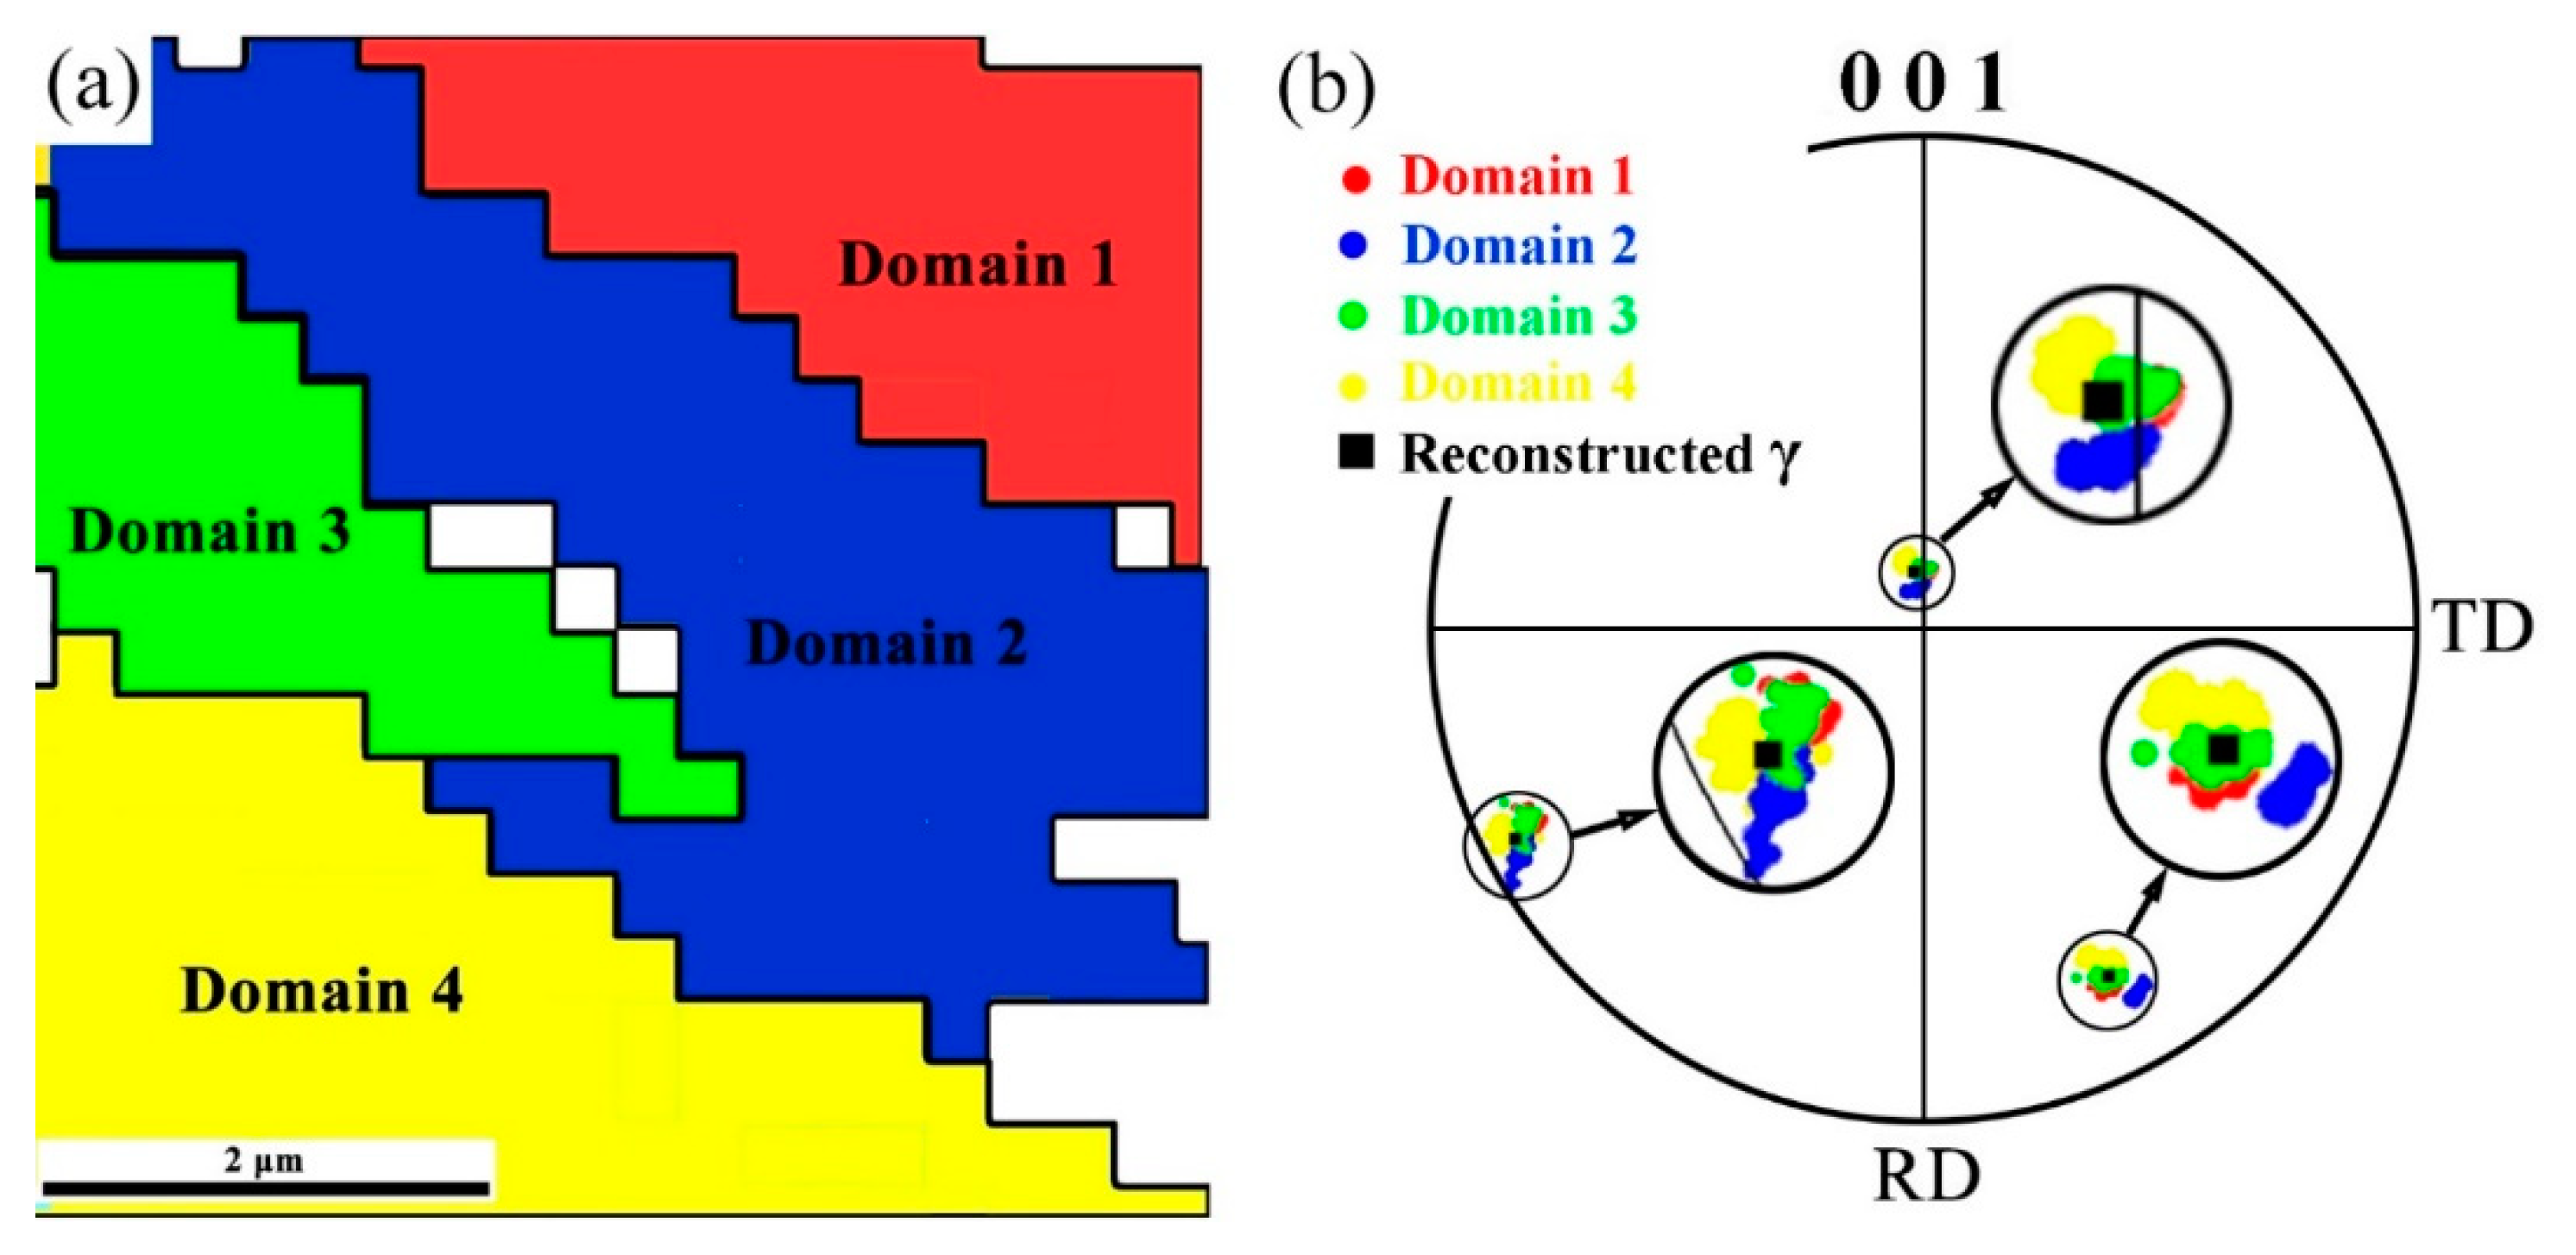
4.1. Verification
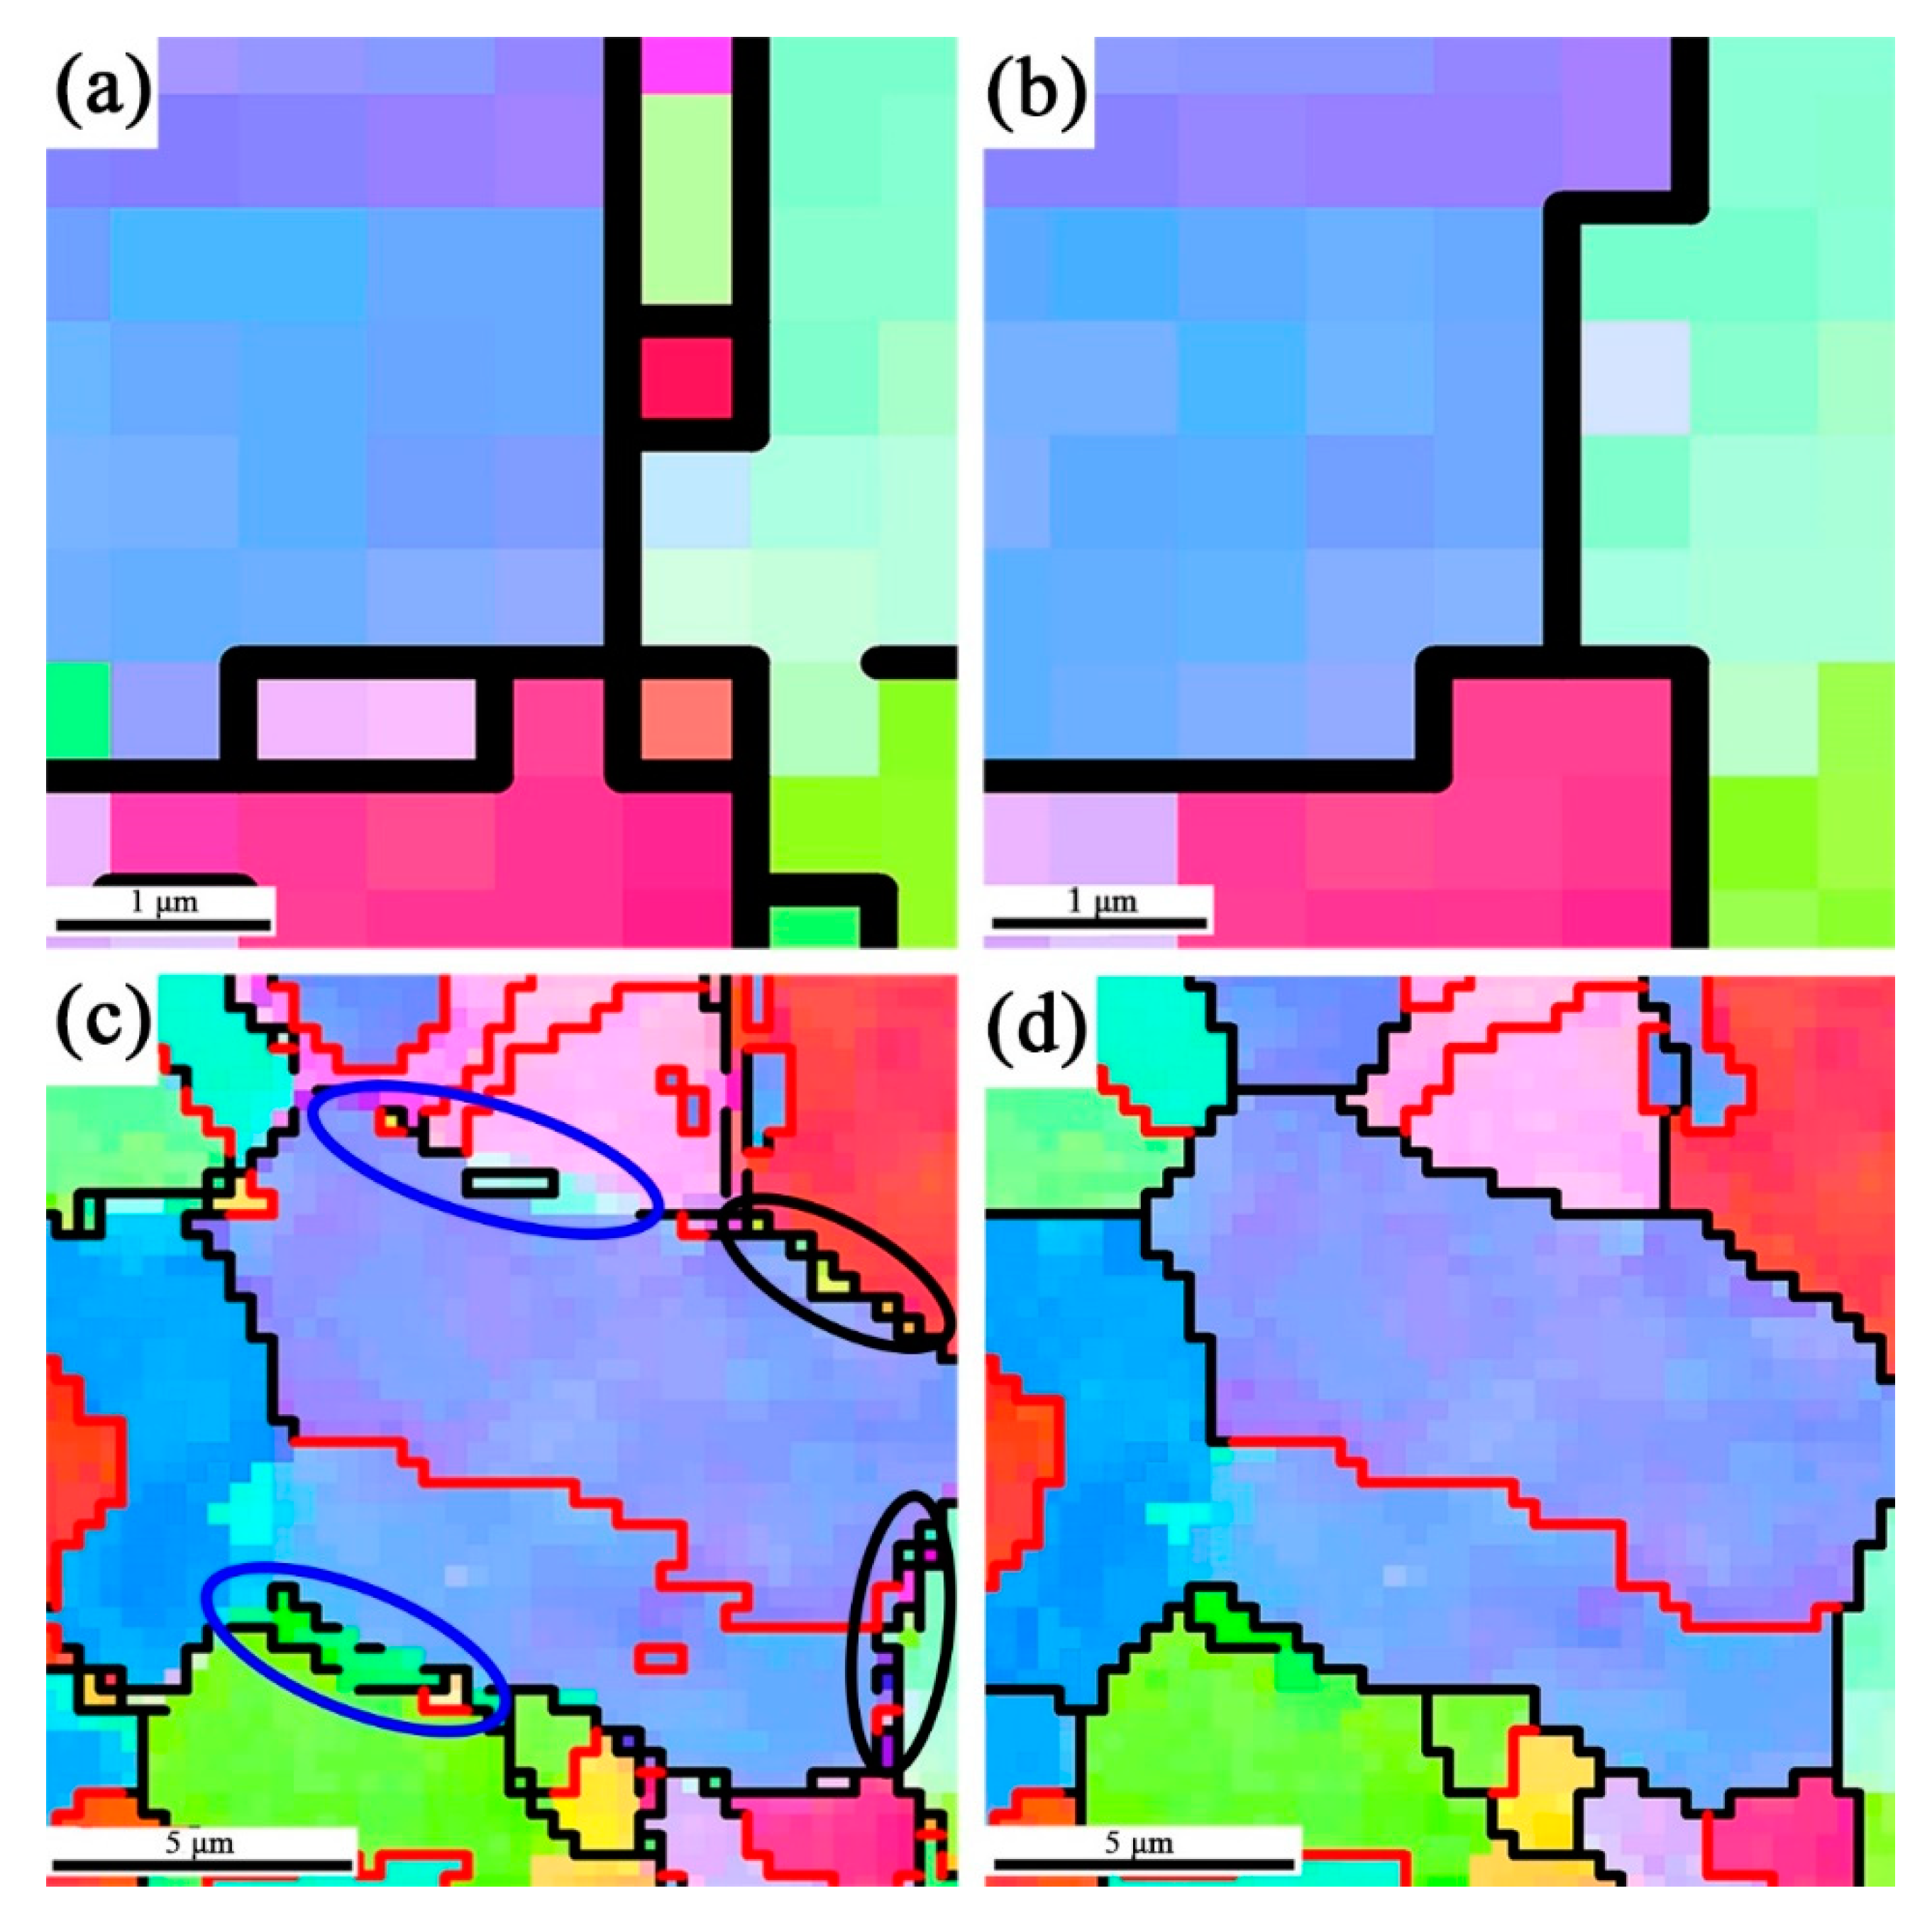
4.2. Application
5. Conclusions
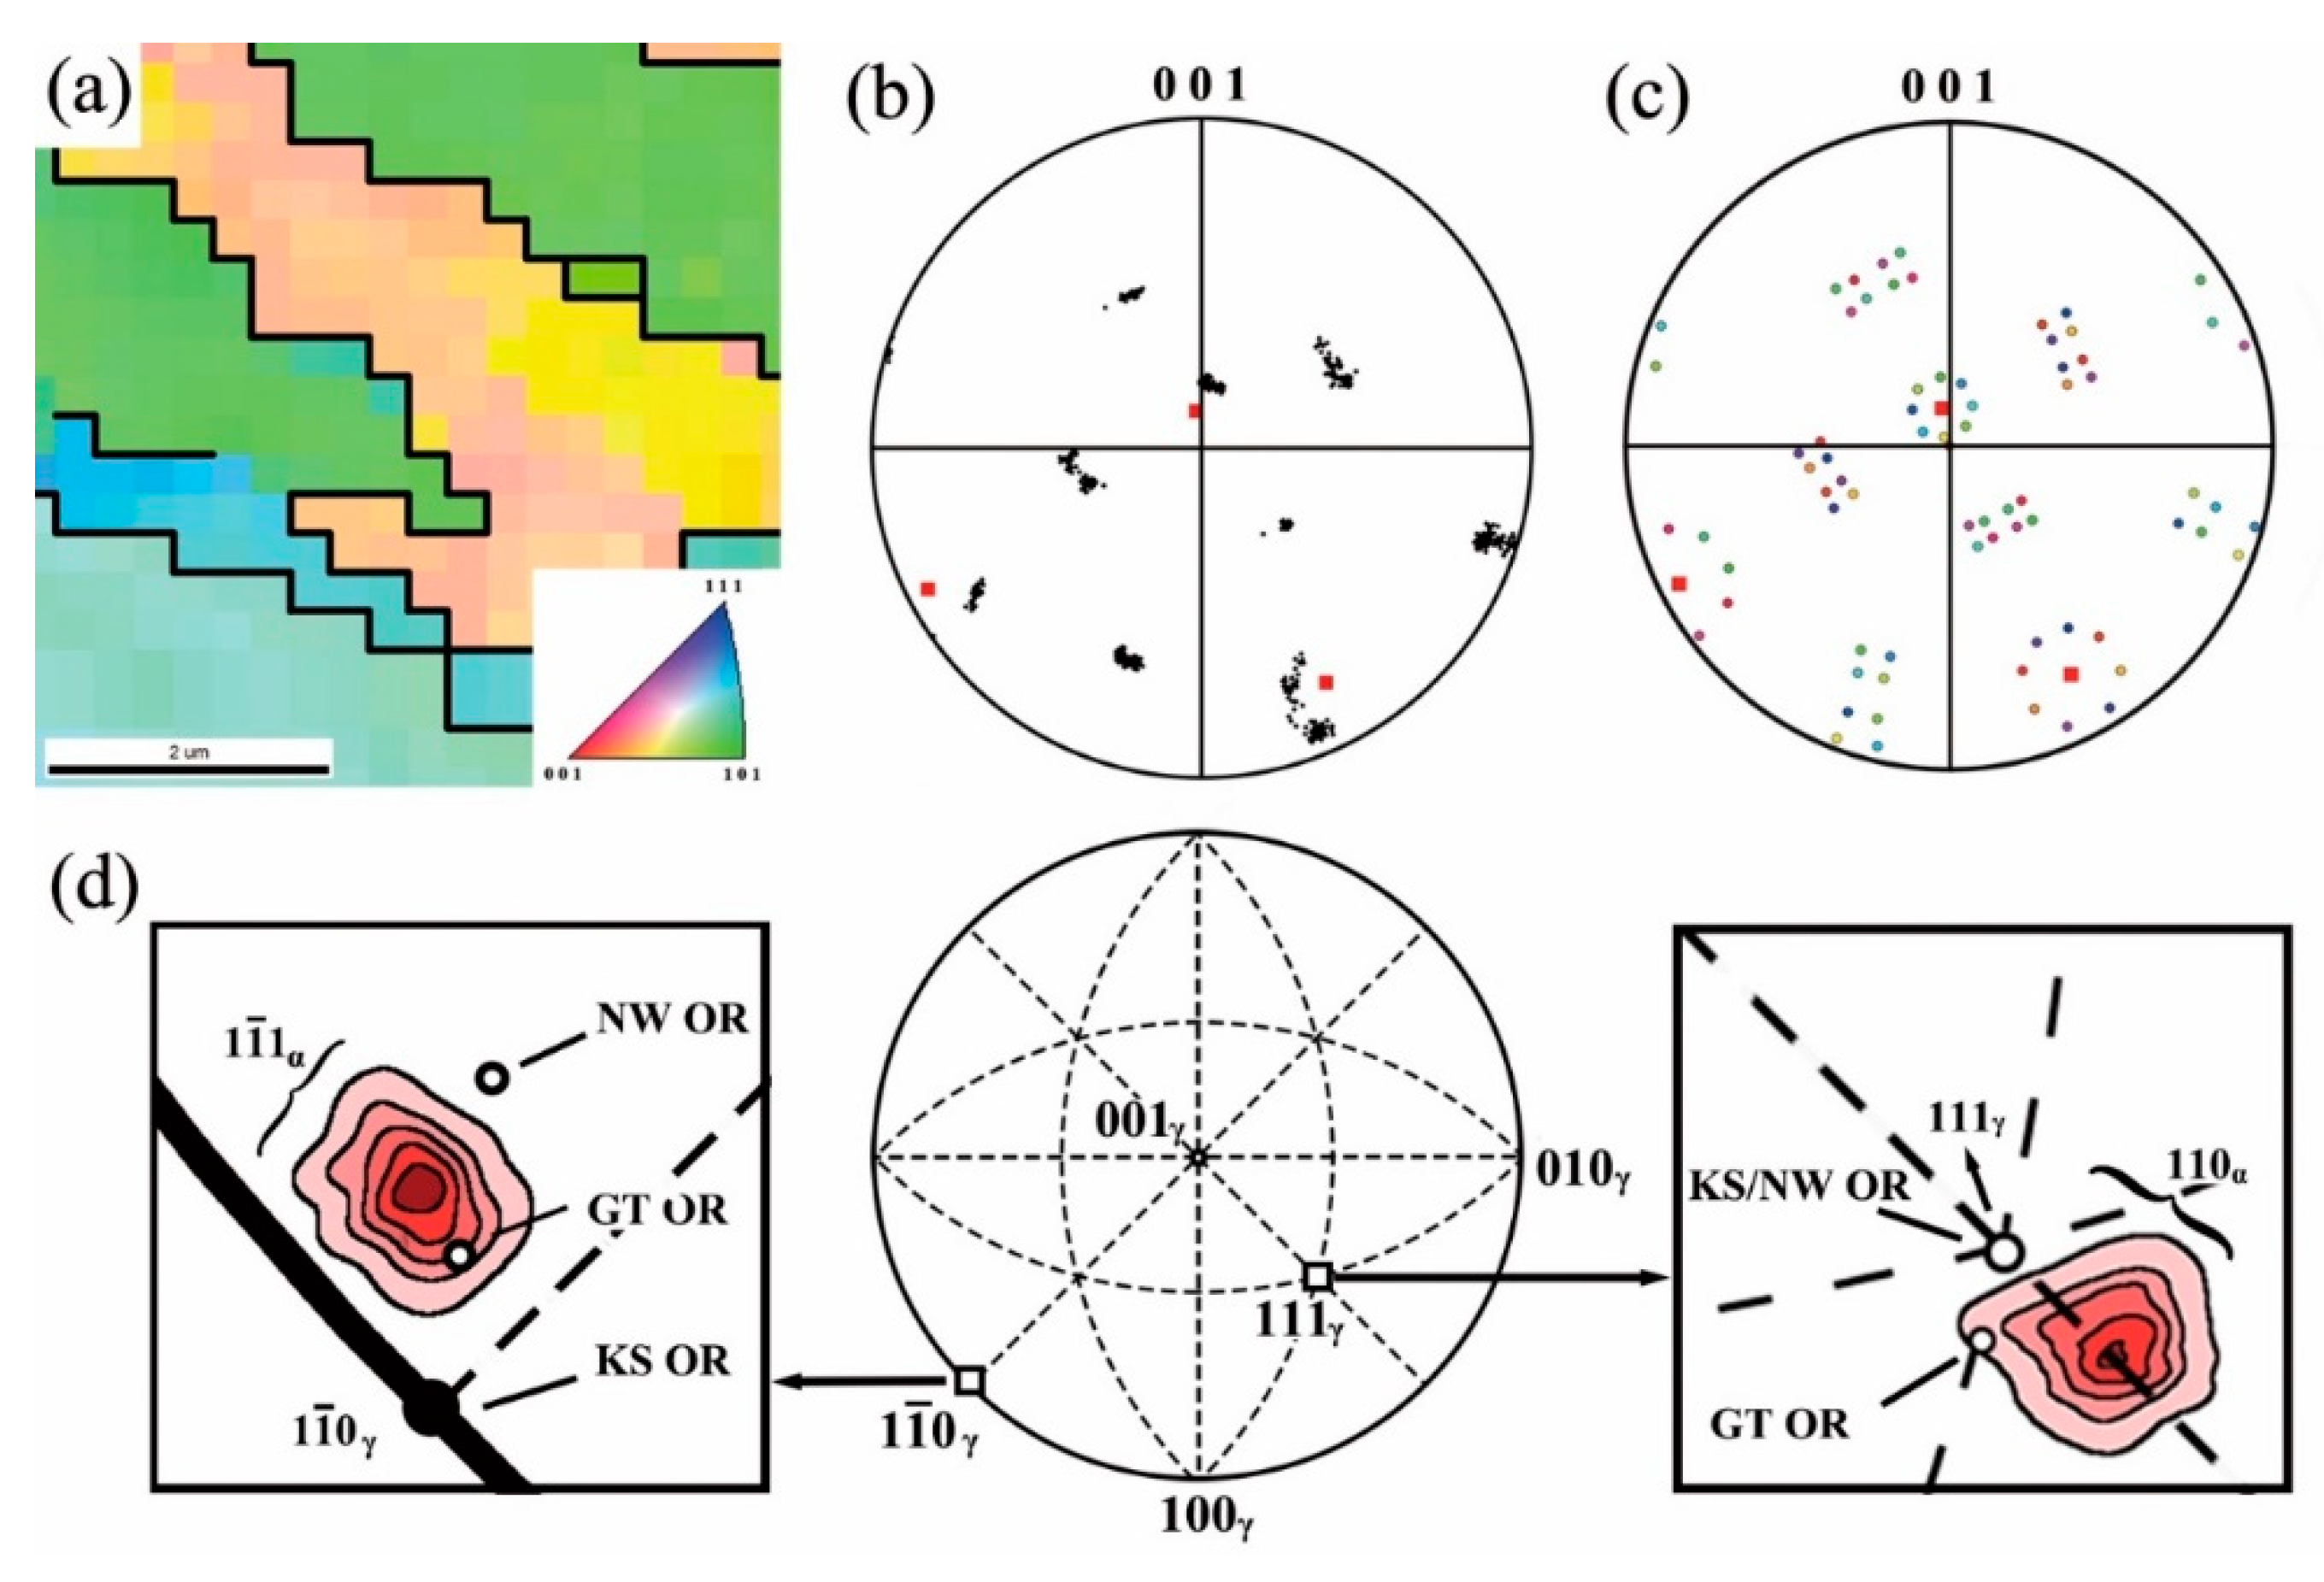
- A reduced solution space of Euler angles for the OR to be determined was proposed, based on the classical ORs. Thus, an average OR for this steel can be accurately determined with high calculation efficiency. The angular deviations between CPs and CDs were found to be and , respectively.
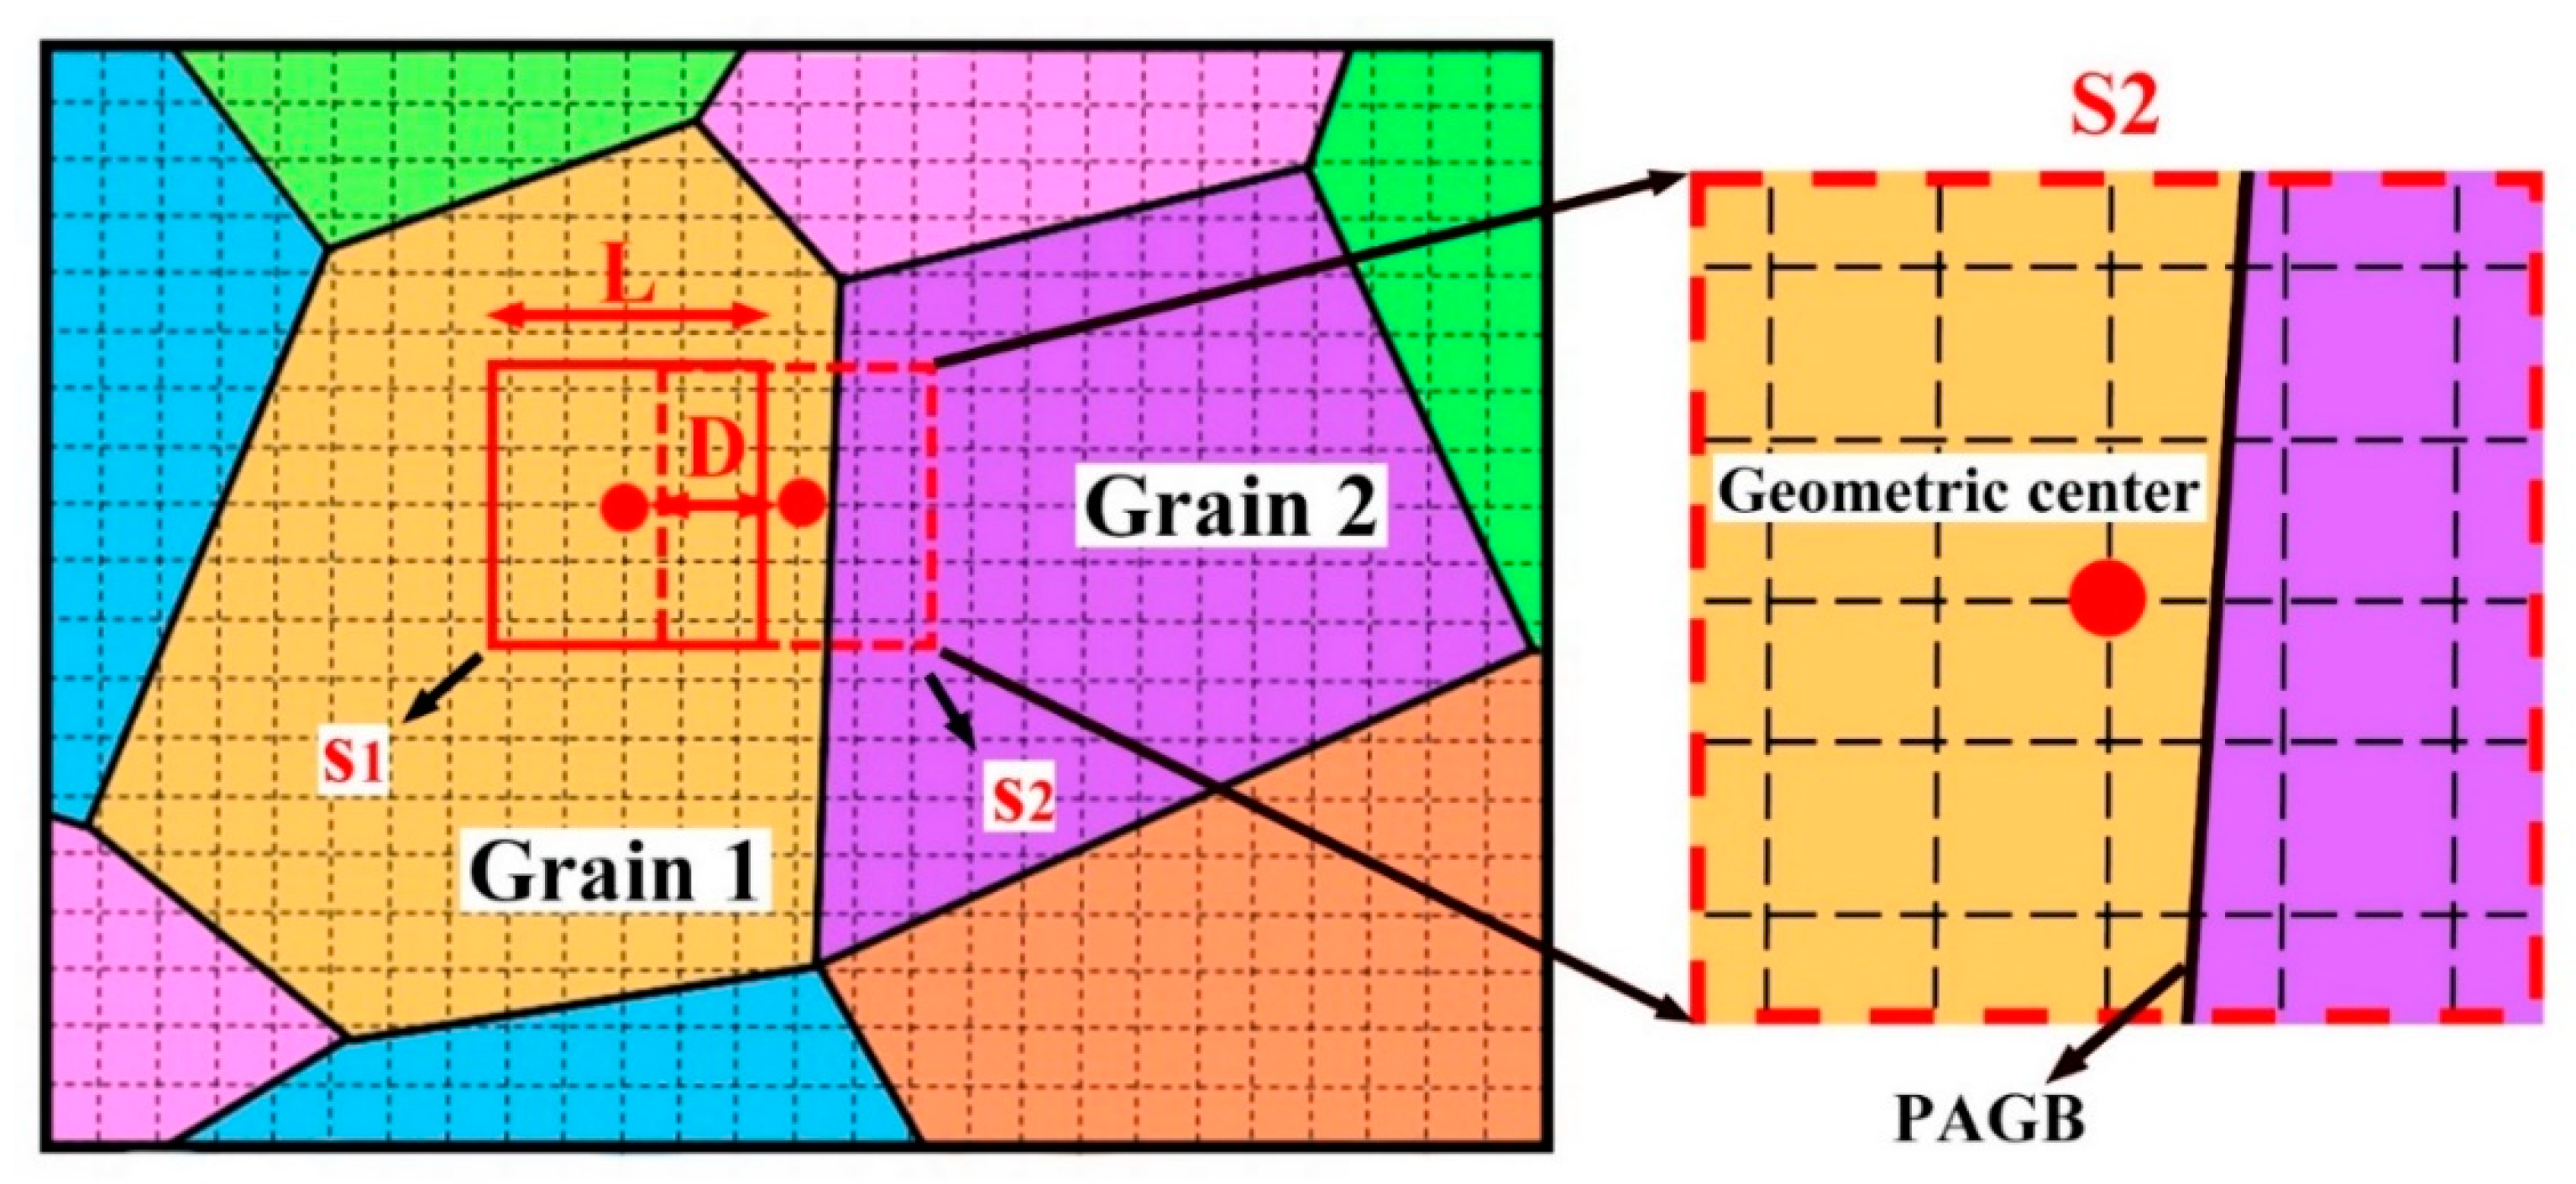
- Further, the solution range of the parent orientation for every square was refined. The 24 potential parent orientations of every measured point in the cropped square were reversely calculated using the solved OR and assembled as the candidate orientations for numerical fitting.
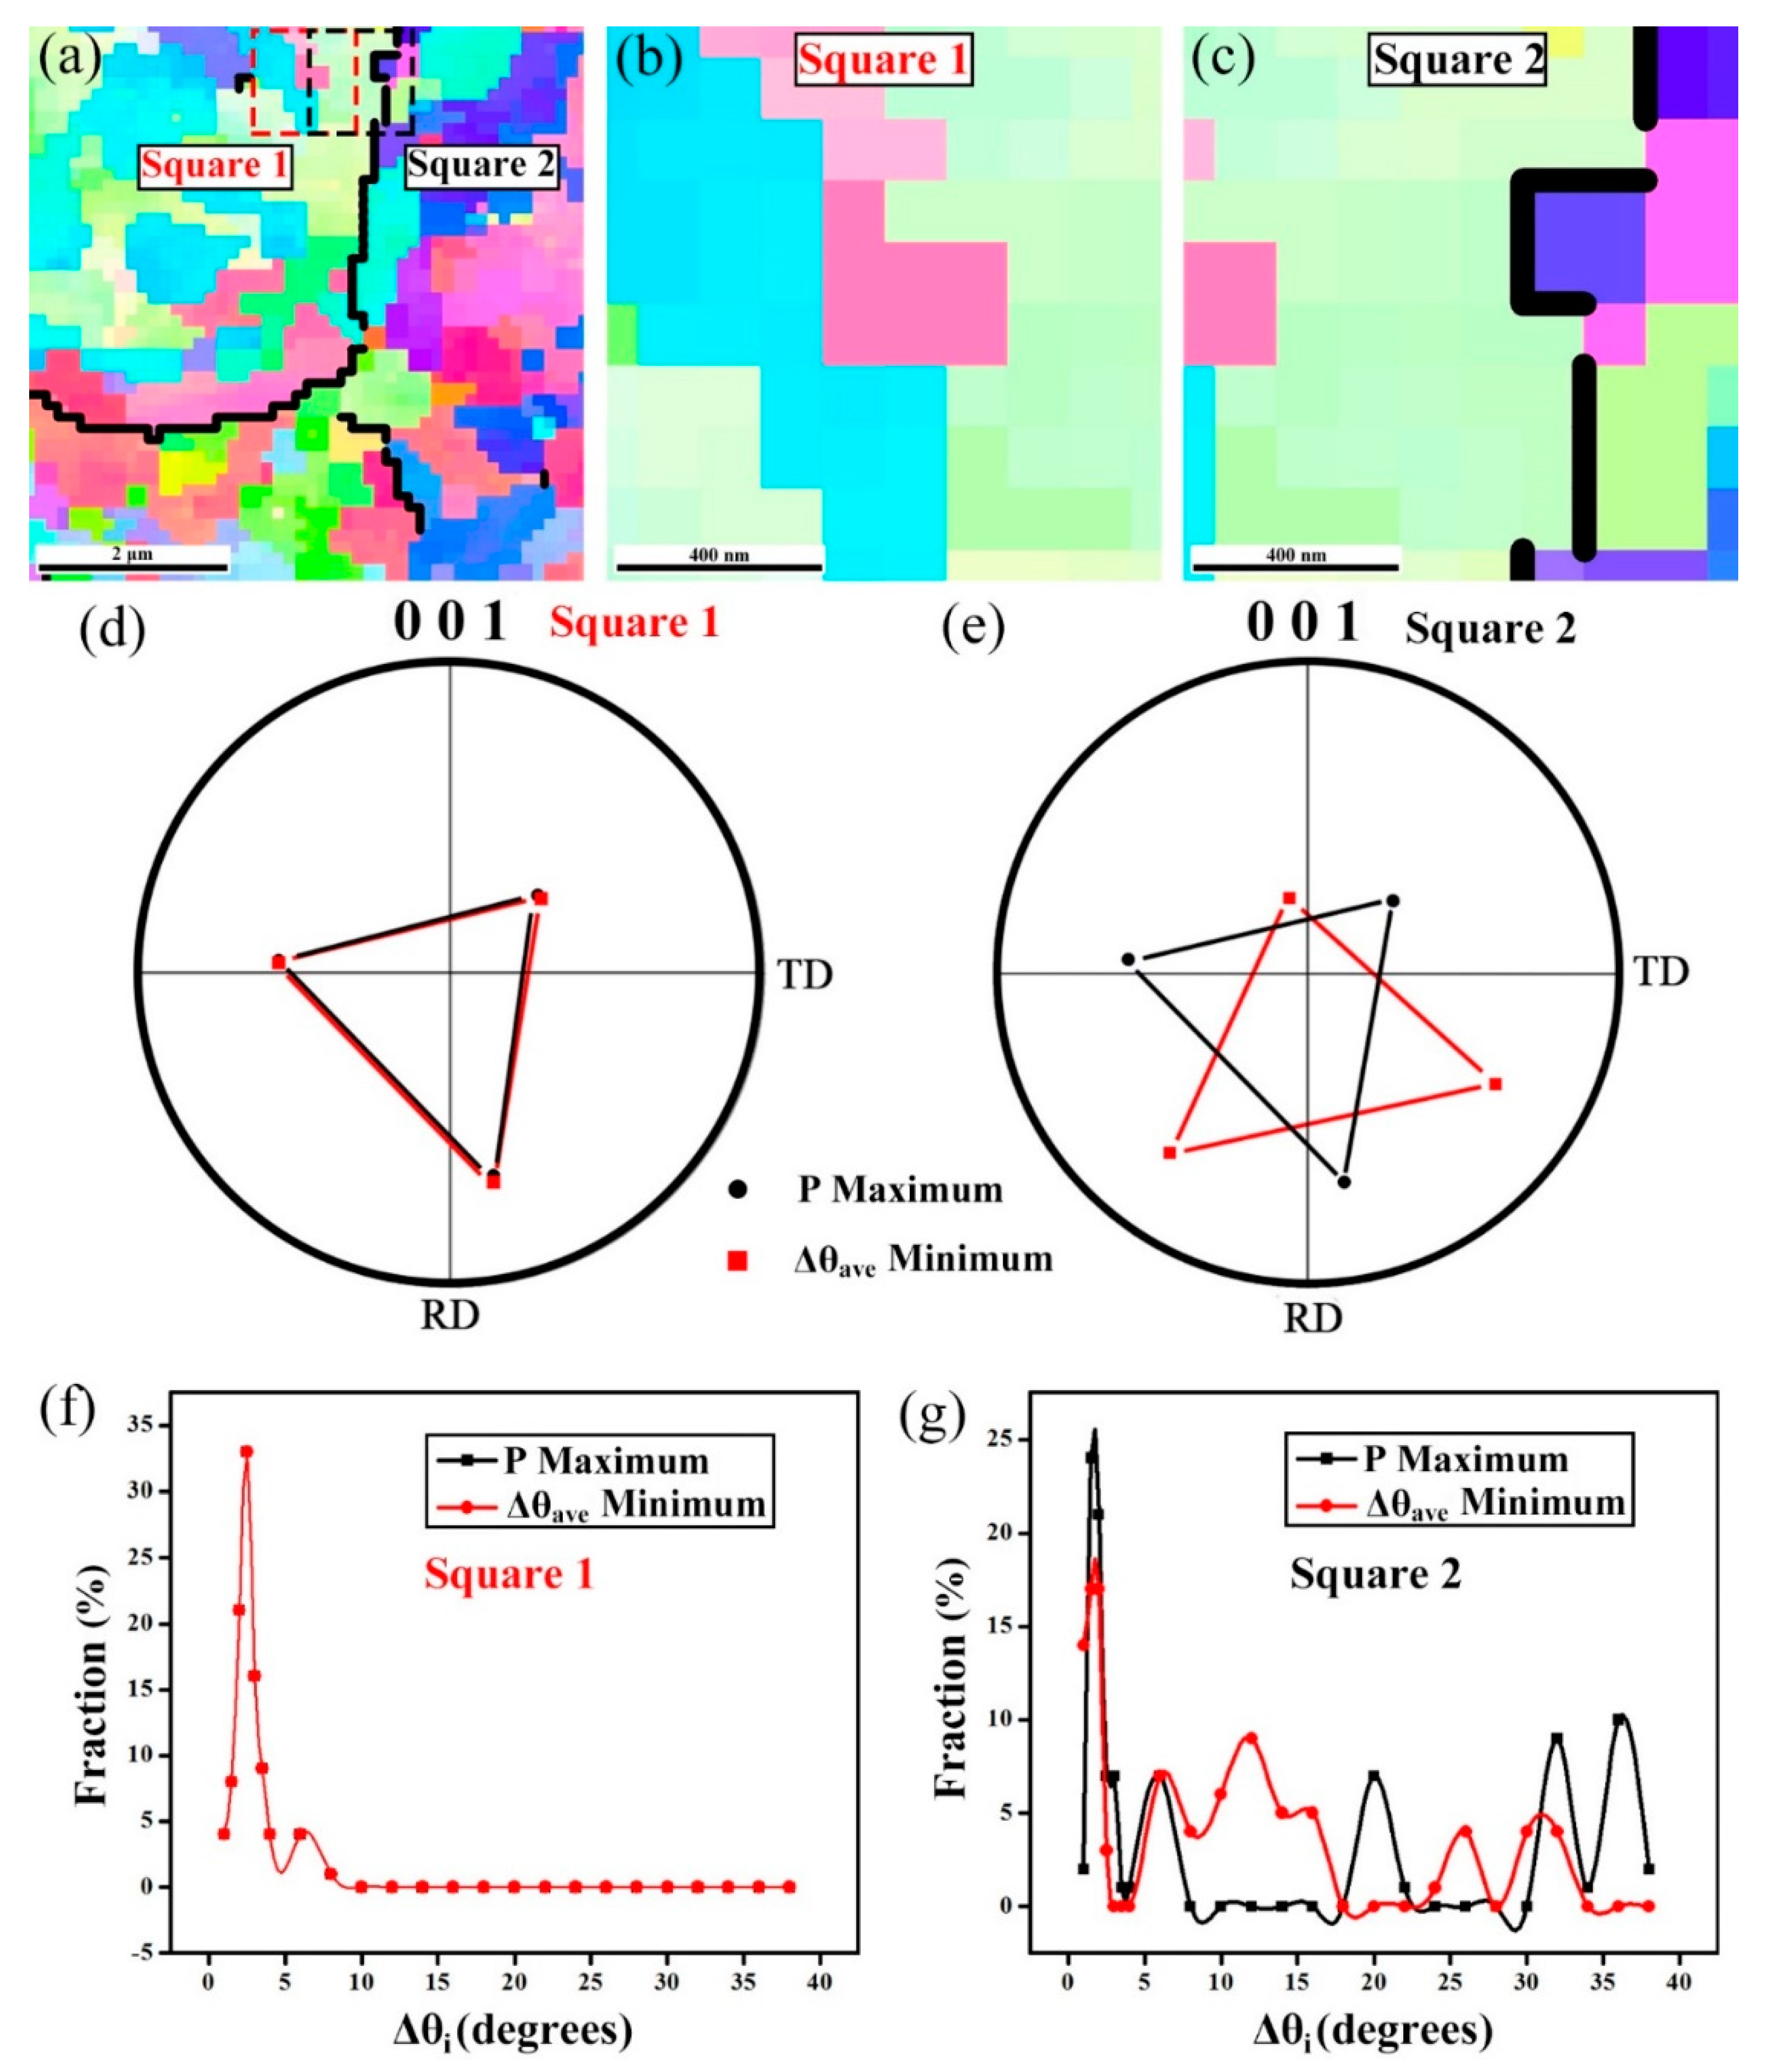
- Cropped squares containing variants inherited from different parent grains were separated from those inherited from one parent grain, i.e., a discriminant factor (F). A unified criterion of C maximization was proposed, appropriate to both types of squares.
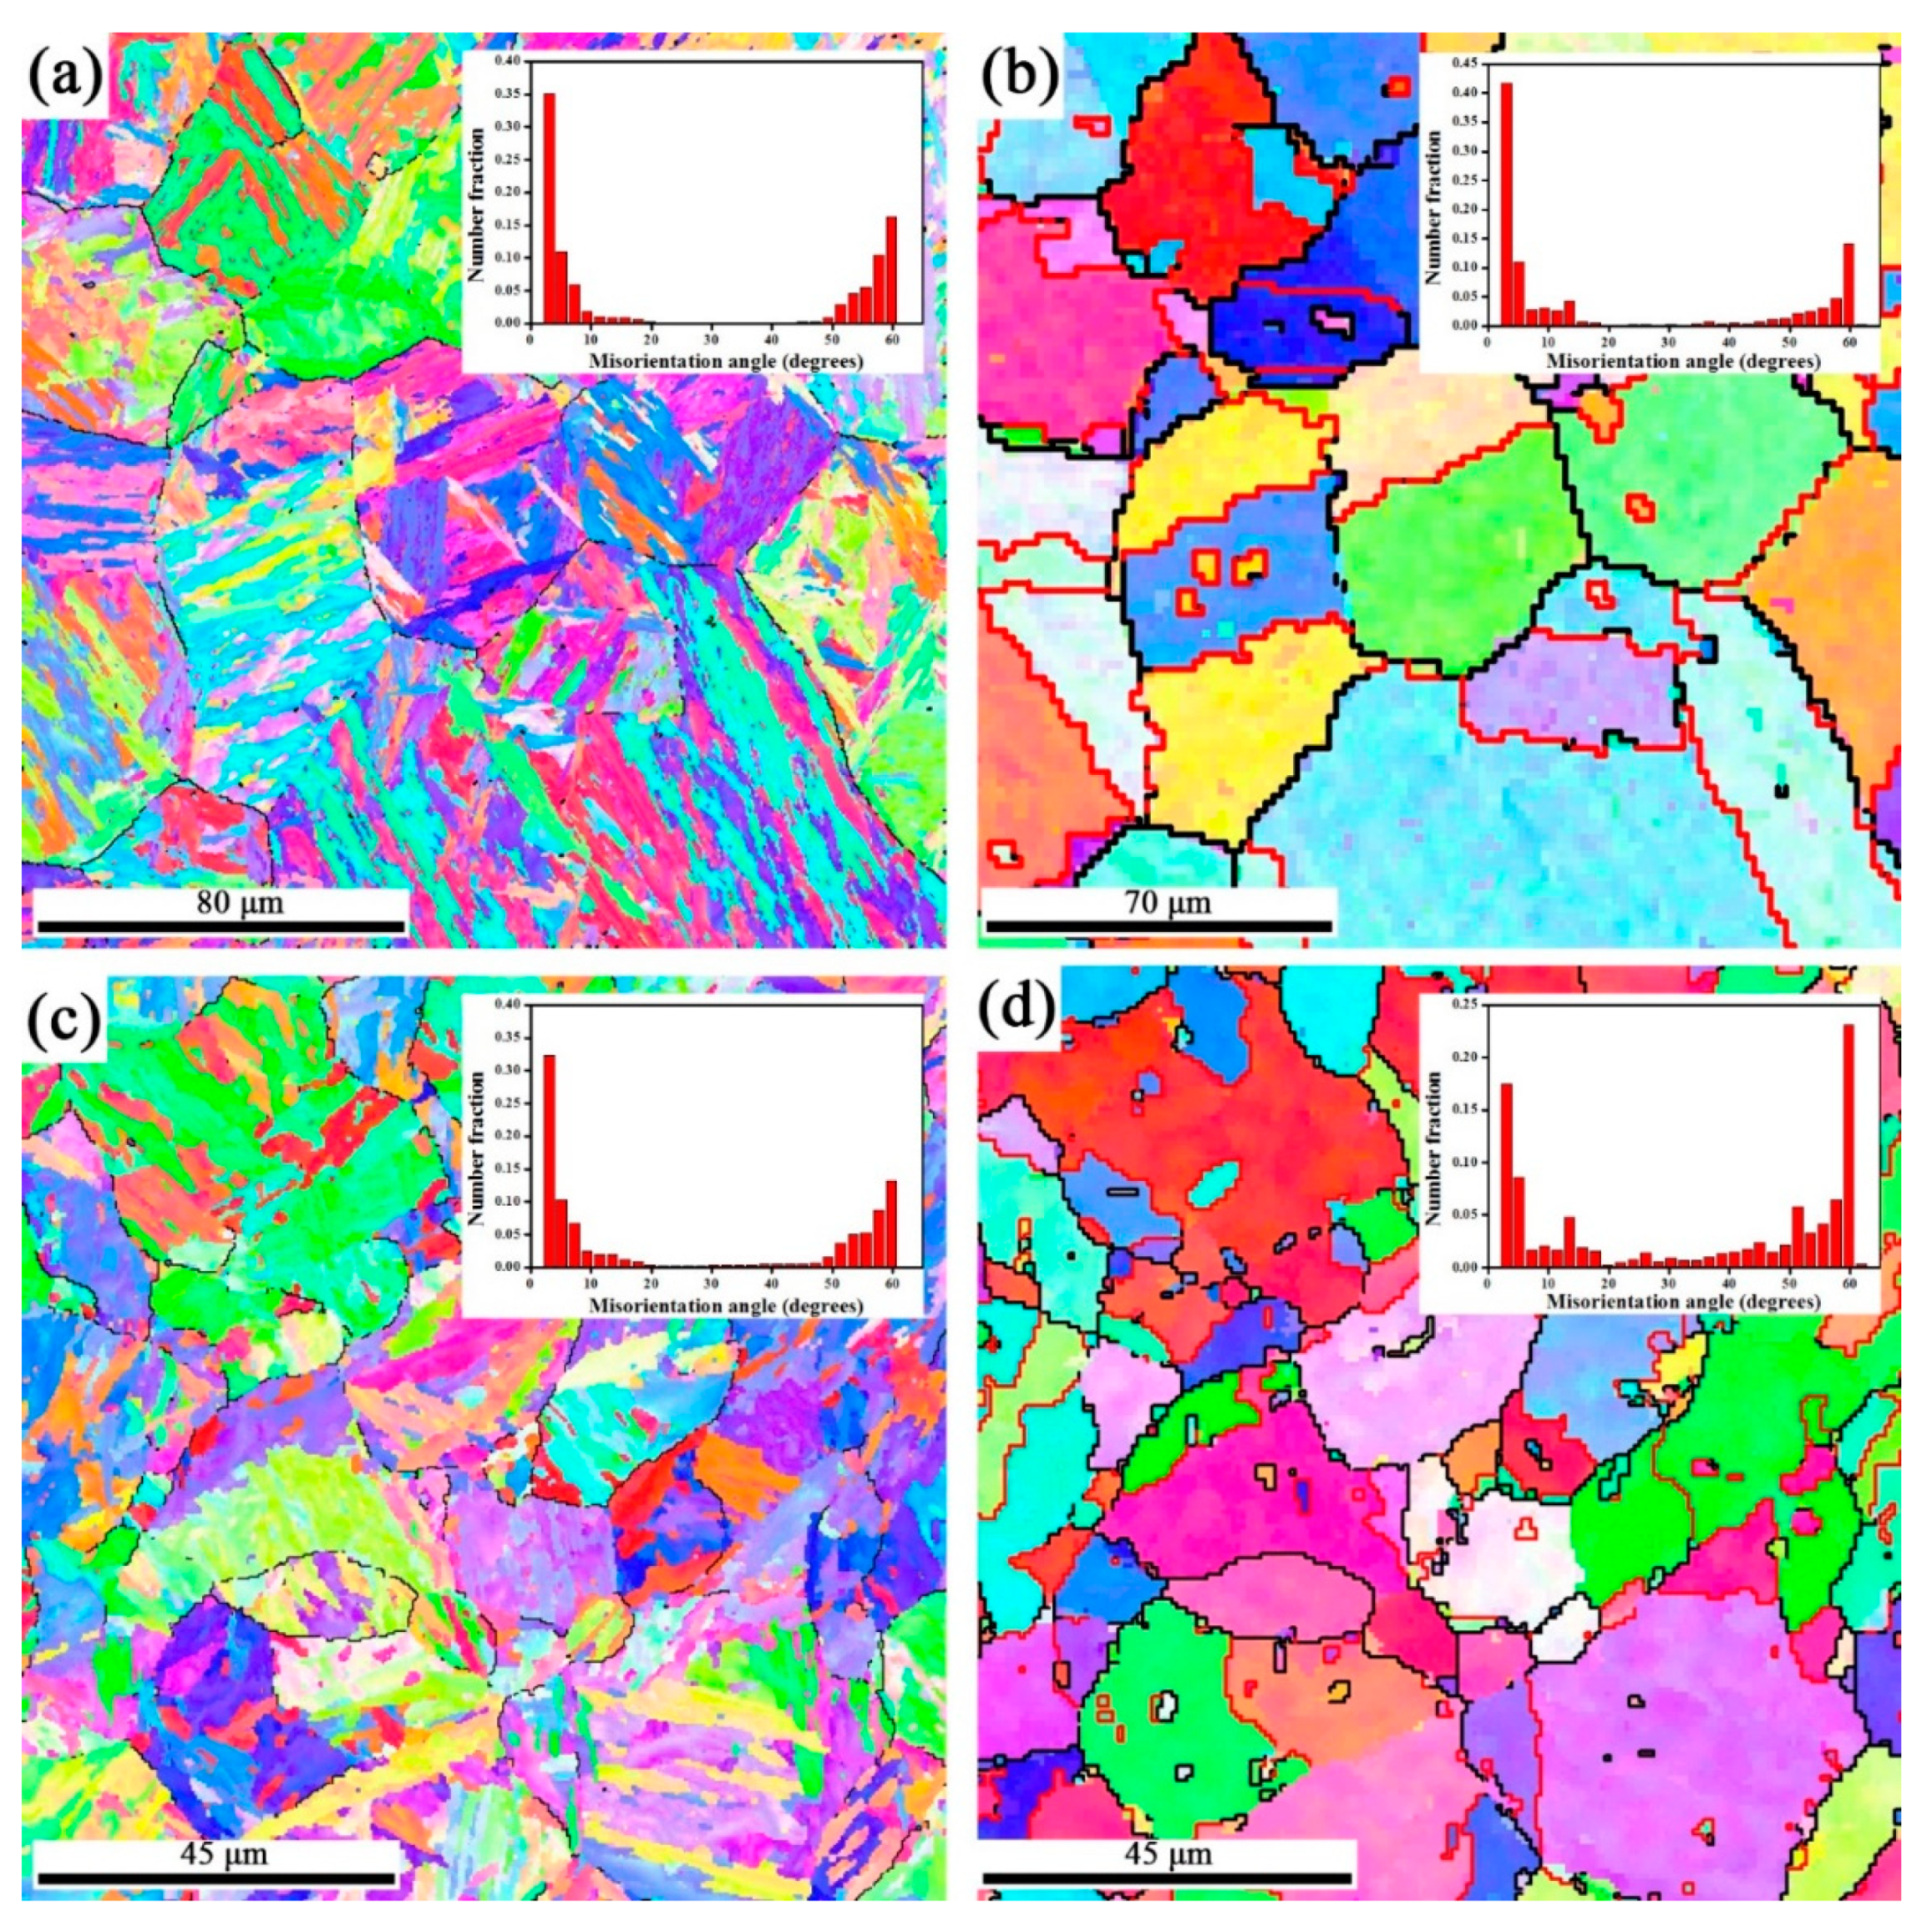
- The present method was applied to the EBSD maps of martensitic phase in the studied steel. It verified that the method accurately reconstructs morphology and crystallography of deformed parent grains.
Author Contributions
Funding
Acknowledgments
Conflicts of Interest
References
- Taylor, A.S.; Cizek, P.; Hodgson, P.D. Comparison of 304 stainless steel and Ni–30wt.% Fe as potential model alloys to study the behaviour of austenite during thermomechanical processing. Acta Mater. 2011, 59, 5832–5844. [Google Scholar] [CrossRef]
- Sanz, L.; Pereda, B.; López, B. Validation and Analysis of the Parameters for Reconstructing the Austenite Phase from Martensite Electron Backscatter Diffraction Data. Metall. Mater. Trans. A 2017, 48, 5258–5272. [Google Scholar] [CrossRef]
- Beladi, H.; Cizek, P.; Hodgson, P.D. Dynamic Recrystallization of Austenite in Ni-30 Pct Fe Model Alloy: Microstructure and Texture Evolution. Metall. Mater. Trans. A 2009, 40, 1175–1189. [Google Scholar] [CrossRef]
- Germain, L.; Blaineau, P.; Gey, N.; Humbert, M. Current Approaches for Reconstructing the Parent Microtexture from that Inherited by Phase Transformation. Mater. Sci. Forum 2011, 702–703, 846–849. [Google Scholar] [CrossRef]
- Germain, L.; Gey, N.; Mercier, R.; Blaineau, P.; Humbert, M. An advanced approach to reconstructing parent orientation maps in the case of approximate orientation relations: Application to steels. Acta Mater. 2012, 60, 4551–4562. [Google Scholar] [CrossRef]
- Gey, N.; Blaineau, P.; Germain, L.; Humbert, M.; Barbier, D.; Perlade, A. Restitution of the Shapes and Orientations of the Prior Austenitic Grains from Inherited Alpha’ Orientation Maps in Steels. Solid State Phenomena 2011, 172–174, 911–915. [Google Scholar] [CrossRef]
- Sanz, L.; López, B.; Pereda, B. Characterization of Austenite Microstructure from Quenched Martensite Using Conventional Metallographic Techniques and a Crystallographic Reconstruction Procedure. Metals 2018, 8, 294. [Google Scholar] [CrossRef]
- Miyamoto, G.; Iwata, N.; Takayama, N.; Furuhara, T. Mapping the parent austenite orientation reconstructed from the orientation of martensite by EBSD and its application to ausformed martensite. Acta Mater. 2010, 58, 6393–6403. [Google Scholar] [CrossRef]
- Miyamoto, G.; Takayama, N.; Furuhara, T. Accurate measurement of the orientation relationship of lath martensite and bainite by electron backscatter diffraction analysis. Scr. Mater. 2009, 60, 1113–1116. [Google Scholar] [CrossRef]
- Anh, T.O.; Pham, H. Shigekazu Morito and Taisuke Hayashi, An Advanced Fitting Method for Crystallographic and Morphological Analyses of EBSD Data Applied for Low-Carbon Steel Martensite. Mater. Trans. 2013, 54, 7. [Google Scholar] [CrossRef]
- Miyamoto, G.; Iwata, N.; Takayama, N.; Furuhara, T. Reconstruction of Parent Austenite Grain Structure Based on Crystal Orientation Map of Bainite with and without Ausforming. ISIJ Int. 2011, 51. [Google Scholar] [CrossRef]
- Zolotorevsky, N.Y.; Panpurin, S.N.; Zisman, A.A.; Petrov, S.N. Effect of ausforming and cooling condition on the orientation relationship in martensite and bainite of low carbon steels. Mater. Charact. 2015, 107, 278–282. [Google Scholar] [CrossRef]
- Schicchi, D.S.; Hunkel, M. Influence of the parent phase on the bainitic transformation under large stress of manganese-boron steel 22MnB5. Mater. Charact. 2019, 151, 457–469. [Google Scholar] [CrossRef]
- Kitahara, H.; Ueji, R.; Ueda, M.; Tsuji, N.; Minamino, Y. Crystallographic analysis of plate martensite in Fe–28.5 at.% Ni by FE-SEM/EBSD. Mater. Charact. 2005, 54, 378–386. [Google Scholar] [CrossRef]
- Nolze, G. Characterizationof the fcc/bcc orientation relationship by EBSD using pole figures and variants. Z. Metall. 2004, 95, 744–755. [Google Scholar] [CrossRef]
- Zhang, M.-X.; Kelly, P.M. Accurate orientation relationship between ferrite and austenite in low carbon martensite and granular bainite. Scr. Mater. 2002, 47, 749–755. [Google Scholar] [CrossRef]
- Cabus, C.; Réglé, H.; Bacroix, B. Orientation relationship between austenite and bainite in a multiphased steel. Mater. Charact. 2007, 58, 332–338. [Google Scholar] [CrossRef]
- Guo, Z.; Lee, C.; Morris, J.W., Jr. On coherent transformations in steel. Acta Mater. 2004, 52, 5511–5518. [Google Scholar] [CrossRef]
- Kitahara, H.; Ueji, R.; Tsuji, N.; Minamino, Y. Crystallographic features of lath martensite in low-carbon steel. Acta Mater. 2006, 54, 1279–1288. [Google Scholar] [CrossRef]
- Bernier, N.; Bracke, L.; Malet, L.; Godet, S. An alternative to the crystallographic reconstruction of austenite in steels. Mater. Charact. 2014, 89, 23–32. [Google Scholar] [CrossRef]
- Wang, S.; Zhang, M.; Wu, H.; Yang, B. Study on the dynamic recrystallization model and mechanism of nuclear grade 316LN austenitic stainless steel. Mater. Charact. 2016, 118, 92–101. [Google Scholar] [CrossRef]
- Morito, S.; Huang, X.; Furuhara, T.; Maki, T.; Hansen, N. The morphology and crystallography of lath martensite in alloy steels. Acta Mater. 2006, 54, 5323–5331. [Google Scholar] [CrossRef]
- Mandal, S.; Bhaduri, A.K.; Sarma, V.S. A Study on Microstructural Evolution and Dynamic Recrystallization During Isothermal Deformation of a Ti-Modified Austenitic Stainless Steel. Metall. Mater. Trans. A 2010, 42, 1062–1072. [Google Scholar] [CrossRef]
- Chen, R.; Zheng, Z.; Li, J.; Feng, F. Constitutive Modelling and Hot Workability Analysis by Microstructure Examination of GH4169 Alloy. Crystals 2018, 8, 282. [Google Scholar] [CrossRef]


| OR | Miller Notation | Euler Angles | |
|---|---|---|---|
| Plane | Direction | ||
| KS | |||
| NW | |||
| GT | |||
© 2019 by the authors. Licensee MDPI, Basel, Switzerland. This article is an open access article distributed under the terms and conditions of the Creative Commons Attribution (CC BY) license (http://creativecommons.org/licenses/by/4.0/).
Share and Cite
Wang, D.; Jin, J.; Li, Q.; Wang, X. An Accurate Method for Crystallographic Reconstruction of Parent Austenite from Inherited Martensite in a Low-Alloy Steel. Crystals 2019, 9, 358. https://doi.org/10.3390/cryst9070358
Wang D, Jin J, Li Q, Wang X. An Accurate Method for Crystallographic Reconstruction of Parent Austenite from Inherited Martensite in a Low-Alloy Steel. Crystals. 2019; 9(7):358. https://doi.org/10.3390/cryst9070358
Chicago/Turabian StyleWang, Daokuan, Junsong Jin, Qiaomin Li, and Xinyun Wang. 2019. "An Accurate Method for Crystallographic Reconstruction of Parent Austenite from Inherited Martensite in a Low-Alloy Steel" Crystals 9, no. 7: 358. https://doi.org/10.3390/cryst9070358
APA StyleWang, D., Jin, J., Li, Q., & Wang, X. (2019). An Accurate Method for Crystallographic Reconstruction of Parent Austenite from Inherited Martensite in a Low-Alloy Steel. Crystals, 9(7), 358. https://doi.org/10.3390/cryst9070358