Article

Hydrogenation of HOPG-supported Gold Nanoparticles: Features of Initial Stages

N. N. Semenov Federal Research Center for Chemical Physics, Russian Academy of Sciences (FRCCP RAS), Moscow 119991, Russia
*
Author to whom correspondence should be addressed.
Crystals 2019, 9(7), 350; https://doi.org/10.3390/cryst9070350
Submission received: 10 June 2019 / Revised: 28 June 2019 / Accepted: 5 July 2019 / Published: 9 July 2019
(This article belongs to the Special Issue Synthesis and Investigation of Gold Nanoparticles)

Abstract

:
The features of deuterium adsorption on the surface of gold nanoparticles deposited on highly oriented pyrolytic graphite (HOPG) were determined. The results showed that deuterium adsorption on gold nanoparticles takes place at room temperature. The results also showed that the filling of the nanoparticles’ surfaces with the adsorbate occurs from the graphite–gold interface until the entire surface is covered by deuterium. The results of quantum chemical simulations are used to explain the experimental data. A simple model of the observed effects is proposed.

1. Introduction

Many modern catalysts are composed of nanomaterials. In particular, gold nanoparticles are used to catalyze the low-temperature oxidation of CO [1] and selective oxidative coupling of methanol to methyl formate [2]. Gold nanoparticles are also used as catalysts for selective isomerization of epoxides to allylic alcohols [3], benzylation of aromatics [4], and production of vinyl chloride and vinyl acetate monomers [5], among other substances. Gold nanoparticles are used in catalytic reactions of alkene hydrogenation [6], in the chemoselective hydrogenation of crotonaldehyde to crotyl alcohol [7], in the chemoselective hydrogenation of nitro compounds [8], and in the heterogeneous hydroformylation of olefins [9]. In addition, catalysts based on gold nanoparticles are used in hydrogenation reactions assisted by hydrogen transfer, including the reduction of carbonyl compounds [10,11] and the hydrochlorination of amines [12] and alkynes [13]. The dissociative adsorption of molecular hydrogen and the interaction of the generated atomic hydrogen with nanoparticles’ surfaces play an important role in these processes. Using calorimetry, TEM and XRD, direct synthesis of water from O2 and H2 was found to occur over silica-supported gold nanoparticles at 383–433 K and under several kilopascals of pressure [14]. The results of corresponding DFT calculations are also presented in this paper. The results obtained for Al2O3-supported gold nanoparticles [15,16] supported a conclusion [14] regarding the interaction of gold and hydrogen. Coordinatively unsaturated Au atoms and/or such defects as vacancies and impurity atoms could be centers of hydrogen adsorption and dissociation. However, in [17], using XPS and mass spectrometry methods, it was found that for the gold-based nanocatalysts supported on TiO2, hydrogen dissociation takes place on the perimeter of interfaces between the gold and TiO2. At the same time, calculations [18] differ from the conclusion reached above. It is specifically stated that centers of H2 dissociation must be low-coordinated gold atoms not directly bound to the stoichiometric and reduced TiO2 support. In [19] it was suggested that hydrogen dissociation occurs on low-coordinated gold atoms, then hydrogen atoms migrate to the substrate. In our previous works [20,21], using methods of scanning tunneling microscopy (STM) and spectroscopy (STS), we observed the dissociative adsorption of hydrogen on gold nanoparticles deposited on graphite. Thus, direct participation of gold nanoparticles in the processes of molecular hydrogen dissociation is not in doubt.
At the same time, despite the long-term studies of nanocatalytic systems, including those based on gold nanoparticles, the mechanisms of elementary acts of even model reactions remain unclear. One of the reasons for the difficulties is that most of the methods used for the study of physicochemical (including catalytic) properties of nanoparticles—photoelectron microscopy, mass spectrometry, and calorimetry—provide information averaged over a large ensemble of nanoparticles in different states. As a result, it is impossible to link the local structural features of nanoparticles with their chemical properties. This problem can be solved using probe methods—in particular, scanning tunneling microscopy and spectroscopy, the spatial resolution of which allows us to investigate chemical interactions between gaseous reagents and solid surfaces at the level of single molecules and single defects. Previously [21], we found that adsorption of hydrogen leads to a change in the electronic structure of gold nanoparticles. Furthermore, the results of [22] have revealed that electron density distortions introduced by the hydrogen adatom are local. These facts have allowed us to observe the evolution of the distribution of adsorbed deuterium atoms on the surface of gold nanoparticles while the sample exposure to molecular deuterium is increasing.
The main purpose of this work is to determine the locations of adsorbed deuterium on the surface of gold nanoparticles, as well as to establish filling dynamics of nanoparticles’ surfaces with an adsorbate as the exposure increases. The paper presents the results of an experimental and numerical study of the initial stages of deuterium adsorption on gold nanoparticles deposited on the surface of highly oriented pyrolytic graphite (HOPG).

2. Experiment

The experiments were carried out at a facility consisting of a scanning tunneling microscope (UHV VT STM, Omicron NanoTechnology, Taunusstein, Germany), Auger spectrometer (CMA-100, Omicron NanoTechnology, Taunusstein, Germany), quadrupole mass spectrometer (HAL 301 PIC, Hiden Analytical Limited, Warrington, UK) and auxiliary equipment, at T = 300 K and a residual gas pressure of P = 2 × 10⁻¹⁰ Torr. We used tips made of platinum-iridium and tungsten wires prepared by standard methods as STM probes.
Nanoparticles were deposited on the surface of HOPG by the impregnation method. To achieve this deposition, an aqueous solution of HAuCl4 with a metal concentration of 5 × 10⁻⁶ g/mL was applied to the substrate surface. Then, the sample was dried, placed in a vacuum chamber and annealed in ultrahigh vacuum at T = 500–750 K for several hours. The required duration of annealing was established by the results of STM study of the sample surface morphology. The fraction of substrate surface covered by nanoparticles did not exceed 0.05.
Morphology and electronic structure of the sample surfaces at the level of single nanoparticles, as well as the results of their modification due to the interaction with adsorbate, were determined using topographic and spectroscopic STM measurements. As the adsorbate we used a molecular isotope of hydrogen—deuterium (D2). The use of D2 made it possible to more accurately control the exposure of the samples in the injected gas. It is known that nanocontact formed by the metal sample and the conducting tip demonstrates the S-shaped dependence of the STM tunnel current on voltage (volt-ampere characteristic (VAC)) [23]. The change in elemental composition of the sample (for instance, due to chemical reactions), can lead to the transition of its electronic structure from metal to semiconductor type or to a significant decrease in the density of states in the vicinity of the Fermi level. This results in the appearance of a zero-current section within the S-shaped VAC curve attributed to the band gap of the material [24,25,26,27]. Thus, changes in VAC curve shape can indicate chemical composition change over the surface of nanoparticles. Hereafter, the term “VAC of nanoparticles” refers to the VAC of STM tunnel contact formed by STM tip and the surface of gold nanoparticles placed on the graphite support, and the term “VAC of graphite” refers to the VAC of STM tunnel contact formed by STM tip and the pure graphite surface.
Analysis of the elemental composition of the samples’ surfaces was carried out by Auger spectroscopy. The obtained data were compared with the results from spectroscopic STM measurements.
The gas composition at all stages of the experiment was controlled by the results of mass spectrometric measurements. In the experiments described below, the molecular deuterium pressure did not exceed P = 1 × 10⁻⁶ Torr. Exposure value was measured in Langmuir, 1 L = 1 × 10⁻⁶ Torr × s.

Numerical Experiment

Quantum chemical simulation of the interaction between atomic deuterium and the interface formed by gold clusters and the carbon substrate—supercluster Au13C138—was carried out within the framework of density functional theory (DFT) using software packages OpenMX-3.7 (OMX) and QuantumEspresso-5.1.1 (QE). All the calculations were carried out in a generalized gradient approximation using the PBE functional without regard for spin polarization. The GGA-PBE approximation met the requirements of the study, since the main focus was on calculating the projected density of states (PDOS) for the atoms of the model during deuterium adsorption. The atomic bases in OMX are specified using localized functions—pseudoatomic orbitals. For Au atoms we used the s1p1d1-set with 17 valence electrons (Nval) and a cut-off radius (Rcut) of 7 Å. For C atoms, s1p1-set, Nval = 4, and Rcut = 5 Å were used, while for D atoms, the more accurate set of s3p2-set, Nval = 1 and Rcut = 7 Å was used. Base sets of flat waves were used in QE. In this study, the cut-off energy of 24 Ry and ultrasoft pseudopotentials was chosen, taking into account relativistic effects for gold. The spatial volume of the cell was 25 × 25 × 25 Å3, and the characteristic size of the model system was 16 × 13 × 6 Å3, which allowed us to minimize the influence of neighboring superclusters. Note that no calculations of PDOS were made for the atoms located on the edge of the supercluster during the simulation; therefore, the effect of dangling bonds could be neglected. The use of two software packages allowed us to cross-test the data of the numerical experiment.
As a model of a gold nanoparticle located at the edge of the HOPG terrace we used a supercluster Au13C138. The atomic structure of C138 is an extracted supercell of bulk graphite, the lower layer of which consists of 90 carbon atoms, and the upper one of 48. During the calculations, the positions of all C138 atoms were fixed in order to avoid the influence of the transformation of the atomic structure on the density of states of C atoms. In addition, control calculations showed that the change in the chemical potential of C138 was less than 1% during relaxation of the atomic structure. As a model of a gold nanoparticle, an icosahedral isomer of the 13-atomic gold cluster was taken. Interacting with C138—mostly with carbon atoms of the upper layer—the atomic structure of Au13 changed, forming two regions: the interface, where Au atoms were bound to C atoms, and the vertex, where Au atoms were bound to Au atoms. The binding energy between Au13 and C138 was estimated by the formula:
E b o n d =   E ( A u 13 C 138 ) E ( C 138 ) E ( A u 13 * )   ,
where E(Au13*) is the total energy of the Au13 cluster with modified atomic structure. The obtained value of –1.2 eV corresponds to the lower limit of the binding energy and is consistent with the results of the STM/STS experiment. Note that since the purpose of the study is to search for general qualitative trends in PDOS changes, the Au13 atomic structure obtained is a suitable model within the framework of our research, although it is unlikely to correspond to the global minimum of potential energy. During interaction with deuterium atoms, the atomic structure of obtained gold–carbon system was fixed, except in a few cases asterisked in Figure 6. It was necessary to use such an approach as we needed to separate the electron and the geometric effects of deuterium adsorption; the first one was due to the formation of the bond, and the second one was associated with changes in the atomic structure of Au13C138 caused by deuterium adsorption. The method of numerical experimentation was essentially the calculation and summation of PDOS for atoms near the site of D adsorption before and after the interaction. The obtained graphs were compared with VAC data acquired in the STM experiments.

3. Results and Discussion

This work includes STM experiments on molecular deuterium interaction with the surface of gold nanoparticles, and quantum chemical simulation of atomic deuterium adsorption onto the gold cluster in contact with two graphene nanocells modeling the edge of the HOPG terrace. In the theoretical portion, we consider the causes of hydrogen dissociative adsorption on the surface of gold nanoparticles and the influence of hydrogen chemisorption on the STM tunneling spectra.

3.1. Experimental Portion

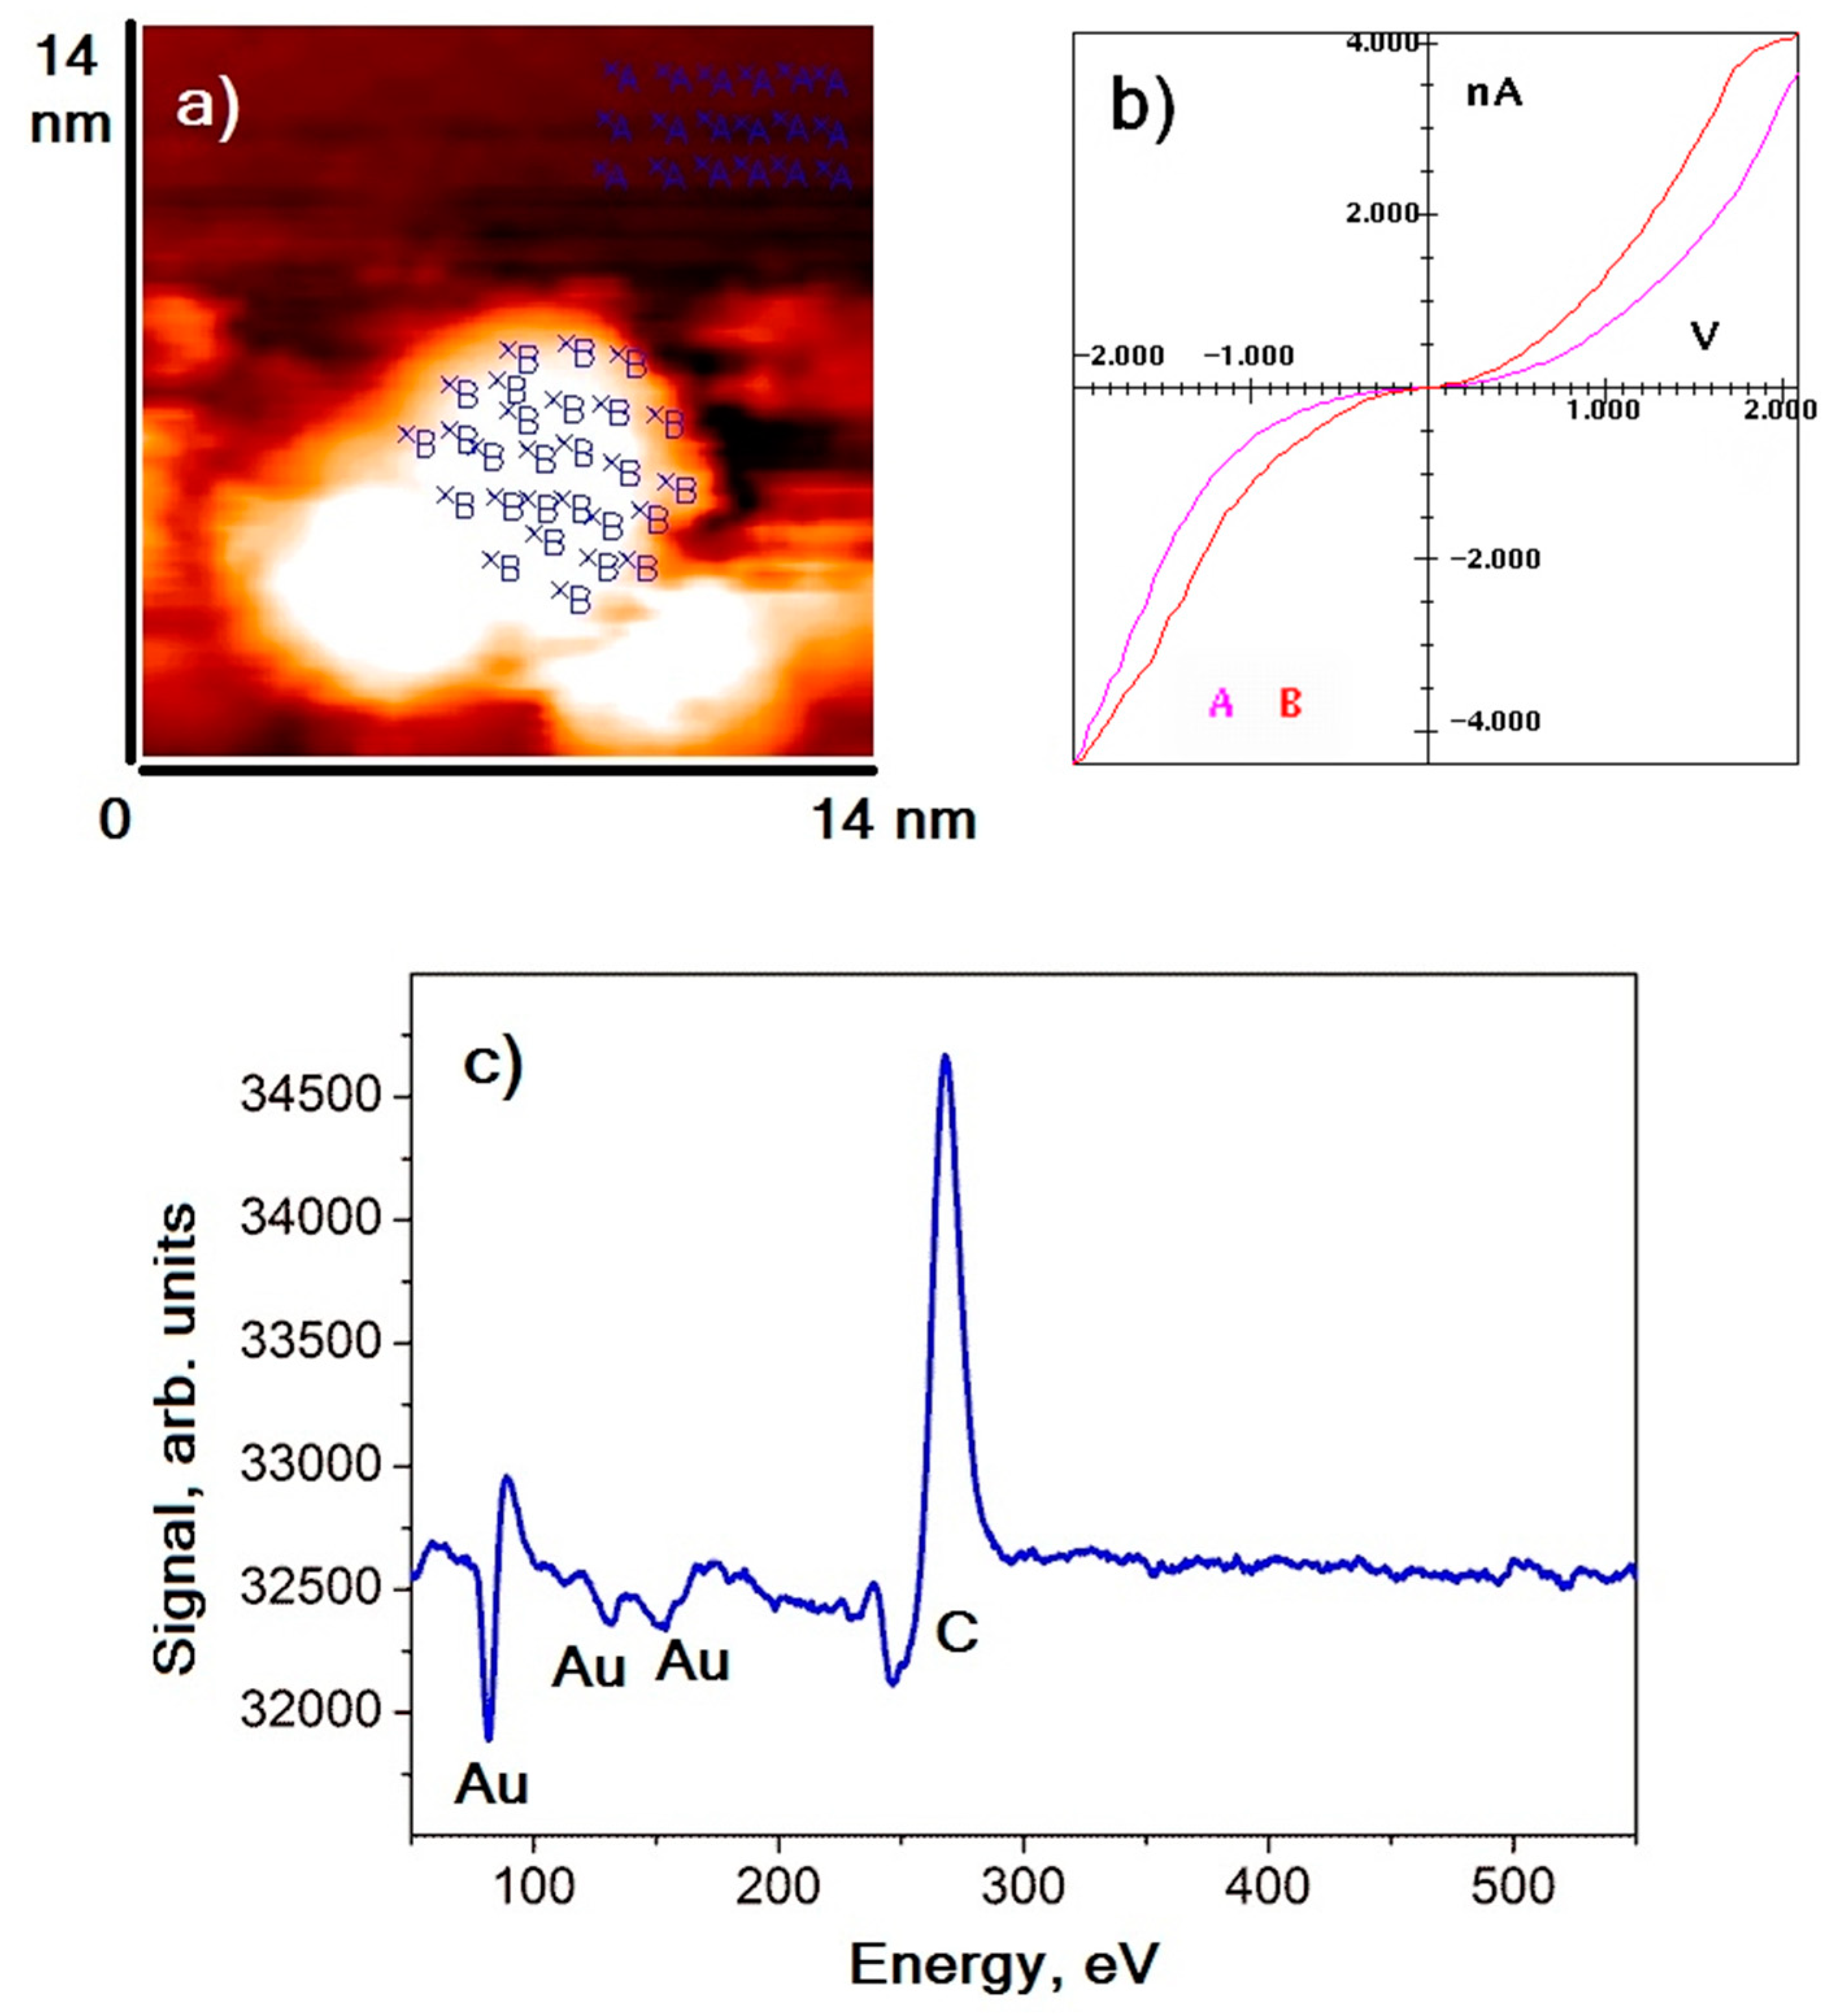
Gold nanoparticles were distributed on the surface of the HOPG in such a way that most of them were arranged on graphite surface defects (terrace edges). Nanoparticles had an oblate spheroidal shape. The maximum of the lateral size distribution was in the range of 4–8 nm, with an average height of approximately 1.5–2 nm. An example image of the HOPG surface area with gold nanoparticles deposited on it is shown in Figure 1a. Figure 1b,c demonstrate the averaged VAC of nanoparticles (dots B) and graphite (dots A) and the Auger electrons spectrum of the sample, respectively. The results of spectroscopic measurements revealed that VACs of nanoparticles and graphite were similar—they possessed an S-shape VAC similar to cases of tunnel contact formed by conductors. It could also be noted that the absolute value of the tunneling current measured on the nanoparticle in the entire voltage range was slightly higher than that of the tunneling current measured on graphite. That is, the local conductivity of nanoparticles was slightly higher than the conductivity of graphite. Such behavior occurred because the density of states in the vicinity of the Fermi level of metal nanoparticles was higher than that of the HOPG (semimetal). The absence of residual impurities on gold was confirmed by the elemental analysis of the sample surface: Auger spectra show maxima at energies of 272 eV and 69, 141, and 160 eV, corresponding to carbon and gold, respectively. Noticeable signals of other elements are not detected.
The exposure of the sample to deuterium resulted in a significant perturbation of the local electron density of nanoparticles. The change in the electronic structure of nanoparticles as a result of increased exposure to D2 is shown in 
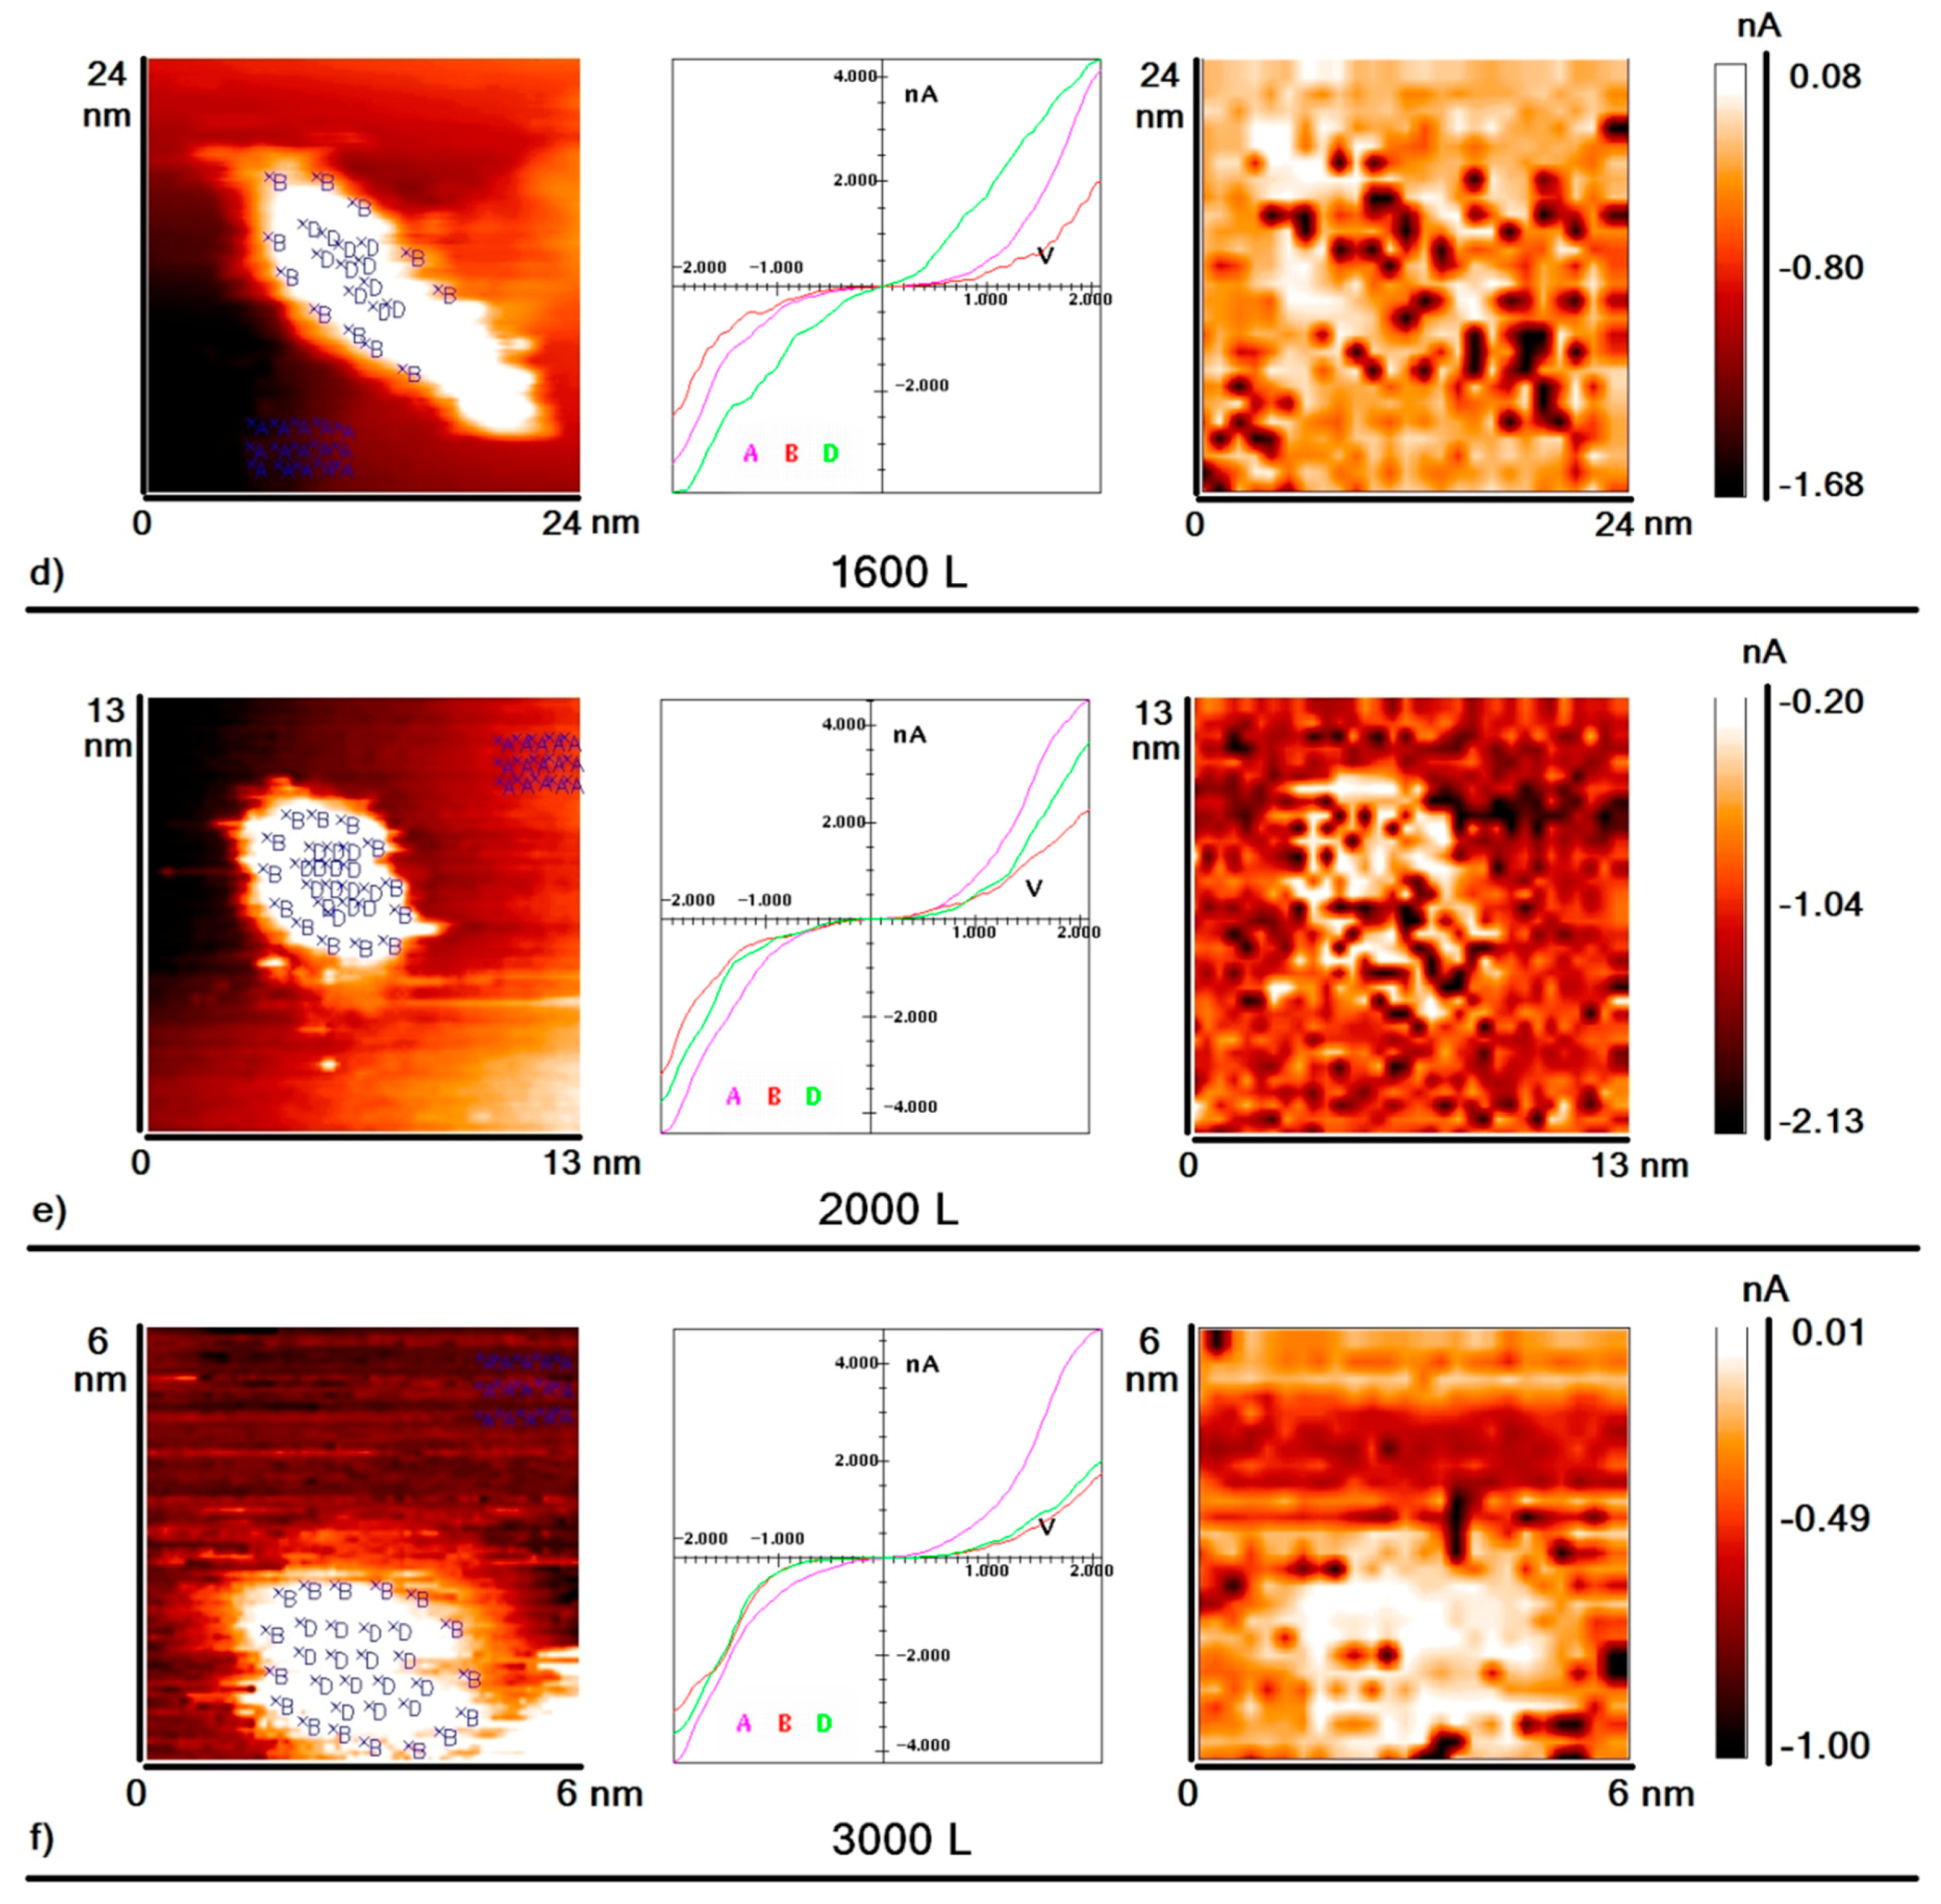
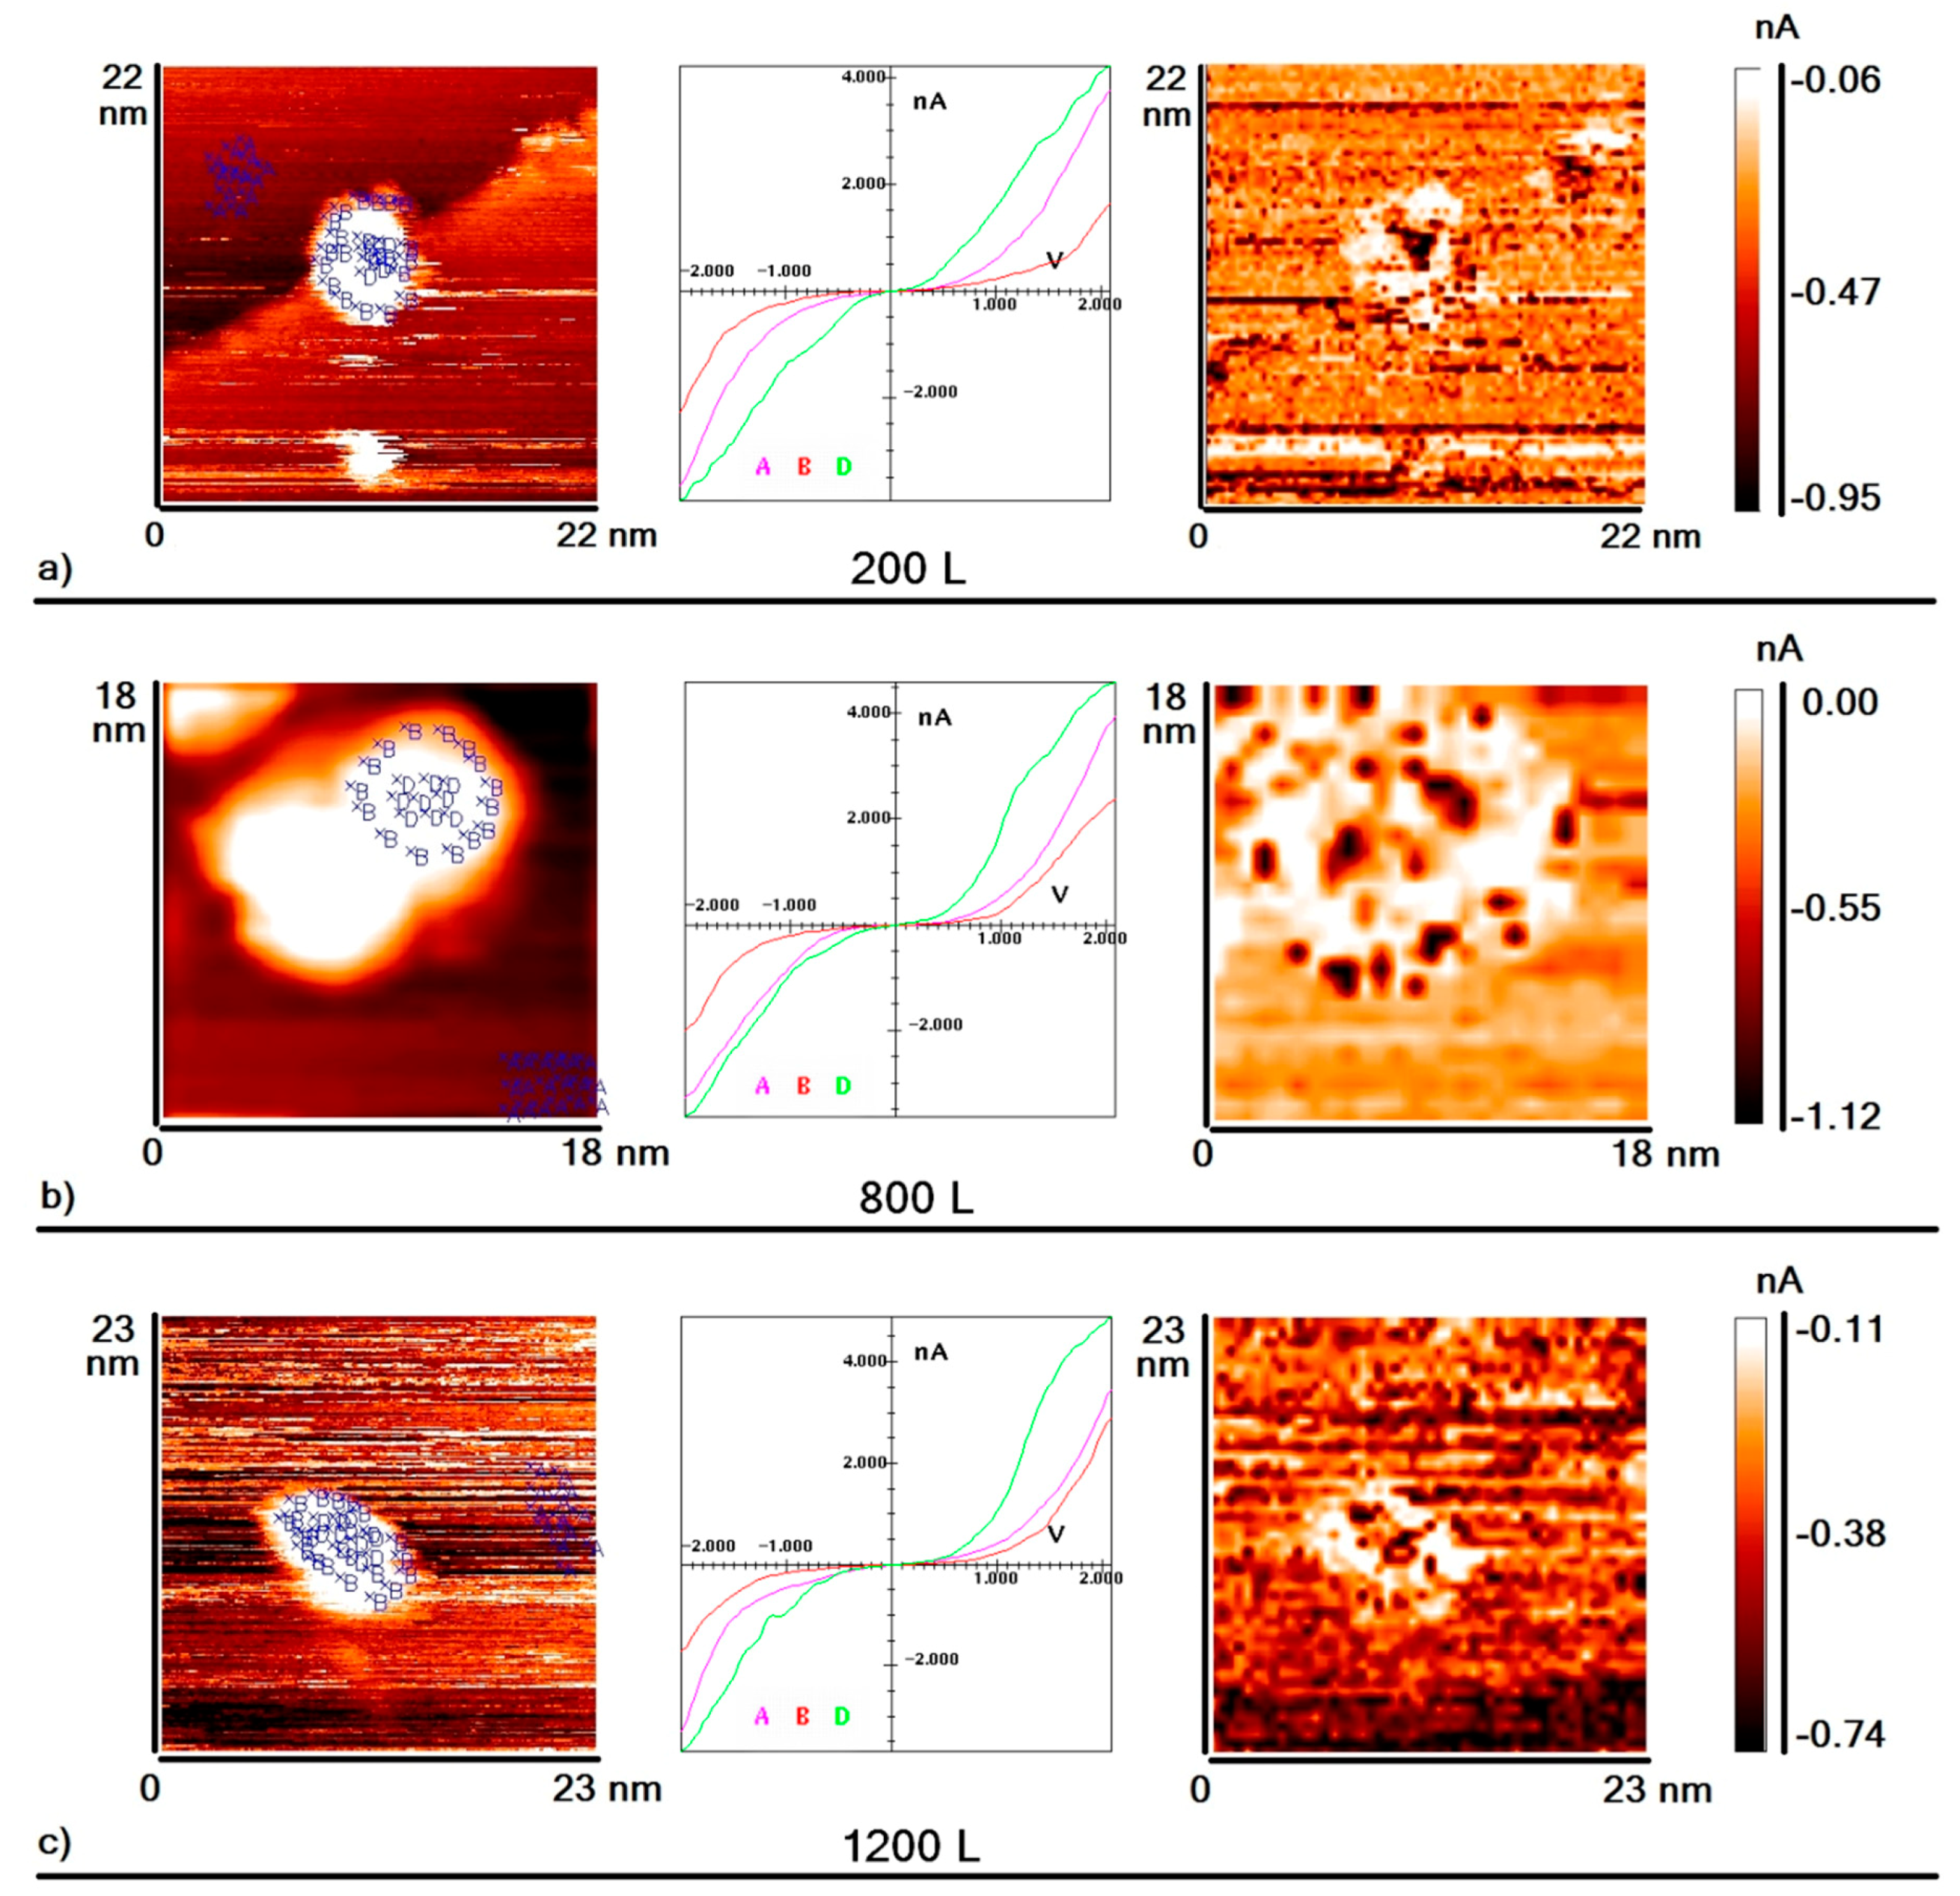
Figure 2a–f. Each part in this figure consists of three elements:
(1) The first element is a topography image of the HOPG surface area with nanoparticles deposited on it. Blue crosses indicate points where VAC was measured;
(2) The second element shows the averaged VAC curves corresponding to the points indicated on the topography image (curve A: area of graphite without nanoparticles; curve B: peripheral area of nanoparticles; curve D: central area of nanoparticles);
(3) The last element is a “current” image of the same surface area, which is a map of the surface distribution of tunneling current values at a certain voltage value (darker points correspond to higher values of tunneling current). This type of image informs the local electron density of the sample surface in an explicit form.
As seen from the above data, after the exposure of the sample to deuterium equal to 200 L, an area appeared on the nanoparticles’ periphery in which the measured value of the tunneling current was lower than one measured on the graphite (hereafter this area is called the “area of reduced conductivity”). However, the value of the tunneling current measured in the center of nanoparticle was still bigger than the one measured on the graphite (Figure 2a). That is, after exposure to deuterium, we could observe two different areas on the surface of the gold nanoparticle—the central area with high conductivity, and the peripheral one with low conductivity. In addition, the VAC measured at several individual points on the periphery of the nanoparticle had a zero-current section. Before the exposition of the sample to deuterium, the existence of such curves was not observed.
As we can see, further increasing the sample’s exposure to deuterium up to 800 L resulted in significant changes: the width of the reduced conductivity region at the periphery of the particle increased, as did the number of points where such VACs containing zero-current sections were detected (Figure 2b). The central part of the nanoparticles remained an area of high conductivity. With an increase in exposure to deuterium up to 1200 L, some points in the central region of nanoparticles started to demonstrate VAC with a zero-current section. However, the average conductivity of the nanoparticle central region was still slightly higher than the conductivity of graphite (Figure 2c). With further exposure to deuterium up to 1600 L, the width of the high conductivity area decreased, and the number of points with zero-current section within the VAC increased even further (Figure 2d). Finally, when the exposure reached approximately 2000 L, it became impossible to identify areas with high and low conductivity on the surface of the nanoparticle. The fraction of points with VAC containing a zero-current section was about one-third of the total number of points where VAC measurements were carried out. So, after the exposure to 2000 L, the surface of nanoparticles became homogeneous, and VACs with and without zero-current sections became almost randomly distributed over the entire surface of the nanoparticle. Formal averaging of VACs measured at the center of the particle and at its periphery demonstrates that conductivity of both the central and peripheral regions of the particle was lower than that of the graphite (Figure 2e). Note that this effect was observed both for isolated nanoparticles and for nanoparticles agglomerated in clusters. A further increase in exposure up to 3000 L did not lead to noticeable changes in the form of VAC curves measured on the surfaces of nanoparticles (Figure 2f).
In our previous work [22], it was shown that adsorption of atomic hydrogen on the surface of free gold nanoclusters results in a decrease in the density of states in the vicinity of the Fermi level, leading to a decrease in the conductivity of the gold nanocluster. Taking into account the results of this work and the experimental data described above, one can conclude that dissociative adsorption of deuterium on the surface of gold nanoparticles takes place and that the filling of nanoparticles with adsorbate begins mainly with the gold–graphite interface, followed by the filling of the rest of the nanoparticle surface. It should be noted that the time of transition of the system to the final (stationary) state is very long (up to 25–30 h). This long transition time indicates the presence of significant activation barriers both for the acts of surface migration of deuterium atoms and for the processes of structural rearrangement of nanoparticles.

3.2. Theoretical Portion and Quantum Chemical Simulation

In this section we consider why gold nanoparticles, unlike monocrystals, are able to adsorb hydrogen, and why hydrogen adsorption significantly affects the tunnel spectra of STM. Our considerations are built on the basis of model concepts that allow an analytical solution.
Hydrogen adsorption on the surface of metals, and gold in particular, has been studied many times. According to the Newns-Anderson model, one can describe the surface as a set of single-electron states with energy εk, and the adsorbate interacting with it as a single valence state with energy εa. Therefore, when the adsorbate approaches the surface, the two sets of states will relate through the interaction matrix with elements Vak, and the adsorbate density of states will be
n a = 1 π Δ ( ε ) ( ε ε a Λ ( ε ) ) 2 + Δ ( ε ) 2     ,
where
Δ ( ε ) = π k | V a k | 2 δ ( ε ε k )   ,
Λ ( ε ) = P π   Δ ( ε ) ε ε d ε .
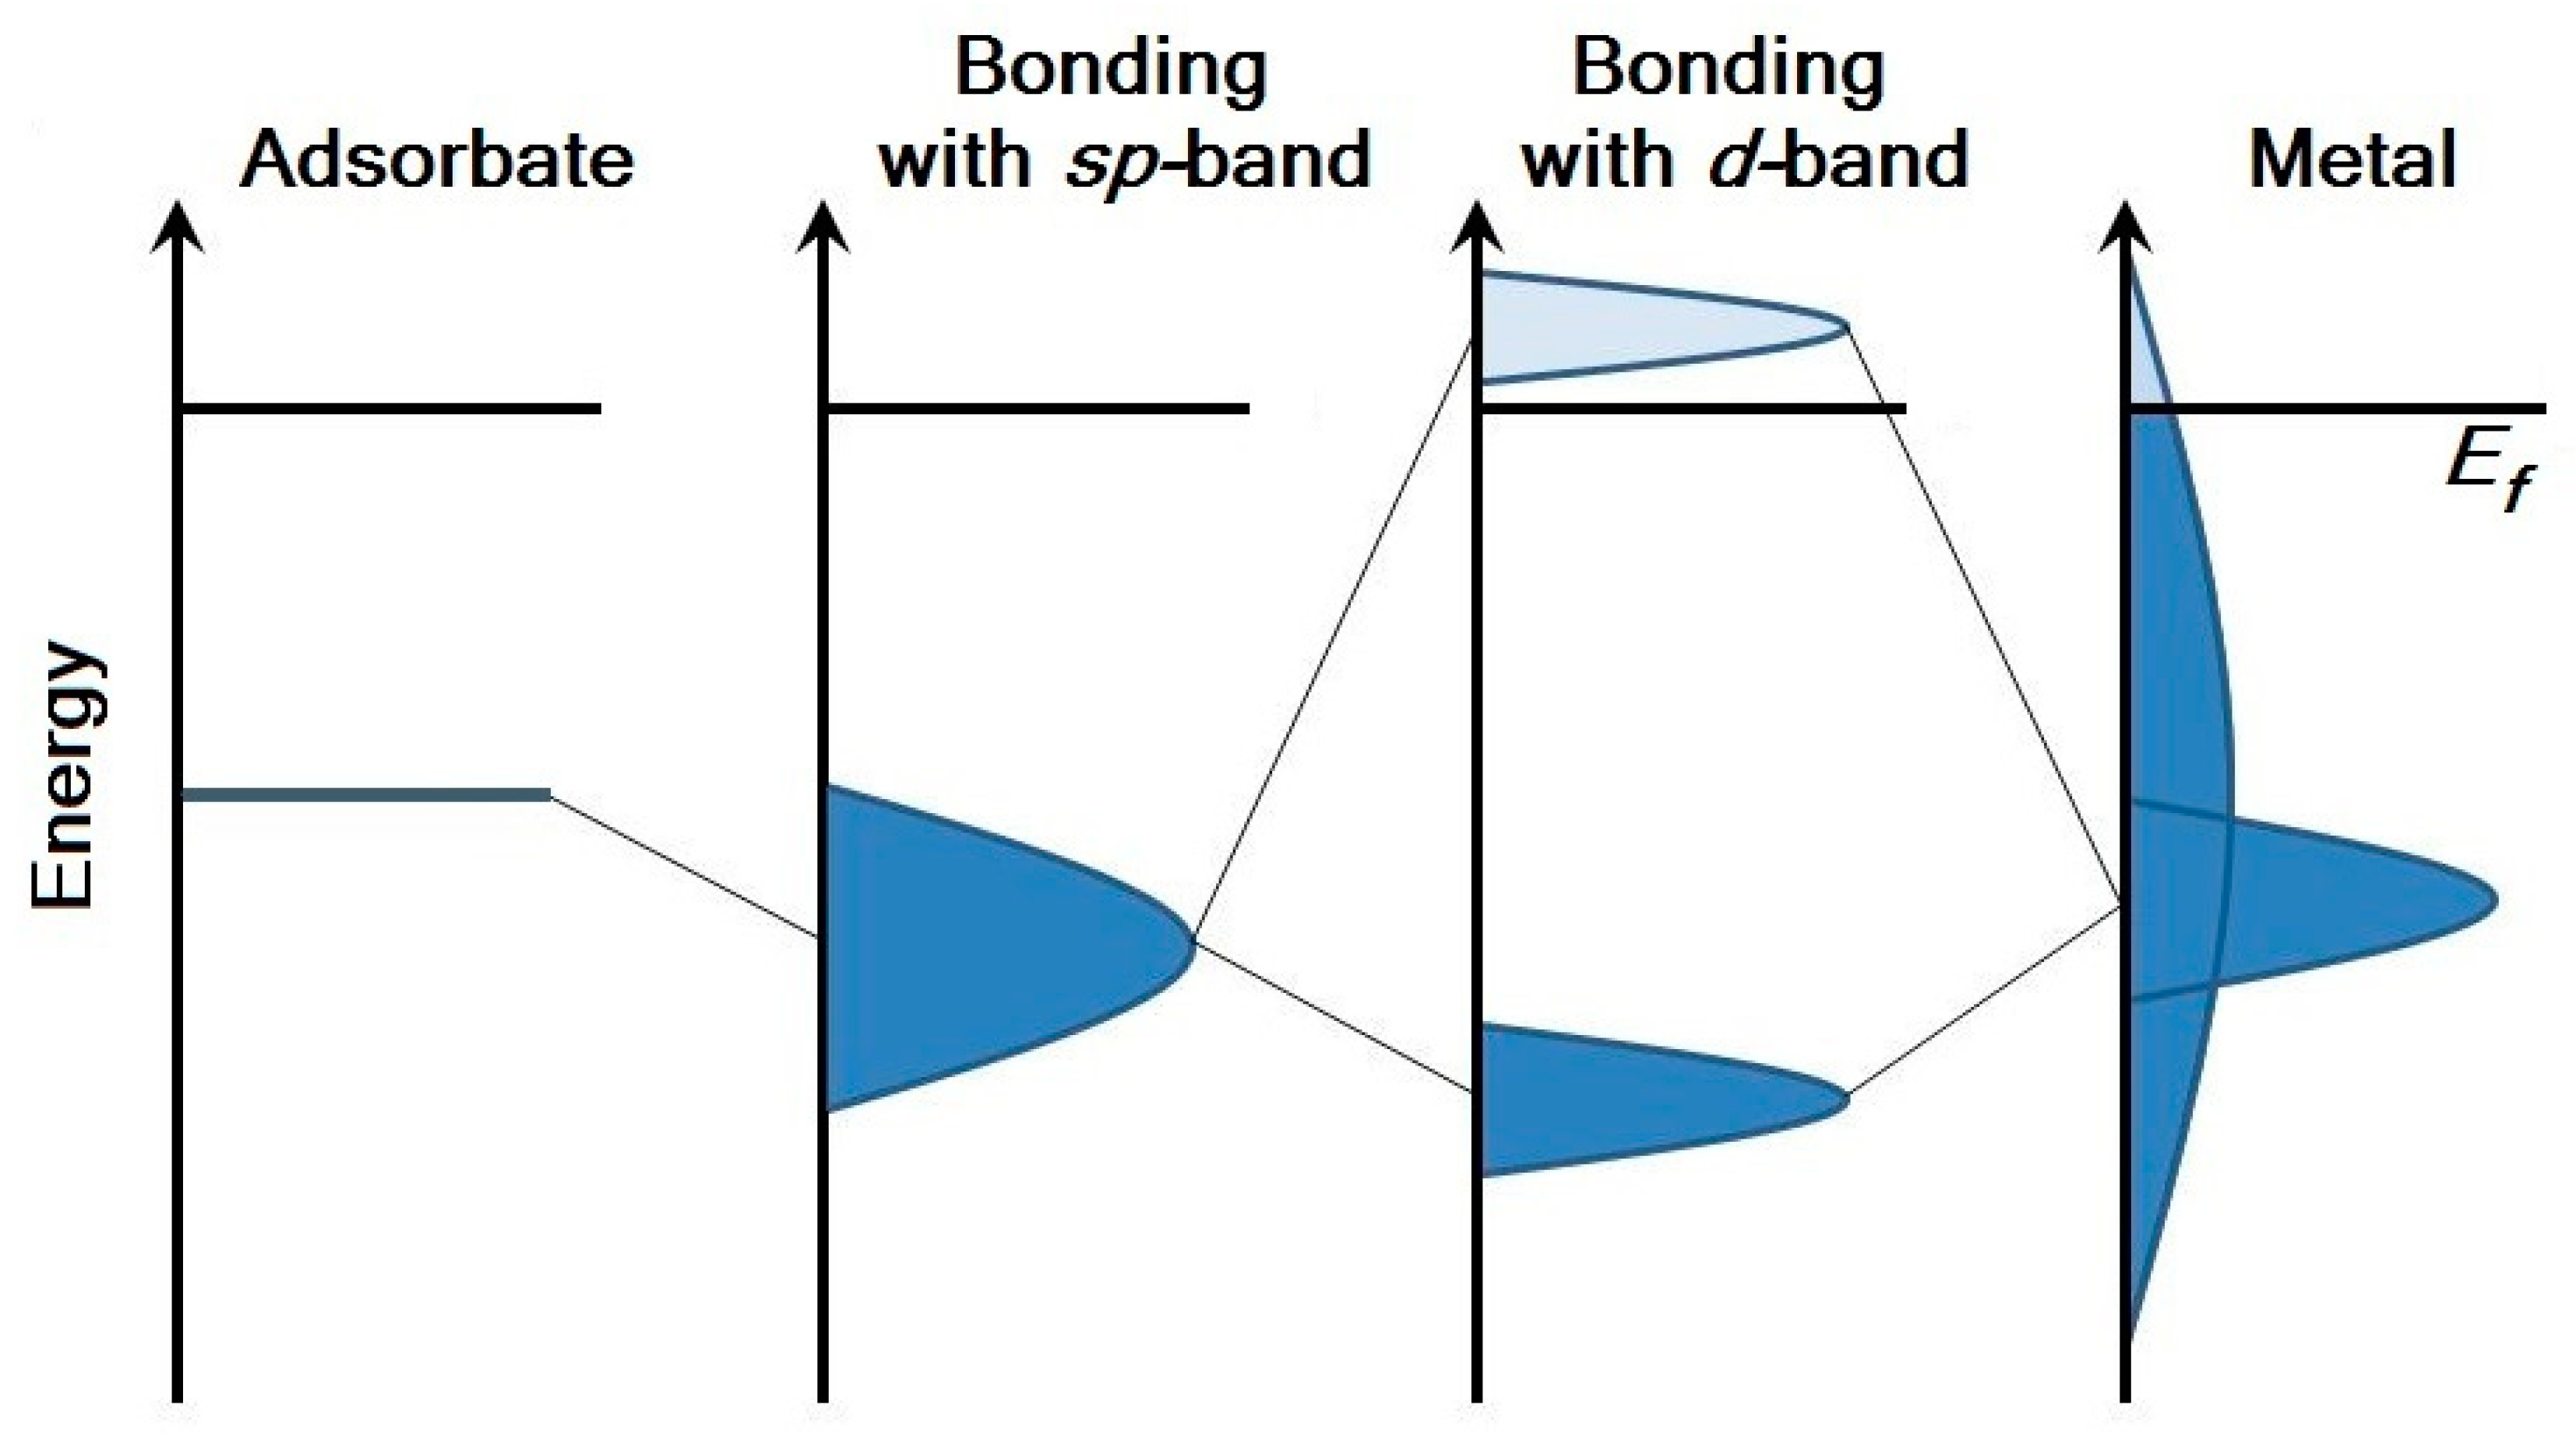
As can be seen, Δ(ε) is a local projection of the density of states of the metal near the adsorbate. If we consider the valence shells formed by the sp- and d-states in the case of noble and transition metals — the most interesting case for catalysis — then we can simplify the dependence Δ(ε) with the next assumption—Δ(ε) does not depend on energy for the sp-band, and the width of Δ(ε) is small for the d-band.
Thus, two stages can be distinguished in the process of atom/molecule adsorption on the metal surface: the interaction of the adsorbate with the sp-states of the metal in the weak-chemisorption approximation, and the interaction of the adsorbate with the d-states of the metal in the strong-chemisorption approximation. Weak chemisorption leads to broadening of the density of adsorbate states. Bonding and antibonding states are formed below and above the d-band and the level of adsorbate as a result of strong chemisorption (Figure 3).
The interactions of the adsorbate with the sp-band (with the surface states) differ little for various noble and transition metals. Therefore, the metal d-band—mainly the location of its center—plays the key role in determining the adsorption properties. For example, for Pt-group transition metals, the d-band is not completely occupied and is located in the vicinity of the Fermi level; therefore, in the case of adsorption, the anti-bonding state will be above the Fermi level, providing remarkable chemisorption properties of the surface. However, the d-band of noble metals (copper, silver and gold) is below the Fermi level and is completely occupied. Therefore, in the case of adsorption, the antibonding state will be below the Fermi level too, and the surface will be more inert (Figure 4a). In addition, within the subgroup of noble metals, Pauli’s repulsion is maximal for gold, which is the most inert and the “noblest of metals” due to this fact [28]. The binding energy of the hydrogen atom on the surface of a gold monocrystal is less than half of the dissociation energy of a hydrogen molecule. As a result, the layer of adsorbed H atoms is unstable.
However, experimentation on hydrogen interaction with gold nanoparticles given in this paper and other works [20,29,30,
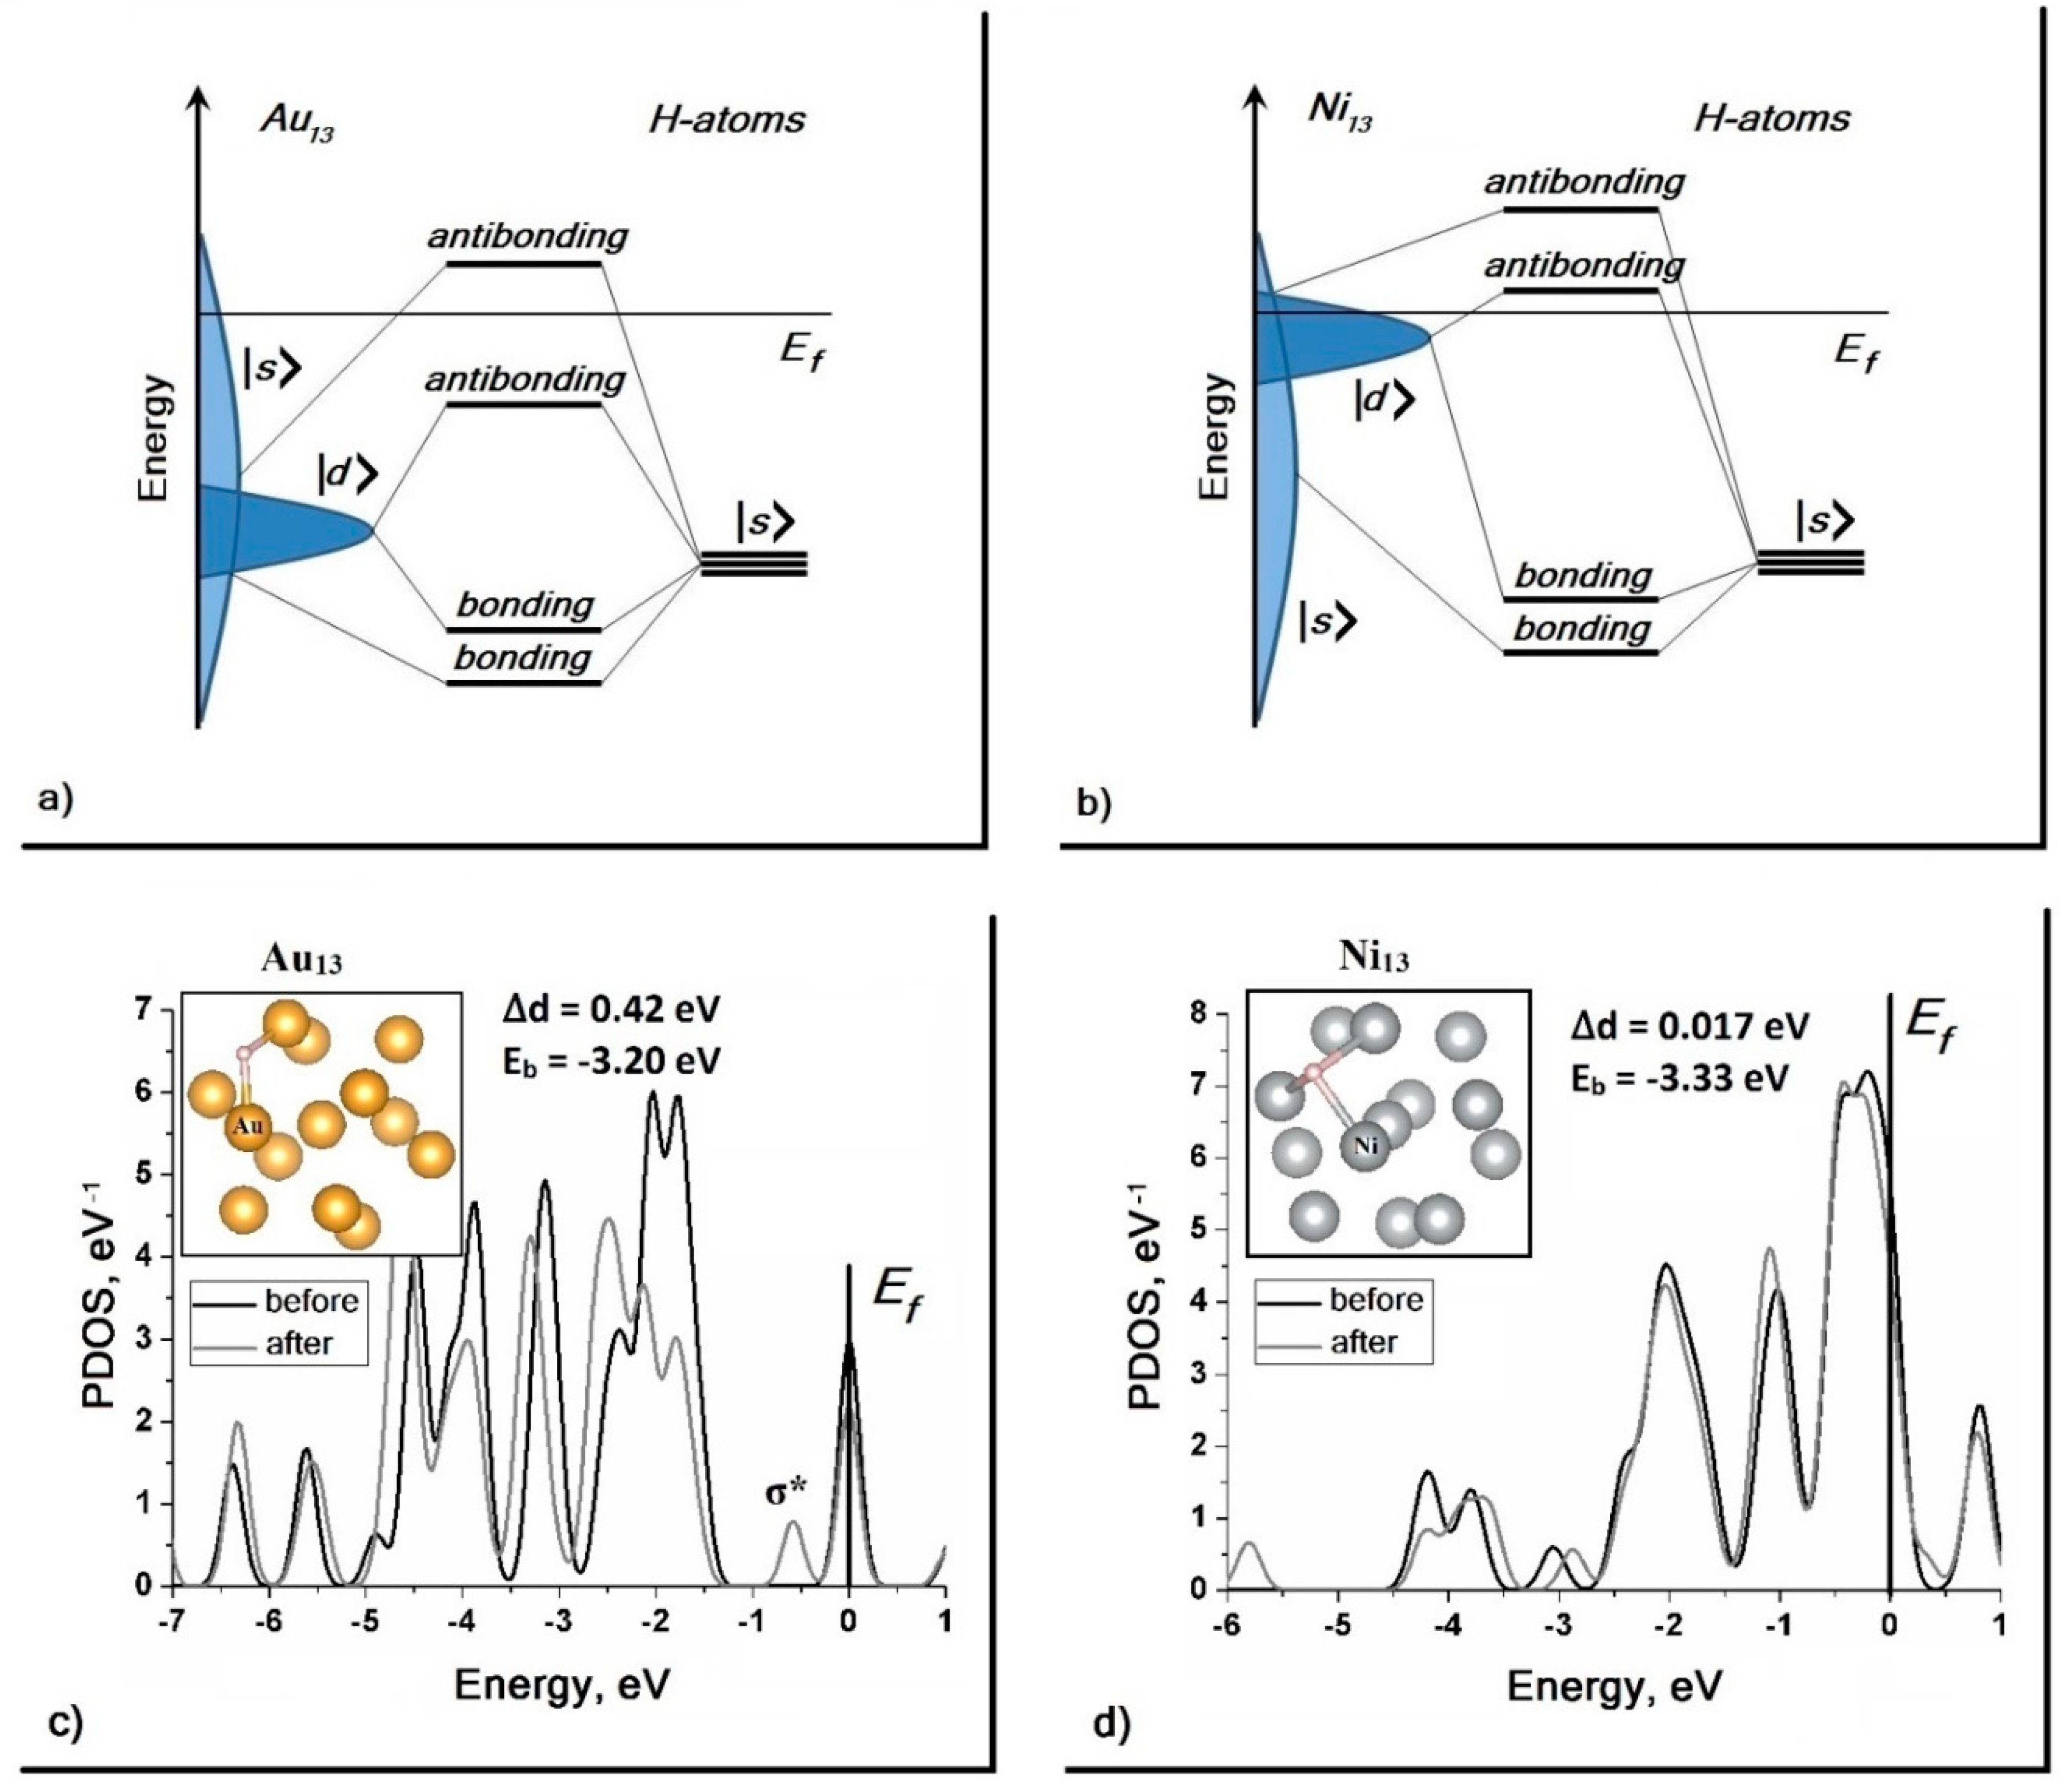
31] demonstrates the existence of a fairly stable form of hydrogen adsorption. How can these results be explained? PDOS calculations for clusters of noble Au13 and transitional Ni13 have shown that the conclusions drawn from a simple model of surface adsorption are also valid in cases of limited systems. The d-band of the Au13 cluster is located below the Fermi level, and after adsorption of hydrogen its center is shifted down, and the antibonding state σ* is formed (Figure 4c). In the case of Ni13 cluster — cluster of transition metal — the d-band is in the vicinity of the Fermi level, and the d-band shift is much smaller; therefore, no formation of the occupied antibonding state σ* takes place (Figure 4d).
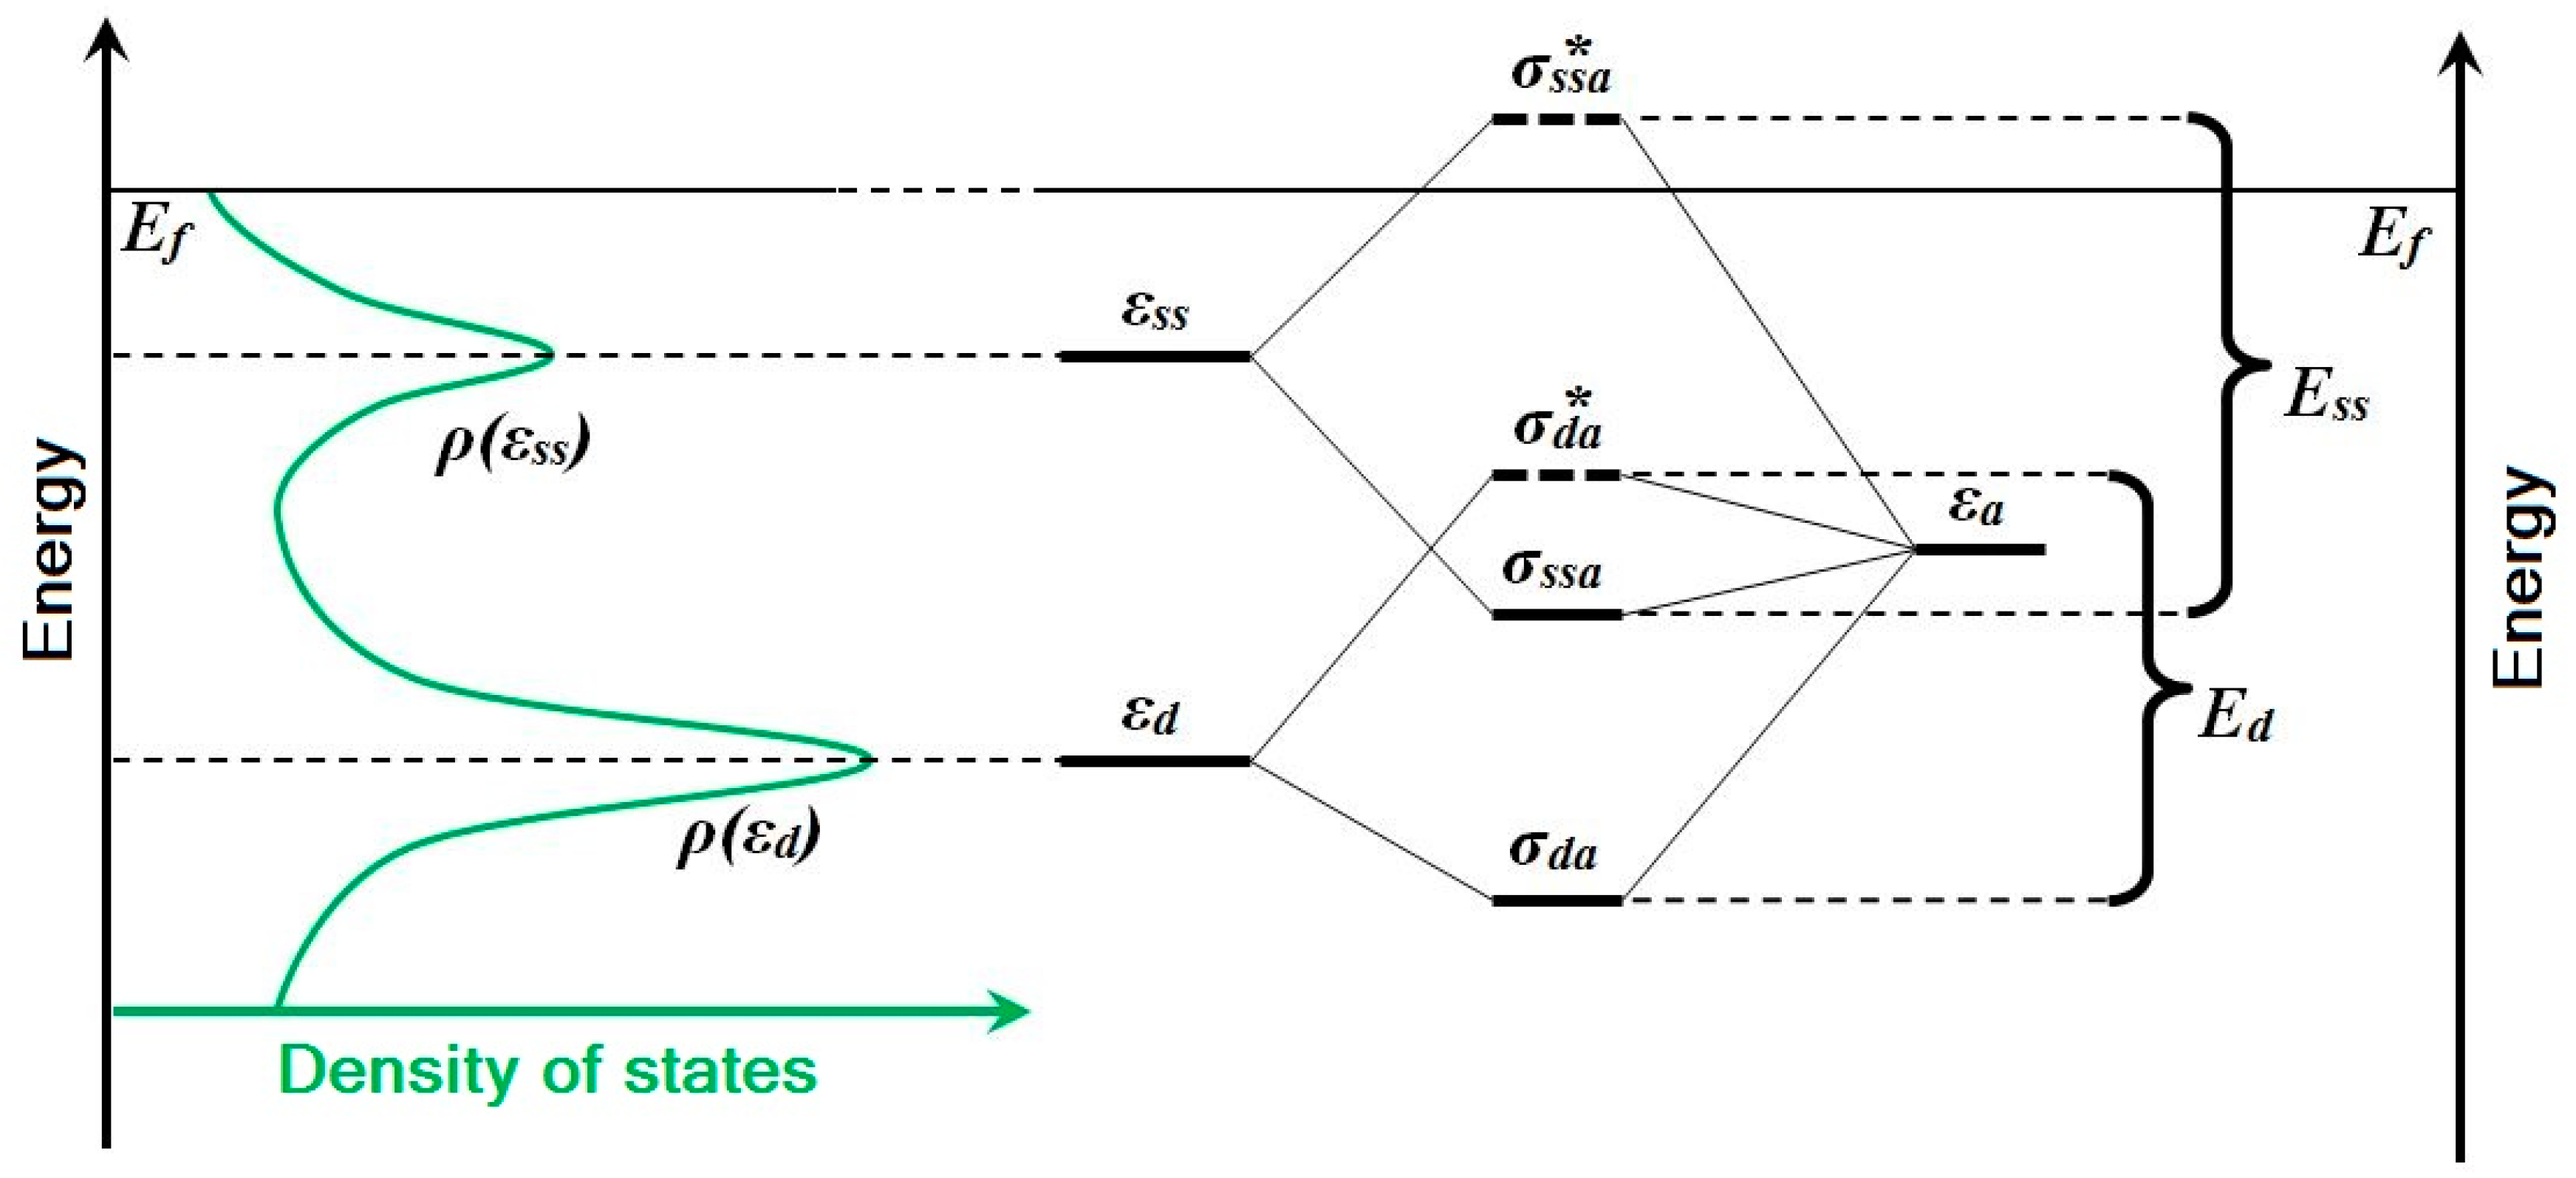
However, in the case of gold nanoparticles in comparison with the bulk, the contribution of surface states to the whole binding energy Eads increases with size reduction of nanoparticle—the well-known “size effect”:
E a d s = ρ ( ε d ) E d + ρ ( ε s s ) E s s ρ ( ε d ) + ρ ( ε s s )   ,
where ρ(εd) and ρ(εss) are the peak amplitudes of the density of d-states and surface states, and Ed and Ess are corresponding interaction energies. The ρ(εd)/ρ(εss) ratio is negligible for the surface of bulk gold, but it increases rapidly with nanoparticle size reduction. Also note that Ess > Ed. These changes are due to the location of the “band” of the surface-states. For noble metals, the peak ρ(εss) is ~0.5 eV lower than the Fermi level. In terms of two-state formalism, this means that the antibonding state of an Au-H “surface molecule” is unoccupied and does not compensate for the bonding-state contribution to the binding energy, in contrast with interaction just with the d-band states. This concept is shown schematically in Figure 5. Thus, it is due to the interaction with surface states of gold nanoparticles that the binding energy of the H adatom increases and provides existence of stable adsorption forms observed in experiments.
We now consider how the conductivity of STM tunneling contact is affected by hydrogen adsorption on the surface of gold nanoparticles. At kT >> eU, where U is bias voltage, the Fermi distribution f ( ε ) = ( 1 + e ε / k T ) 1 can be given as a Heaviside function and the tunneling current can be written as
I ( U ) = c o n s t k e U 0 M k ρ t i p ( ε + e U ) ρ k ( ε ) d ε   ,
where ρtip(ε) is density of states of the probe, ρk(ε) is local (projected on the kth atom) density of states of the sample, and Mk is the matrix element of wave function overlaps for the probe and the kth atom of the sample. To more clearly establish the dependence we are interested in, we assume that ρtip(ε) has no singularities in the vicinity of the Fermi level as it is usually observed in experiments. ρk(ε) and Mk can be approximated by values averaged over the region of tunneling contact:
M k = M = c o n s t   ,
ρ k ( ε ) = ρ s a m p l e ( ε ) = 1 / K k ρ k ( ε )   .
The tunneling current is now determined only by the density of states of the sample:
I ( U ) = c o n s t × M × ρ t i p ( 0 ) e U 0 ρ s a m p l e ( ε ) d ε .
At low-bias voltages, the decisive contribution to binding energy is made by the interaction of the H-adatom state with surface states of the gold nanoparticle. Note that the peak of surface states decreases as hydrogen atoms fill the nanoparticle surface—adsorption is known to influence the distribution of surface state densities [32]. Therefore, it is due to the reduction of density of states in the vicinity of the Fermi level that we can detect the acts of hydrogen (deuterium) interaction (dissociative adsorption) with gold nanoparticles in STM-STS experiments.
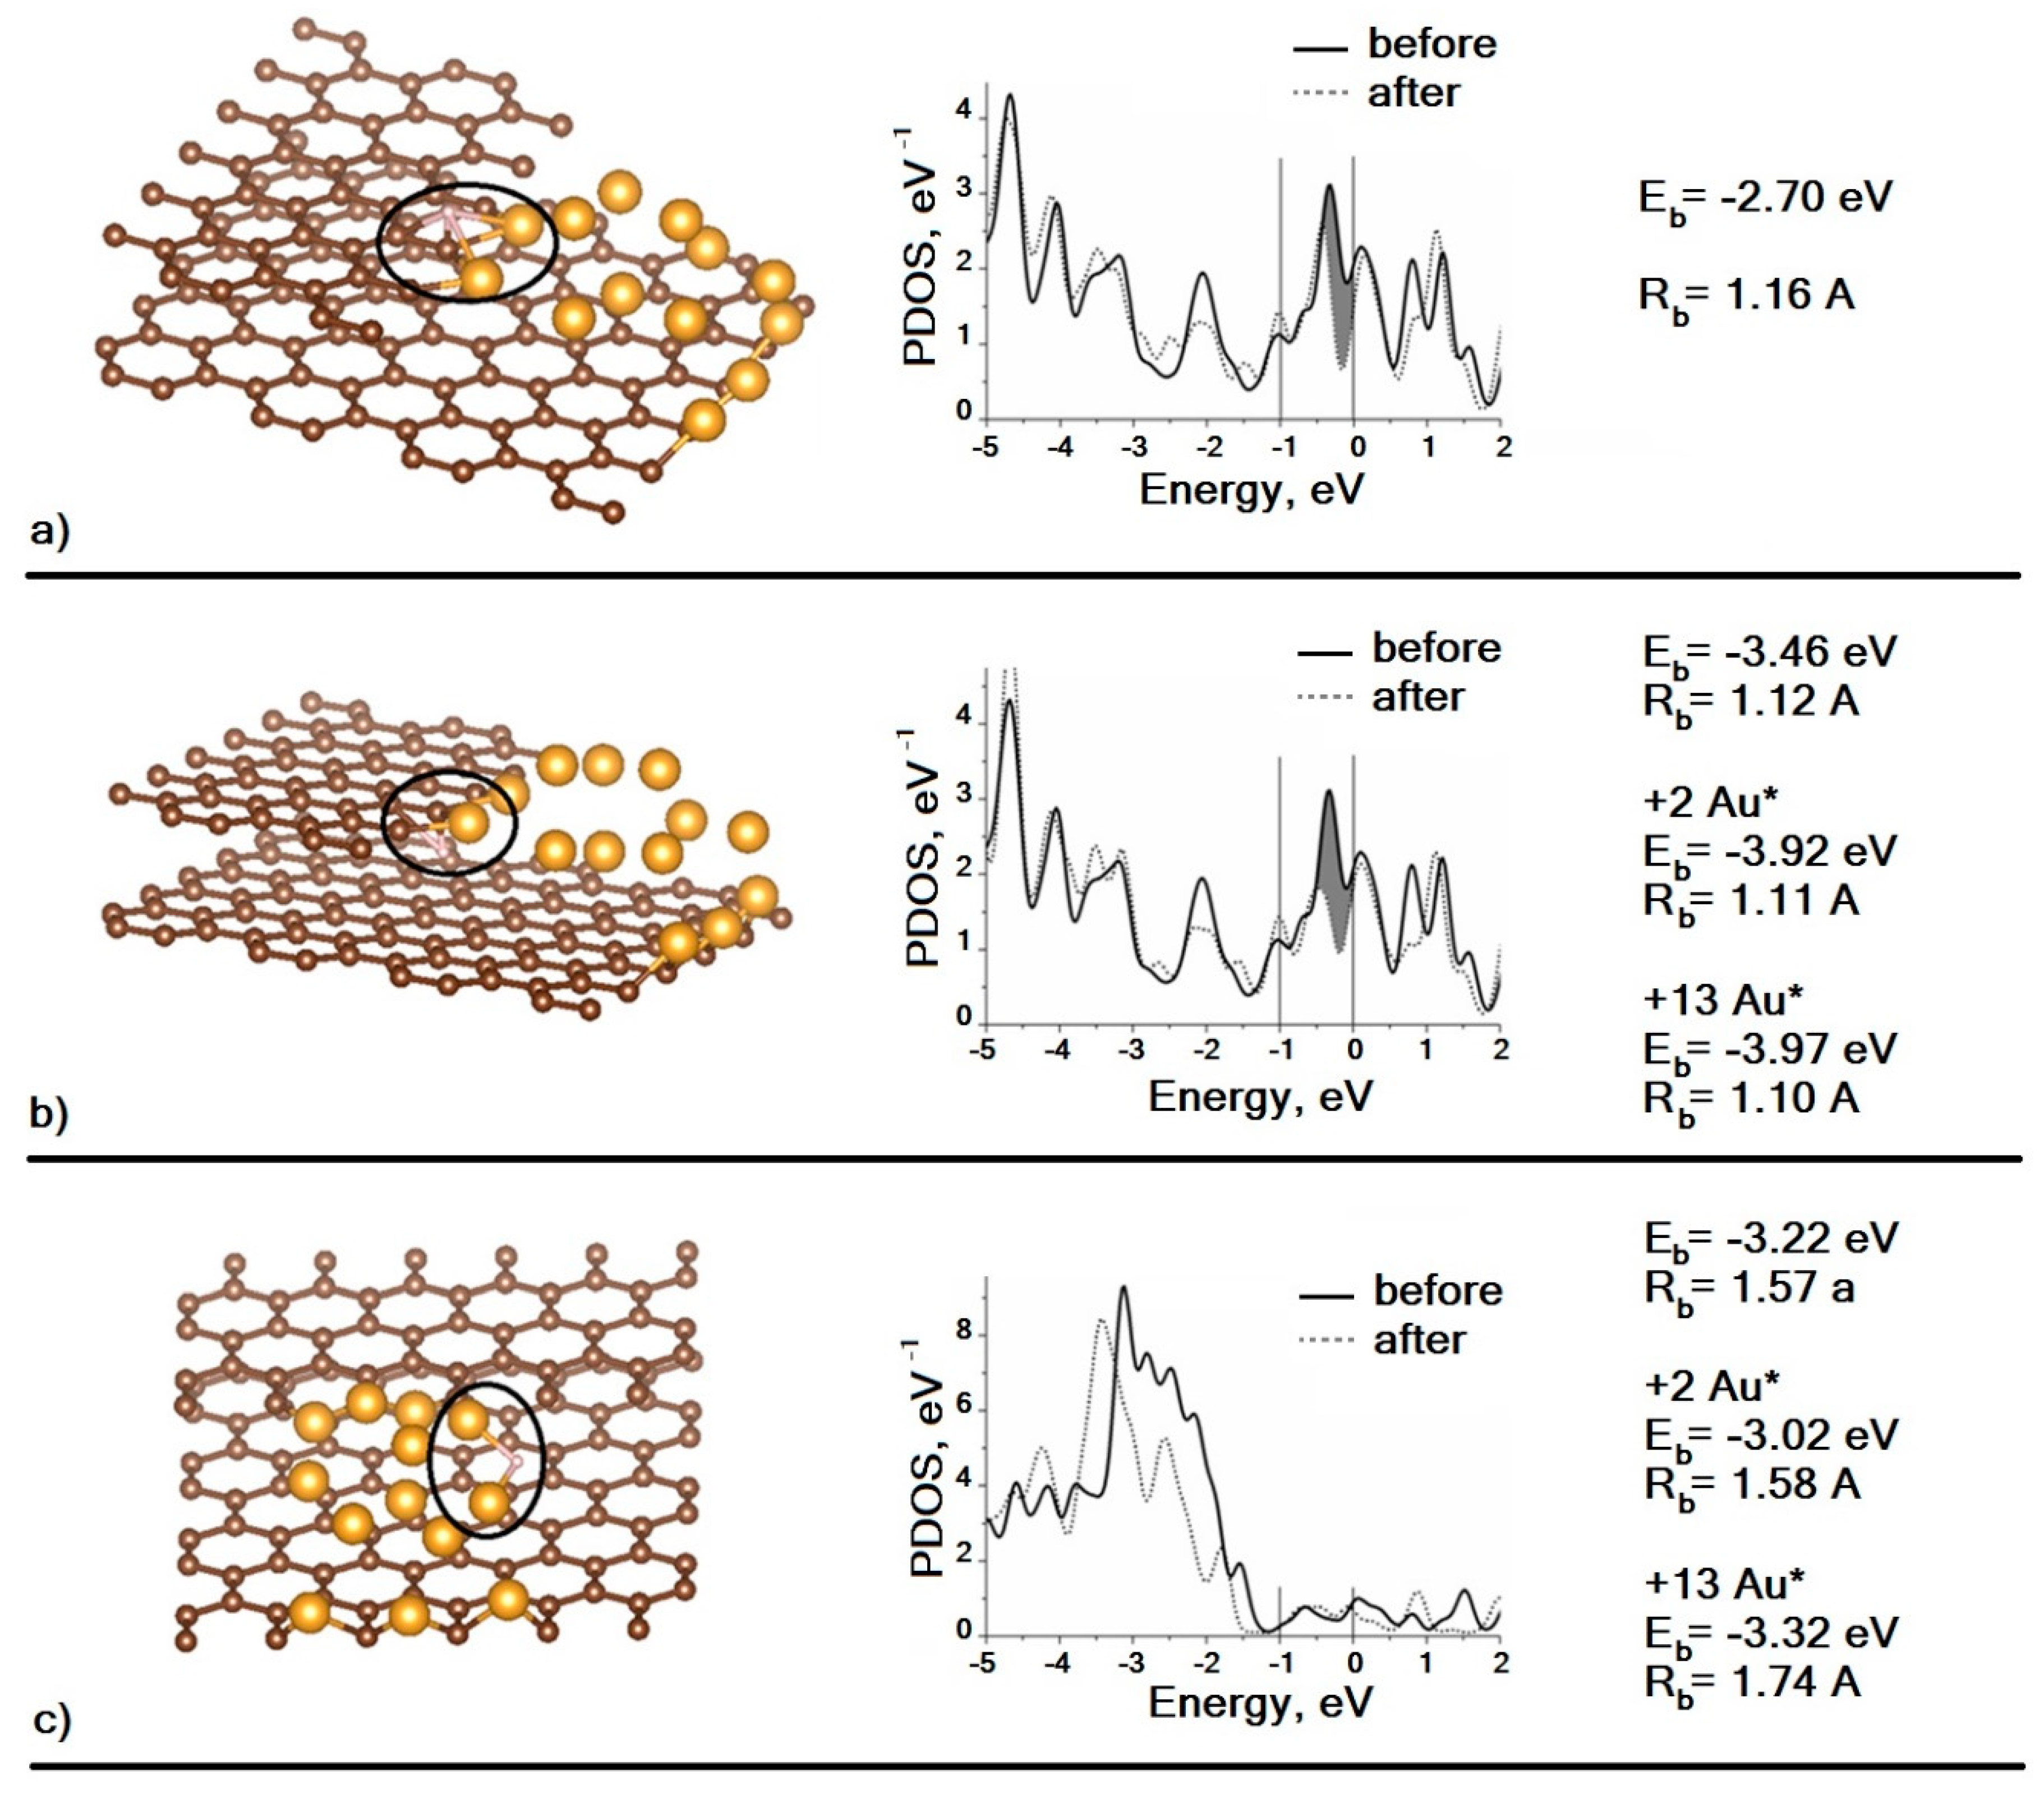
The density of states of individual atoms can also be calculated using DFT modeling and compared with the VAC measured in STM experiments, and we have performed this for the abovementioned supercluster Au13C138 which is a model of a gold nanoparticle at the edge of the graphite terrace. Summation over a set of projectors simulates a situation typical for STM experiments on metal clusters when the curvature radius of the probe is much less than the curvature radius of the cluster and when the tunneling current is formed by several atoms. In these cases, matrix elements of the wave function of the probe and the cluster atoms are assumed to be the same for simplicity. The results are shown in Figure 6.
As can be seen, in the case of D atom adsorption over the Au–C interface, the density of surface states decreases (Figure 6a). In the case of adsorption under the interface, a decrease in the density of surface states is also observed, and the binding energy of the adatom with the supercluster is higher than in the previous case (Figure 6b). For adsorption under the interface, the effect of the Au atoms’ mobility on the value of the binding energy with the D atom was also investigated. As shown by calculations, if we allow the two nearest Au atoms to move, the binding energy will increase by 0.46 eV (+2Au*), and if we remove the “freezing” from degrees of freedom for all Au atoms, the binding energy will increase by only 0.05 eV (+13Au*). Thus, it is possible to describe the interaction of D with a supercluster as local, since the perturbation of the atomic and electronic structure occurs on the atoms closest to D. In Figure 6c, one can see that the adsorption of the D atom at the top of the Au13 cluster does not lead to any noticeable decrease in the density of surface states. The binding energy of the D atom with the supercluster is calculated for three similar cases. Note that the difference in the adsorption energy at the interface and at the top is small (i.e., the surface migration of D adatoms is constrained because of a significant activation barrier). Existence of this barrier was confirmed experimentally in our previous work [20], where we described strong bonding between hydrogen and gold nanoparticles on the surface of graphite and the long transition time (up to 25–30 h) of the system to the final (stationary) state. Of course, the real values of binding energy are likely to be significantly lower than the calculated ones, which is at least partly due to the absence of the correction of basis set superposition error, but such comparison of calculated values is valid.
Thus, the results of quantum chemical calculations correlate with results of the above experiment, which together demonstrate that at small exposures of HOPG-supported gold nanoparticles to deuterium, adsorption occurs predominantly on the periphery of gold nanoparticles close to the gold–carbon interface. In addition, our calculations prove the conclusions of [20,21], where hydrogen adsorption on HOPG-supported gold nanoparticles was shown to decrease local conductivity of tunnel nanocontact.

4. Conclusions

Experimental study and quantum chemical simulation of deuterium adsorption on HOPG-supported gold nanoparticles were performed. The periphery of gold nanoparticles has been found experimentally to be the preferred region for deuterium adsorption. Quantum chemical simulation has shown deuterium adsorption in this region to be more beneficial in energy in comparison with other sites of the gold–carbon system. With increasing exposure and saturation of the interface adsorption sites, deuterium interacts with the rest of the gold nanoparticle surface, gradually covering it from periphery to the center.

Author Contributions

Conceptualization, A.K.G. and M.V.G.; methodology, M.V.G.; formal analysis, N.V.D.; investigation, A.K.G.; writing - original draft preparation, A.K.G. and N.V.D.; writing - review and editing, M.V.G. and S.Y.S.; visualization, S.Y.S. and N.V.D.; supervision, B.R.S.; project administration, A.K.G. and M.V.G.; funding acquisition, A.K.G.

Funding

This research was funded by the Russian Science Foundation, project No. 18-73-00195.

Acknowledgments

Quantum chemical calculations were carried out using the computing power of the Interdepartmental supercomputer center of the Russian Academy of Sciences.

Conflicts of Interest

The authors declare no conflict of interest. The funders had no role in the design of the study; in the collection, analyses, or interpretation of data; in the writing of the manuscript, or in the decision to publish the results.

References

  1. Haruta, M.; Yamada, N.; Kobayashi, T.; Iijima, S. Gold Catalysts Prepared by Coprecipitation for Low-Temperature Oxidation Of Hydrogen and of Carbon Monoxide. J. Catal. 1989, 115, 301–309. [Google Scholar] [CrossRef]
  2. Wittstock, A.; Zielasek, V.; Biener, J.; Friend, C.M.; Baumer, M. Nanoporous Gold Catalysts for Selective Gas-Phase Oxidative Coupling of Methanol at Low Temperature. Science 2010, 327, 319–322. [Google Scholar] [CrossRef] [PubMed] [Green Version]
  3. Raptis, C.; Garcia, H.; Stratakis, M. Selective Isomerization of Epoxides to Allylic Alcohols Catalyzed by TiO2-Supported Gold Nanoparticles. Angew. Chem. Int. Ed. 2009, 48, 3133–3136. [Google Scholar] [CrossRef]
  4. Taylor, S.F.R.; Sa, J.; Hardacre, C. Friedel-Crafts Alkylation of Aromatics with Benzyl Alcohol over Gold-Modified Silica. ChemCatChem 2011, 3, 119–121. [Google Scholar] [CrossRef]
  5. Meyer, R.; Shaikhutdinov, S.K.; Freund, H.-J. Surface Chemistry of Catalysis by Gold. Gold Bull. 2004, 37, 72–124. [Google Scholar] [CrossRef]
  6. Hashmi, A.S.K.; Hutchings, G.J. Gold Catalysis. Angew. Chem. Int. Ed. 2006, 45, 7896–7936. [Google Scholar] [CrossRef]
  7. Zhu, Y.; Tian, L.; Jiang, Z.; Pei, S.; Xie, S.; Qiao, M.; Fan, K.J. Heteroepitaxial Growth of Gold on Flowerlike Magnetite: An Efficacious and Magnetically Recyclable Catalyst for Chemoselective Hydrogenation of Crotonaldehyde to Crotyl Alcohol. J. Catal. 2011, 281, 106–118. [Google Scholar] [CrossRef]
  8. Corma, A.; Serna, P. Chemoselective Hydrogenation of Nitro Compounds with Supported Gold Catalysts. Science 2006, 313, 332–334. [Google Scholar] [CrossRef]
  9. Liu, X.; Hu, B.; Fujimoto, K.; Haruta, M.; Tokunaga, M. Hydroformylation of Olefins by Au/Co3O4 Catalysts. Appl. Catal. B 2009, 92, 411. [Google Scholar] [CrossRef]
  10. Ikariya, T.; Blacker, A.J. Asymmetric Transfer Hydrogenation of Ketones with Bifunctional Transition Metal-Based Molecular Catalysts. Acc. Chem. Res. 2007, 40, 1300–1308. [Google Scholar] [CrossRef]
  11. Su, F.-Z.; He, L.; Ni, J.; Cao, Y.; He, H.-Y.; Fan, K.-N. Efficient and Chemoselective Reduction of Carbonyl Compounds with Supported Gold Catalysts under Transfer Hydrogenation Conditions. Chem. Commun. 2008, 30, 3531–3533. [Google Scholar] [CrossRef] [PubMed]
  12. He, L.; Qian, Y.; Ding, R.-S.; Liu, Y.-M.; He, H.-Y.; Fan, K.-N.; Cao, Y. Highly Efficient Heterogeneous Gold-Catalyzed Direct Synthesis of Tertiary and Secondary Amines From Alcohols and Urea. ChemSusChem 2012, 5, 621–624. [Google Scholar] [CrossRef] [PubMed]
  13. Uozumi, Y.; Hamasaka, G. Hydrochlorination of Alkynes with Titaniasupported Gold Nanoparticles. Synfacts 2017, 13, 0890. [Google Scholar]
  14. Barton, D.G.; Podkolzin, S.G. Kinetic Study of a Direct Water Synthesis over Silica-Supported Gold Nanoparticles. J. Phys. Chem. B 2005, 109, 2262–2274. [Google Scholar] [CrossRef] [PubMed]
  15. Bus, E.; van Bokhoven, J.A. Hydrogen Chemisorption on Supported Platinum, Gold, and Platinum–Gold-Alloy Catalysts. Phys. Chem. Chem. Phys. 2007, 9, 2894–2902. [Google Scholar] [CrossRef] [PubMed]
  16. Shimizu, K.; Miyamoto, Y.; Kawasaki, T.; Tanji, T.; Tai, Y.; Satsuma, A.J. Chemoselective Hydrogenation of Nitroaromatics by Supported Gold Catalysts: Mechanistic Reasons of Size-and Support-Dependent Activity and Selectivity. Phys. Chem. C 2009, 113, 17803–17810. [Google Scholar] [CrossRef]
  17. Fujitani, T.; Nakamura, I.; Akita, T.; Okumura, M.; Haruta, M. Hydrogen Dissociation by Gold Clusters. Angew. Chem. Int. Ed. 2009, 48, 9515–9518. [Google Scholar] [CrossRef] [PubMed]
  18. Boronat, M.; Illas, F.; Corma, A. Active Sites for H2 Adsorption and Activation in Au/TiO2 and the Role of the Support. J. Phys. Chem. A 2009, 113, 3750–3757. [Google Scholar] [CrossRef] [PubMed]
  19. Panayotov, D.A.; Burrows, S.P.; Yates, J.T.; Morris, J.R. Mechanistic Studies of Hydrogen Dissociation and Spillover on Au/TiO2: IR Spectroscopy of Coadsorbed CO and H-Donated Electrons. J. Phys. Chem. C 2011, 115, 22400–22408. [Google Scholar] [CrossRef]
  20. Gatin, A.K.; Grishin, M.V.; Kirsankin, A.A.; Kharitonov, V.A.; Shub, B.R. Individual Nanoparticles of Aluminum, Gold, Nickel, and Platinum Deposited on a Pyrolytic Graphite Surface. Nanotechnol. Russ. 2013, 8, 36–45. [Google Scholar] [CrossRef]
  21. Grishin, M.V.; Gatin, A.K.; Dokhlikova, N.V.; Kirsankin, A.A.; Kulak, A.I.; Nikolaev, S.A.; Shub, B.R. Adsorption and Interaction of Hydrogen and Oxygen on the Surface of Separate Crystalline Gold Nanoparticles. Kinet. Catal. 2015, 56, 532–539. [Google Scholar] [CrossRef]
  22. Dokhlikova, N.V.; Kolchenko, N.N.; Grishin, M.V.; Shub, B.R. Electron delocalization in heterogeneous systems AunHm. Nanotechnol. Russ. 2016, 11, 7–11. [Google Scholar] [CrossRef]
  23. Scanning Tunneling Microscopy, I. General Principles and Applications to Clean and Absorbate-Covered Surfaces; Guntherodt, H.J., Wiesendanger, R., Eds.; Springer: Berlin, Germany, 1994; p. 280. [Google Scholar]
  24. Binnig, G.; Rohrer, H.; Gerber, C.; Weibel, E. Tunneling Through a Controllable Vacuum Gap. Appl. Phys. Lett. 1982, 40, 178–180. [Google Scholar] [CrossRef]
  25. Meyer, E.; Hug, H.J.; Bennewitz, R. Scanning Probe Microscopy; Springer: Berlin, Germany, 2004; p. 210. [Google Scholar]
  26. Hamers, R.J.; Wang, Y.J. Atomically-Resolved Studies of the Chemistry and Bonding at Silicon Surfaces. Chem. Rev. 1996, 96, 1261–1290. [Google Scholar] [CrossRef] [PubMed]
  27. Hamers, R.J.; Tromp, R.M.; Demuth, J.E. Surface Electronic Structure of Si (111)-(7 × 7) Resolved in Real Space. Phys. Rev. Lett. 1986, 56, 1972–1975. [Google Scholar] [CrossRef] [PubMed]
  28. Hammer, B.; Norskov, J.K. Why gold is the noblest of all the metals. Nature 1995, 376, 238–240. [Google Scholar] [CrossRef]
  29. Manzoli, M.; Chiorino, A.; Vindigni, V.; Boccuzzi, F. Hydrogen Interaction with Gold Nanoparticles and Clusters Supported on Different Oxides: A FTIR Study. Catal. Today 2012, 181, 62–67. [Google Scholar] [CrossRef]
  30. Silverwood, I.P.; Rogers, S.M.; Callear, S.K.; Parker, S.F.; Catlow, C.R.A. Evidence for a Surface Gold Hydride on a Nanostructured Gold Catalyst. Chem. Commun. 2016, 52, 533–536. [Google Scholar] [CrossRef]
  31. Watkins, W.L.; Borensztein, Y. Mechanism of Hydrogen Adsorption on Gold Nanoparticles and Charge Transfer Probed by Anisotropic Surface Plasmon Resonance. Phys. Chem. Chem. Phys. 2017, 19, 27397–27405. [Google Scholar] [CrossRef]
  32. Belen’kii, A.Y. Electronic surface states of crystals. Sov. Phys. Uspekhi 1981, 24, 412–425. [Google Scholar] [CrossRef]
Figure 1. Gold nanoparticles deposited on HOPG: (a) topography image, (b) VAC of nanoparticles and HOPG before exposure to deuterium, (c) Auger spectrum of the sample.
Crystals 09 00350 g001
Figure 2. Topography image, VAC, and current image of gold nanoparticles and HOPG at different experimental stages. The letter designation of the curves corresponds to the points on the topography. After exposure to deuterium: (a) 200 L; (b) 800 L; (c) 1200 L; (d) 1600 L; (e) 2000 L; (f) 3000 L.
Crystals 09 00350 g002aCrystals 09 00350 g002b
Figure 3. Schematic representation of the change in the local electronic structure of an atom in the case of adsorption on the surfaces of simple (alkali) and transition/noble metals.
Crystals 09 00350 g003
Figure 4. Diagrams of energy levels (a,b) and PDOS representations (c,d) for metal clusters interacting with a hydrogen atom: (a,c) Au13 cluster; (b,d) for Ni13 cluster.
Crystals 09 00350 g004
Figure 5. Correlation diagram illustrating the difference in position of antibonding orbitals formed due to the interaction of adatom with surface states and d-band states.
Crystals 09 00350 g005
Figure 6. The projected density of electron states for various active centers in the supercluster Au13C138: (a) adsorption over the Au–C interface; (b) adsorption under the Au–C interface; (c) adsorption at the top of the Au13 cluster. The cases of various numbers of mobile gold atoms are marked as “+2 Au*” and “+13 Au*”.
Crystals 09 00350 g006

