Hydrothermal Synthesis of Layered Titanium Phosphate Ti2O2H(PO4)[(NH4)2PO4]2 and Its Potential Application in Cosmetics


Abstract

1. Introduction
2. Materials and Methods
3. Results and Discussion
4. Conclusions
Supplementary Materials
Author Contributions
Funding
Acknowledgments
Conflicts of Interest
References
- Oguchi-Fujiwara, N.; Hatao, M.; Sakamoto, K. Chapter 35—Ultraviolet Care Cosmetics. In Cosmetic Science and Technology: Theoretical Principles and Applications; Sakamoto, K., Lochhead, R.Y., Maibach, H.I., Yamashita, Y., Eds.; Elsevier: Amsterdam, The Netherlands, 2017; pp. 587–599. [Google Scholar] [CrossRef]
- Auffan, M.; Pedeutour, M.; Rose, J.; Masion, A.; Ziarelli, F.; Borschneck, D.; Chaneac, C.; Botta, C.; Chaurand, P.; Labille, J.; et al. Structural Degradation at the Surface of a TiO2-Based Nanomaterial Used in Cosmetics. Environ. Sci. Technol. 2010, 44, 2689–2694. [Google Scholar] [CrossRef]
- Hirakawa, T.; Nosaka, Y. Properties of O2•− and OH• Formed in TiO2 Aqueous Suspensions by Photocatalytic Reaction and the Influence of H2O2 and Some Ions. Langmuir 2002, 18, 3247–3254. [Google Scholar] [CrossRef]
- Saito, H.; Nosaka, Y. Mechanism of Singlet Oxygen Generation in Visible-Light-Induced Photocatalysis of Gold-Nanoparticle-Deposited Titanium Dioxide. J. Phys. Chem. C 2014, 118, 15656–15663. [Google Scholar] [CrossRef]
- Jiang, J.; Oberdörster, G.; Elder, A.; Gelein, R.; Mercer, P.; Biswas, P. Does nanoparticle activity depend upon size and crystal phase? Nanotoxicology 2008, 2, 33–42. [Google Scholar] [CrossRef]
- Carlotti, M.E.; Ugazio, E.; Sapino, S.; Fenoglio, I.; Greco, G.; Fubini, B. Role of particle coating in controlling skin damage photoinduced by titania nanoparticles. Free Radic. Res. 2009, 43, 312–322. [Google Scholar] [CrossRef]
- Yadav, U.C.S. Oxidative Stress-Induced Lipid Peroxidation: Role in Inflammation. In Free Radicals in Human Health and Disease; Rani, V., Yadav, U.C.S., Eds.; Springer: New Delhi, India, 2015; pp. 119–129. [Google Scholar] [CrossRef]
- Lebedev, V.A.; Kozlov, D.A.; Kolesnik, I.V.; Poluboyarinov, A.S.; Becerikli, A.E.; Grünert, W.; Garshev, A.V. The amorphous phase in titania and its influence on photocatalytic properties. Appl. Catal. B Environ. 2016, 195, 39–47. [Google Scholar] [CrossRef]
- Herrmann, J.-M. Detrimental cationic doping of titania in photocatalysis: Why chromium Cr3+-doping is a catastrophe for photocatalysis, both under UV- and visible irradiations. New J. Chem. 2012, 36, 883–890. [Google Scholar] [CrossRef]
- Kemp, T.J.; McIntyre, R.A. Transition metal-doped titanium(IV) dioxide: Characterisation and influence on photodegradation of poly(vinyl chloride). Polym. Degrad. Stab. 2006, 91, 165–194. [Google Scholar] [CrossRef]
- Kolesnik, I.V.; Lebedev, V.A.; Garshev, A.V. Optical properties and photocatalytic activity of nanocrystalline TiO2, doped by 3d-metal ions. Nanosyst. Phys. Chem. Math. 2018, 9, 401–409. [Google Scholar] [CrossRef]
- Matsukura, A.; Onoda, H. Influences of additives on phosphoric acid treatment of titanium dioxide as a novel white pigment. J. Adv. Ceram. 2015, 4, 211–216. [Google Scholar] [CrossRef][Green Version]
- Onoda, H.; Yamaguchi, T. Synthesis of Titanium Phosphates with Additives and Their Powder Properties for Cosmetics. Mater. Sci. Appl. 2012, 3, 18–23. [Google Scholar] [CrossRef][Green Version]
- Onoda, H.; Fujikado, S.; Toyama, T. Preparation of titanium phosphate white pigments with titanium sulfate and their powder properties. J. Adv. Ceram. 2014, 3, 132–136. [Google Scholar] [CrossRef][Green Version]
- Petříček, V.; Dušek, M.; Palatinus, L. Crystallographic Computing System JANA2006: General features. Z. Kristallogr. 2014, 229, 345–352. [Google Scholar] [CrossRef]
- Frank, O.; Zukalova, M.; Laskova, B.; Kurti, J.; Koltai, J.; Kavan, L. Raman spectra of titanium dioxide (anatase, rutile) with identified oxygen isotopes (16, 17, 18). Phys. Chem. Chem. Phys. 2012, 14, 14567–14572. [Google Scholar] [CrossRef]
- Kandiel, T.A.; Robben, L.; Alkaim, A.; Bahnemann, D. Brookite versus anatase TiO2 photocatalysts: Phase transformations and photocatalytic activities. Photochem. Photobiol. Sci. 2013, 12, 602–609. [Google Scholar] [CrossRef]
- Kobayashi, M.; Tomita, K.; Petrykin, V.; Yoshimura, M.; Kakihana, M. Direct synthesis of brookite-type titanium oxide by hydrothermal method using water-soluble titanium complexes. J. Mater. Sci. 2008, 43, 2158–2162. [Google Scholar] [CrossRef]
- Hecht, H.G. The Interpretation of Diffuse Reflectance Spectra. J. Res. Natl. Bur. Stand. A Phys. Chem. 1976, 80A, 567–583. [Google Scholar] [CrossRef]
- D’Amato, C.A.; Giovannetti, R.; Zannotti, M.; Rommozzi, E.; Ferraro, S.; Seghetti, C.; Minicucci, M.; Gunnella, R.; Di Cicco, A. Enhancement of visible-light photoactivity by polypropylene coated plasmonic Au/TiO2 for dye degradation in water solution. Appl. Surf. Sci. 2018, 441, 575–587. [Google Scholar] [CrossRef]
- Khatun, N.; Rini, E.G.; Shirage, P.; Rajput, P.; Jha, S.N.; Sen, S. Effect of lattice distortion on bandgap decrement due to vanadium substitution in TiO2 nanoparticles. Mater. Sci. Semicond. Process. 2016, 50, 7–13. [Google Scholar] [CrossRef]
- Khainakova, O.A.; Espina, A.; Trobajo, C.; Khainakov, S.A.; García, J.R.; Bortun, A.I. Ion-exchange properties of a novel layered titanium(IV) phosphate. In Studies in Surface Science and Catalysis; Rodriguez-Reinoso, F., McEnaney, B., Rouquerol, J., Unger, K., Eds.; Elsevier: Amsterdam, The Netherlands, 2002; Volume 144, pp. 701–708. [Google Scholar] [CrossRef]
- Zhu, Y.; Hasegawa, G.; Kanamori, K.; Kiyomura, T.; Kurata, H.; Hayashi, K.; Nakanishi, K. Nanostructured titanium phosphates prepared via hydrothermal reaction and their electrochemical Li- and Na-ion intercalation properties. CrystEngComm 2017, 19, 4551–4560. [Google Scholar] [CrossRef]
- García-Granda, S.; Salvadó, M.A.; Pertierra, P.; García, J.R.; Bortun, A.I.; Clearfield, A. Synchrotron X-ray Powder Structure of the New Layered Phosphate Ti2O2H(PO4)[(NH4)2PO4]2. Mater. Sci. Forum 2001, 378–381, 665–670. [Google Scholar] [CrossRef]
- Stanghellini, P.L.; Boccaleri, E.; Diana, E.; Alberti, G.; Vivani, R. Vibrational Study of Some Layered Structures Based on Titanium and Zirconium Phosphates. Inorg. Chem. 2004, 43, 5698–5703. [Google Scholar] [CrossRef]
- Nakamoto, K. Infrared and Raman Spectra of Inorganic and Coordination Compounds, 5th ed.; Wiley: New York, NY, USA, 1986; pp. 156–159. [Google Scholar]
- Di Paola, A.; Bellardita, M.; Palmisano, L.; Parrino, F. Junction Effect on the Photocatalytic Activity of Mixed-Phase TiO2 Nanoparticles. ECS Trans. 2010, 25, 29–35. [Google Scholar] [CrossRef]
- Serpone, N.; Lawless, D.; Khairutdinov, R. Size Effects on the Photophysical Properties of Colloidal Anatase TiO2 Particles: Size Quantization versus Direct Transitions in This Indirect Semiconductor? J. Phys. Chem. 1995, 99, 16646–16654. [Google Scholar] [CrossRef]
- Monticone, S.; Tufeu, R.; Kanaev, A.V.; Scolan, E.; Sanchez, C. Quantum size effect in TiO2 nanoparticles: Does it exist? Appl. Surf. Sci. 2000, 162–163, 565–570. [Google Scholar] [CrossRef]
- Serpone, N. Is the Band Gap of Pristine TiO2 Narrowed by Anion- and Cation-Doping of Titanium Dioxide in Second-Generation Photocatalysts? J. Phys. Chem. B 2006, 110, 24287–24293. [Google Scholar] [CrossRef]
- Ao, Y.; Bao, J.; Wang, P.; Wang, C.; Hou, J. Bismuth oxychloride modified titanium phosphate nanoplates: A new p-n type heterostructured photocatalyst with high activity for the degradation of different kinds of organic pollutants. J. Colloid Interface Sci. 2016, 476, 71–78. [Google Scholar] [CrossRef]
- Kim, Y.; Kim, H.-C.; Lee, J.; Lee, S.-H.; Kwon, K.-Y. Morphological change and photocatalytic activity of titanium phosphates. J. Photochem. Photobiol. A Chem. 2017, 338, 146–151. [Google Scholar] [CrossRef]


| Sample | Phase Composition | Ti:P Molar Ratio in the Reaction Mixture | Ti:P Molar Ratio in the Sample (EDX) |
|---|---|---|---|
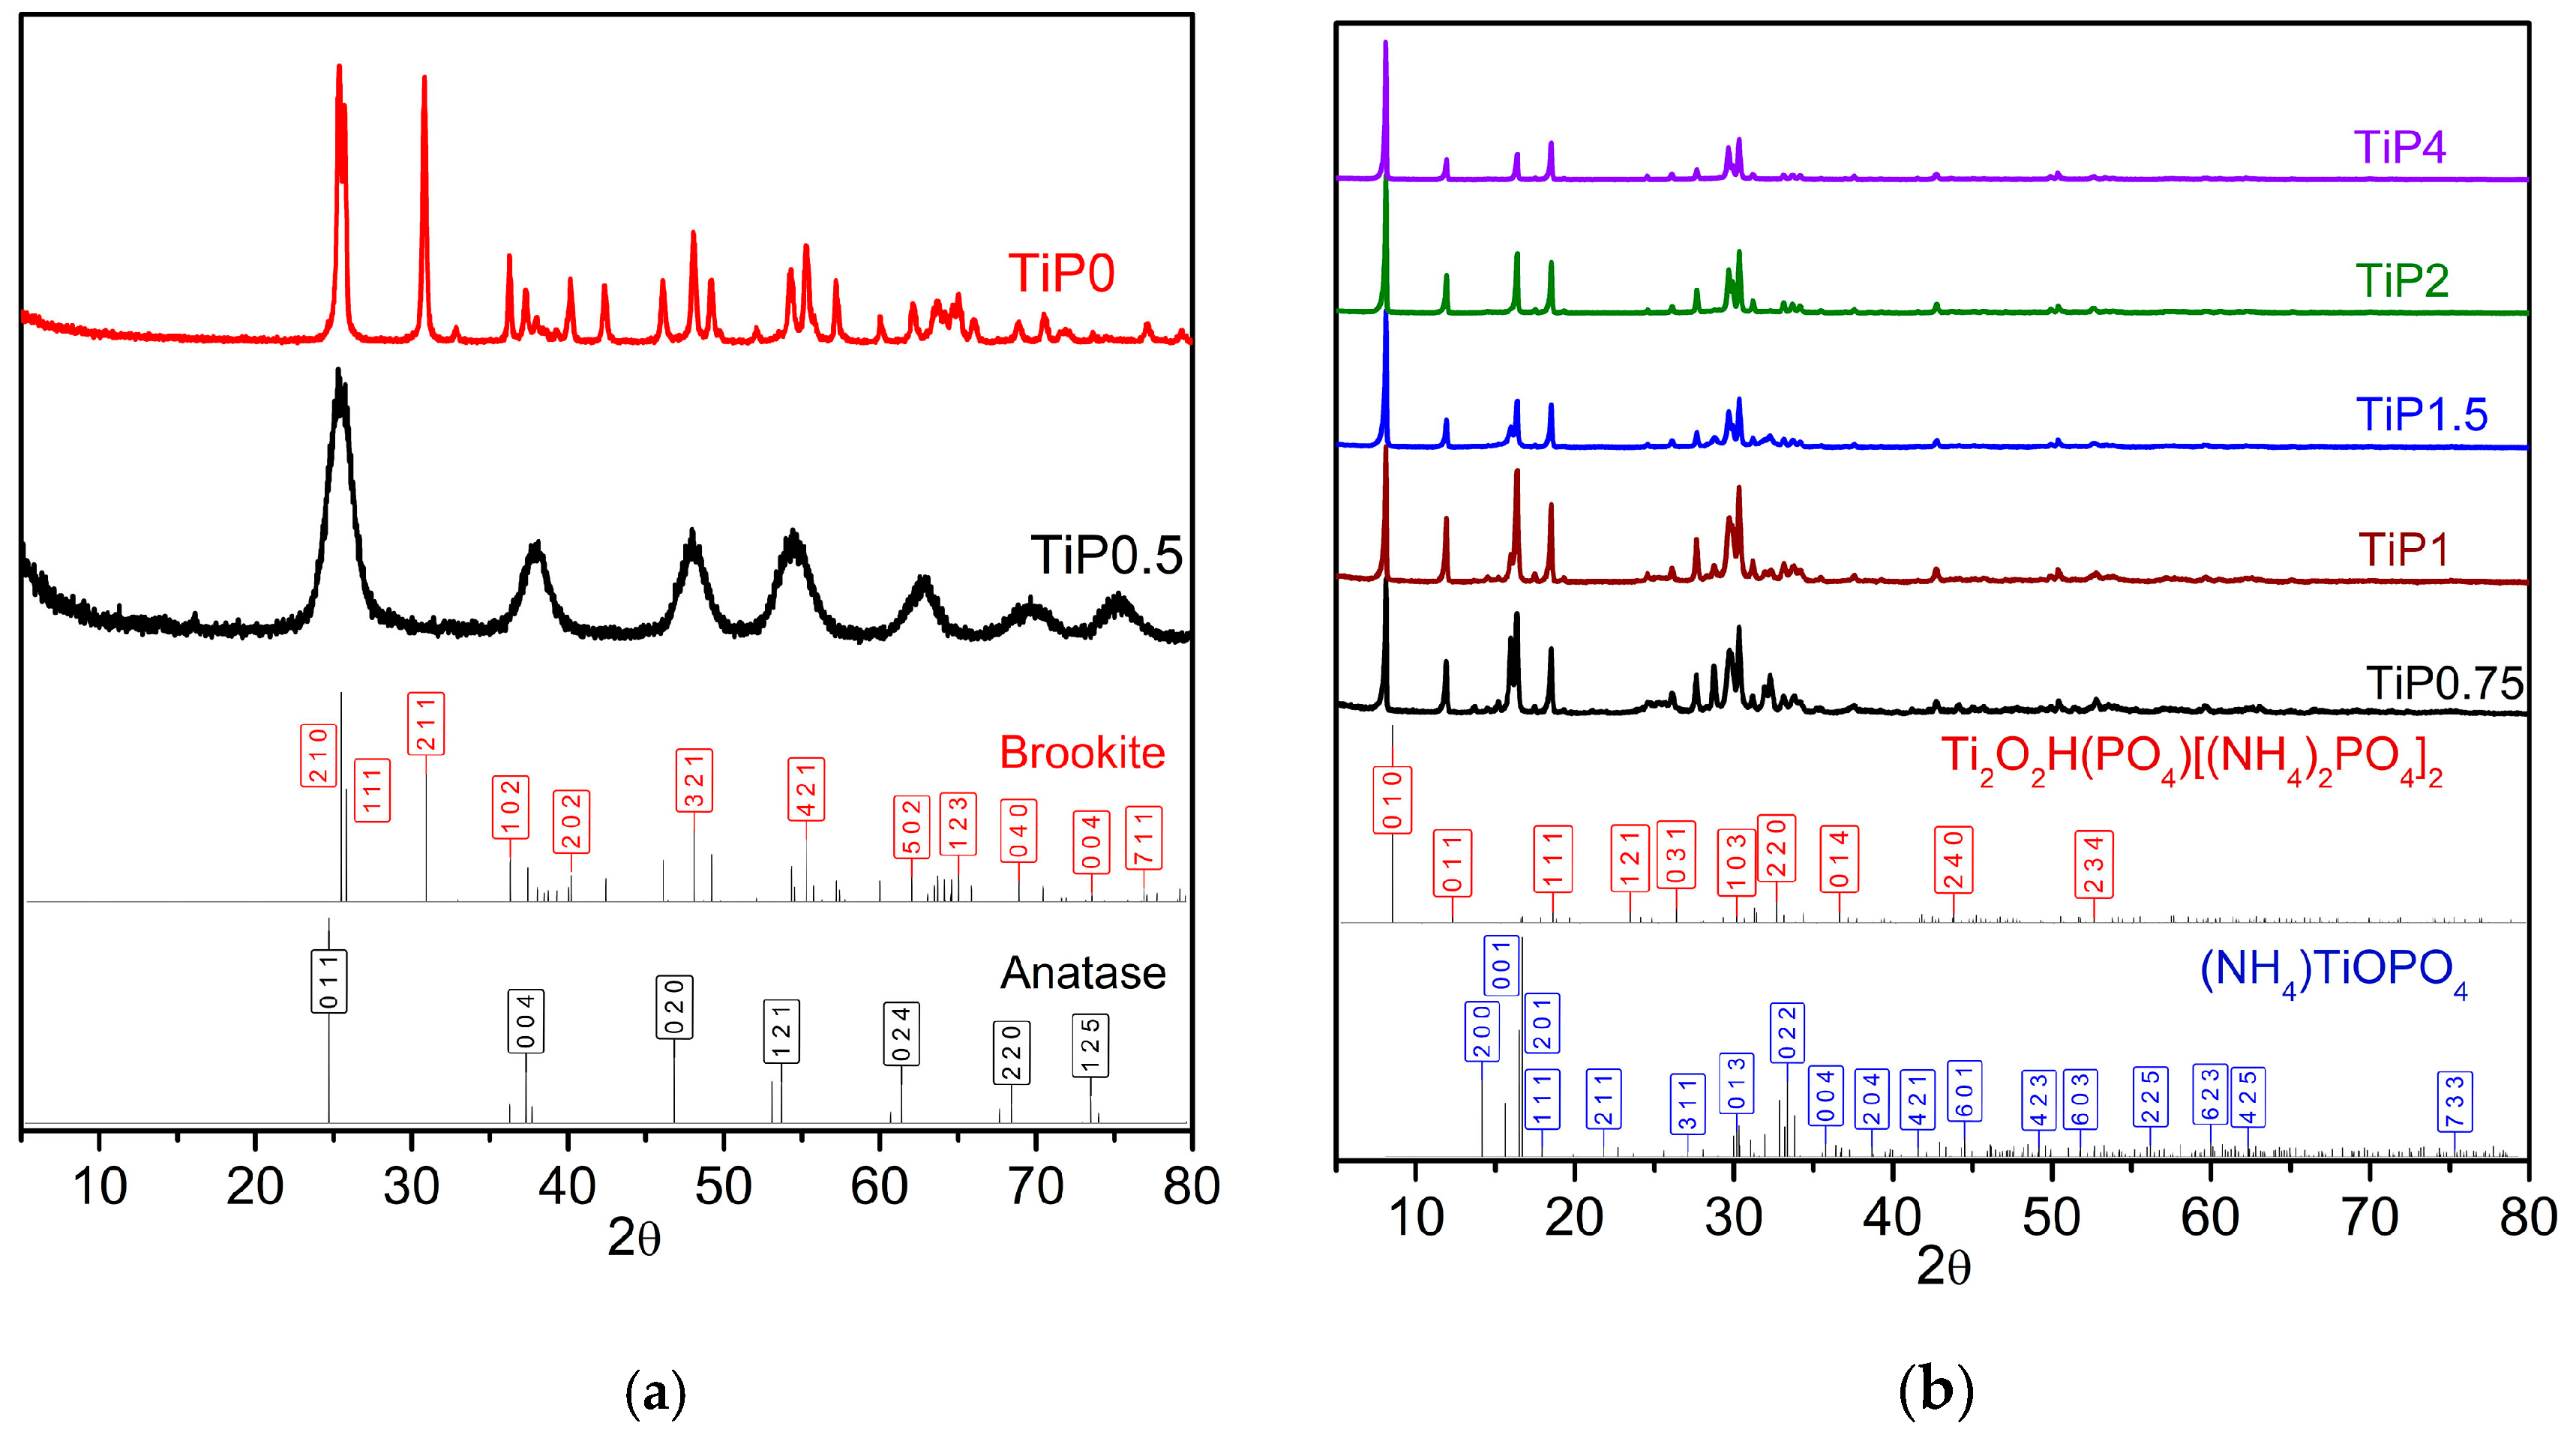
| TiP0 | TiO2 (brookite) | without phosphate | 1:0 |
| TiP0.5 | TiO2 (anatase) | 1:0.5 | 1:0.05 |
| TiP0.75 | Ti2O2H(PO4)[(NH4)2PO4]2 + (NH4)TiOPO4 | 1:0.75 | 1:1.2 |
| TiP1 | Ti2O2H(PO4)[(NH4)2PO4]2 + (NH4)TiOPO4 | 1:1 | 1:1.3 |
| TiP1.5 | Ti2O2H(PO4)[(NH4)2PO4]2 + (NH4)TiOPO4 | 1:1.5 | 1:1.4 |
| TiP2 | Ti2O2H(PO4)[(NH4)2PO4]2 | 1:2 | 1:1.5 |
| TiP4 | Ti2O2H(PO4)[(NH4)2PO4]2 | 1:4 | 1:1.5 |
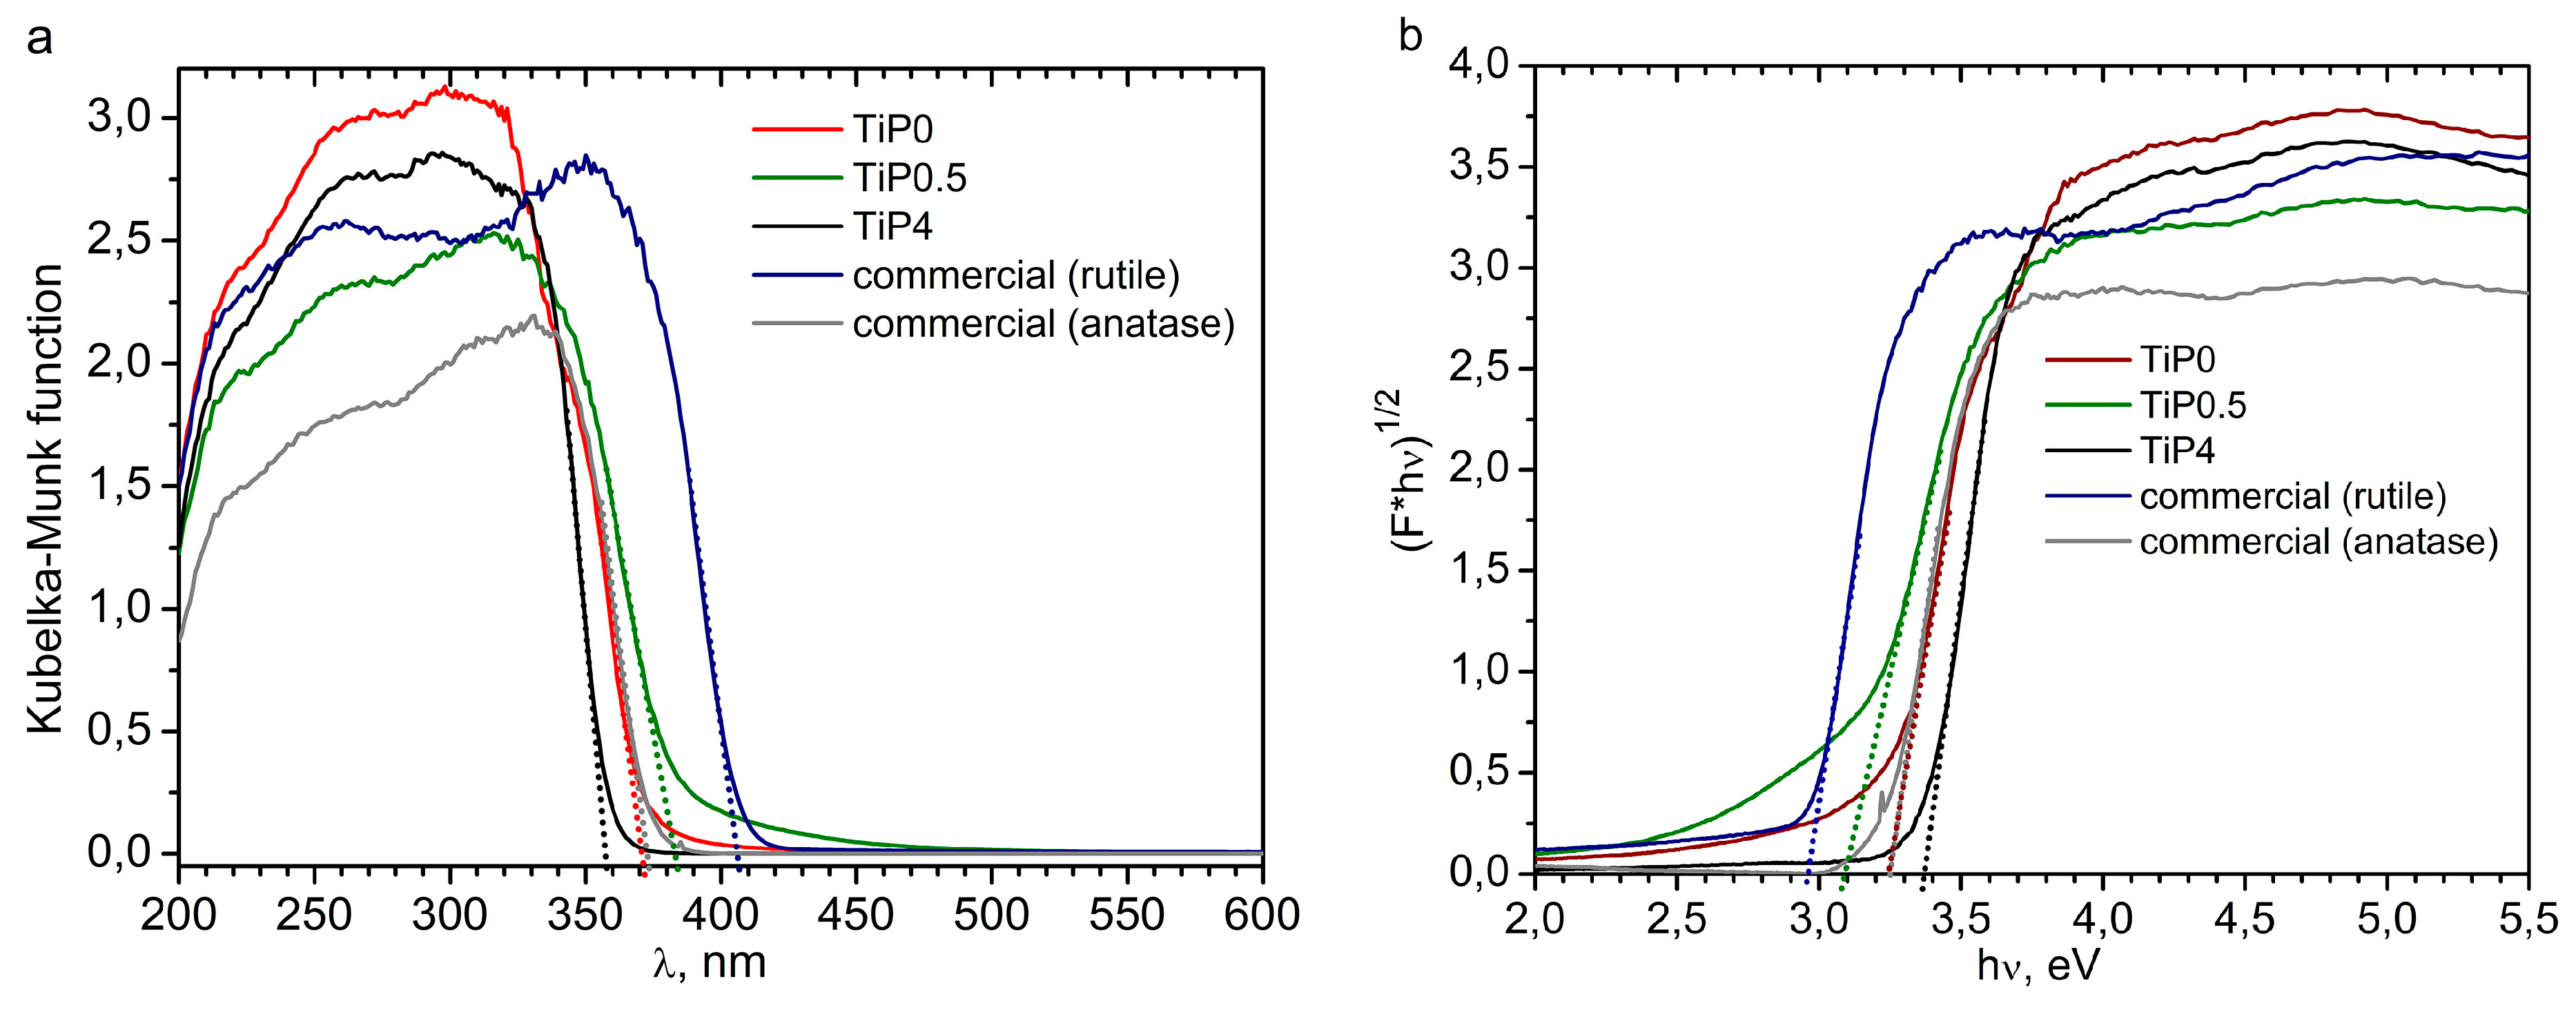
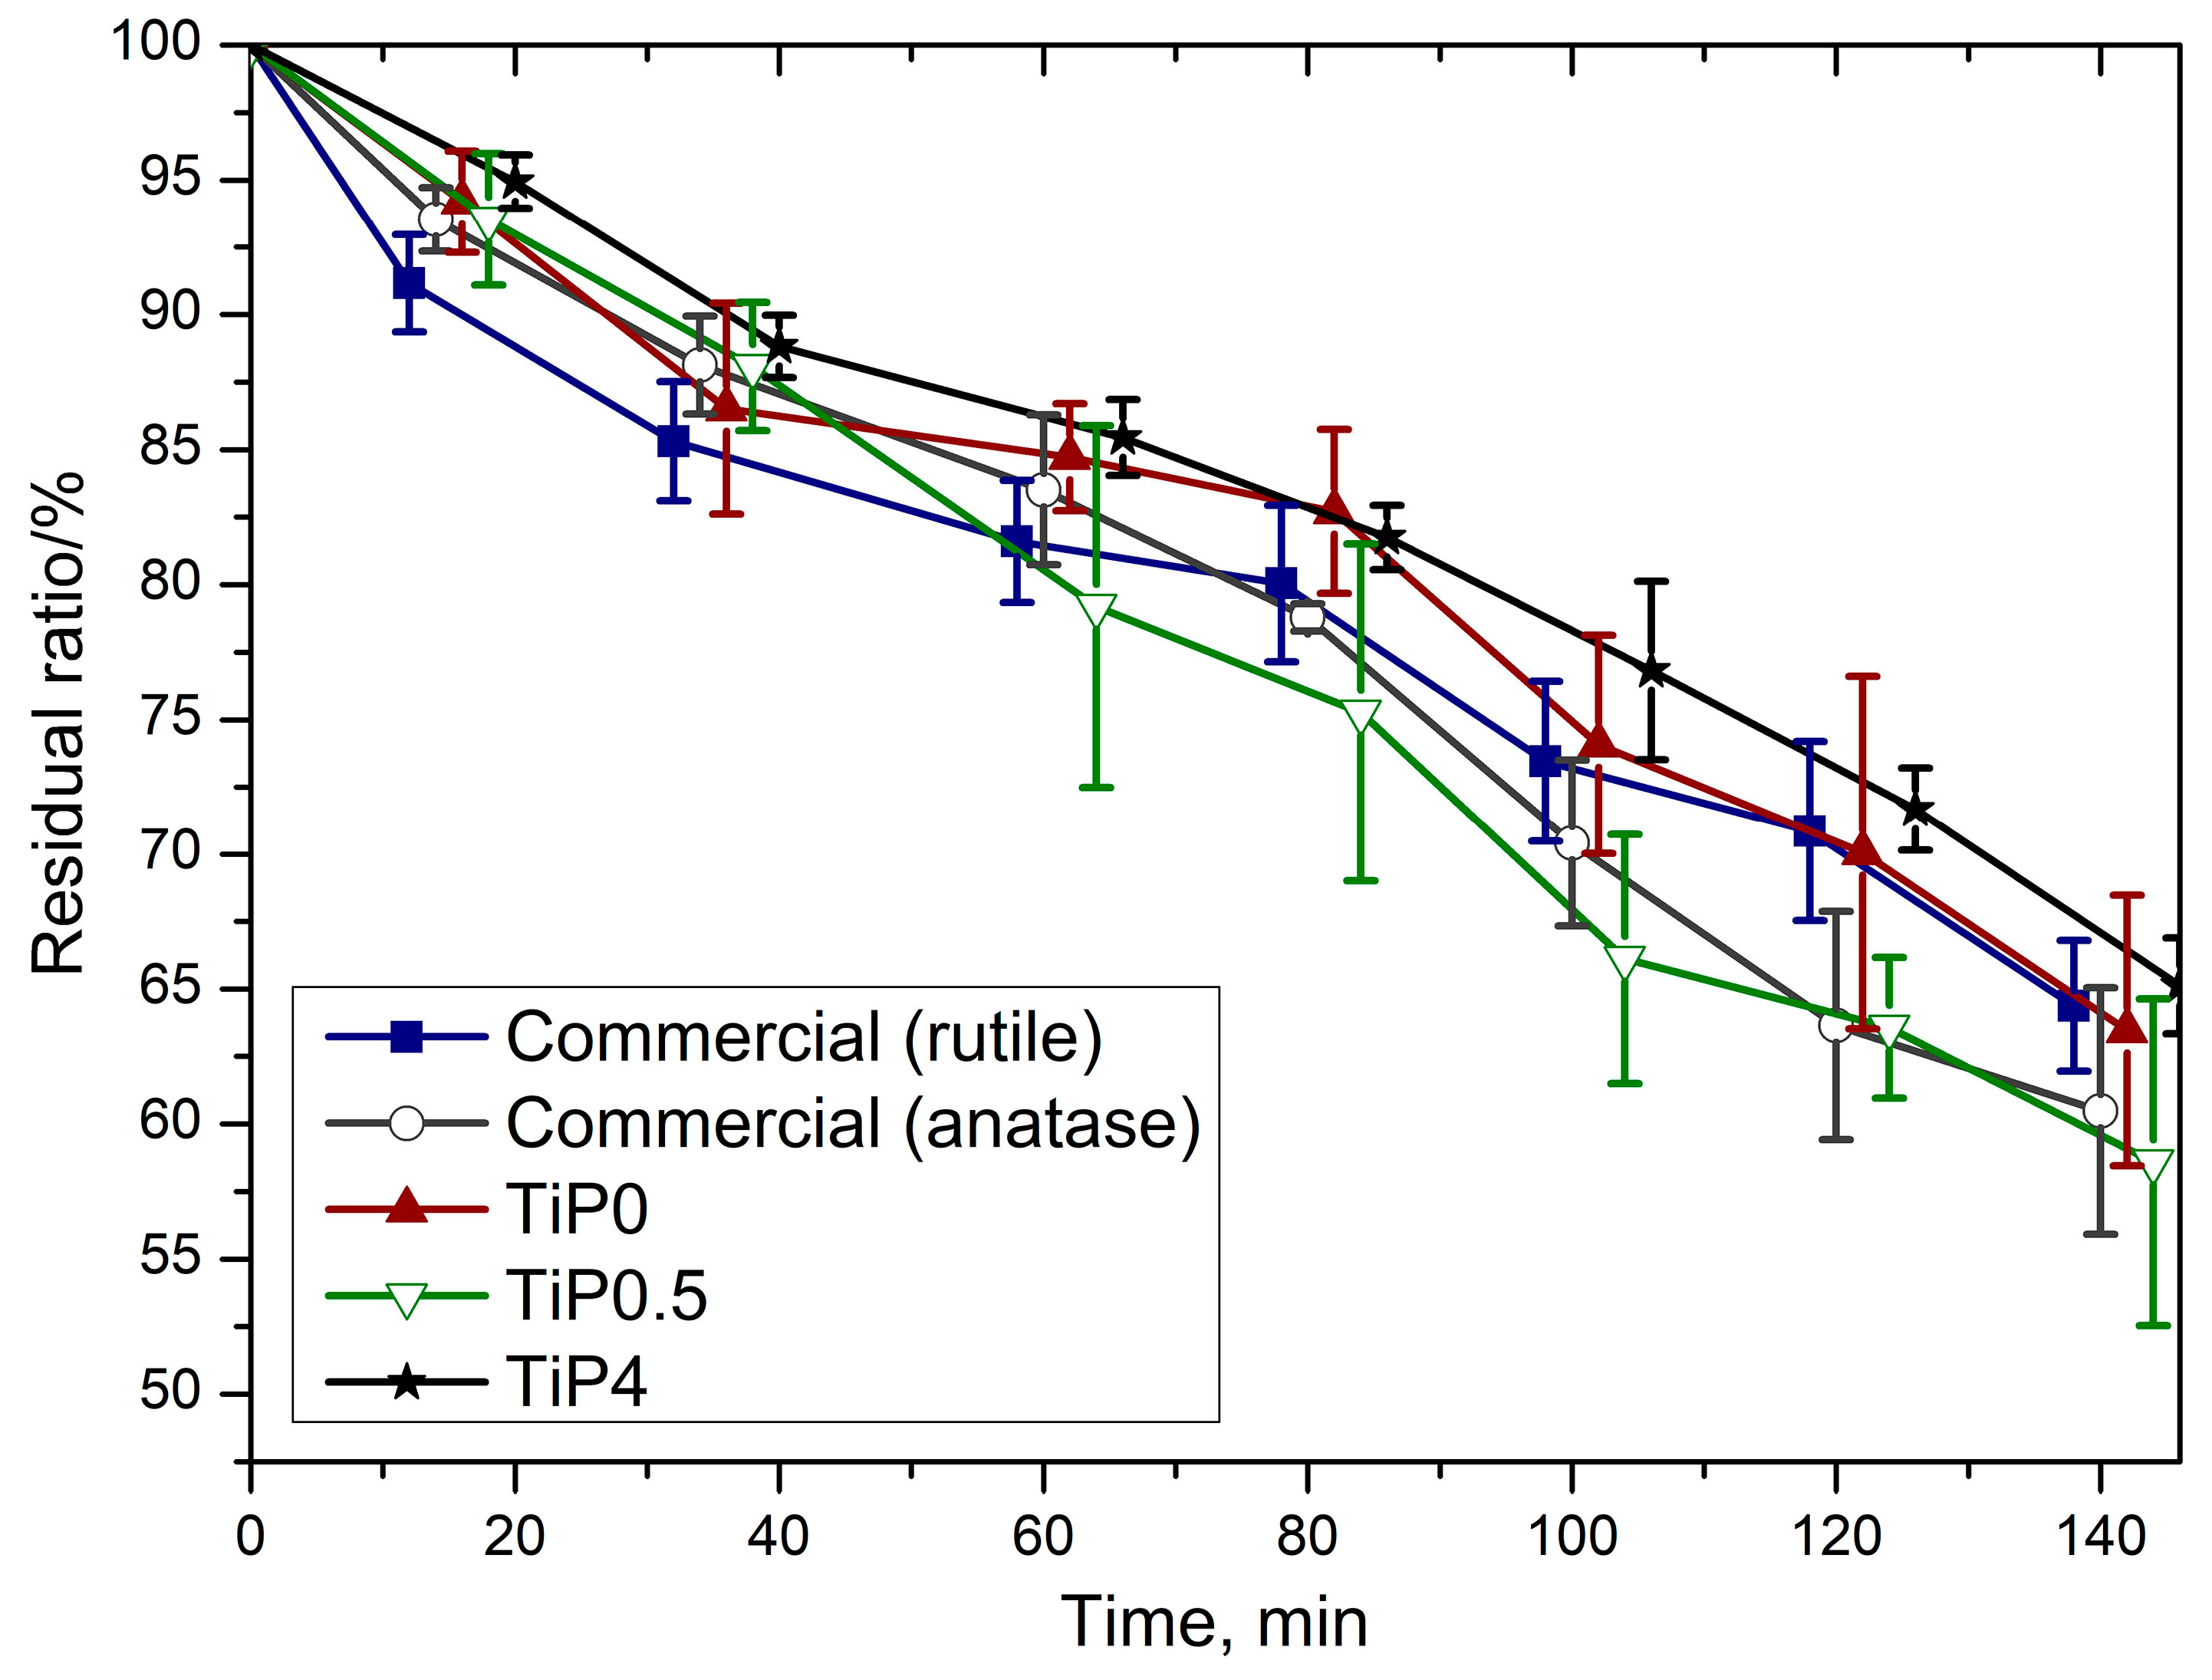
| Sample | Optical Band Gap (eV) | Photocatalytic Activity (% from P25) | SPF | UVAPF |
|---|---|---|---|---|
| TiP0 | 3.25 | 60 | 11 | 5 |
| TiP0.5 | 3.09 | 6 | 1 | 1 |
| TiP4 | 3.37/3.53 a | 40 | 3 | 2 |
| Commercial (rutile) | 2.97 | 68 | 3 | 3 |
| Commercial (anatase) | 3.23 | 121 | 3 | 4 |
© 2019 by the authors. Licensee MDPI, Basel, Switzerland. This article is an open access article distributed under the terms and conditions of the Creative Commons Attribution (CC BY) license (http://creativecommons.org/licenses/by/4.0/).
Share and Cite
Kolesnik, I.V.; Aslandukov, A.N.; Arkhipin, A.S.; Kozlov, D.A. Hydrothermal Synthesis of Layered Titanium Phosphate Ti2O2H(PO4)[(NH4)2PO4]2 and Its Potential Application in Cosmetics. Crystals 2019, 9, 332. https://doi.org/10.3390/cryst9070332
Kolesnik IV, Aslandukov AN, Arkhipin AS, Kozlov DA. Hydrothermal Synthesis of Layered Titanium Phosphate Ti2O2H(PO4)[(NH4)2PO4]2 and Its Potential Application in Cosmetics. Crystals. 2019; 9(7):332. https://doi.org/10.3390/cryst9070332
Chicago/Turabian StyleKolesnik, Irina V., Andrey N. Aslandukov, Anatoly S. Arkhipin, and Daniil A. Kozlov. 2019. "Hydrothermal Synthesis of Layered Titanium Phosphate Ti2O2H(PO4)[(NH4)2PO4]2 and Its Potential Application in Cosmetics" Crystals 9, no. 7: 332. https://doi.org/10.3390/cryst9070332
APA StyleKolesnik, I. V., Aslandukov, A. N., Arkhipin, A. S., & Kozlov, D. A. (2019). Hydrothermal Synthesis of Layered Titanium Phosphate Ti2O2H(PO4)[(NH4)2PO4]2 and Its Potential Application in Cosmetics. Crystals, 9(7), 332. https://doi.org/10.3390/cryst9070332