Article

Study on Luminescence of KCl:Eu2+ Crystals after X-ray Irradiation at Room Temperature

1
Department of Mechanical Engineering, Saitama Institute of Technology, 1690 Fusaiji, Fukaya, Saitama 369-0293, Japan
2
Graduate School of Natural Science and Technology, Kanazawa University, Kakuma-machi, Kanazawa 920-1192, Japan
*
Author to whom correspondence should be addressed.
Crystals 2019, 9(7), 331; https://doi.org/10.3390/cryst9070331
Submission received: 8 May 2019 / Revised: 24 June 2019 / Accepted: 27 June 2019 / Published: 28 June 2019
(This article belongs to the Special Issue Defects in Crystals)

Abstract

:
Bleaching with the F-light at the excitation bandpass of 20 nm results in the phenomenon that F-centre peak and thermoluminescence (TL) glow peaks due to Fz- and F-centres identically decrease with the F-bleach time, whereas TL glow peak due to Fz-centre only remains almost constant irrespective of its time in the case of that at the excitation bandpass of 5 nm. Analysing the data on bleaching effects, absorption spectrum of X-ray irradiated KCl:Eu2+ crystal has a peak due to Fz-centre approximately within 20 nm of the wavelength 560 nm at F-centre peak. Electrons released from Fz-centres at 370 K and from F-centres at 450 K combine with Eu3+ ions, leading to the excited Eu2+ ions from which the luminescence at 420 nm is emitted.

1. Introduction

It is ascertained that when pure KCl and KCl:Eu2+ were subjected to the same X-ray radiation dose, the thermoluminescence (TL) intensity of the KCl:Eu2+ phosphor is at least three orders of magnitude larger than that of pure KCl under the same reading conditions [1]. The europium is known as a fluorescent material and causes strong luminescence. Also, KCl:Eu2+ exhibits an optically stimulated luminescence (OSL) for optical stimulation after X-ray irradiation, of which the intensity is proportional to the X-ray absorbed dose [2]. It has been further reported that the photostimulated luminescence (PSL) intensity increases linearly with X-ray irradiation dose over a wide range of its dose [3]. Electron-hole pairs are generated during X-ray irradiation of KCl:Eu2+ and chlorine vacancies store the electrons producing F-centres (trapped electrons). Under a photostimulation of 560 nm, which corresponds to the absorption wavelength of the F-centres in KCl:Eu2+ [4], the electrons liberated from the F-centres recombine with the trapped holes. The energy released in the PSL process results in characteristic Eu2+ luminescence. The F-centres hereby function as electron trapping sites in the PSL process. KCl:Eu2+ is one of the efficient PSL phosphors with an excellent sensitivity as a two-dimensional X-ray imaging sensor utilising OSL phenomenon [1] and is much more useful than conventional X-ray film in the fields of radiation dosimetry and X-ray diffraction for molecular biology applications [5,6,7]. KCl:Eu2+ exhibits excellent storage performance and is reusable material for radiation therapy dosimetry [8,9].
Thus far, a number of studies on OSL and TL processes have been conducted under X-ray irradiation and have proved that F- and Fz-centres (F-centres perturbed by neighbouring Eu2+ ions), which act as the trapping sites for the electrons, are directly involved their processes. However, to our knowledge, the details seem not to be clear (see, e.g., [10,11]). In this paper, optical absorption (OA) and TL glow are measured at various conditions for KCl:Eu2+ crystals after X-ray irradiation. The behaviour of OA and TL glow peaks is reported here in order to obtain a further insight into this situation.

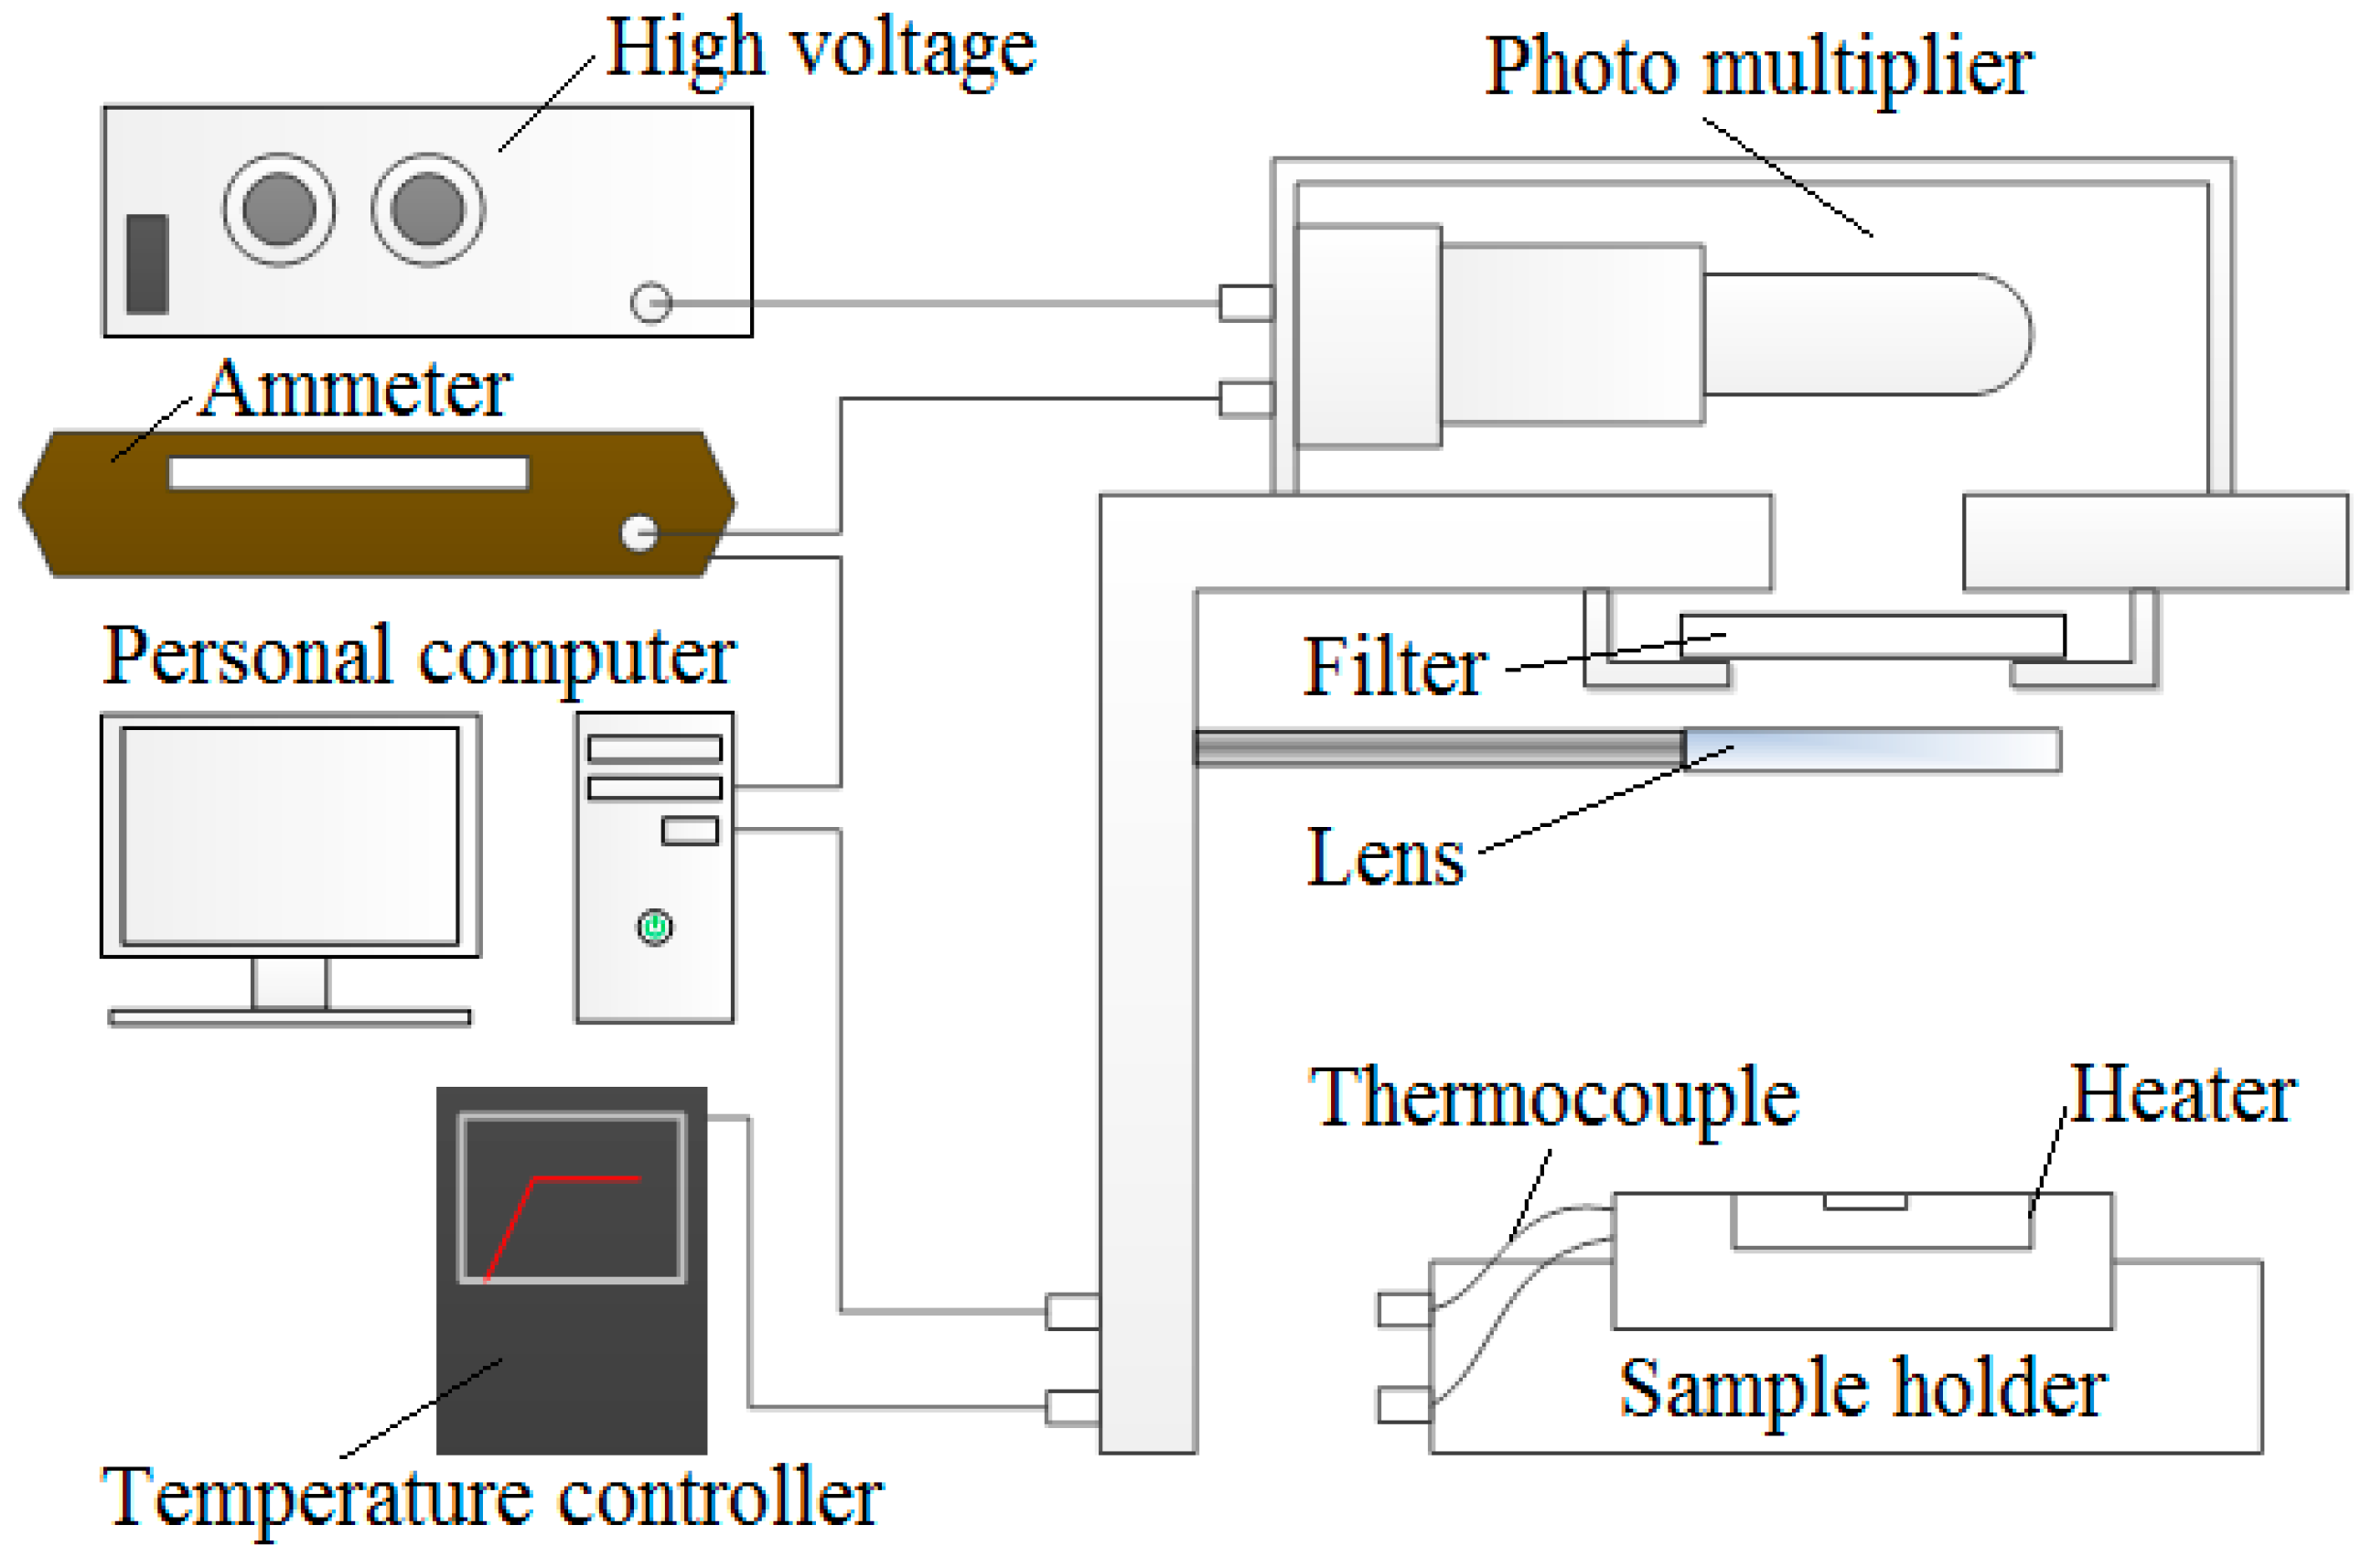
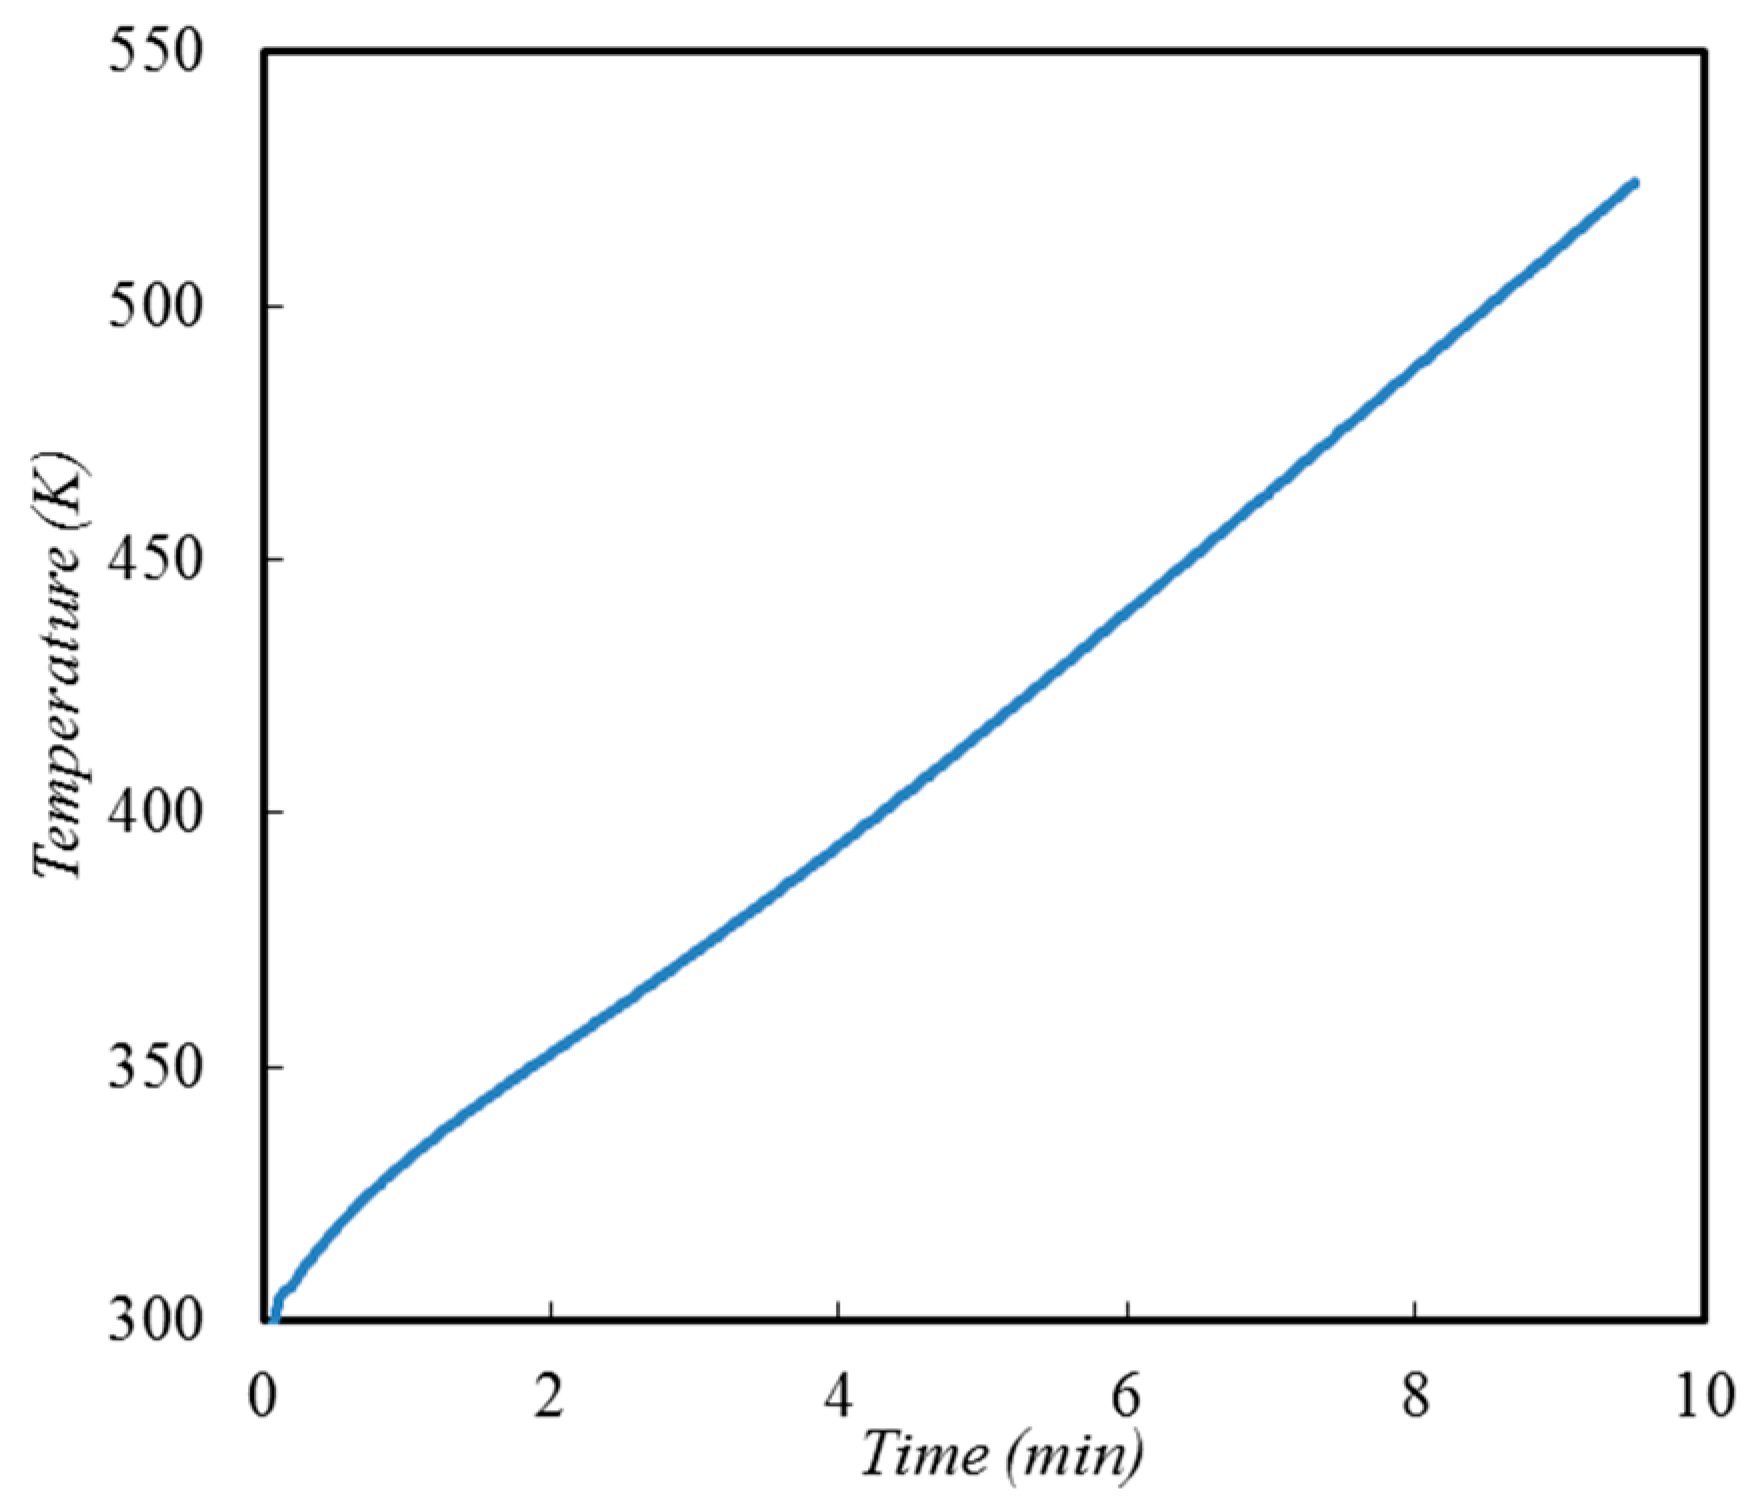
2. Experimental Procedure

KCl single crystal doped with Eu2+ (0.02, 0.04, 0.1 mol% in melt) was grown from the melt of superfine reagent powders by the vertical Bridgeman method. The specimens, which were cleaved to the size of 2 × 3 × 5 mm3 from the ingot, were kept below the melting point for 15 h in order to remove internal strains as far as possible, followed by gradually cooling to room temperature within 20 h. Furthermore, the specimens were held at 623 K for 30 min and then were quenched to room temperature in order to disperse the dopant ions in them. The specimens were exposed to X-ray on the wide surfaces at room temperature. The irradiation was carried out with X-rays from W-target operated at 40 kV and 30 mA by Shimadzu XD-610 (Shimadzu Corp., Kyoto, Japan). The absorbed dose rate of KCl:Eu2+ at the specimen position was about 5.22 Gy min−1. The absorption spectra of KCl:Eu2+ irradiated by the X-ray up to the time of 120 min were measured with a Hitachi U-3500 spectrophotometer.
Figure 1 shows a schematic diagram of the TL observing system at various temperatures. Thermal-bleach was conducted by heating at the rate of 24 K min−1 up to 525 K after the irradiation. The linear increase of the temperature of the specimen (X-ray irradiated KCl:Eu2+) is shown in Figure 2 and the data registration was controlled by a Chino JP1131-R00 temperature controller (Chino Corp., Tokyo, Japan). The filter in the figure was used to exclude the infrared rays from the heater. Luminescence was observed using a photomultiplier (Hamamatsu R928) with a sensitive region from 185 to 900 nm. Luminescence intensity was recorded on a computer and then the data were processed. Furthermore, the absorption spectra and the TL intensity of X-ray irradiated KCl:Eu2+ were also measured after thermal-bleach or F-bleach (excitation bandpass: 5 and 20 nm) by using a Hitachi U-3010 fluorescence spectrometer in order to clarify the nature of the electron traps after the irradiation. The F-light source was a xenon lamp of which the emission spectra are shown in Figure 3. All experiments were carried out at 300 to 525 K and the irradiation and measurements were performed in the dark to avoid the unwanted effect of environmental light.

3. Results and Discussion

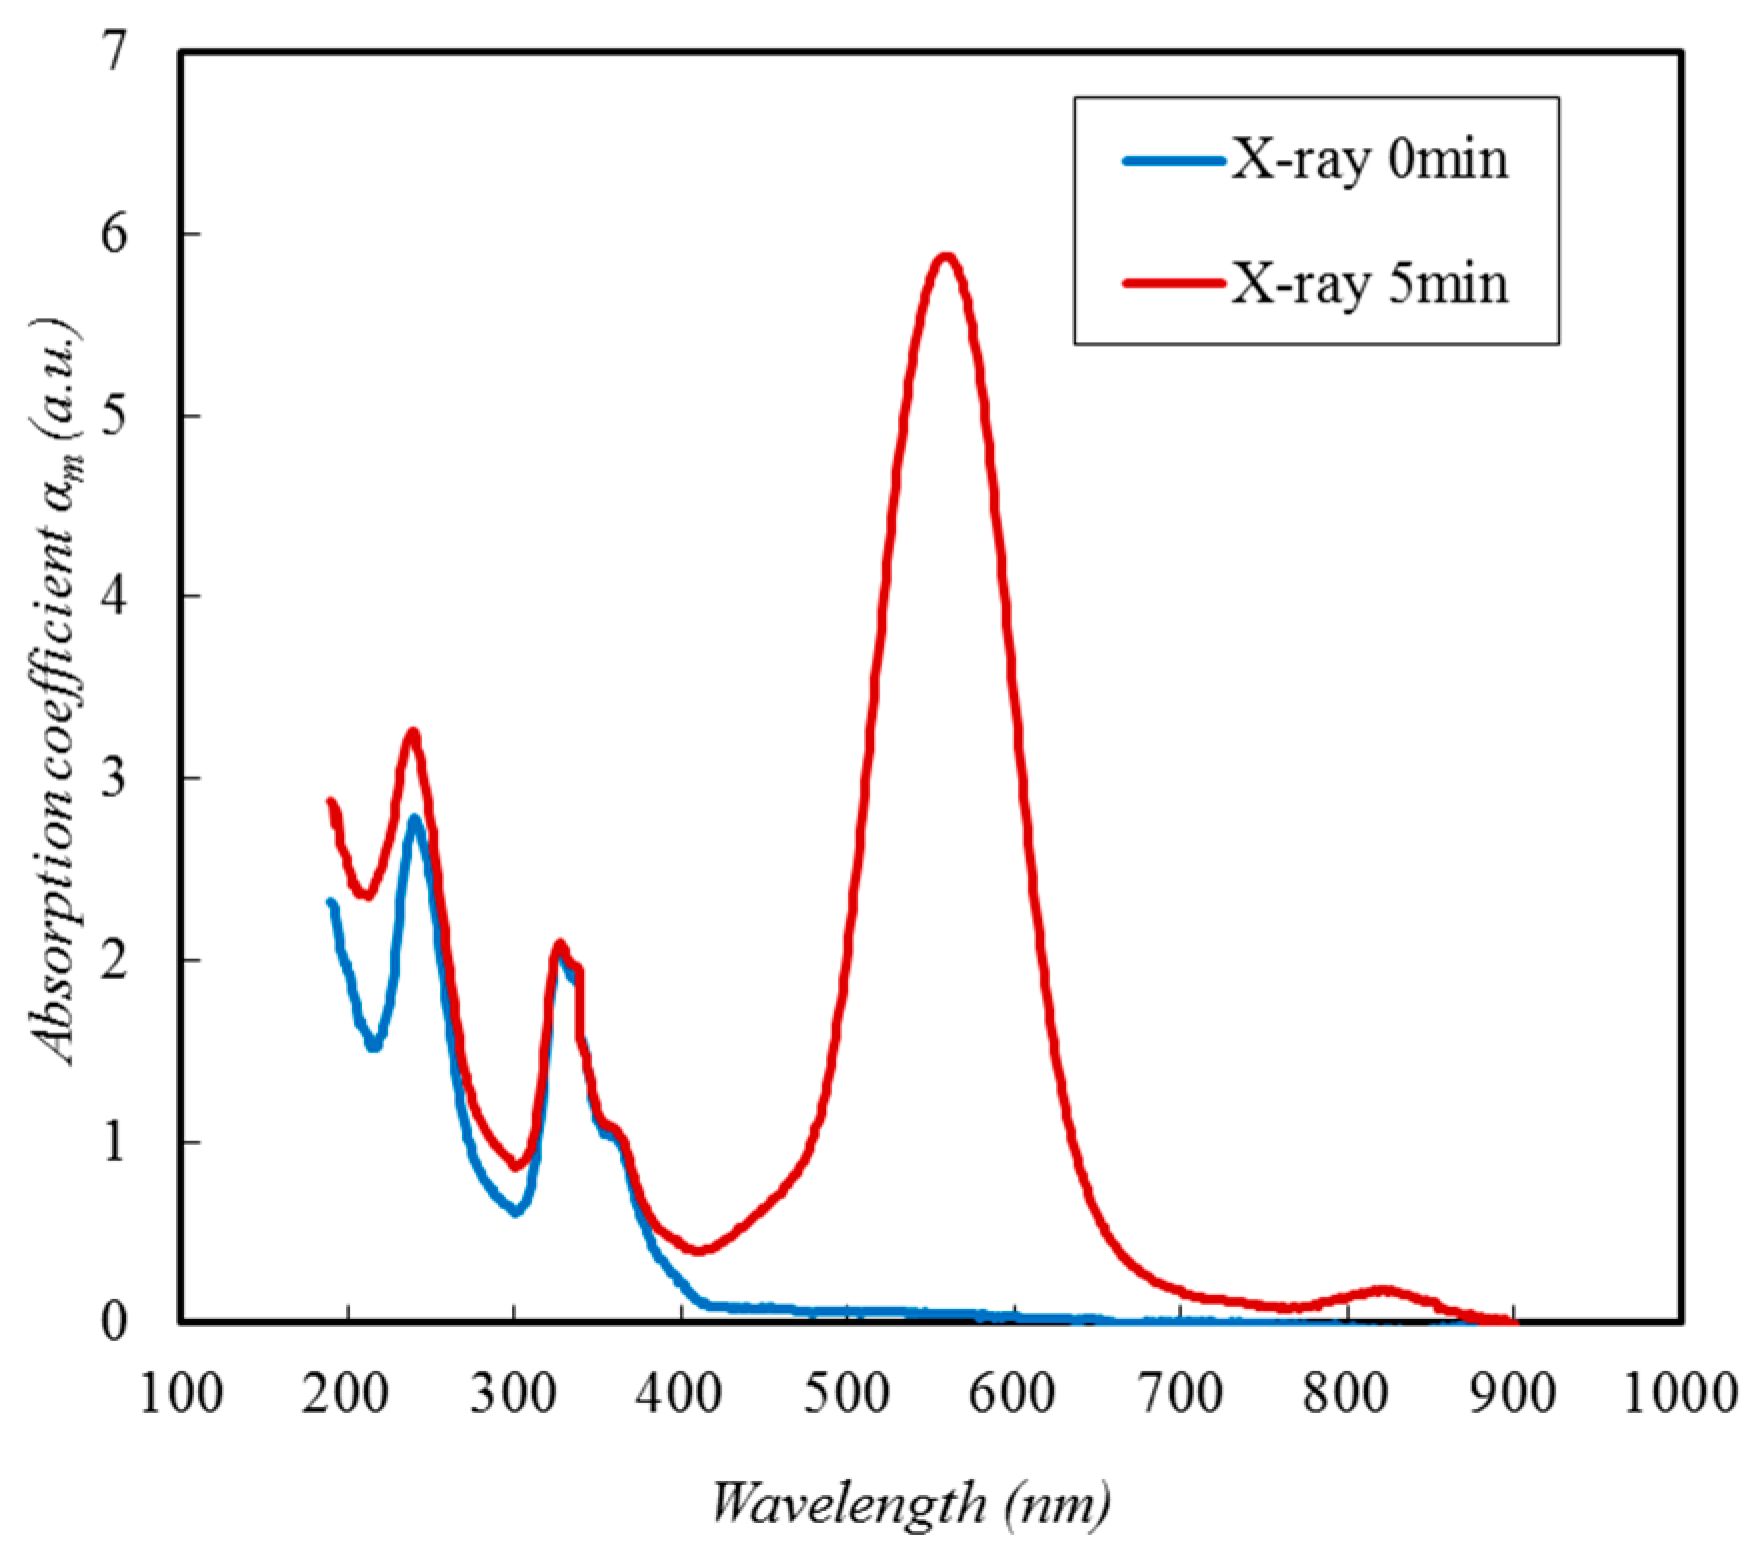
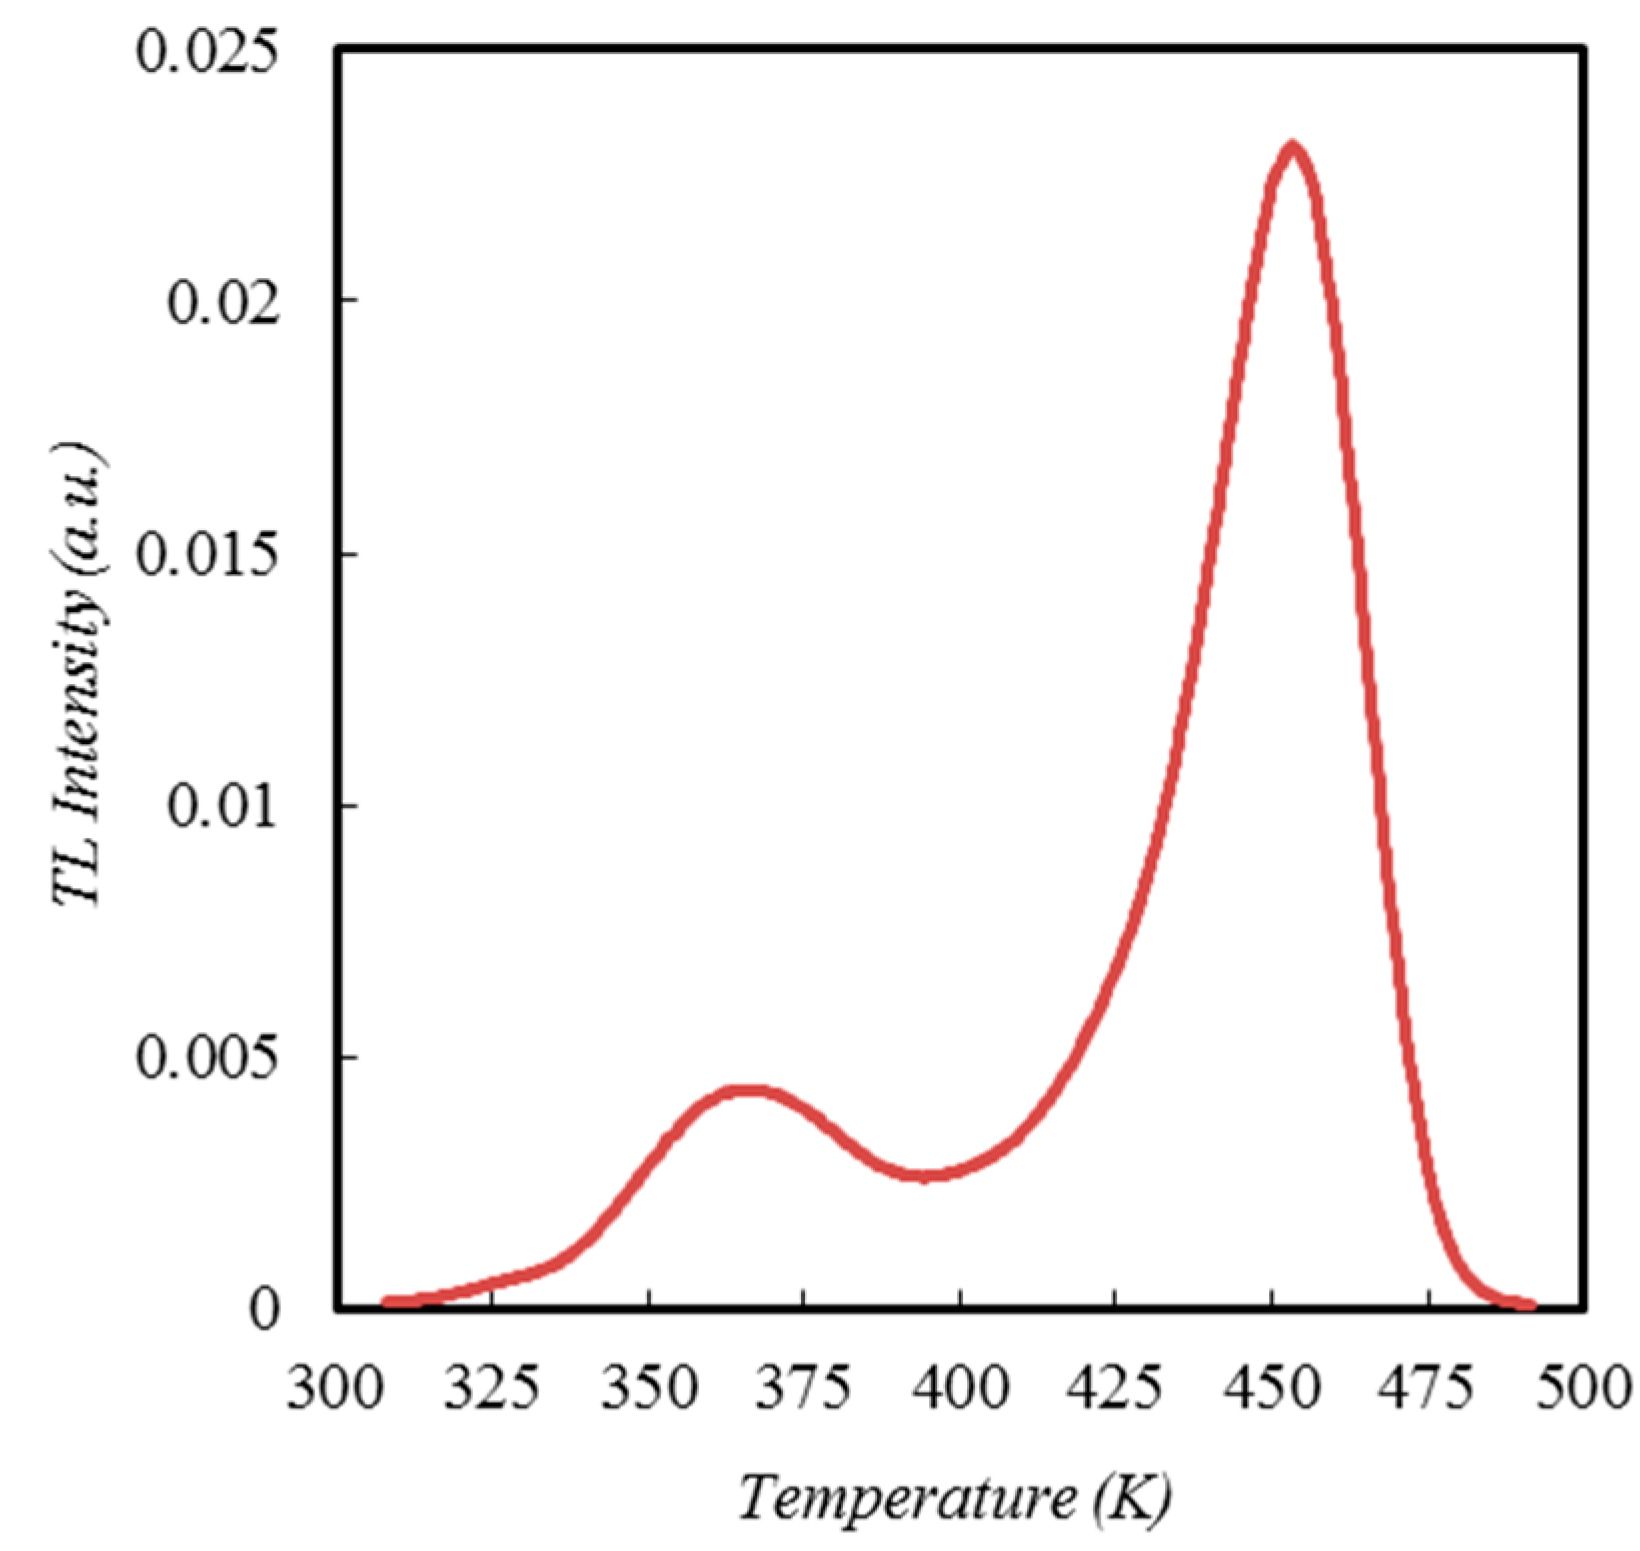
3.1. Absorption Spectrum and TL Glow

Figure 4 shows the typical absorption spectra of the X-ray irradiated (red solid line) or non-irradiated (blue solid one) KCl:Eu2+ (0.02 mol%) crystals. The unit of absorption coefficient (i.e. the vertical scale of the figure) is represented by a.u. (arbitrary unit), because the X-ray irradiation cannot make the uniform distribution of defects in the crystal. The irradiation time was 5 min. With respect to the X-ray irradiated crystal, it consists of four broad bands. The absorption peaks at the wavelength of 243 and 343 nm are due to Eu2+ and the peak at 560 nm is due to F-centre [4,12]. A small absorption peak at 825 nm is ascribed to the M-centre, which is a complex centre comprising two neighbouring Cl vacancies and a trapped electron [4]. The absorption peaks at about 560 and 825 nm are observed in the X-ray irradiated KCl:Eu2+ and are not in the non-irradiated one, as shown in Figure 4. The peak heights due to Eu2+ decrease taking account of base absorption line after the X-ray irradiation. Figure 5 shows TL glow curve of X-ray irradiated KCl:Eu2+ (0.02 mol%), which was obtained from the linear heating as shown in Figure 2. The TL glow peak at the temperature of 370 K is related to Fz-centre (F-centre perturbed by neighbouring a Eu2+ ion-cation vacancy dipole), while that at 450 K seems to be due to F-centre [13,14]. The former and the later peaks are here termed LTP (the low temperature peak) and HTP (the high temperature peak), respectively.

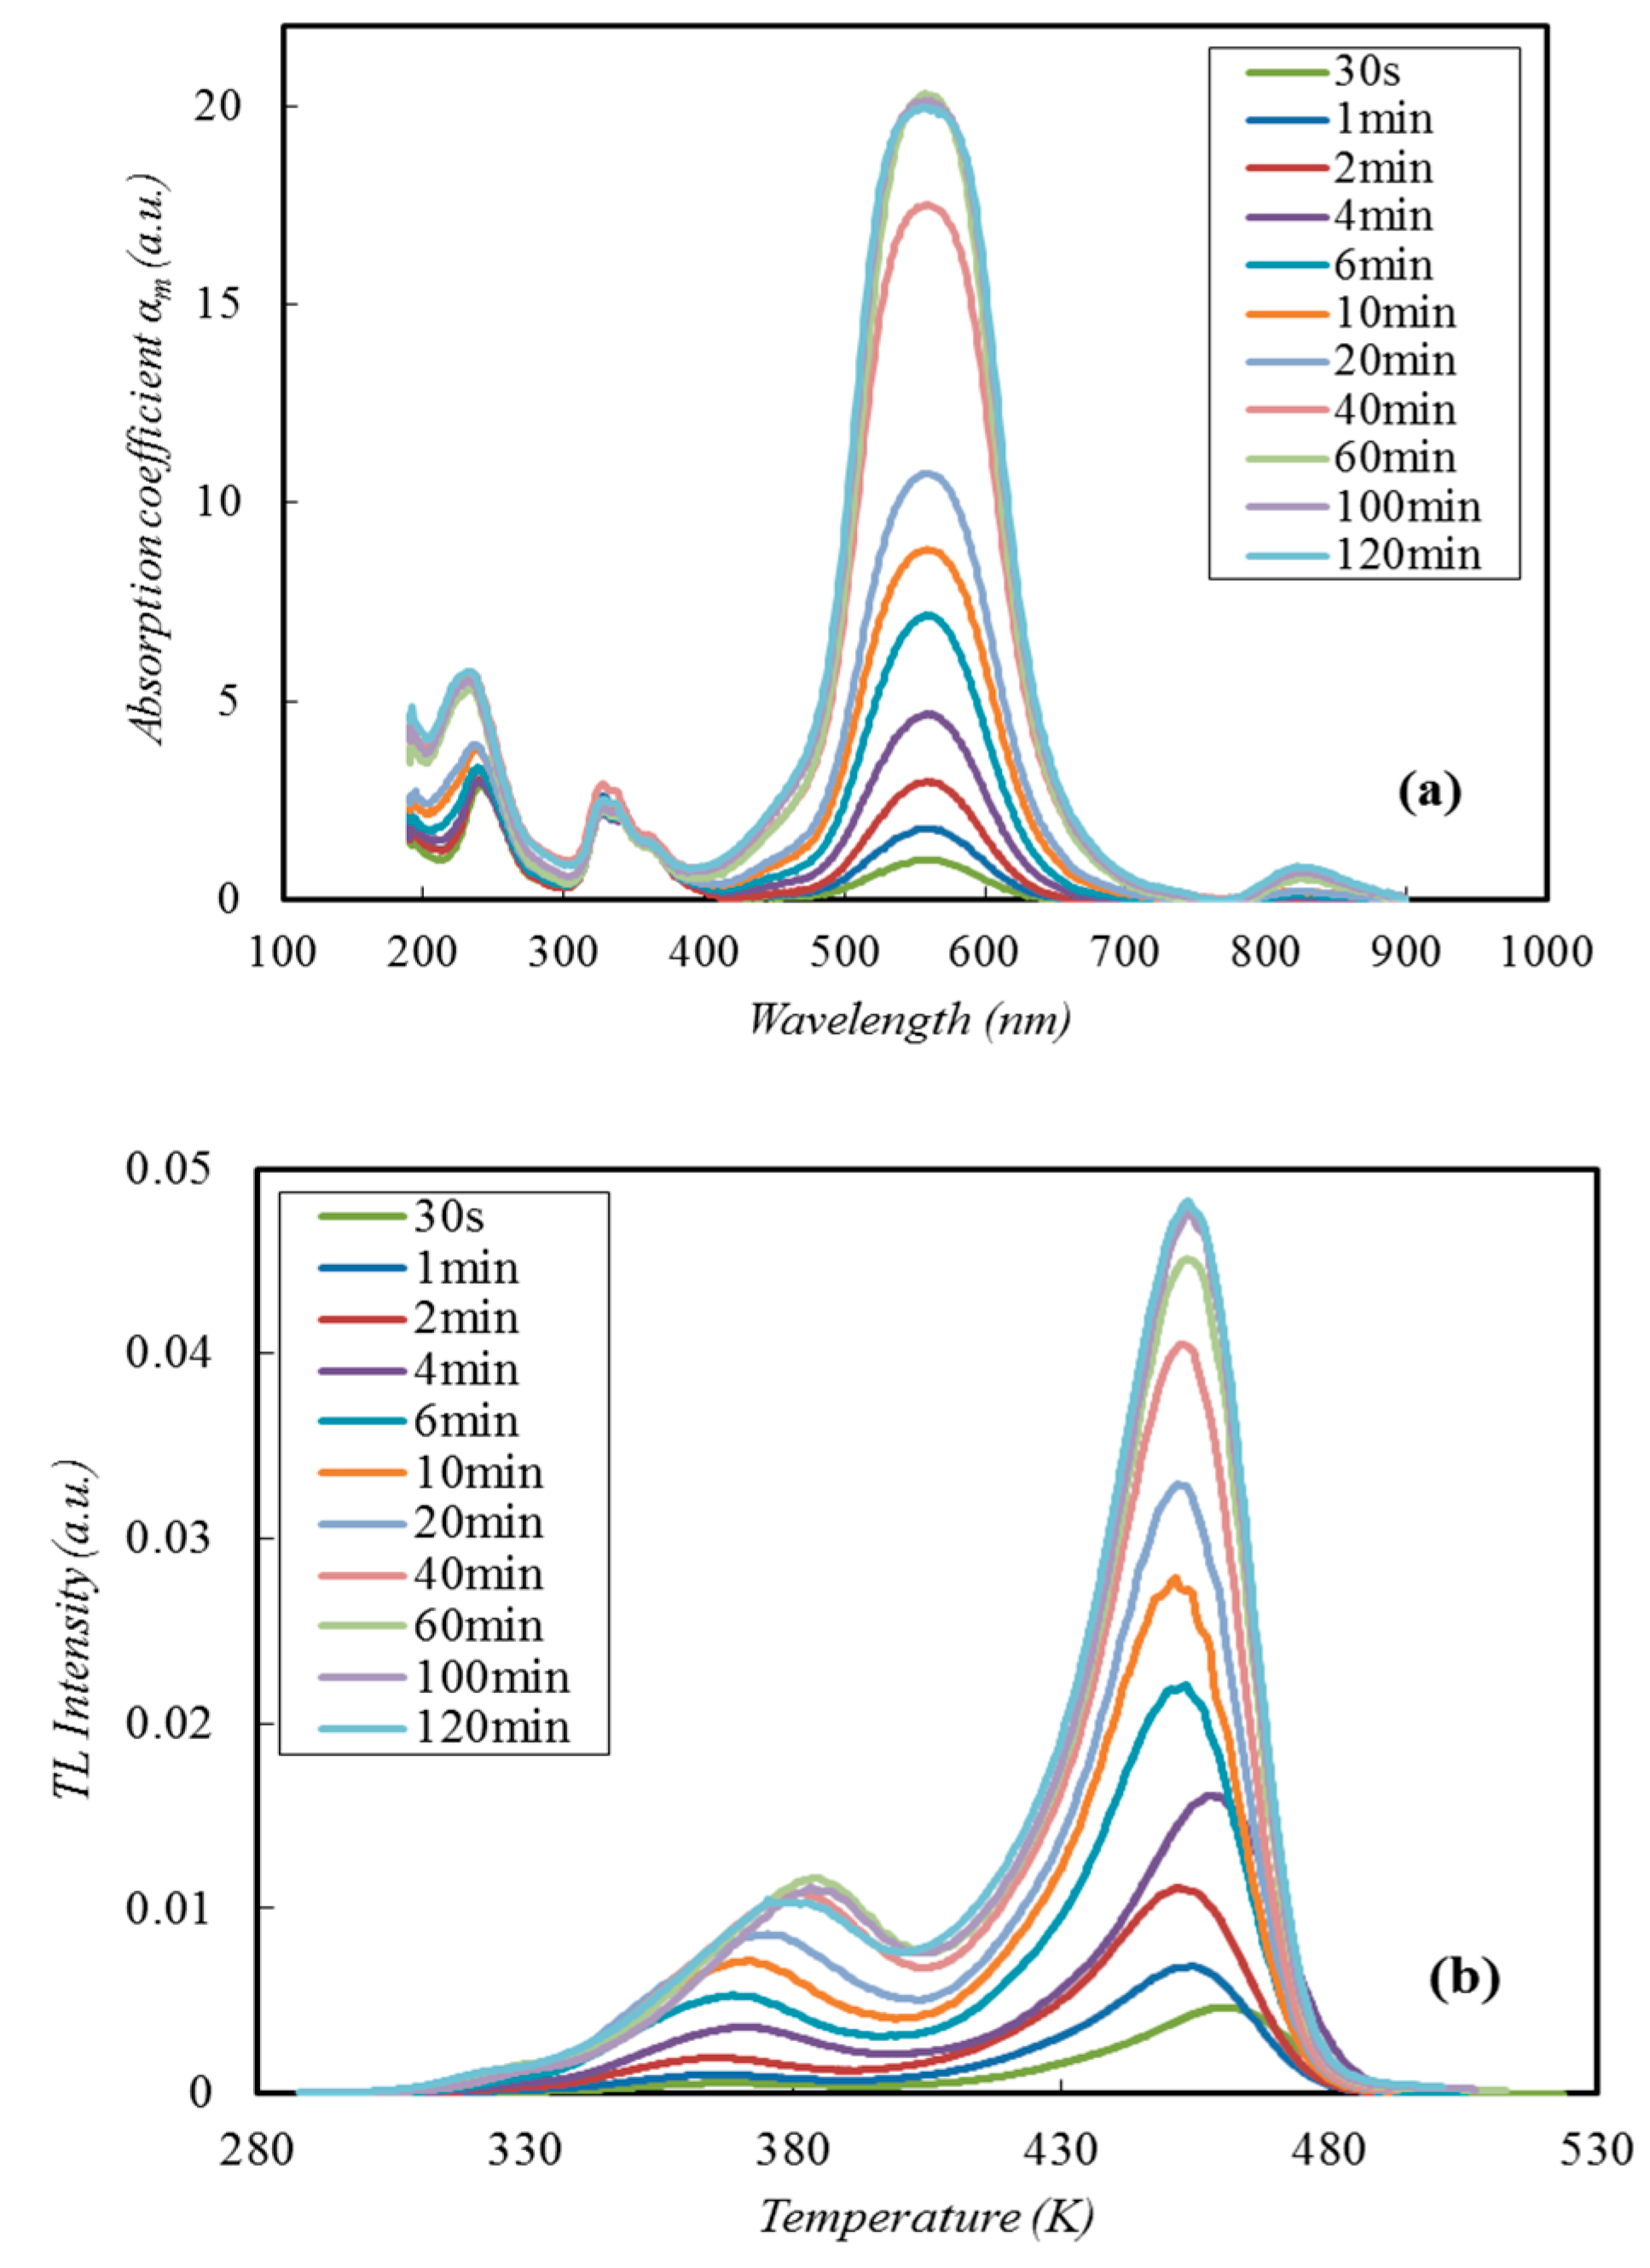
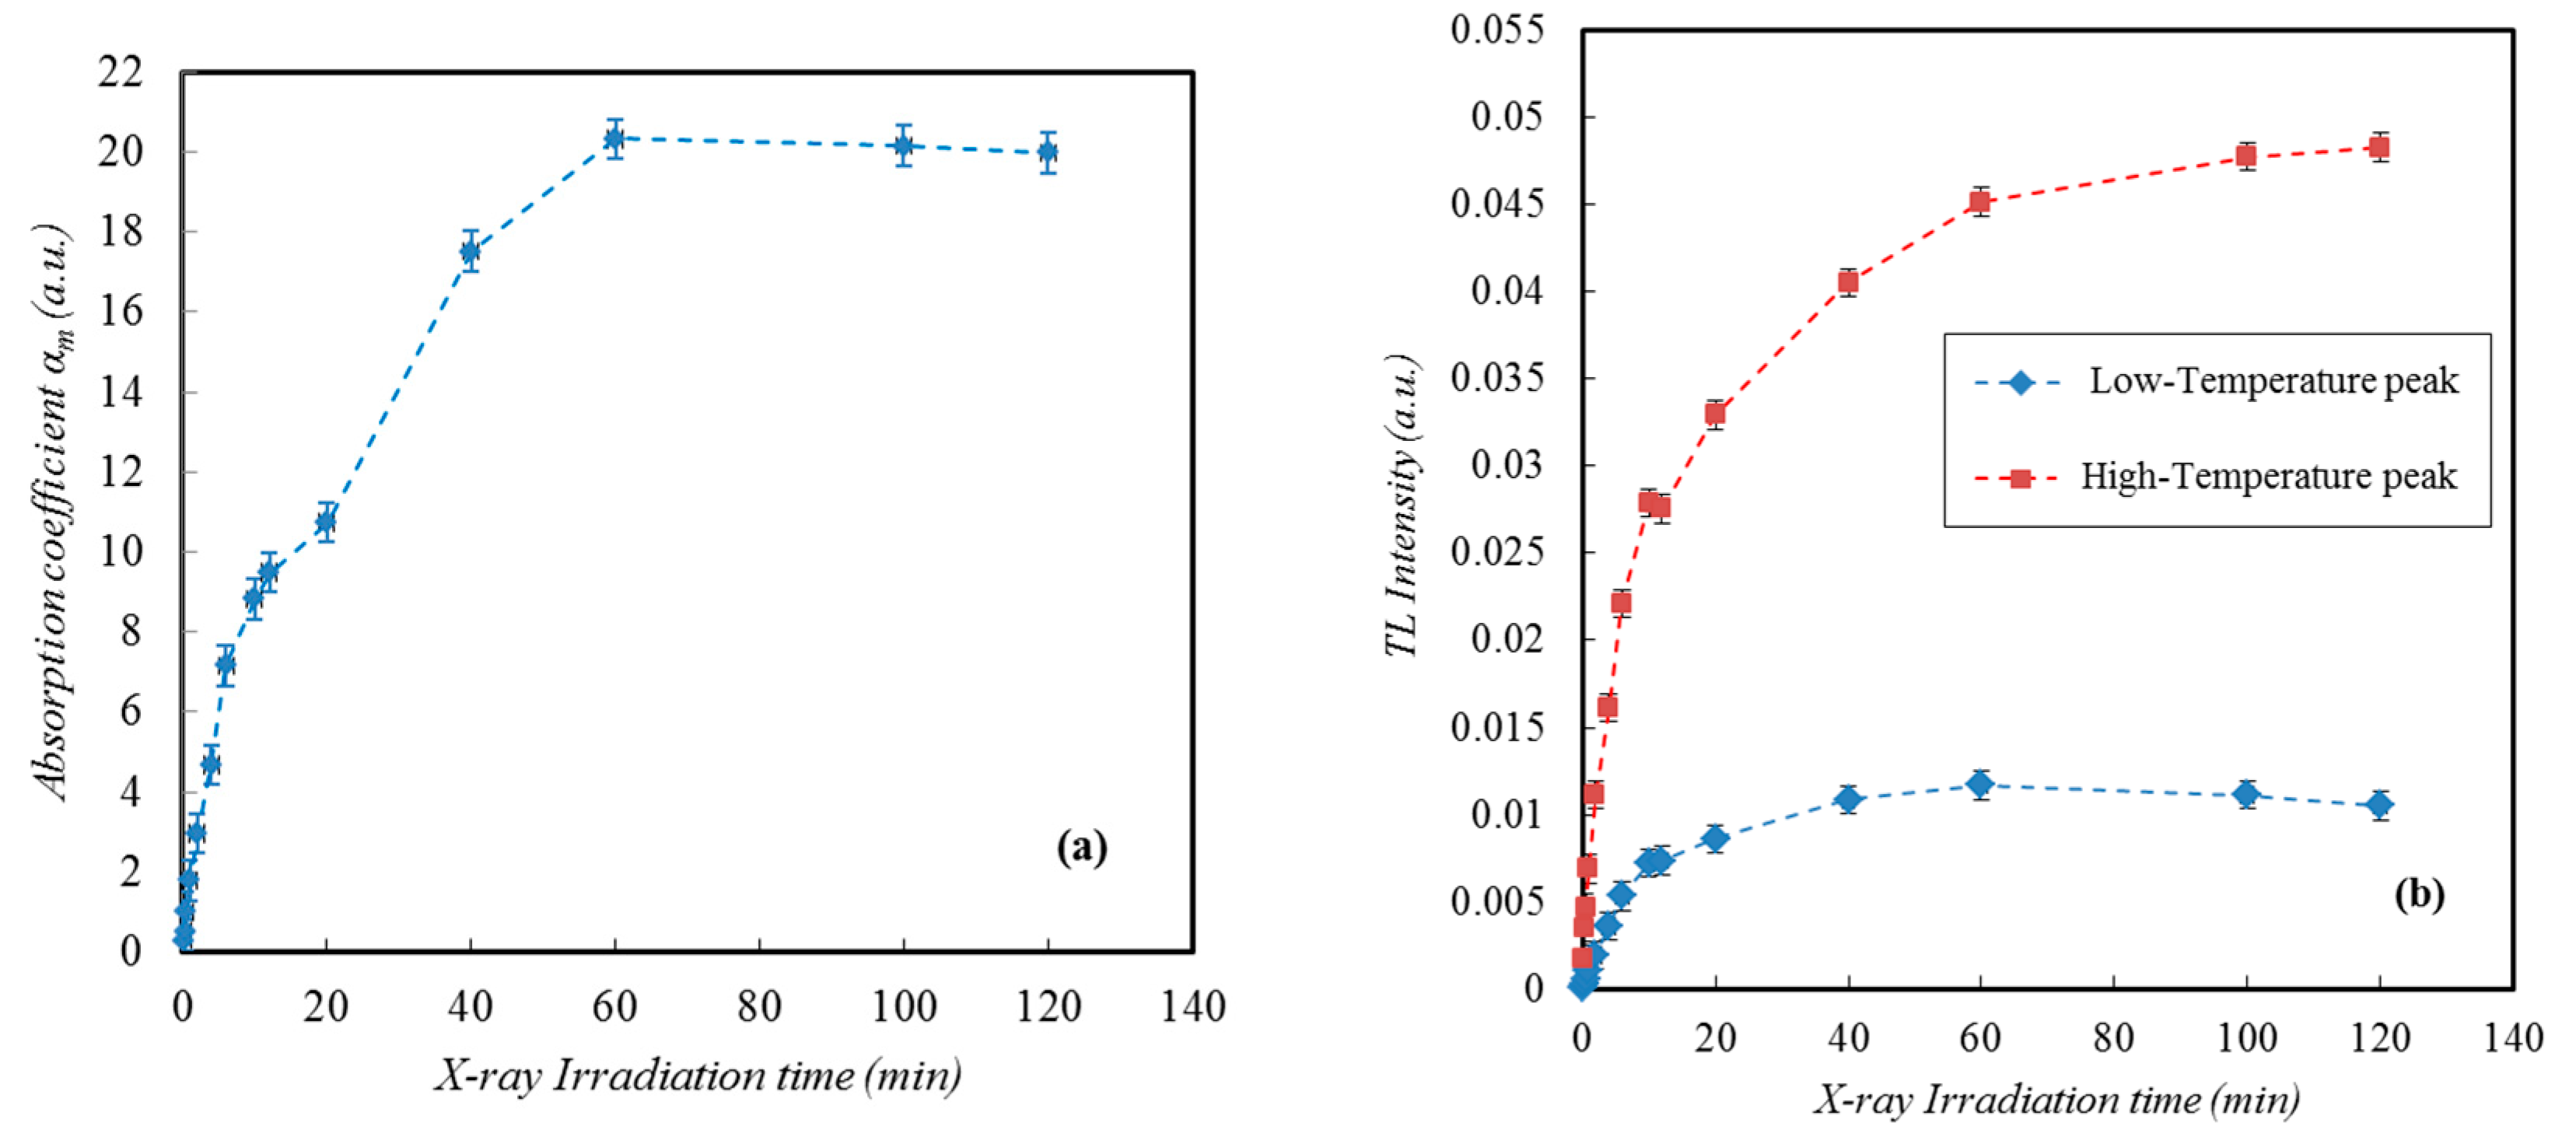
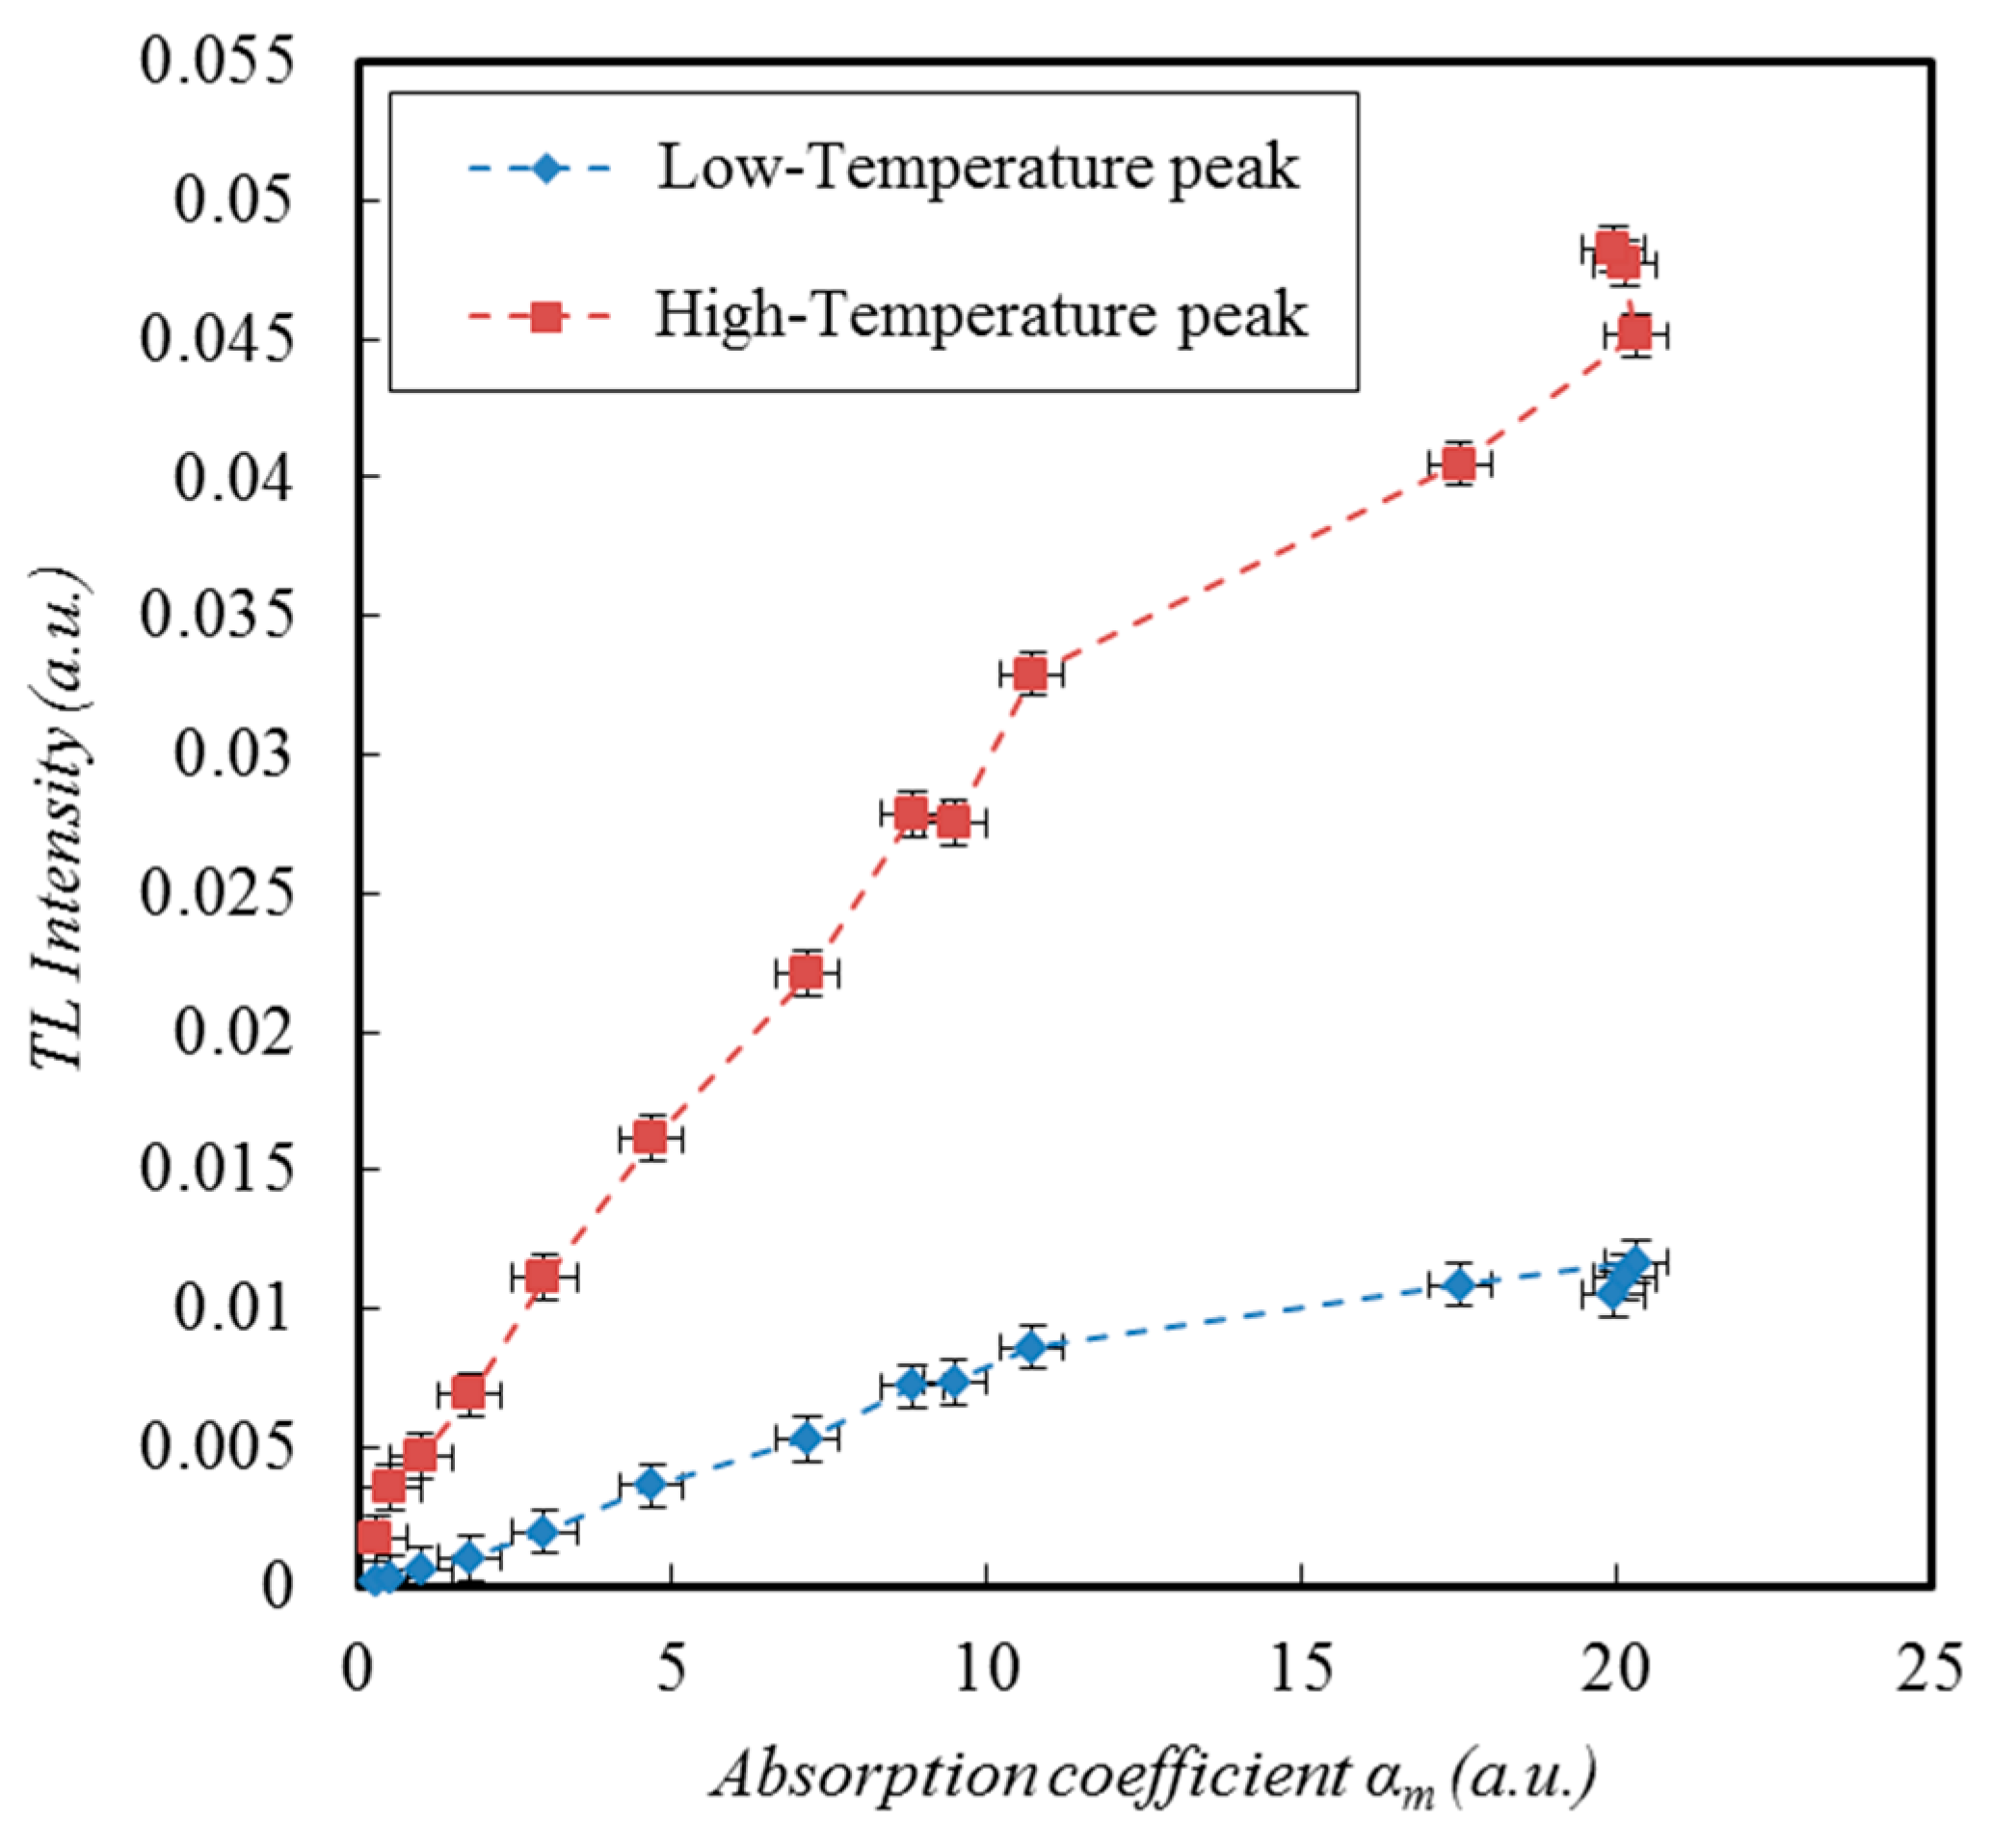
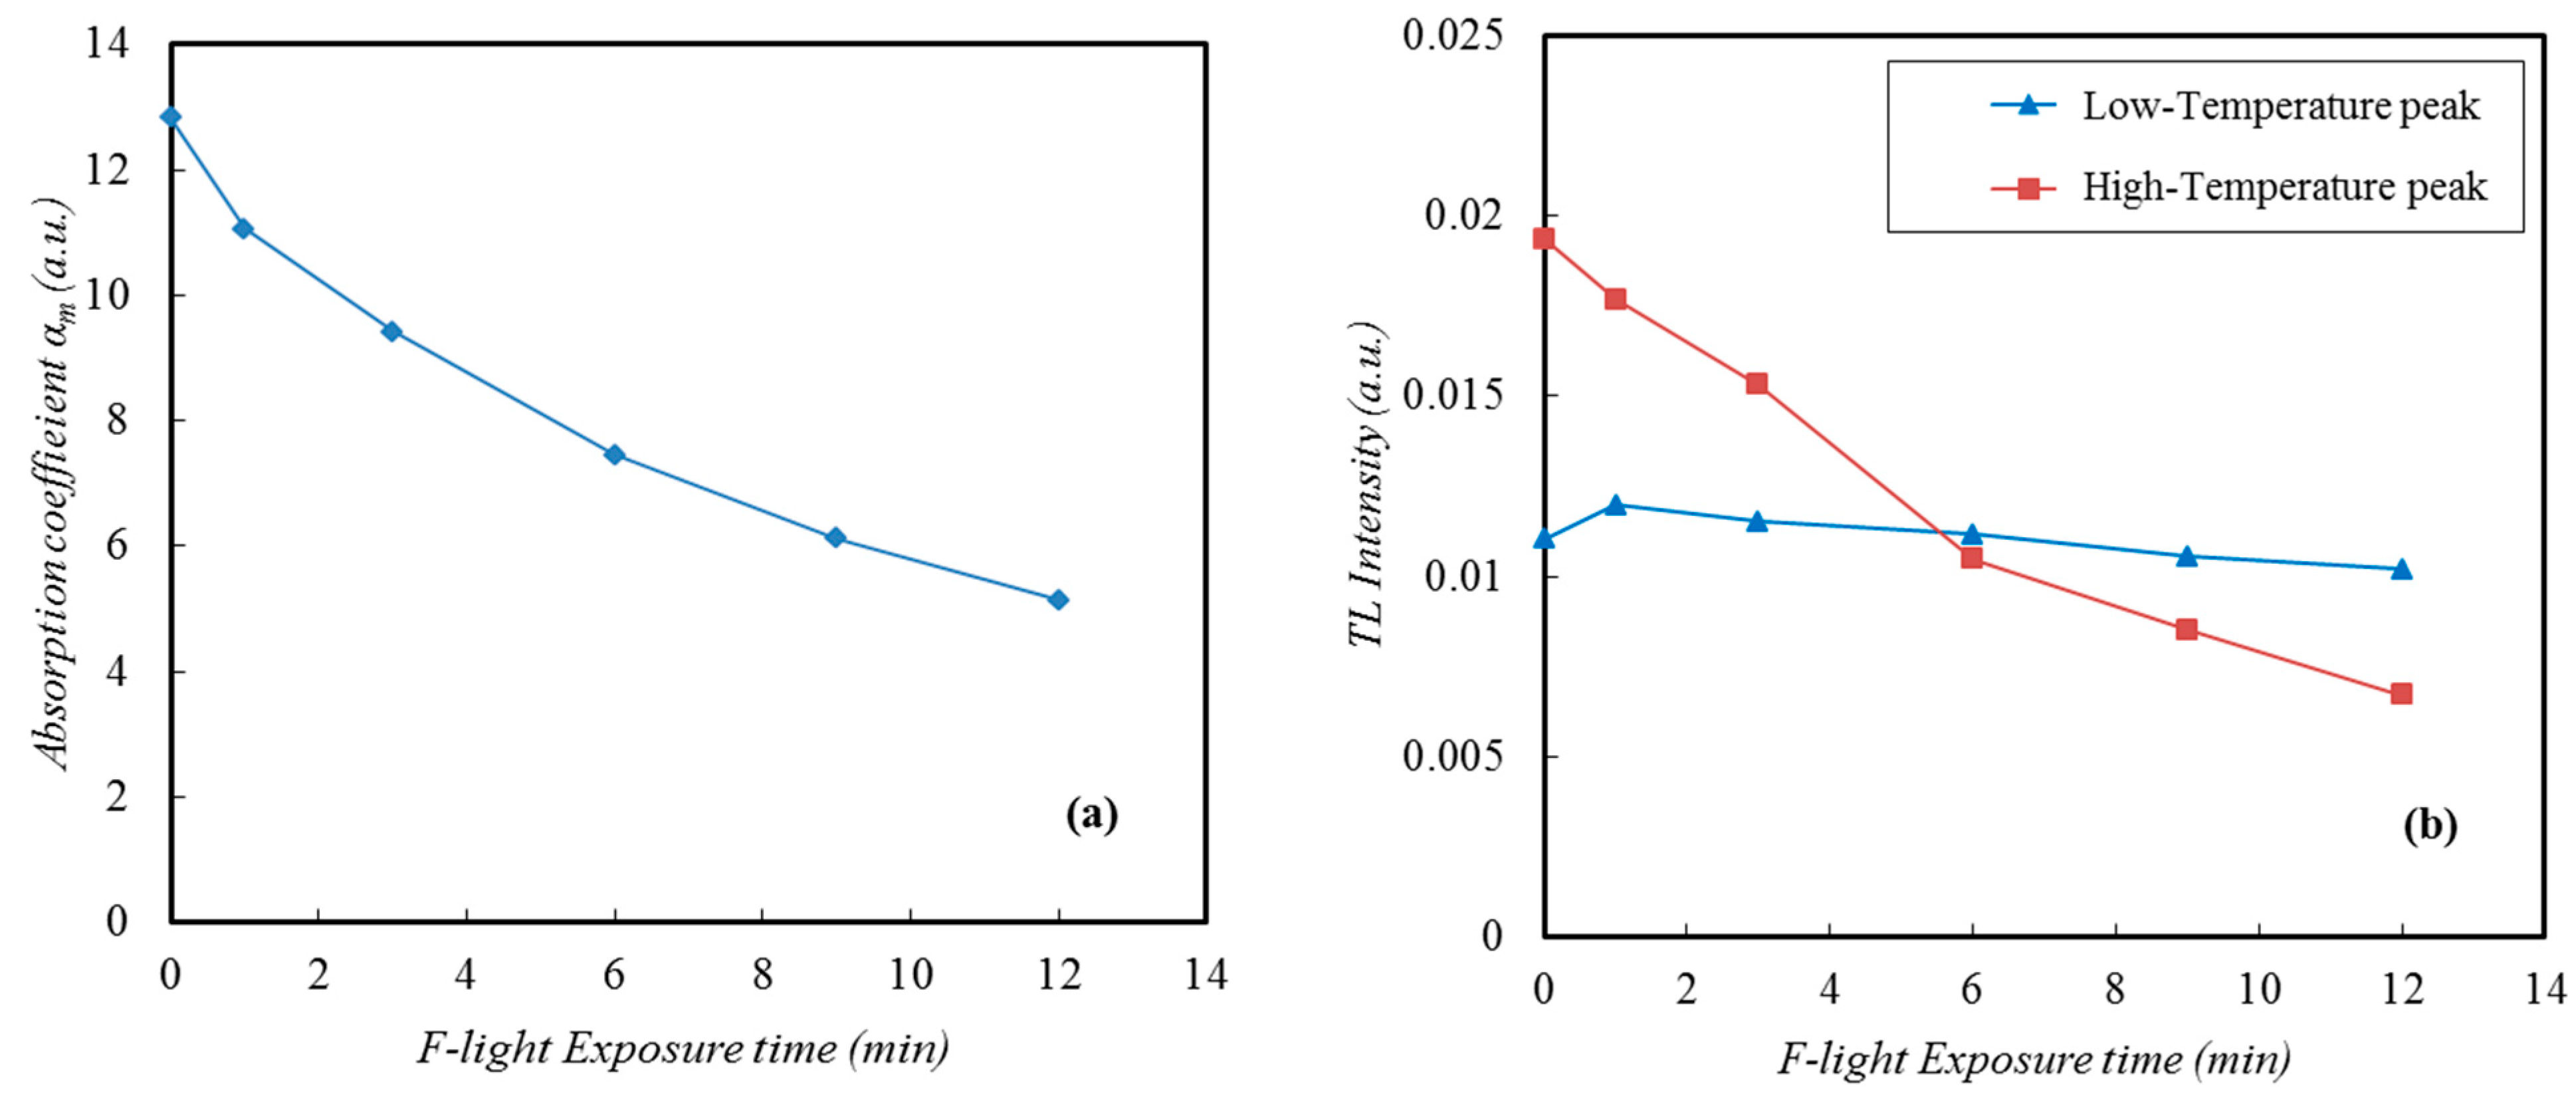
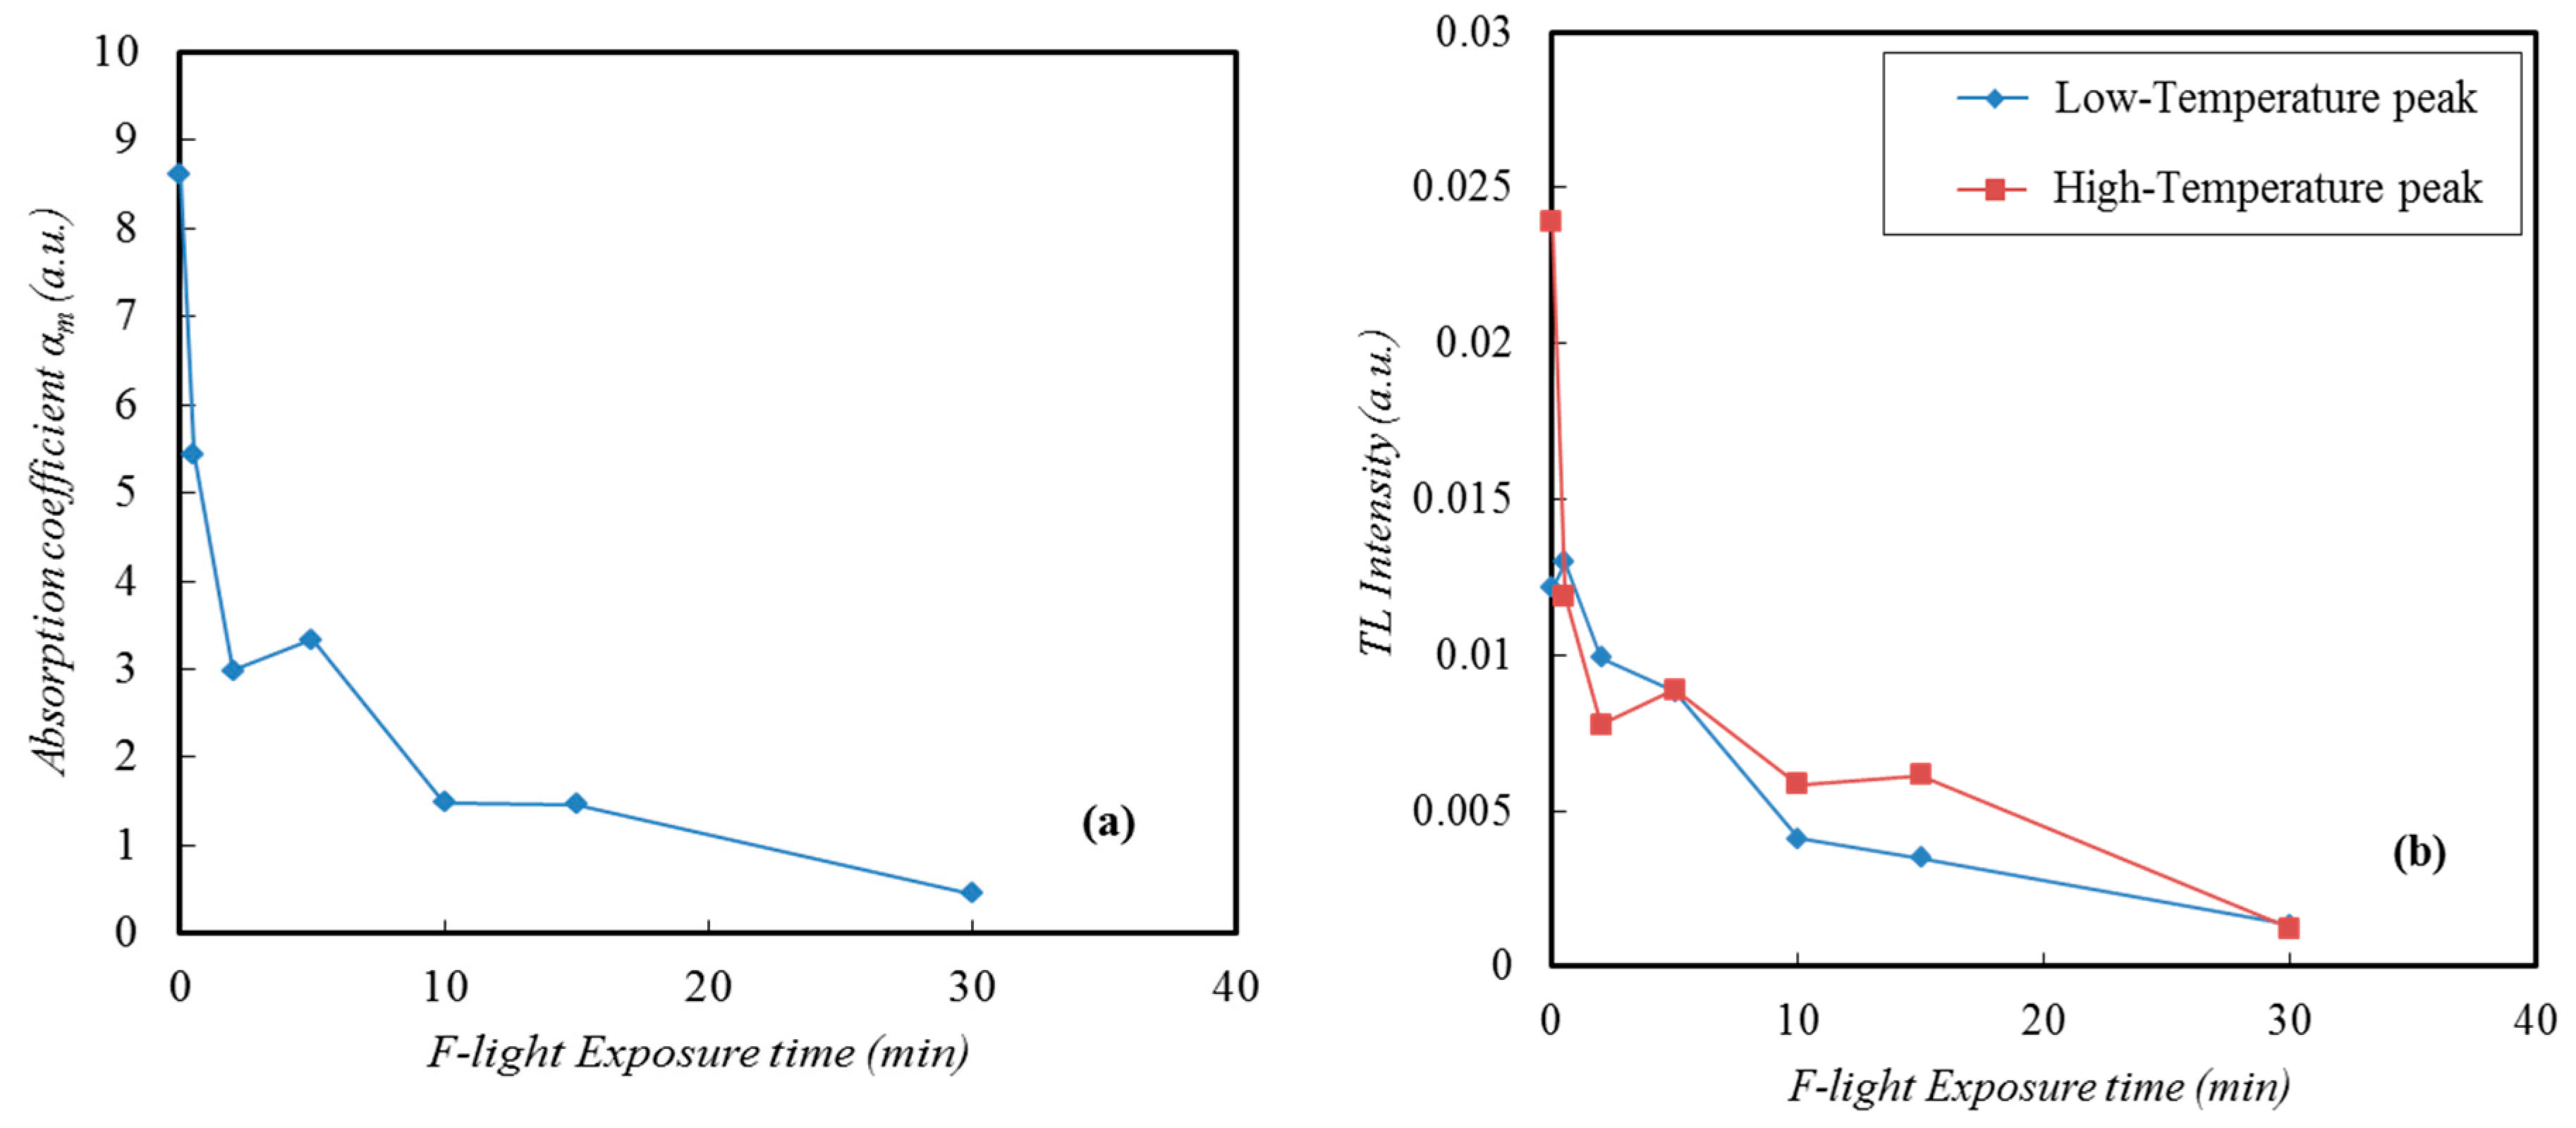
3.2. Dependence of Absorption Spectrum and TL Glow on Irradiation Time

The absorption spectra and TL glow curves are shown in Figure 6a,b respectively for X-ray irradiated KCl:Eu2+ (0.04 mol%) at various irradiation times. When the irradiation time becomes longer, the height of the peak due to F-centre increases and that due to Eu2+ seems to be unclear taking account of the base line, as shown in Figure 6a. This means higher concentration of F-centre in the crystal with X-ray irradiation dose. Although the production of F-centre leads to the decrease of the concentration of the Eu2+ ion, the great difference between the two (i.e. F-centre and Eu2+ ion) concentrations in the crystals may result in the observations that 343 nm band due to the Eu2+ ion seems mostly unchanged in Figure 6a. As an instance, the F-centre concentration is 2.57 ppm using Smakura’s formula and that of Eu2+ is 105.6 ppm according to Hernandez et al. [15] for 40 min irradiation. Meanwhile, the absorption peak at about 825 nm is insensitive to the increment of irradiation dose. The heights of two peaks due to the Fz- and F- centres, namely LTP and HTP, increase with the irradiation time in Figure 6b. LTP shifts to slightly higher temperature with its time. This may suggest that the excitonic electrons are trapped into deeper states when the irradiation dose increases. With regard to HTP, the peak lies a little toward high temperature side below 6 min of the time.
Figure 7a,b shows the variations of absorption coefficient at about 560 nm wavelength in Figure 6a and of each peak (LTP and HTP) in Figure 6b with the X-ray irradiation time. The absorption coefficient at about 560 nm is termed AC560 in this paper. These three peaks increase and subsequently increase further slowly with increasing the irradiation time below 60 min and then tend to a saturation value. The values of AC560, LTP and HTP, which are read at the same irradiation time in Figure 7, are plotted in Figure 8. Both LTP (blue dotted line) and HTP (red dotted one) monotonically become large depending on AC560, as can be seen from the figure. This may suggest that AC560 is not only due to LTP (i.e. Fz-centre) but also HTP (i.e. F- centre).

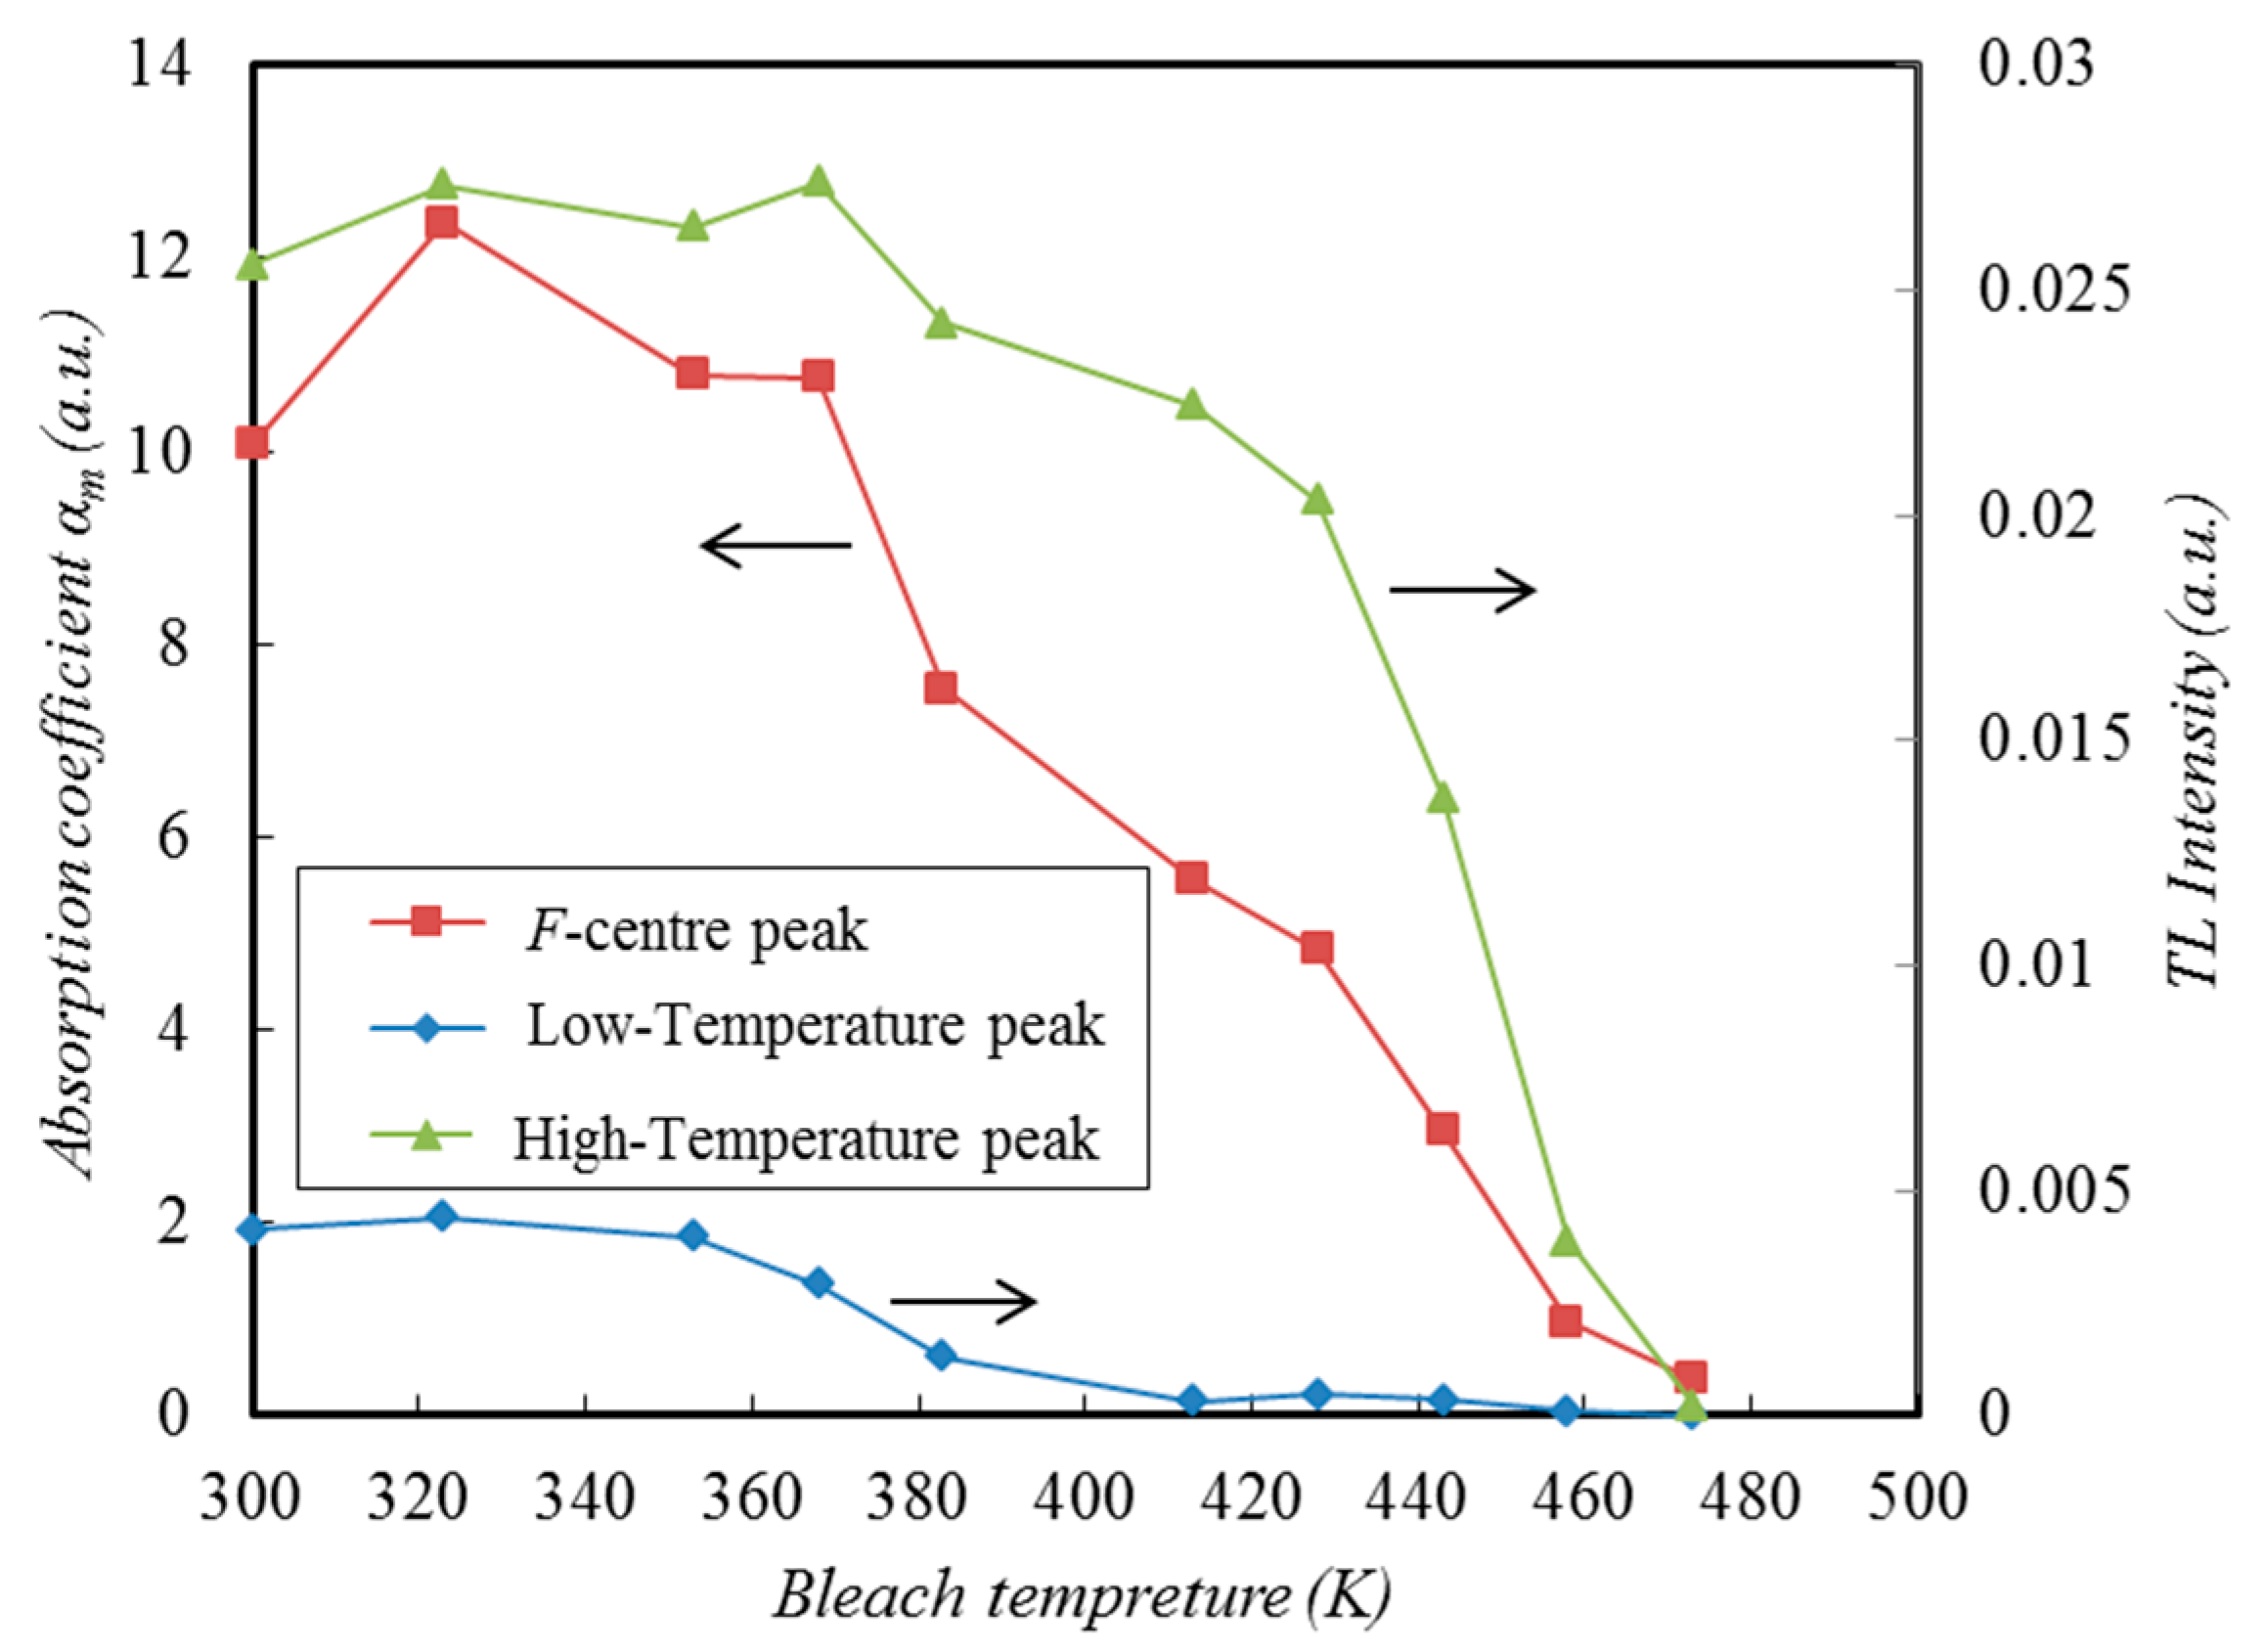
3.3. Absorption Spectrum and TL Glow after F-Bleach and Thermal-Bleach

KCl:Eu2+ (0.1 mol%) crystals after X-ray irradiation (irradiation time 8 min) were bleached with F-light (560 nm wavelength). The bleach was conducted using an optical bandpass filter with 5 nm bandwidth. Therefore, the F-light bleaching removes the F-centre peak within 5 nm bandwidth from the TL signal and the Fz-centre peak is enhanced. This may lead to resolve the Fz-centre. Figure 9a represents variation of AC560 with the F-light exposure time. Figure 9b shows those of LTP (blue solid line) and HTP (red solid one) of TL glow curve with the F-light exposure time.
For effect, the three peak values without F-bleach are presented in the figures (plots on ordinate of the figures). Both AC560 and HTP decrease with increasing F-light exposure time. However, LTP seems to be almost constant independently of the exposure time.
Similarly, the X-ray irradiated crystals were also bleached with F-light at the excitation bandpass of 20 nm. X-ray irradiation time was 6 min. Figure 10a,b is shown as a result of bleaching with the F-light. All of AC560, LTP (blue solid line) and HTP (red solid one) identically decrease with increasing exposure time of the F-light. This is expected to free the electrons trapped at vacancies near or far away from a Eu2+ ion-cation vacancy dipole. The absorption peak due to the Fz-centre does not exist on about 560 nm wavelength. However, the hidden peak due to the Fz-centre is either on the lower or on the higher side of 560 nm in the absorption spectrum. This supports the report that the absorption band with a maximum at 590 nm is associated with Fz-centres in the KCl:Eu2+ (0.1 wt%) crystal at 10 K, which is previously X-ray irradiated and subsequently photostimulated with F-light (wavelength 520 nm) at room temperature [13]. In Figure 9b and Figure 10b LTP initially increases in intensity below the exposure time 1 min, whereupon there is the dynamical rearrangement of F-centres to Eu2+ to form Fz here (F-centres transform partially to Fz-centres during the F-bleach) as described in the papers [11,14].
Secondly, thermal-bleach was carried out for X-ray irradiated KCl:Eu2+ (0.02 mol%) crystals on purpose to obtain further insight into the nature of the electron traps after the irradiation. X-ray irradiation time was 10 min. Dependence of AC560 (red solid line), LTP (blue solid one) and HTP (green solid one) on the bleach temperature is shown in Figure 11. These peak values without thermal-bleach are also presented as plots on ordinate of the figure for effect. The height of LTP decreases with the bleach temperature above 360 K and approaches to zero at 400 K. At the corresponding bleach temperature (360 K), AC560 also begins to become small with the bleach temperature, as shown in Figure 11. This may lead to the phenomenon that the wavelength at Fz-centre and F-centre peaks in the absorption spectrum is nearly equal with each other, as previously mentioned in this section. Above the bleach temperature of 400 K, reduction in AC560 continues in accordance with the bleach temperature dependence of HTP until 473 K. These results would mean that electrons trapped at shallow traps (i.e. Fz-centres) begin to be set free at about 370 K and end detrapping from the traps around 400 K. Continuously, electrons trapped at deep traps (i.e. F-centres) begin to detrap within 400 to 473 K. That is to say, this allows us to confirm two overlapping absorption peaks due to F- and Fz-centres around the peak at wavelength 560 nm in Figure 4 and Figure 6a, though Fz-centre peak is too low to be observed here.

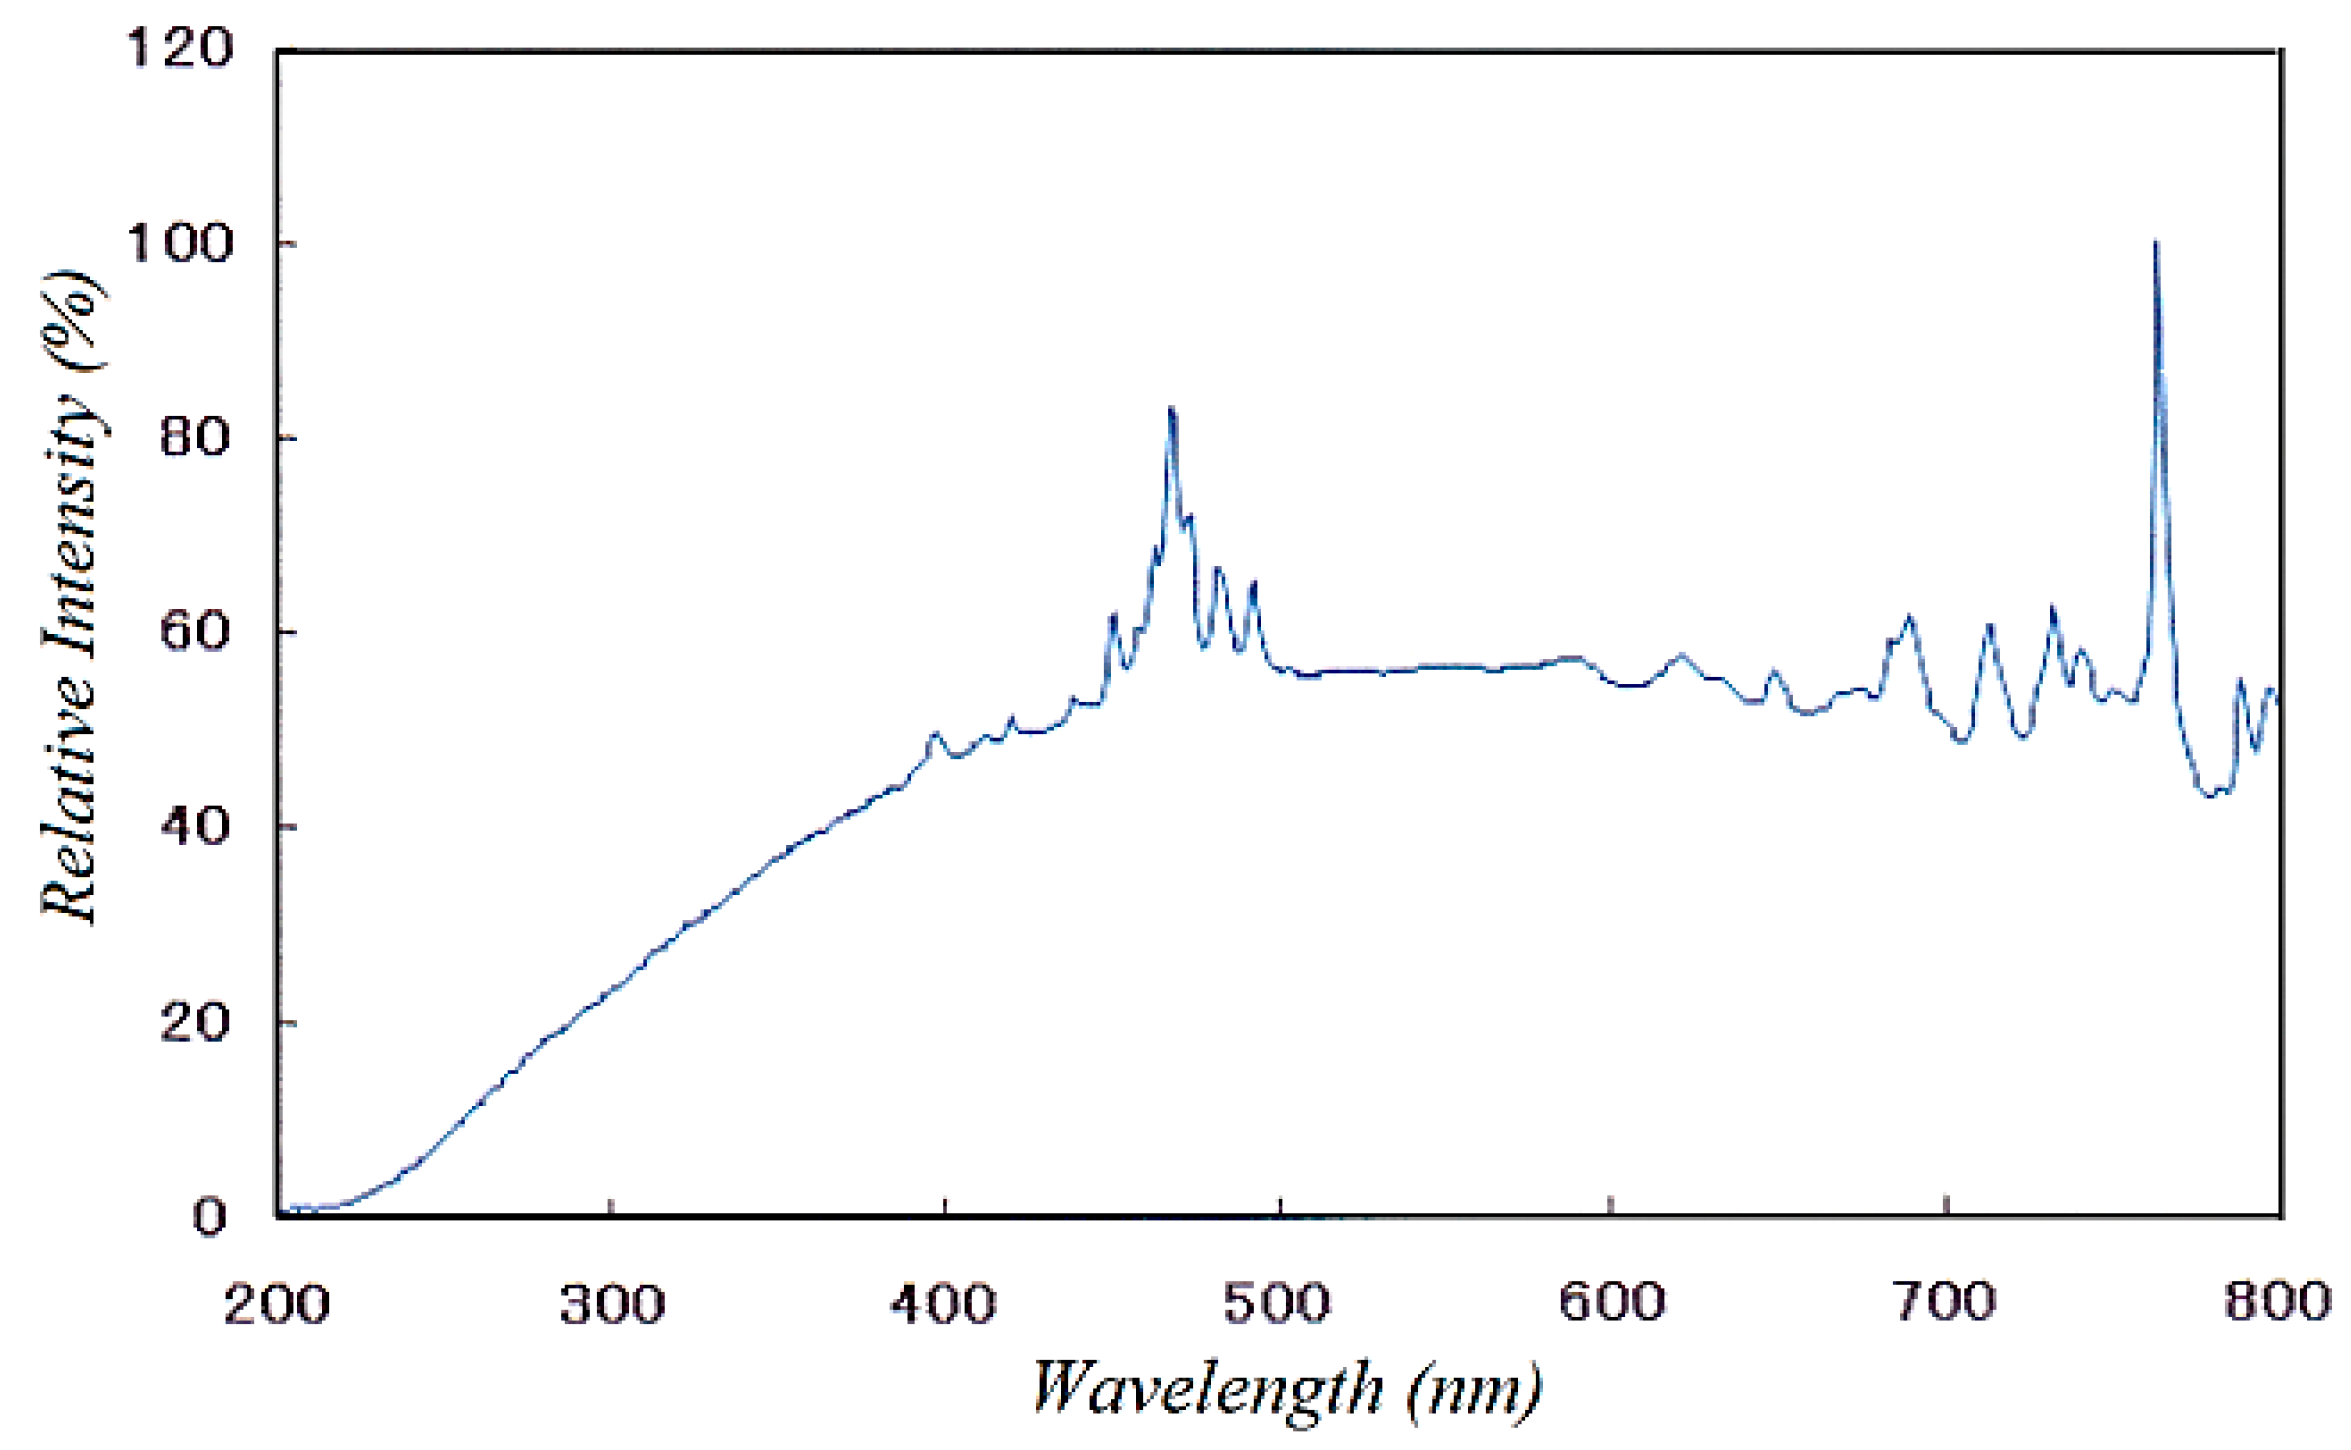
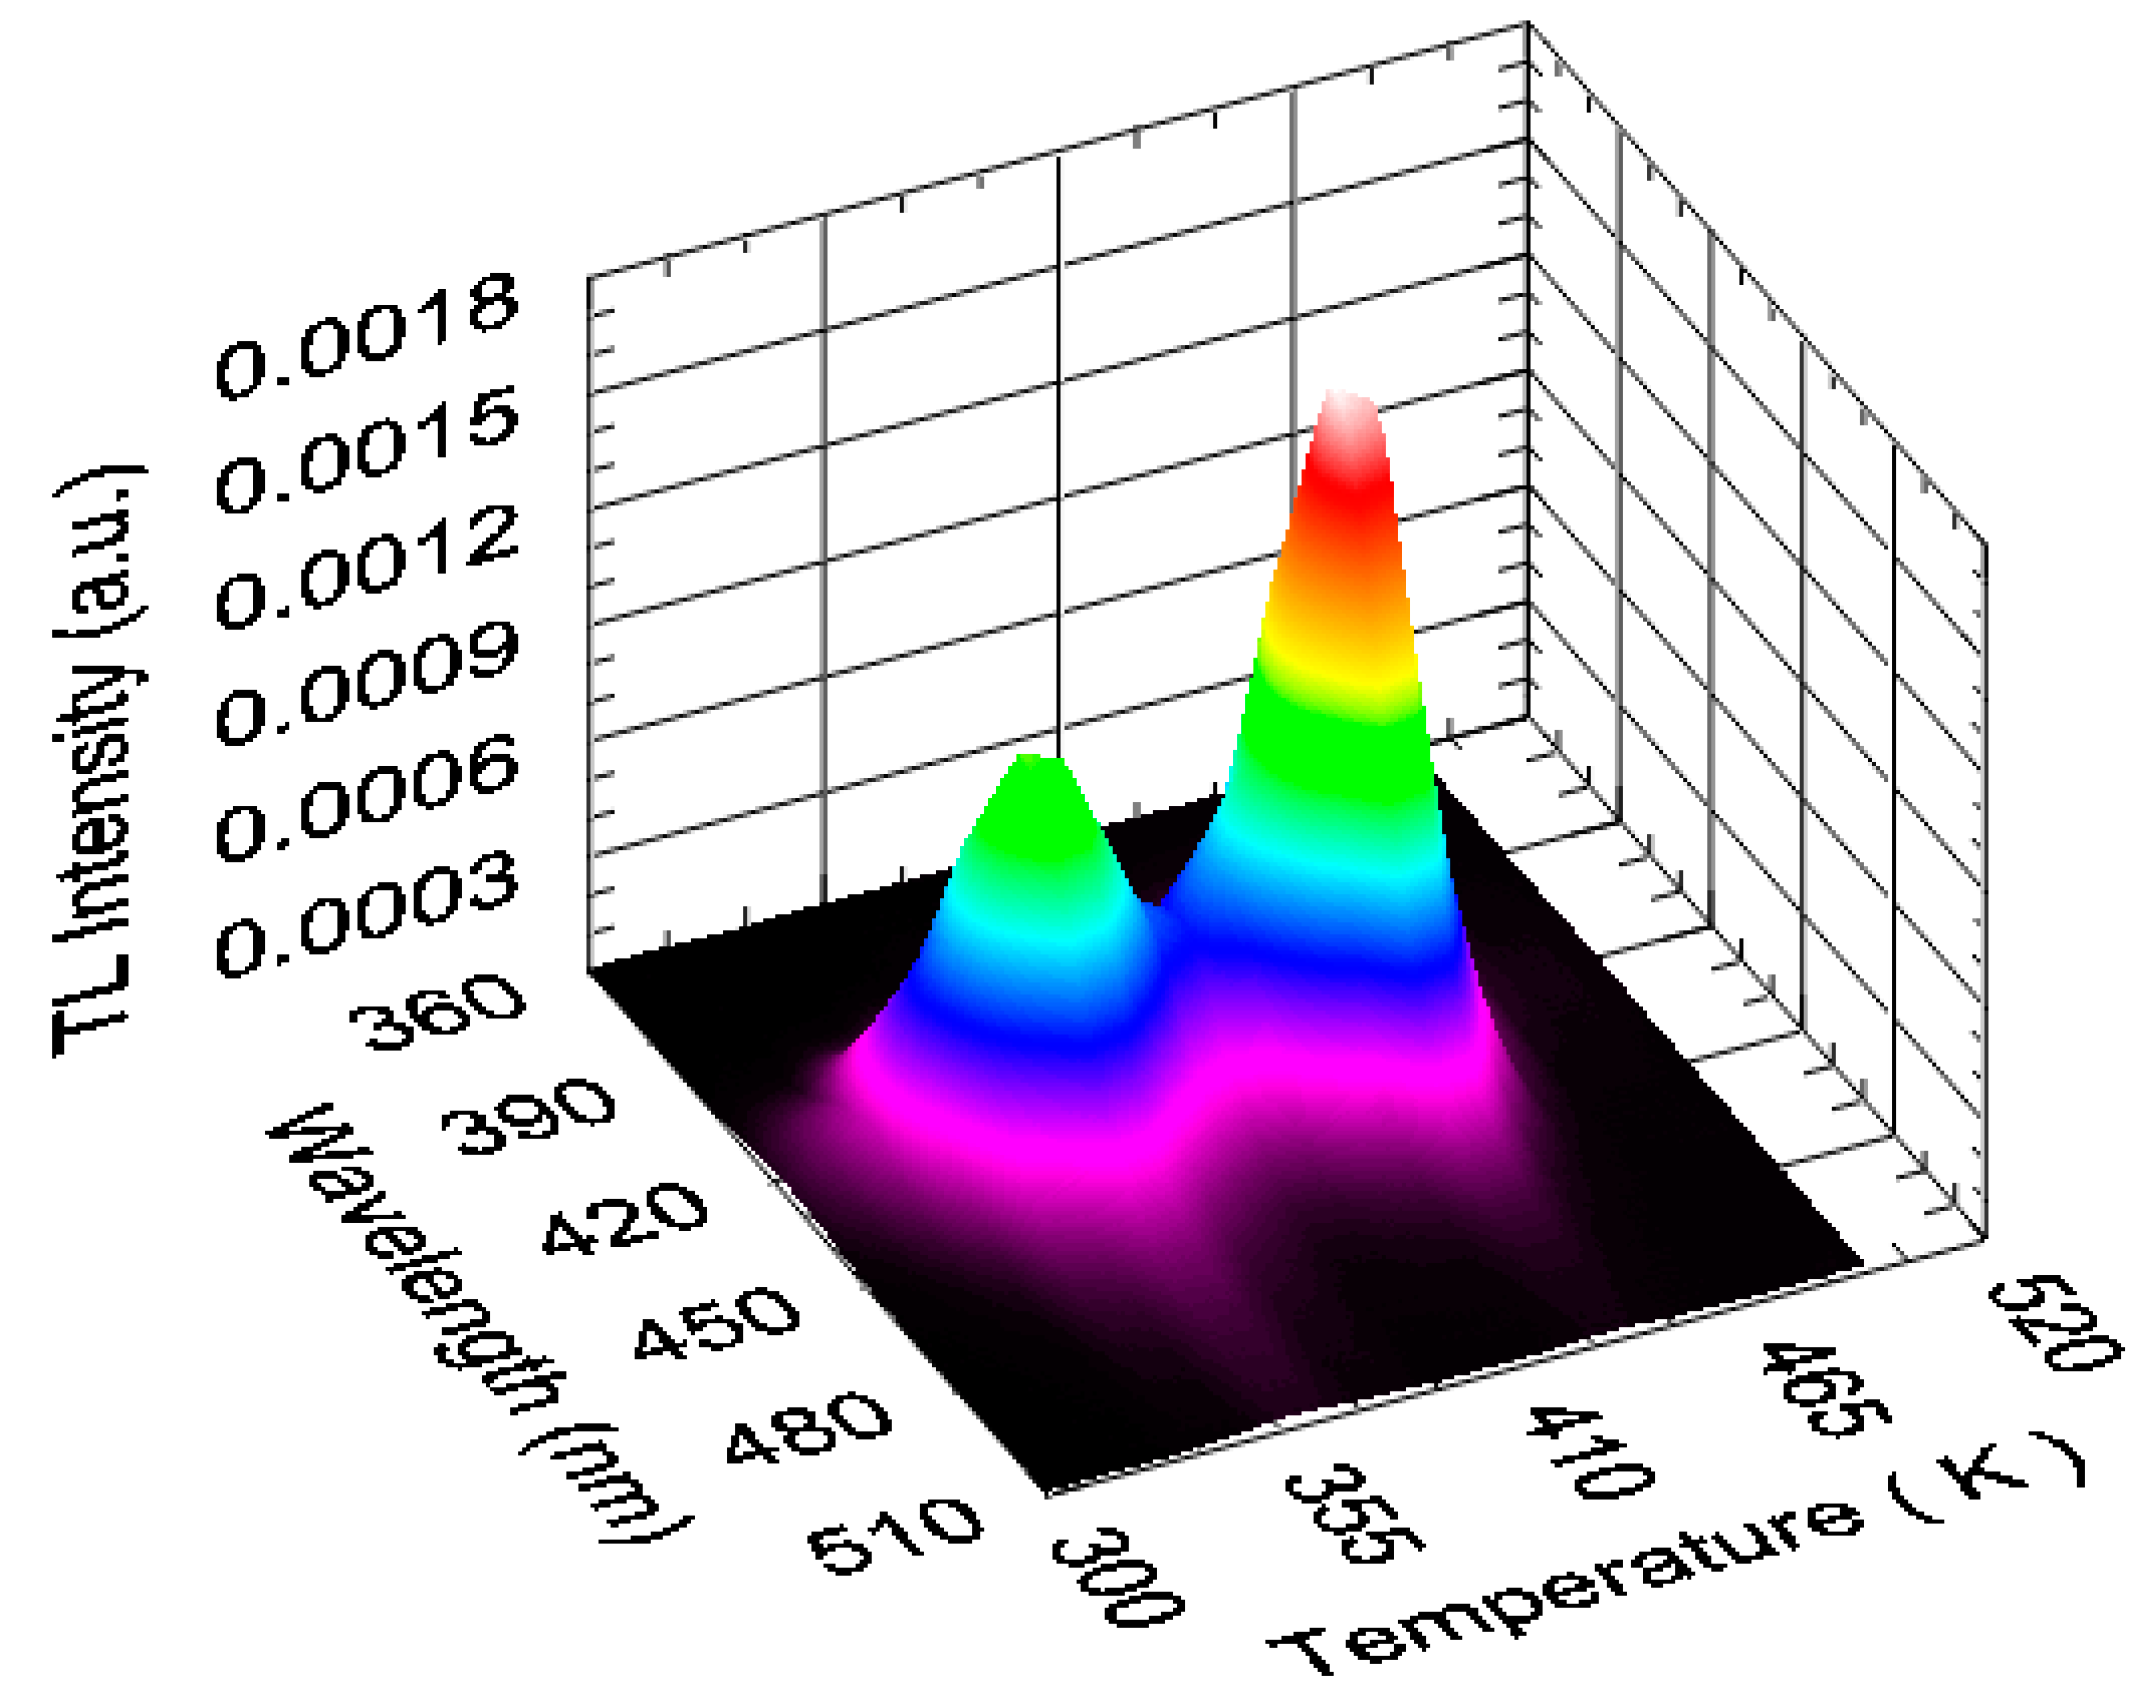
3.4. Variation of TL Spectrum with Temperature

TL spectrum was measured in order to investigate luminescence centre on TL glow of X-ray irradiated KCl:Eu2+ (0.04 mol%) crystals. Figure 12 shows the collection of TL spectra at each temperature for the phosphor crystals. X-ray irradiation time was 10 min. TL spectrum has a peak of 420 nm at LTP and HTP of TL glow curve. The luminescence peak is the same peak as that obtained by OSL measurements of X-ray or ultraviolet-ray irradiated KCl:Eu2+ crystals in the paper [16]. Luminescence spectra in Figure 12 are explained using the energy-band diagram as shown in Figure 13 as follows.
X-ray irradiation causes free electrons and holes in the crystal. It is likely that a part of the free electrons excited from Eu2+ ions to conduction band are trapped at anion vacancies to produce the Fz-centres at the low temperature (370 K) and the F-centres at the high temperature (450 K). Some holes are also trapped at Eu2+ to produce Eu3+ ions. Electrons released from Fz- and F-centres combine with Eu3+ ions at each temperature leading to the excited Eu2+ ions from which the 420 nm emitted. The process is expressed by:
Eu3+ + e → (Eu2+)* → Eu2+ + (420 nm)
where e indicates free electron, (Eu2+)* is the divalent europium excited state and has its usual meaning. Accordingly, the transition from the excited state of divalent europium to the ground state results in the 420 nm luminescence, which is due to the 4f65d→4f7 transition of Eu2+ ions [12].

4. Conclusions

The following conclusions were derived from the results and discussion based on the data analysed in terms of the absorption spectrum, TL glow and TL spectrum for X-ray irradiated KCl:Eu2+ crystals.
(1) Bleaching with the F-light at the excitation bandpass of 20 nm results in the phenomenon that F-centre peak, LTP and HTP identically decrease with the F-bleach time, whereas LTP only remains almost constant irrespective of its time in the case of that at the excitation bandpass of 5 nm.
(2) During the thermal-bleach above 360 K, F-centre peak in the absorption spectrum continues to reduce in accordance with the bleach temperature dependence of two TL glow peaks: LTP at 360 to 400 K and HTP at 400 to 473 K.
(3) The X-ray irradiation induces Fz- and F-centres in KCl:Eu2+ crystal, of which the wavelengths are almost equalled with each other in the absorption spectrum. The wavelength at Fz-centre peak is approximately within 20 nm of it (560 nm) at F-centre peak.
(4) Luminescence centre on LTP and HTP of TL glow curve is considered to depend on the excited Eu2+ ions which are created by the combination of Eu3+ ions and free electrons from Fz-centres or F-centres.

Author Contributions

Y.K. and T.O. analysed the data and wrote the paper. All authors contributed to this research.

Funding

This research received no external funding.

Acknowledgments

We would like to thank Y. Igari for his experimental assistance.

Conflicts of Interest

The authors declare no conflict of interest.

References

  1. Camacho, A.Q.; Muñoz, G.H.; Rubio, J.O.; Garcia, J.M.; Murrieta, H.S.; Hernandez, J.A. Dosimetric properties of KCI:Eu. J. Mater. Sci. Lett. 1988, 7, 437–440. [Google Scholar] [CrossRef]
  2. Nanto, H.; Murayama, K.; Usuda, T.; Taniguchi, S.; Takeuchi, N. Optically stimulated luminescence in KCl:Eu single crystals. Radiat. Prot. Dosim. 1993, 47, 281–284. [Google Scholar] [CrossRef]
  3. Nanto, H.; Ikeda, M.; Nishishita, J.; Kadota, M.; Nasu, S.; Douguchi, Y.; Taniguchi, S.; Inabe, K. Eu concentration dependence of photostimulated luminescence in X-ray or uv-ray irradiated KCl:Eu phosphor ceramics. Nucl. Instr. Meth. Phys. Res. B 1996, 116, 542–544. [Google Scholar] [CrossRef]
  4. Kao, K.J.; Perlman, M.M. X-ray effects on cation impurity-vacancy pairs in KCl:Eu2+. Phys. Rev. B 1979, 19, 1196–1202. [Google Scholar] [CrossRef]
  5. Amemiya, Y.; Wakabayashi, K.; Tanaka, H.; Ueno, Y.; Miyahara, J. Laser-stimulated luminescence used to measure x-ray diffraction of a contracting striated muscle. Science 1987, 237, 164–168. [Google Scholar] [CrossRef] [PubMed]
  6. Amemiya, Y.; Miyahara, J. Imaging plate illuminates many fields. Nature 1988, 336, 89–90. [Google Scholar] [CrossRef] [PubMed]
  7. Amemiya, Y.; Kishimoto, S.; Matsushita, T.; Satow, Y.; Ando, M. Imaging plate for time-resolved X-ray measurements. Rev. Sci. Instrum. 1989, 60, 1552–1556. [Google Scholar] [CrossRef]
  8. Driewer, J.P.; Chen, H.; Osvet, A.; Low, D.A.; Li, H. Radiation hardness of the storage phosphor europium doped potassium chloride for radiation therapy dosimetry. Med. Phys. 2011, 38, 4681–4688. [Google Scholar] [CrossRef] [PubMed] [Green Version]
  9. Hansel, R.A.; Xiao, Z.; Zhang, L.; Li, H.H. X-ray storage performance of KCl:Eu2+ with high cumulated dose. Nucl. Instrum. Methods Phys. Res. B 2014, 326, 178–181. [Google Scholar] [CrossRef] [PubMed]
  10. Pedroza-Montero, M.; Castañeda, B.; Meléndrez, R.; Piters, T.M.; Barboza-Flores, M. Thermoluminescence, optical stimulated luminescence and defect creation in europium doped KCl and KBr crystals. Phys. Stat. Sol. 2000, 220, 671–676. [Google Scholar] [CrossRef]
  11. Chernov, V.; Meléndrez Ao, R.; Piters, T.M.; Barboza-Flores, M. Thermally and optically stimulated luminescence correlated processes in x-ray irradiated KCl:Eu2+. Radiat. Meas. 2001, 33, 797–800. [Google Scholar] [CrossRef]
  12. Rubio, J.O.; Flores, M.C.; Murrieta, H.M.; Hernandez, J.A.; Jaque, F.; Lopez, F.J. Influence of concentration and aggregation-precipitation state of divalent europium in the room-temperature coloring of KCl. Phys. Rev. B 1982, 26, 2199–2207. [Google Scholar]
  13. Aceves, R.; Pérez Salas, R.; Barboza-Flores, M. The role of F centres in the thermoluminescence of low-energy UV- and X-irradiated KCl:Eu2+. J. Phys. Condens. Matter 1994, 6, 10397–10405. [Google Scholar] [CrossRef]
  14. Pedroza-Montero, M.; Castañteda, B.; Meléndrez, R.; Chernov, V.; Barboza-Flores, M. Comparative investigations of TL and OSL in KCI:Eu2+ crystals irradiated with uv and X-rays. Radiat. Eff. Def. Sol. 2001, 154, 319–324. [Google Scholar] [CrossRef]
  15. Hernandez, A.J.; Cory, W.K.; Rubio, O.J. A non-destructive method for determining the Eu2+ concentration in the alkali chlorides. Jpn. J. Appl. Phys. 1979, 18, 533–538. [Google Scholar] [CrossRef]
  16. Nanto, H.; Endo, F.; Hirai, Y.; Nasu, S.; Taniguchi, S.; Takeuchi, N. Eu-doped KCl phosphor crystals as a storage material for two-dimensional ultraviolet-ray or X-ray imaging sensors. J. Appl. Phys. 1994, 75, 7493–7497. [Google Scholar] [CrossRef]
Figure 1. Schematic diagram of thermoluminescence (TL) measurement.
Crystals 09 00331 g001
Figure 2. Heating curve for the specimen.
Crystals 09 00331 g002
Figure 3. Emission spectra of F-light source (xenon lamp).
Crystals 09 00331 g003
Figure 4. Absorption spectra of KCl:Eu2+ (0.02 mol%) single crystals before and after the X-ray irradiation (irradiation time: 5 min).
Crystals 09 00331 g004
Figure 5. TL glow curve of X-ray irradiated KCl:Eu2+ (0.02 mol%) single crystals.
Crystals 09 00331 g005
Figure 6. Variations of (a) absorption spectrum and (b) TL glow curve of X-ray irradiated KCl:Eu2+ (0.04 mol%) single crystals with the irradiation time.
Crystals 09 00331 g006
Figure 7. Variations of (a) absorption coefficient at about 560 nm wavelength of absorption spectrum and (b) each peak of TL glow curve of X-ray irradiated KCl:Eu2+ (0.04 mol%) single crystals with the irradiation time. The dotted lines are to guide the reader’s eye.
Crystals 09 00331 g007
Figure 8. Relationships between the absorption coefficient at about 560 nm wavelength of absorption spectrum and the intensity for each peak on TL glow curve of X-ray irradiated KCl:Eu2+ (0.04 mol%) single crystals. The dotted lines are to guide the reader’s eye.
Crystals 09 00331 g008
Figure 9. Variations of (a) absorption coefficient and (b) each peak on TL glow curve of X-ray irradiated (irradiation time: 8 min) KCl:Eu2+ (0.1 mol%) single crystals with F-light (excitation bandpass: 5 nm) exposure time.
Crystals 09 00331 g009
Figure 10. Variations of (a) absorption coefficient and (b) each peak on TL glow curve of X-ray irradiated (irradiation time: 6 min) KCl:Eu2+ (0.1 mol%) single crystals with F-light (excitation bandpass: 20 nm) exposure time.
Crystals 09 00331 g010
Figure 11. Variations of F-centre peak in absorption spectrum and each peak of TL glow curve with thermal-bleach temperature for X-ray irradiated (irradiation time: 10 min) KCl:Eu2+ (0.02 mol%) single crystals.
Crystals 09 00331 g011
Figure 12. Variation of TL spectrum with temperature for X-ray irradiated (irradiation time: 10 min) KCl:Eu2+ (0.04 mol%) single crystals.
Crystals 09 00331 g012
Figure 13. Energy-band diagram at KCl:Eu2+ phosphor crystal for excitation and emission mechanism in X-ray irradiated specimen.
Crystals 09 00331 g013

