Article

Resonance Raman Spectroscopy of Mn-Mgk Cation Complexes in GaN

1
V. Lashkaryov Institute of Semiconductor Physics of National Academy of Sciences of Ukraine, 41 Nauky pr., 03028 Kyiv, Ukraine
2
Institut für Halbleiter-und-Festkörperphysik, Johannes Kepler University, Altenbergerstr. 69, A-4040 Linz, Austria
*
Author to whom correspondence should be addressed.
Crystals 2019, 9(5), 235; https://doi.org/10.3390/cryst9050235
Submission received: 15 April 2019 / Revised: 1 May 2019 / Accepted: 2 May 2019 / Published: 4 May 2019
(This article belongs to the Special Issue Raman Spectroscopy of Crystals)

Abstract

:
Resonance Raman analysis is performed in order to gain insight into the nature of impurity-induced Raman features in GaN:(Mn,Mg) hosting Mn-Mgk cation complexes and representing a prospective strategic material for the realization of full-nitride photonic devices emitting in the infra-red. It is found that in contrast to the case of GaN:Mn, the resonance enhancement of Mn-induced modes at sub-band excitation in Mg co-doped samples is not observed at an excitation of 2.4 eV, but shifts to lower energies, an effect explained by a resonance process involving photoionization of a hole from the donor level of Mn to the valence band of GaN. Selective excitation within the resonance Raman conditions allows the structure of the main Mn-induced phonon band at ~670 cm−1 to be resolved into two distinct components, whose relative intensity varies with the Mg/Mn ratio and correlates with the concentration of different Mn-Mgk cation complexes. Moreover, from the relative intensity of the 2LO and 1LO Raman resonances at inter-band excitation energy, the Huang-Rhys parameter has been estimated and, consequently, the strength of the electron-phonon interaction, which is found to increase linearly with the Mg/Mn ratio. Selective temperature-dependent enhancement of the high-order multiphonon peaks is due to variation in resonance conditions of exciton-mediated outgoing resonance Raman scattering by detuning the band gap.

1. Introduction

Gallium nitride (GaN)-based semiconductors, due to their remarkable properties such as wide tunability of direct band-gap, the availability of both n- and p-type material, high thermal stability, large heat conductivity, high electric field strength, and electron mobility, are key materials for state-of-the-art high-efficiency optoelectronic devices, such as blue, ultra-violet, and white light emitting diodes (LEDs) [1], laser diodes [2], and high-power and high-frequency electronic devices, like e.g., electron mobility transistors (HEMTs) [3]. Moreover, as recently demonstrated, the co-doping of GaN with Mn and Mg results in the formation of Mn-Mgk cation complexes—with k the number of ligands [4]—which are responsible for a strong room-temperature broad near infra-red (NIR) emission and open wide perspectives to extend the functionalities of III-nitride systems to the NIR range without the need of rare earths or In [5].
Raman spectroscopy is an informative tool to investigate impurities and impurity complexes in semiconductors by probing their specific impurity-induced local vibrational modes (LVM) [6,7], which can be significantly enhanced in resonance conditions, i.e., when the energy of the excitation is close or coincides with one of the electron energy levels in the system. Doping of GaN with Mg and Mn leads to a rich set of impurity-related Raman bands. The most prominent feature related to the incorporation of Mn is the phonon band detected at 667 cm−1 [8,9]. This mode was shown to have a strong polarization dependence similar to the one of the A1(LO) mode of GaN [9], a resonance enhancement at an excitation of 2.4 eV and a linear-like dependence on the Mn concentration [8]. The 667 cm−1 band, together with a set of less intense phonon bands found in the range between the E 2 high and the A1(LO) modes of GaN at ~600 cm−1, ~630 cm−1, and between 700 cm−1 and 730 cm−1, were compared with the calculated phonon density of states (DOS) of GaN:Mn and attributed to modes activated by disorder in the nitrogen sublattice, while their high intensity is explained by the impurity-induced Fröhlich type resonance Raman scattering related to the charge transfer level of the Mn2+ center [9]. Raman modes in Mg-doped GaN found at 136 cm−1, 262 cm−1, and 656 cm−1 were attributed to LVM modes of Mg on Ga sites, while broad bands around 320 cm−1 and 595 cm−1 originate from disorder-activated scattering [10,11]. All mentioned modes exhibit A1 symmetry and scale with the Mg concentration.
Doping of epitaxial GaN films with Mn results in the onset of a Mn-induced feature at 667 cm−1, which in the case of disordered Mn-implanted GaN structures was assigned to the LVM of GaN related to nitrogen vacancies VN, since this mode shows a significant polarization dependence, becomes sharper with decreasing Mn content, i.e., at lower defect concentration, and is found in GaN implanted with different foreign elements [12,13]. In contrast, the phonon band at (579–586) cm−1 is attributed to the LVM of Mn, in view of its strong polarization dependence consistent with the local symmetry of Mn ions occupying Ga sites and of its frequency consistent with the one estimated within the light impurity model [8,13]. The broad background bands centered at 300 cm−1, 430 cm−1, and 730 cm−1 respectively—also found in ion-implanted GaN [12]—show no relevant polarization dependence and are related to a defect-induced response due to the activation of the phonon DOS [13].
The Mn-induced Raman features are significantly modified when GaN:Mn is co-doped with Mg. The behavior of the impurity-related bands in GaN:(Mn,Mg) containing Mn-Mgk cation complexes was reported as a function of the Mg/Mn ratio [8]. In particular, it was shown that co-doping of GaN:Mn with Mg leads to: (i) a significant decay of the Mn-induced features in the range between the E 2 high and the A1(LO) modes of GaN, and to a lesser extent, in correspondence of the 667 cm−1 band; (ii) a gradual high-frequency shift of the 667 cm−1 band with increasing Mg/Mn ratio, consistent with the shortening of the Mn-N bond length in the Mn-Mgk cation complexes expected from ab initio calculations [4]; (iii) the appearance of a broad structure at ~688 cm−1, whose intensity correlates with the presence of Mn-Mg2 complexes.
Here, the in-depth analysis of excitation-dependent resonance Raman spectroscopy at a sub-band-gap excitation of GaN:(Mn,Mg) with Mn-Mgk IR-emitting cation complexes is reported. In addition, a resonance Raman analysis at the inter-band excitation energy is performed in order to estimate the strength of the electron-phonon interaction from the relative intensity of the 2LO and 1LO Raman resonances.

2. Materials and Methods

The investigated samples consist of a 1µm-thick GaN buffer layer grown on c-sapphire (0001), on which a 600 nm-thick layer of GaN doped with Mn and/or Mg is deposited. The samples are fabricated using metalorganic vapor phase epitaxy (MOVPE) according to a procedure previously reported [4,14]. Alternatives to c-sapphire as substrates for the growth of nitride compounds have been widely investigated [15,16]. Furthermore, options for buffer/nucleation layers aimed at minimizing the effects of lattice and thermal mismatch between substrate and overlayers are currently considered, and significant progress has been made in the epitaxy of III-nitrides on Si [17]. Nevertheless, c-sapphire is still the preferred substrate for the fabrication of nitride-based optoelectronic device structures, and accordingly, it is employed in this work.
The thickness of the various epitaxial layers has been determined on-line during the growth process by means of laser reflectometry and then confirmed using complementary high-resolution transmission electron microscopy (HRTEM) on cross-sectional specimens and x-ray diffraction (XRD) measurements, as previously reported in [4,5,8,14]. Moreover, according to the applied comprehensive protocol of structural and magnetic characterization [4,5,8,14], the Mn ions (and related complexes) are randomly and homogeneously distributed over the corresponding layers (both in-plane and in the growth direction). A sketch of the architecture of the sample is provided in Figure 1, while a list of the investigated samples is given in Table 1, together with the respective Mn content xMn, Mg concentration xMg, and Mg/Mn ratio. The concentrations of Mg and Mn reported in columns 2 and 3 of Table 1 have been obtained using secondary-ion mass spectroscopy (SIMS) analysis, while the Mg/Mn ratios are the result of extended X-ray fine structure (EXAFS) data and data analysis, according to the procedures and protocols in [4].
Room-temperature Raman spectra are collected in backscattering geometry from the c-plane at excitations of 488 nm and 514 nm using a Horiba JobinYvon T64000 micro-Raman spectrometer, at 632 nm with a Renishaw inVia micro-Raman spectrometer, and at 785 nm by means of a line-focus Raman microscope with a Princeton Instruments IsoPlane SCT-320 spectrograph [18]. Polarized Raman spectra were measured in parallel z ( y , y ) z ¯ and crossed z ( x , y ) z ¯ scattering geometries. Photoluminescence (PL) spectra were acquired at excitations of 785 nm and 514 nm, respectively.

3. Results and Discussion

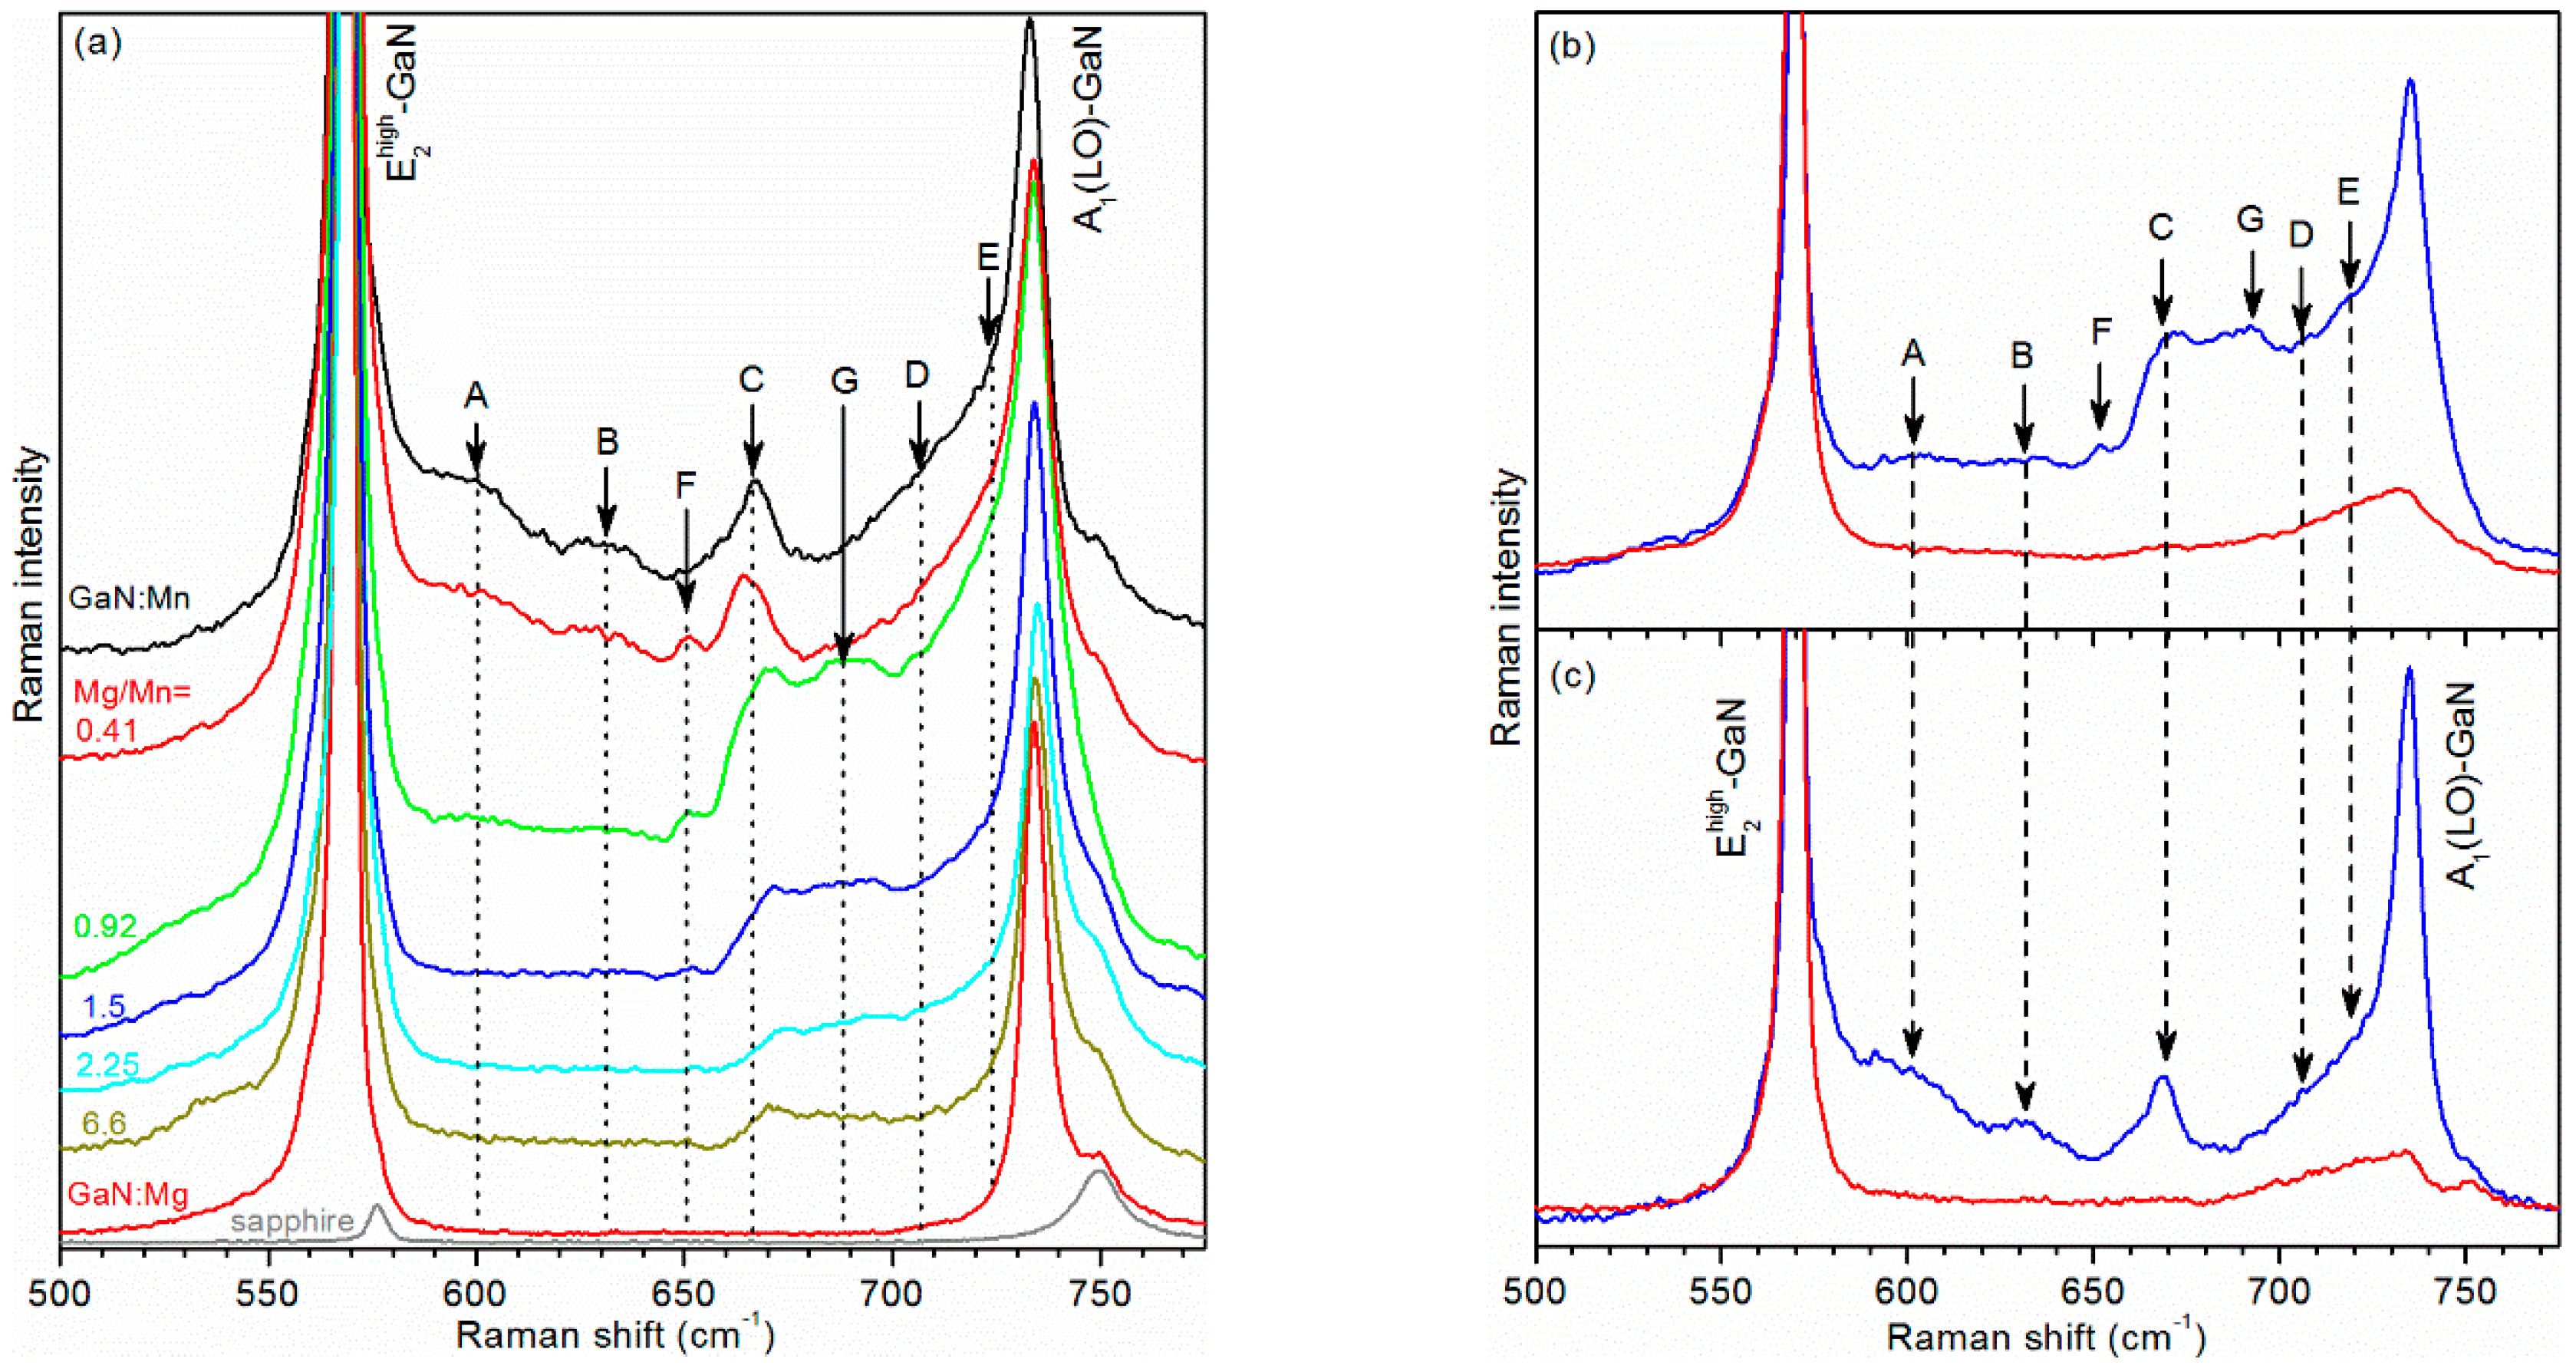
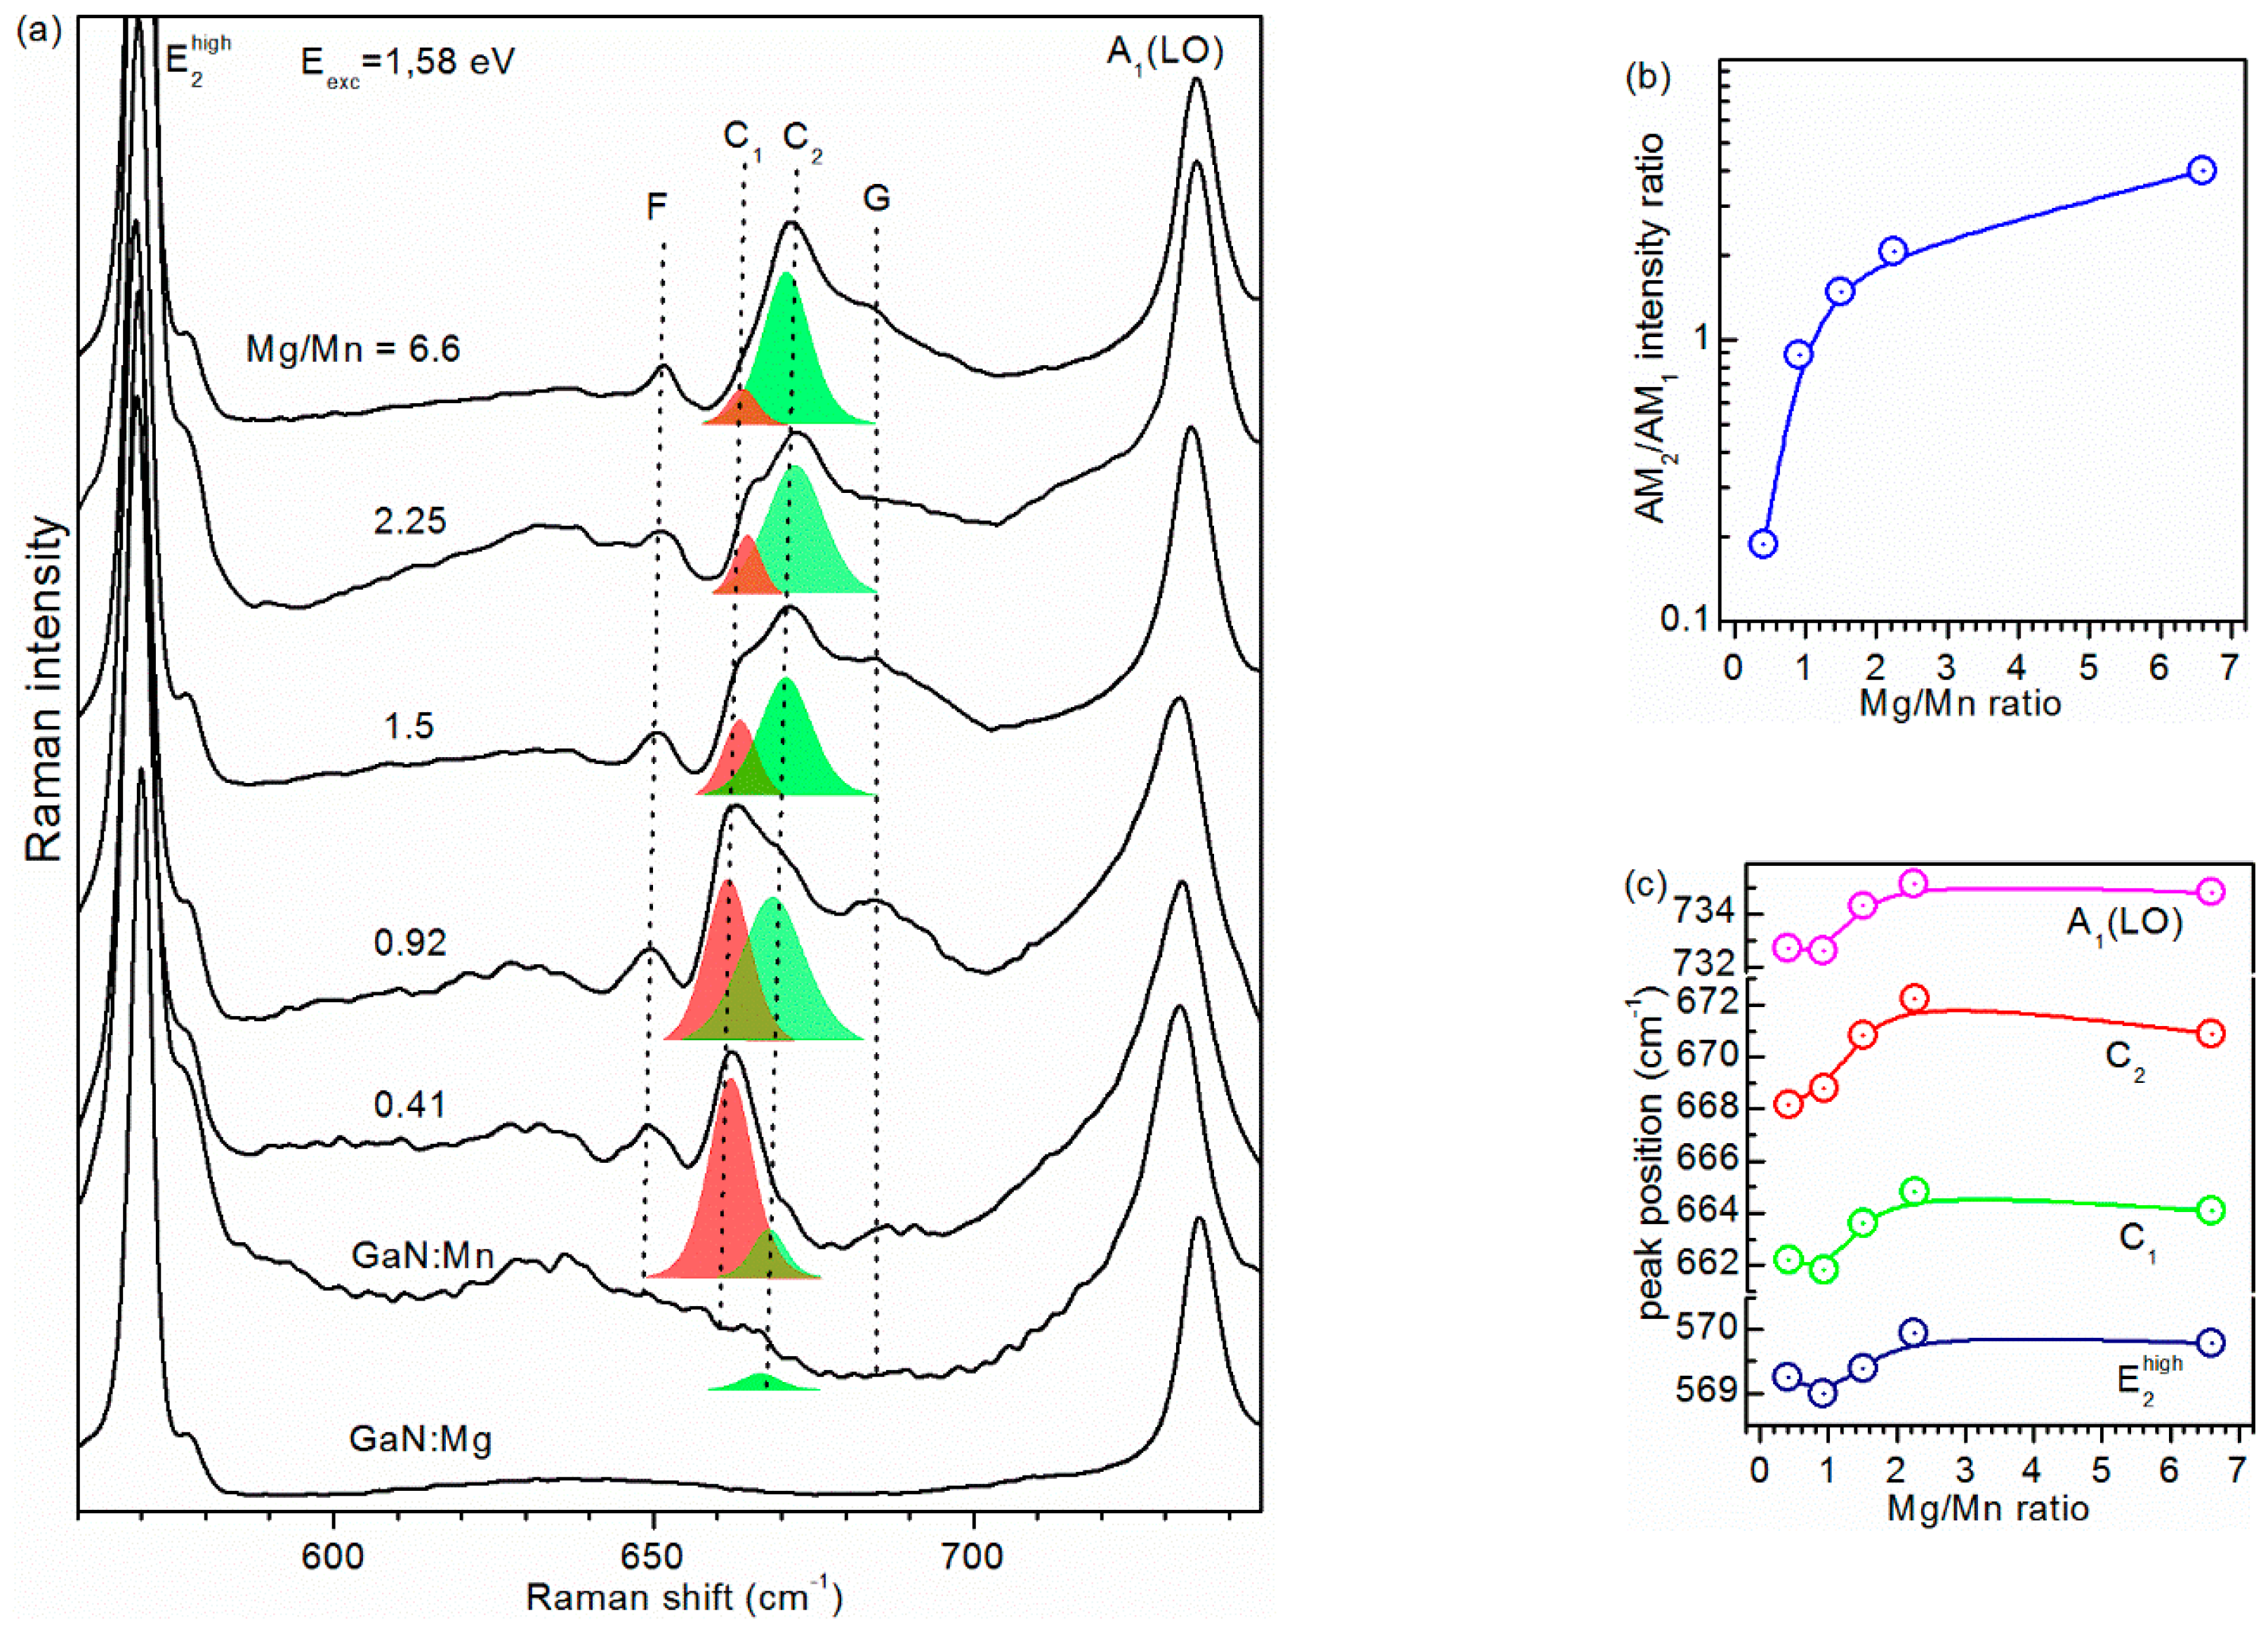
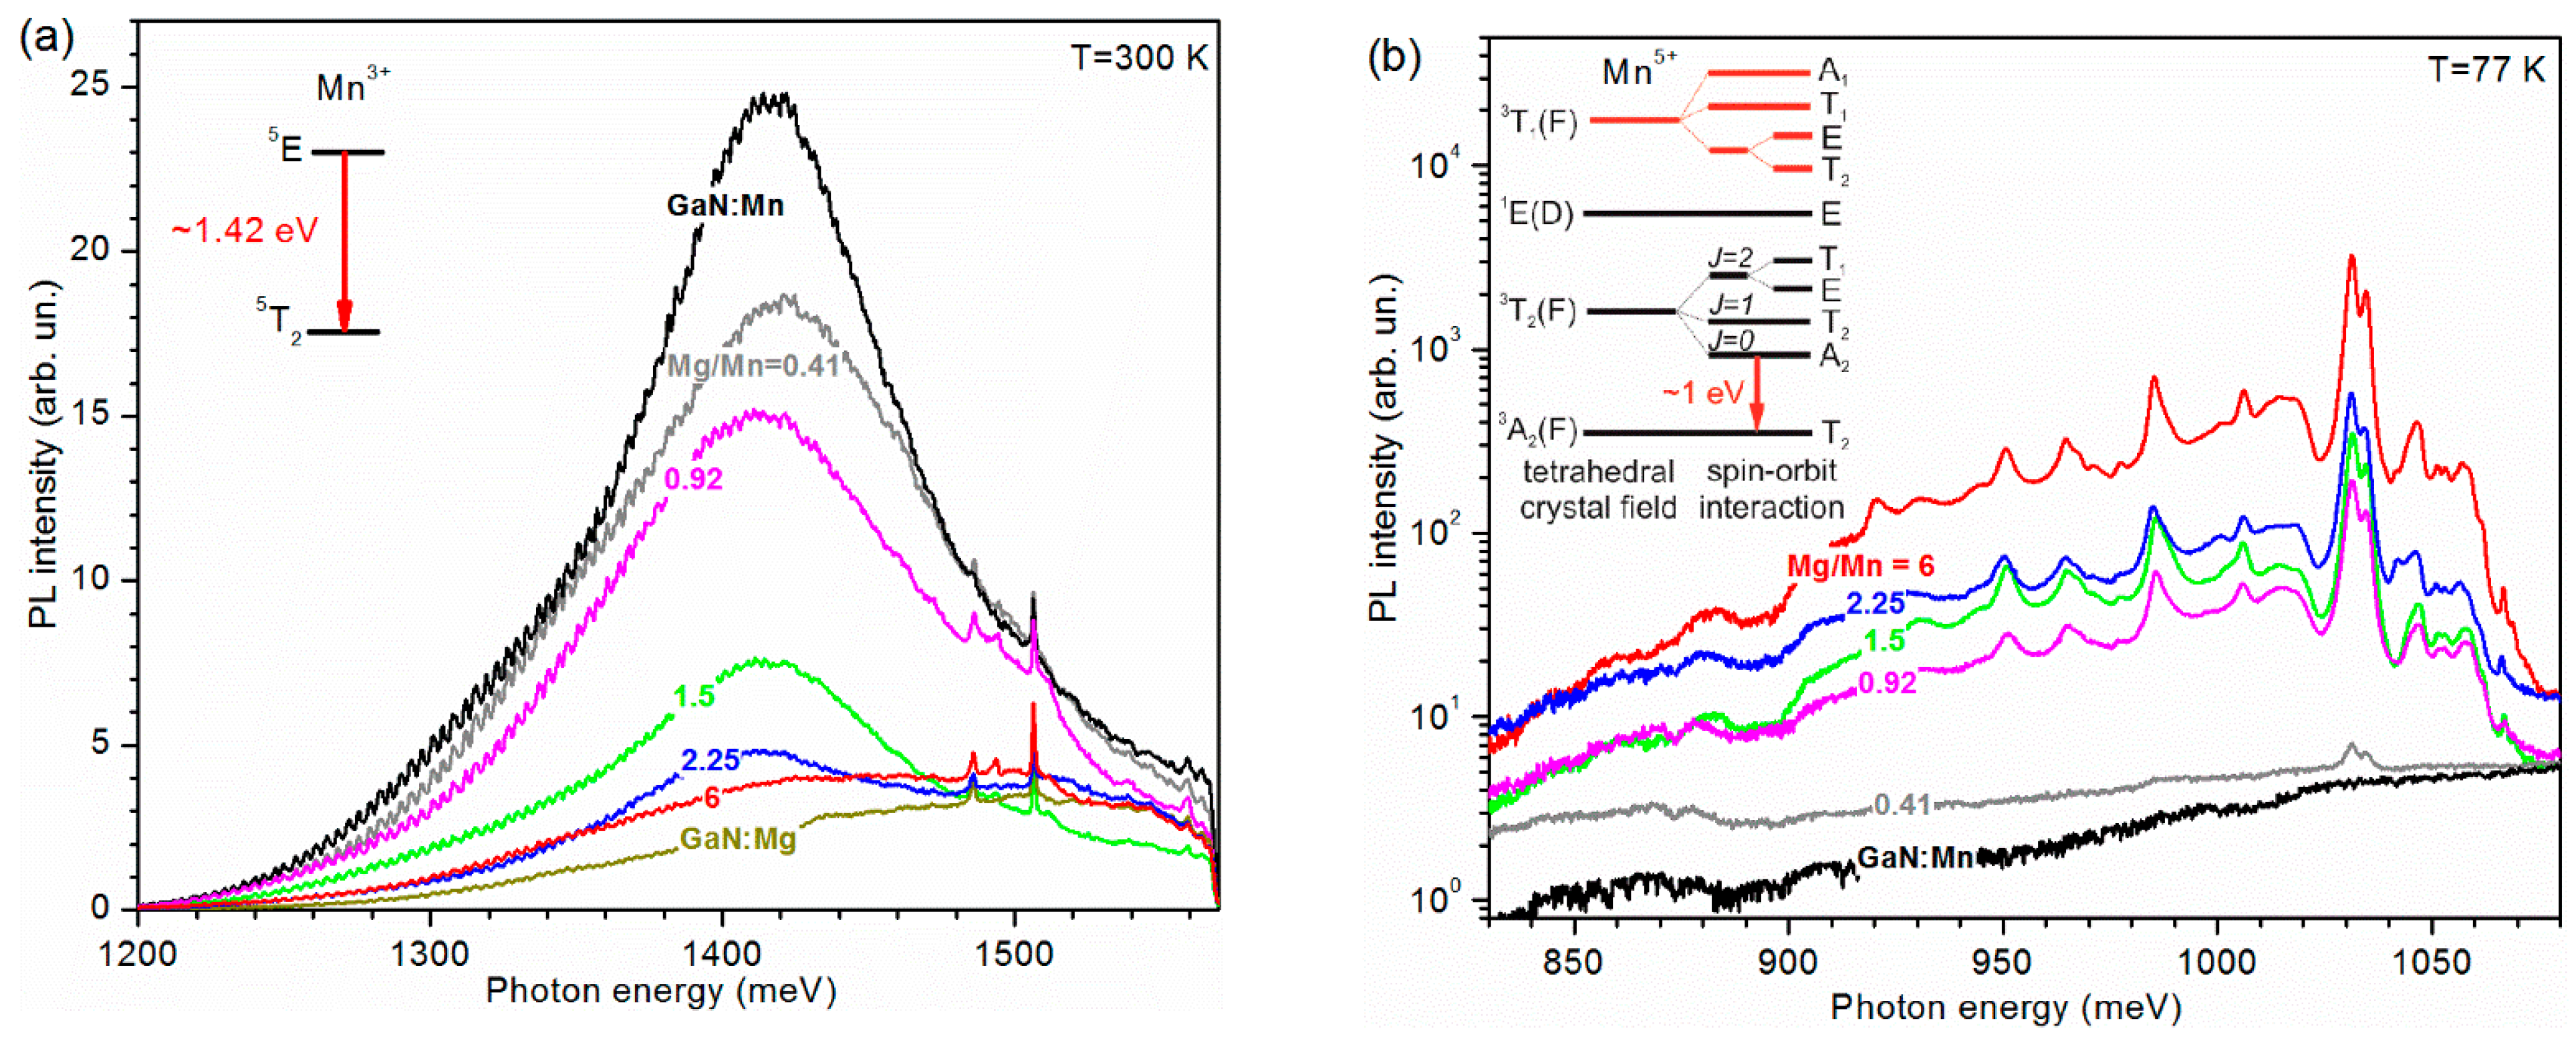
3.1. Raman Spectroscopy at Sub-Band Excitation

The Raman spectra from the studied GaN:Mn, GaN:Mg, and GaN:(Mn,Mg) samples at a sub-band excitation of 2.54 eV are shown in Figure 2a and are characteristic for GaN doped with Mn and/or Mg [8], where impurity-induced Raman features are detected in the region between the E 2 high and the A1(LO) modes of GaN at 569 cm−1 and 735 cm−1, respectively. Using an approach similar to the one employed in [8,9], the impurity-induced features found in GaN:Mn are denoted as (A,B,C,D,E). Band C is the most prominent feature related to Mn and scales with the Mn concentration, while bands (A,B,D,E) originate from disorder-induced scattering due to the activation of phonon DOS [9].
The (A,B,C,D,E) features are significantly affected by Mg co-doping in GaN:(Mn,Mg), and the two bands F and G emerge. In accordance with previous findings on GaN:(Mn,Mg) [8]: (1) the intensity of the Mn-induced bands (A,B,D,E) and—in a lesser pronounced way—of C quenches significantly upon Mg co-doping, while a broad peak G at 688 cm−1 appears; (2) the peak G at 688 cm−1 is a convolution of at least two peaks with maxima between 680 cm−1 and 695 cm−1 and its integrated intensity as a function of Mg/Mn correlates with the presence of Mn-Mg2 cation complexes, which have the lowest symmetry among the stable configurations, resulting in a maximum distortion of the Mn-N4 tetrahedron; (3) the blue-shift of the C band with increasing Mg/Mn ratio is compatible with the shortening of the Mn-N bond in the Mn-Mgk cation complexes [4,8]; (4) in the frame of the light impurity model, the phonon mode F at 650 cm−1 is attributed to the LVM of Mg. This mode is not active in GaN:Mg, due to the passivation of Mg by H and resulting in Mg-N-H complexes in as-grown MOVPE samples, while it is found in the co-doped samples, where the incorporation of H is hindered by the formation of the Mn-Mgk cation complexes [11].
The polarized Raman spectra of GaN:(Mn,Mg) shown in Figure 2b follow the behavior of the impurity-induced features in the parallel z ( y , y ) z ¯ polarization, while are absent in the crossed z ( x , y ) z ¯ polarization of light, similarly to the A1(LO) mode of GaN. This trend is analogous to the one found for the Mn-induced bands C in GaN:Mn (Figure 2c) with A1 symmetry [9]. The broad background collected in crossed polarization at ~730 cm−1 is a disorder-induced Raman mode due to the activation of the GaN phonon DOS, which is expected to appear in the Raman spectra independently of polarization [13].
The Raman analysis is performed at various excitation energies to gain a deeper insight into the nature of the impurity-induced Raman features in GaN:(Mn,Mg). The Mn-induced features of GaN:Mn show a resonant behavior as a function of the excitation energy with a maximum enhancement at 2.41 eV (Figure 3a). The effect is most prominent for band C at 670 cm−1. The observed behavior was explained through a resonance process involving electron transitions from the localized level of Mn2+ to the conduction band and its subsequent recombination with Mn3+ with the emission of LO phonons [9,19]. The response was found to be significantly different for GaN:(Mn,Mg) and to vary with the ratio Mg/Mn (Figure 3b–f). The relative intensity of the impurity-induced features at the excitation of 1.58 eV gradually increases with Mg/Mn, while their intensity is quenched and the line-shape is also affected at an excitation of 2.41 eV. The vanishing of the Mn-Mg-induced vibrational features (F,C,G) upon increasing the excitation energy up to 3.82 eV is related to the deviation of the excitation from the resonance conditions. While the inter-band excitation at 3.82 eV is in resonance with the band-gap of GaN and induces a significant resonance Raman enhancement of the A1(LO) phonon of the GaN matrix, it is not resonant with the charge transfer level of the Mn impurity and does not affect the Mn-Mg-induced vibrational features. This is in agreement with the previous findings by Gebicki et al. [9] for GaN:Mn, where the Mn-induced feature C is reported to reach a maximum of intensity at 2.4 eV, in resonance with the charge transfer level of Mn impurity, gradually weakening with the excitation energy, when moving away from the resonance, and fully vanishing at 3.0 eV.
The impurity-induced feature C is the main Raman resonance related to Mn. The intensity of this feature scales with the Mn concentration [8], thus in order to analyze its dependence on the excitation energy, as well as to compare the response of samples with different Mg/Mn ratios and Mn concentrations, its relative intensity with respect to the A1(LO) mode of GaN is normalized to the corresponding intensity at the non-resonant excitation of 2.54 eV (Figure 4).
The intensity of the Mn-induced mode C in GaN:Mn is the highest for an excitation energy of 2.41 eV, as evidenced in Figure 4. This resonance gradually weakens with increasing Mg/Mn ratio in the Mg co-doped samples, while a resonance at 1.58 eV is detected.
A detailed analysis of the Raman spectra at 1.58 eV suggests that the Mn-induced band C results from the convolution of two distinct components, denoted as C1 and C2 in Figure 5a. The relative intensity of these two contributions gradually changes upon varying the Mg/Mn ratio (Figure 5b), while their frequency gradually increases for k ≥ 2.25 and then decreases for k = 6.6, similarly to the A1(LO) mode of GaN (Figure 5c), but with an enhanced shift of the C2 component. This frequency shift cannot be assigned to the effect of elastic strains solely, since the non-polar E 2 high mode, influenced by in-plain strain more significantly than the polar A1(LO) mode [20], shows here a weak frequency dependence on the Mg/Mn ratio. The band at (720–750) cm−1 is a convolution of several phonon peaks with different origin: (i) a wide feature E, which—according to Gebicki et al. [9]—is related to disorder-induced scattering due to the activation of the phonon DOS; (ii) the A1(LO) mode of GaN; (iii) a weak peak at 750 cm−1 originating from the sapphire substrate (the Raman spectrum of a reference bare sapphire substrate is shown in Figure 2a). The A1(LO) mode is a single peak independent of the Mg/Mn ratio. The broad feature E does not show a significant dependence on the Mg/Mn ratio and gradually increases in intensity with the Mn content in the Mg co-doped samples, in [9] responding to local lattice disorder, which allows the observation of the phonon DOS.
The detected gradual increase in the relative intensity of the C2 mode with the Mg/Mn ratio (Figure 5b) in general correlates with the increase of concentration of Mn-Mgk complexes, in particular of Mn-Mg2 and Mn-Mg3 complexes in GaN:(Mn,Mg) samples [4]. According to [8], the peak position of the C2 mode corresponds to the Mn-Mg2 and Mn-Mg3 complexes and correlates with their high Raman activity (the most significant contribution to Raman spectra). This is also in agreement with the population of different complexes, as calculated in [4]. Thus, the C2 component can be ascribed to Mn-Mg2 and Mn-Mg3 complexes, while C1 to the Mn-Mg1 ones. The frequency of the C2 component, higher than that of C1, qualitatively agrees with the shortening of the Mn-N bond length in the presence of Mg [4].
The observed resonant behavior of the Mn-induced mode in GaN:(Mn,Mg) can be treated in the frame of a resonance Raman process similar to the one acting in GaN:Mn [9] and related to the charge transfer level of the Mn impurity, but additionally taking into account the changes in the Mn charge state due to the co-doping with Mg [4]. In GaN:Mn, Mn is mostly present in the neutral Mn3+ state with the Mn3+/2+ acceptor level pinned at 1.8 eV above the valance band maximum of GaN, and the corresponding optical absorption resulting in the photoionization of neutral Mn [21]. However, in the co-doped samples, the presence of Mg alters the charge state of Mn, which is then found in the Mn5+ state [22]. Specifically, as reported in [23], the photoluminescence excitation (PLE) spectra of GaN:(Mn,Mg) show a broad band with an edge at 1.1 eV, assigned to electron excitation from the valence band of GaN to the Mn4+ level located at 1.1 eV above the top of the valance band. The broad band in the PLE spectra is caused by the presence of an absorption band, pointing at both hole photoionization and recombination. Therefore, considering the energy position of the Mn charge transfer level and applying the model proposed in [1], the enhancement of the Mn-induced Raman features in GaN:(Mn,Mg) at 1.58 eV is explained using impurity-induced one-LO-phonon resonance Raman scattering involving photoionization of a hole from the Mn donor level to the valence band and its subsequent recombination with ionized Mn4+ donors and with the emission of LO phonons.
In the case of Mn5+ ions (i.e., Mn-Mg3 complexes) [22] the process of hole recombination after generation is hampered due to the positive charge state of Mn4+ with respect to the lattice. Therefore, the process results in a change of charge state from Mn5+ into Mn4+, rather than in the capture of a hole by Mn4+.
To probe the electron energy structure of the Mn impurity and to study the nature of the observed non-trivial enhancement of the Mn-induced phonon modes under sub-band excitation, PL spectroscopy was performed. The investigated GaN:(Mn,Mg) samples revealed two PL peaks at ~1.42 eV (Figure 6a) and at ~1.05 eV (Figure 6b), respectively, with intensities which depend on the Mg/Mn ratio. The feature at ~1.42 eV is attributed to the 5T2-5E intra-center transition of Mn3+ [24]. This PL line is most intense for GaN:Mn, and it gradually quenches with increasing Mg content (increase of the Mg/Mn ratio). The elusive intra-center photoluminescence of Mn3+ [21,24] is captured here, due to the specific resonant conditions of optical excitation close to the 5T2-5E transition of Mn3+. The PL peak at ~1.05 eV in GaN:Mn co-doped with Mg was shown to be related to internal transitions of the Mn5+ ion predominantly in the Mn-Mg3 configuration [22].
Considering the energy position of the Mn charge transfer level, which in GaN:(Mn,Mg) is found to lie 1.1 eV above the top of the valence band of GaN, and applying the model proposed in [9], the enhancement of the Mn-induced Raman features in GaN:(Mn,Mg) at 1.58 eV is explained by impurity-induced one-LO-phonon resonance Raman scattering involving photoionization of a hole from the donor level of Mn to the valence band and its subsequent recombination with an ionized Mn5+ donor and with the emission of LO phonons. This impurity-induced resonance Raman process is efficient, due to the presence of the Mn-Mgk cation complexes, favoring the energy transfer between a shallow MgGa acceptor state and the Mn center, the capturing of the excited hole by the Mg acceptor, and its following transfer to the Mn center. The detected wide resonance energy profile of the Raman mechanism is also a fingerprint of the resonance process between the localized energy level and the band states.

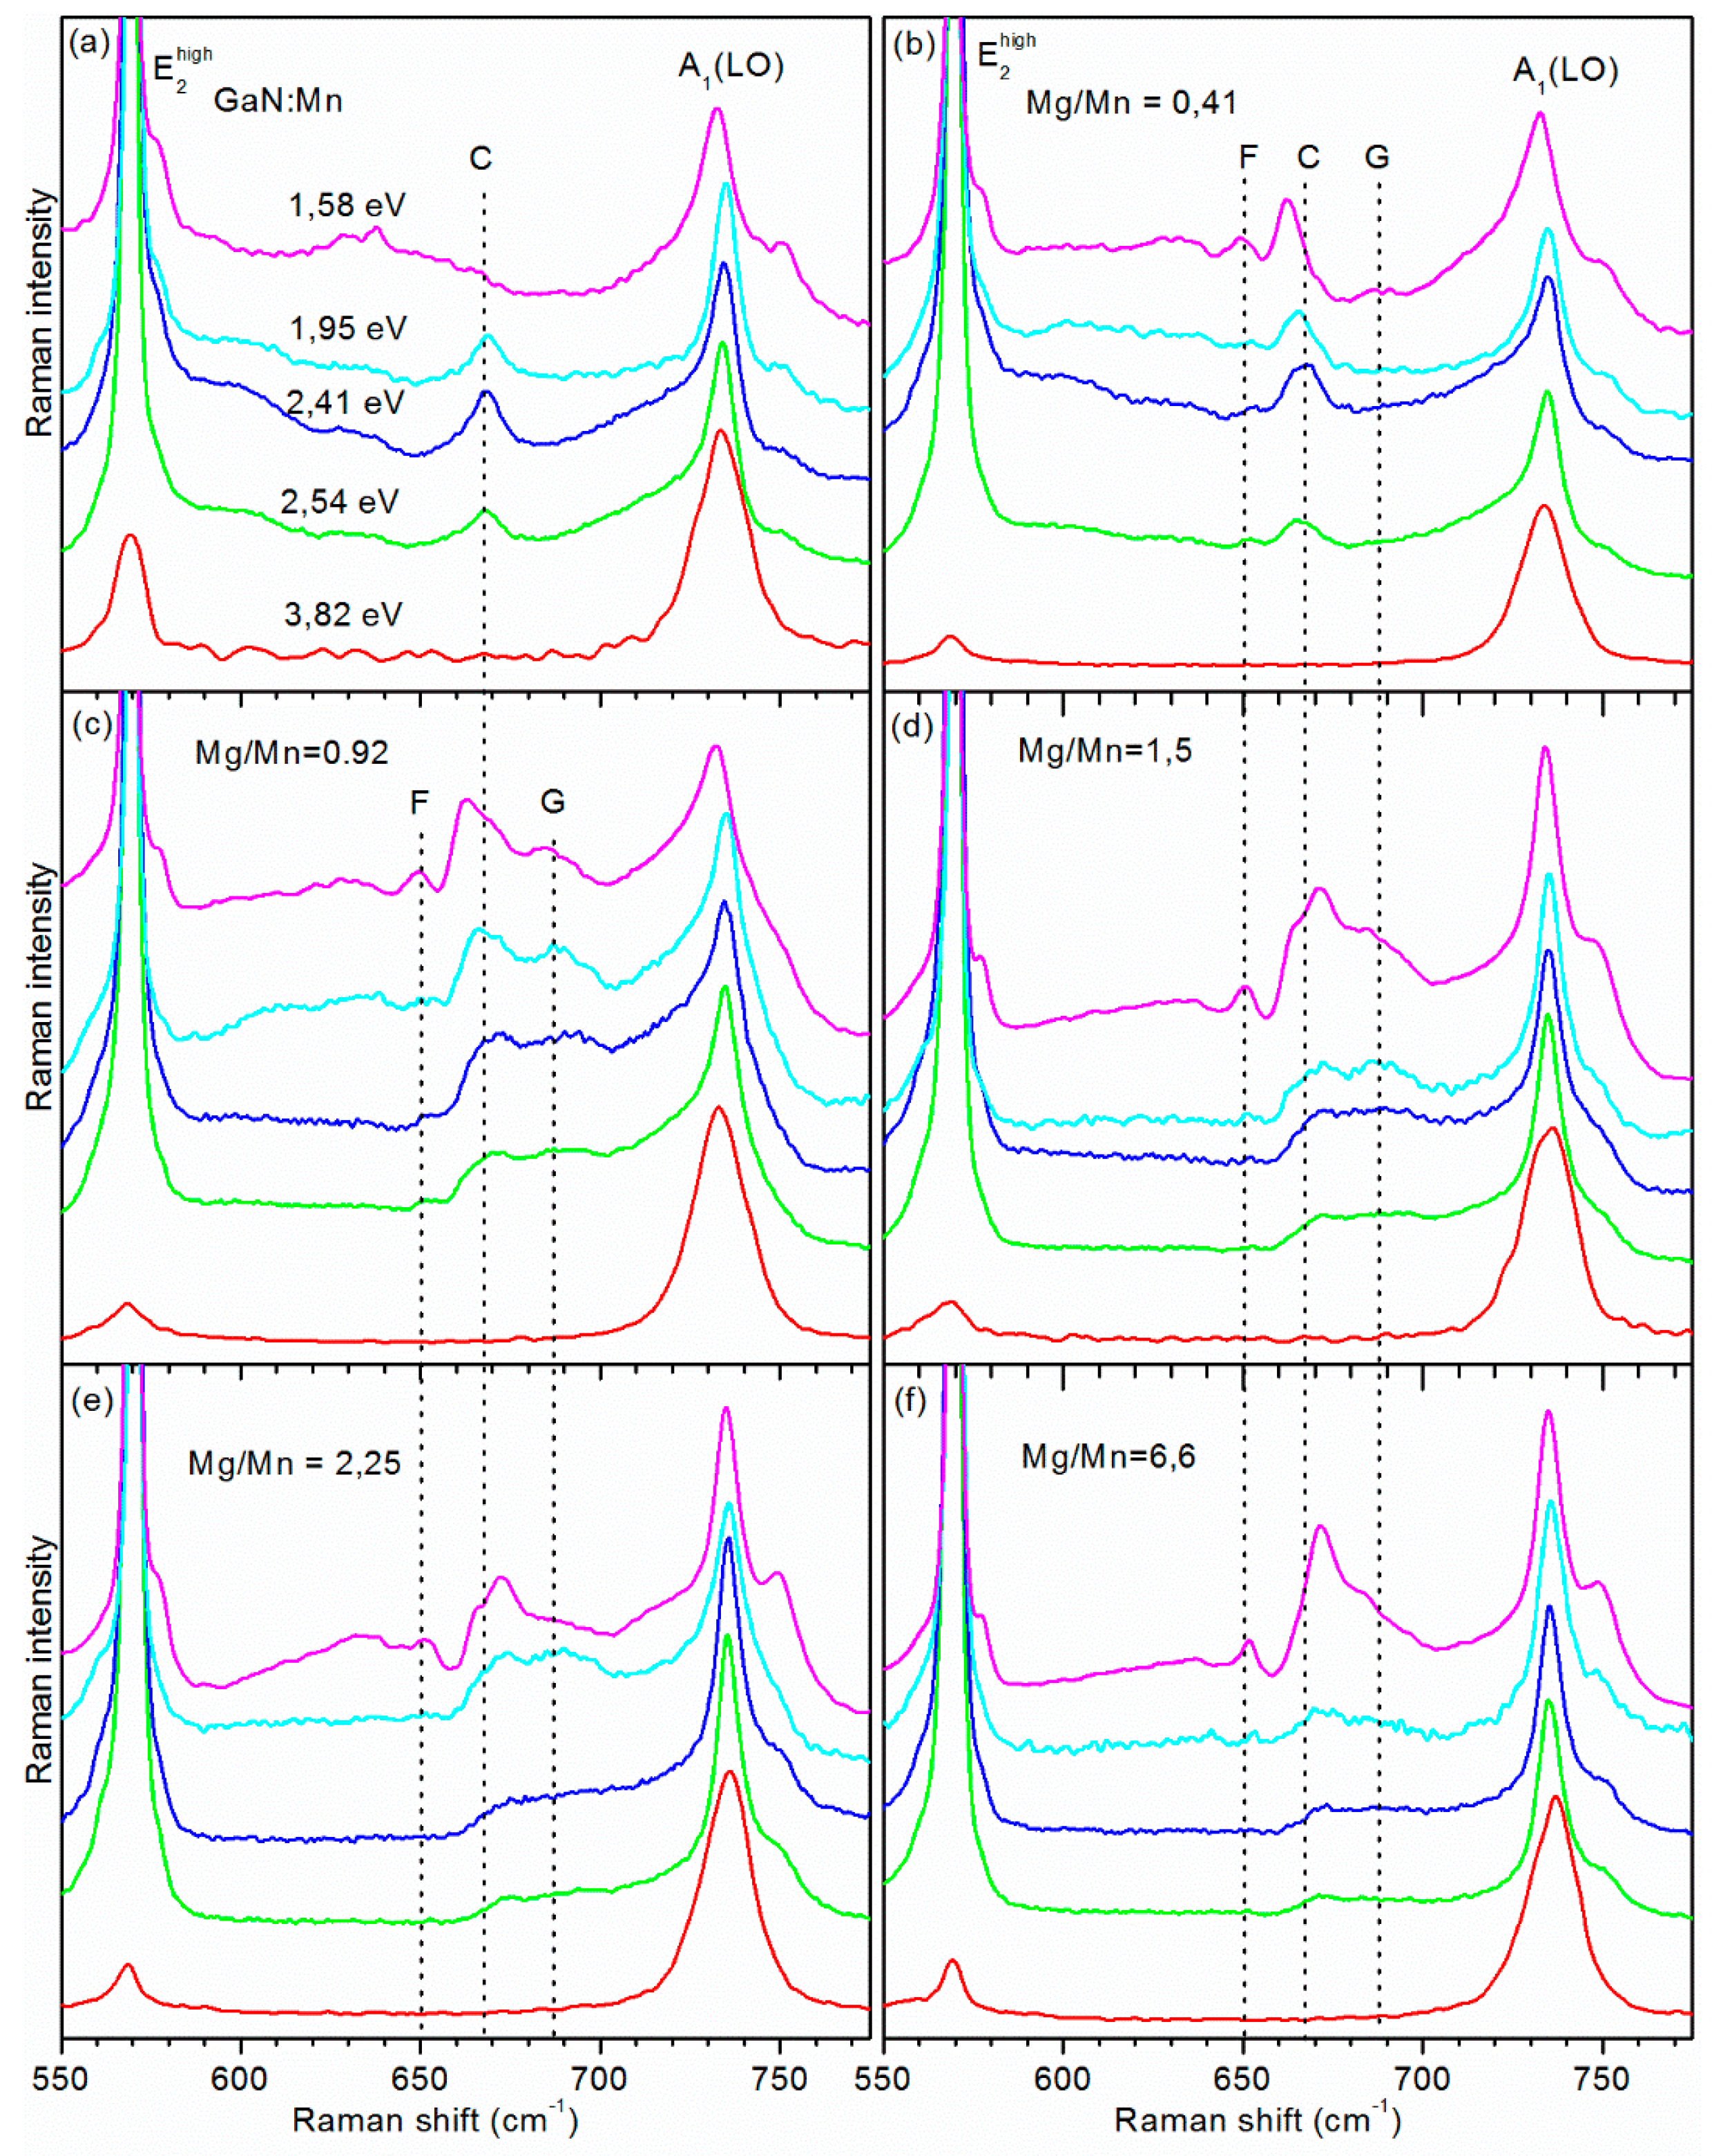
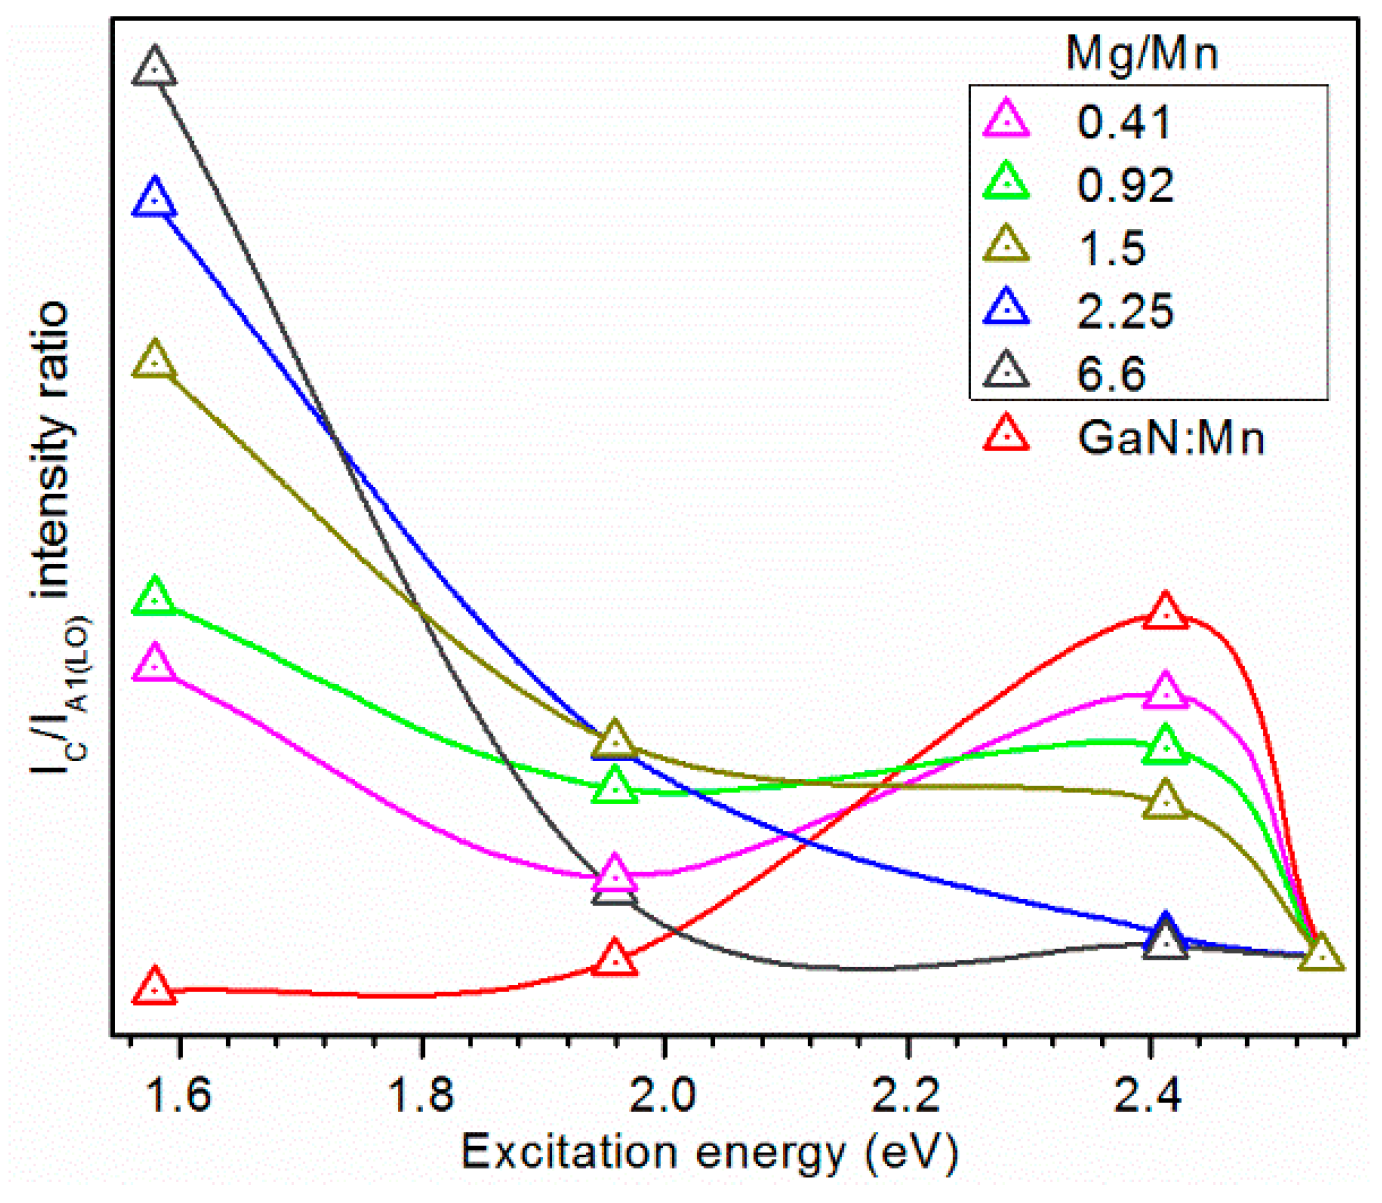
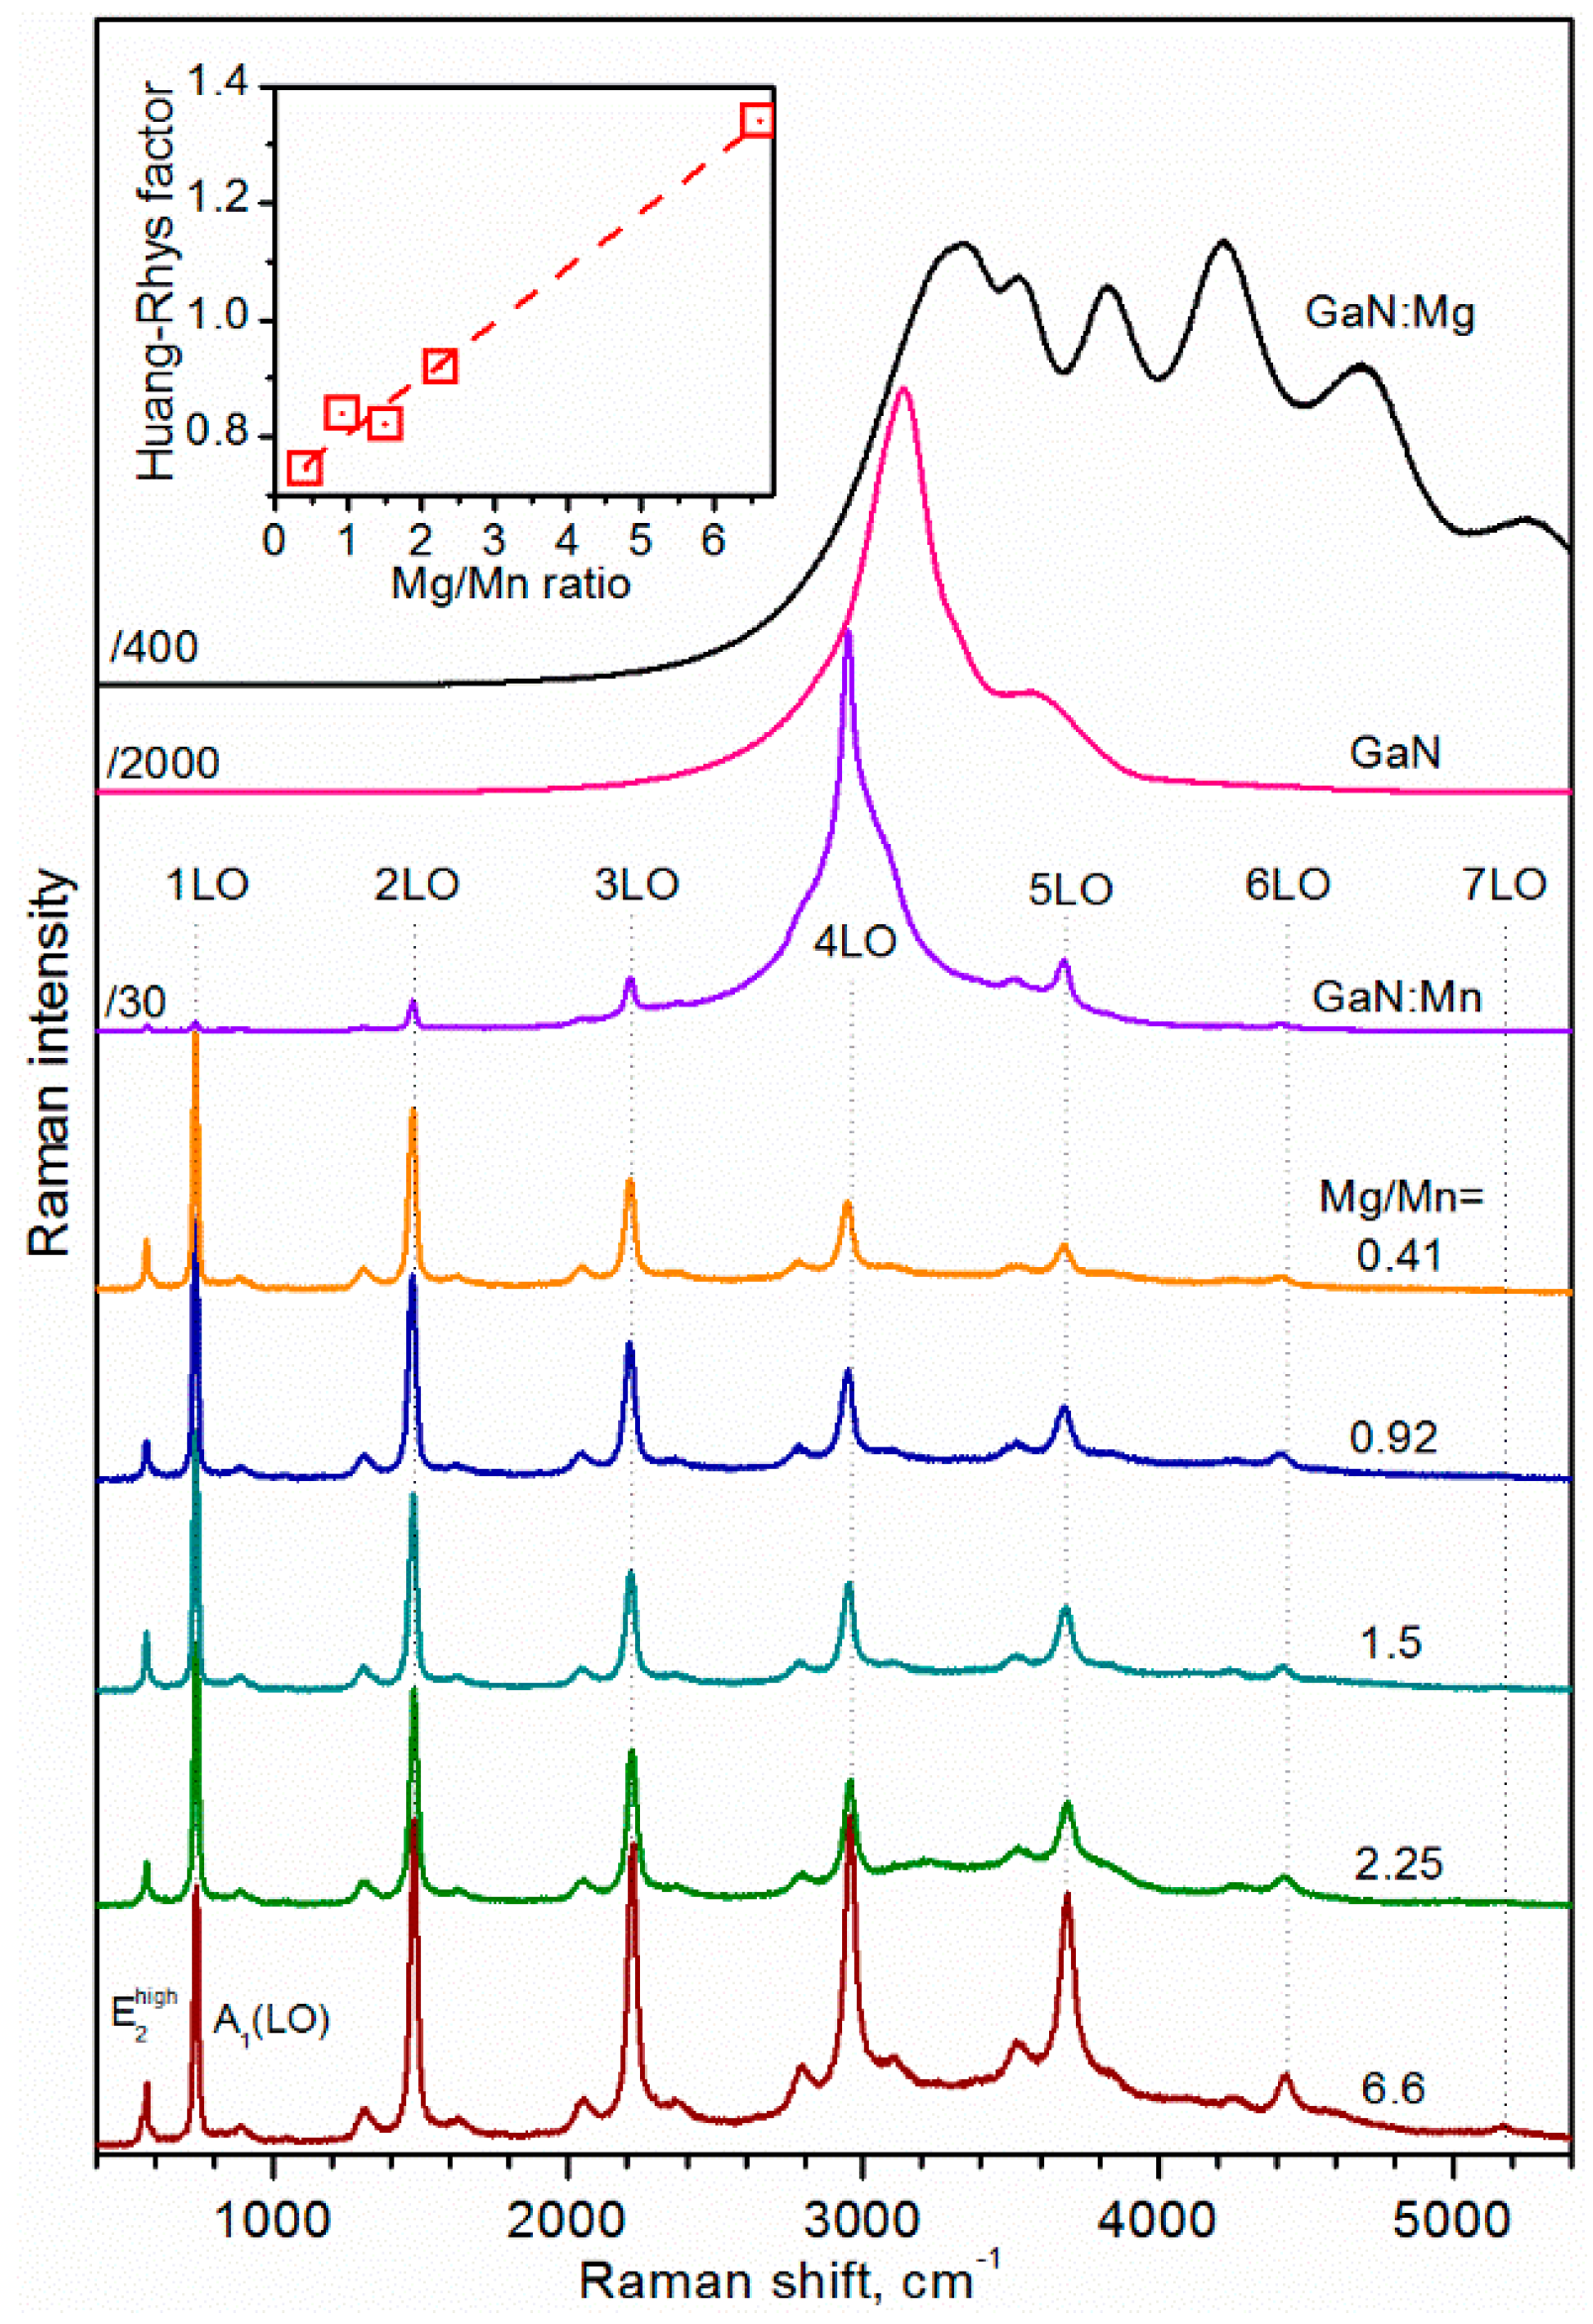
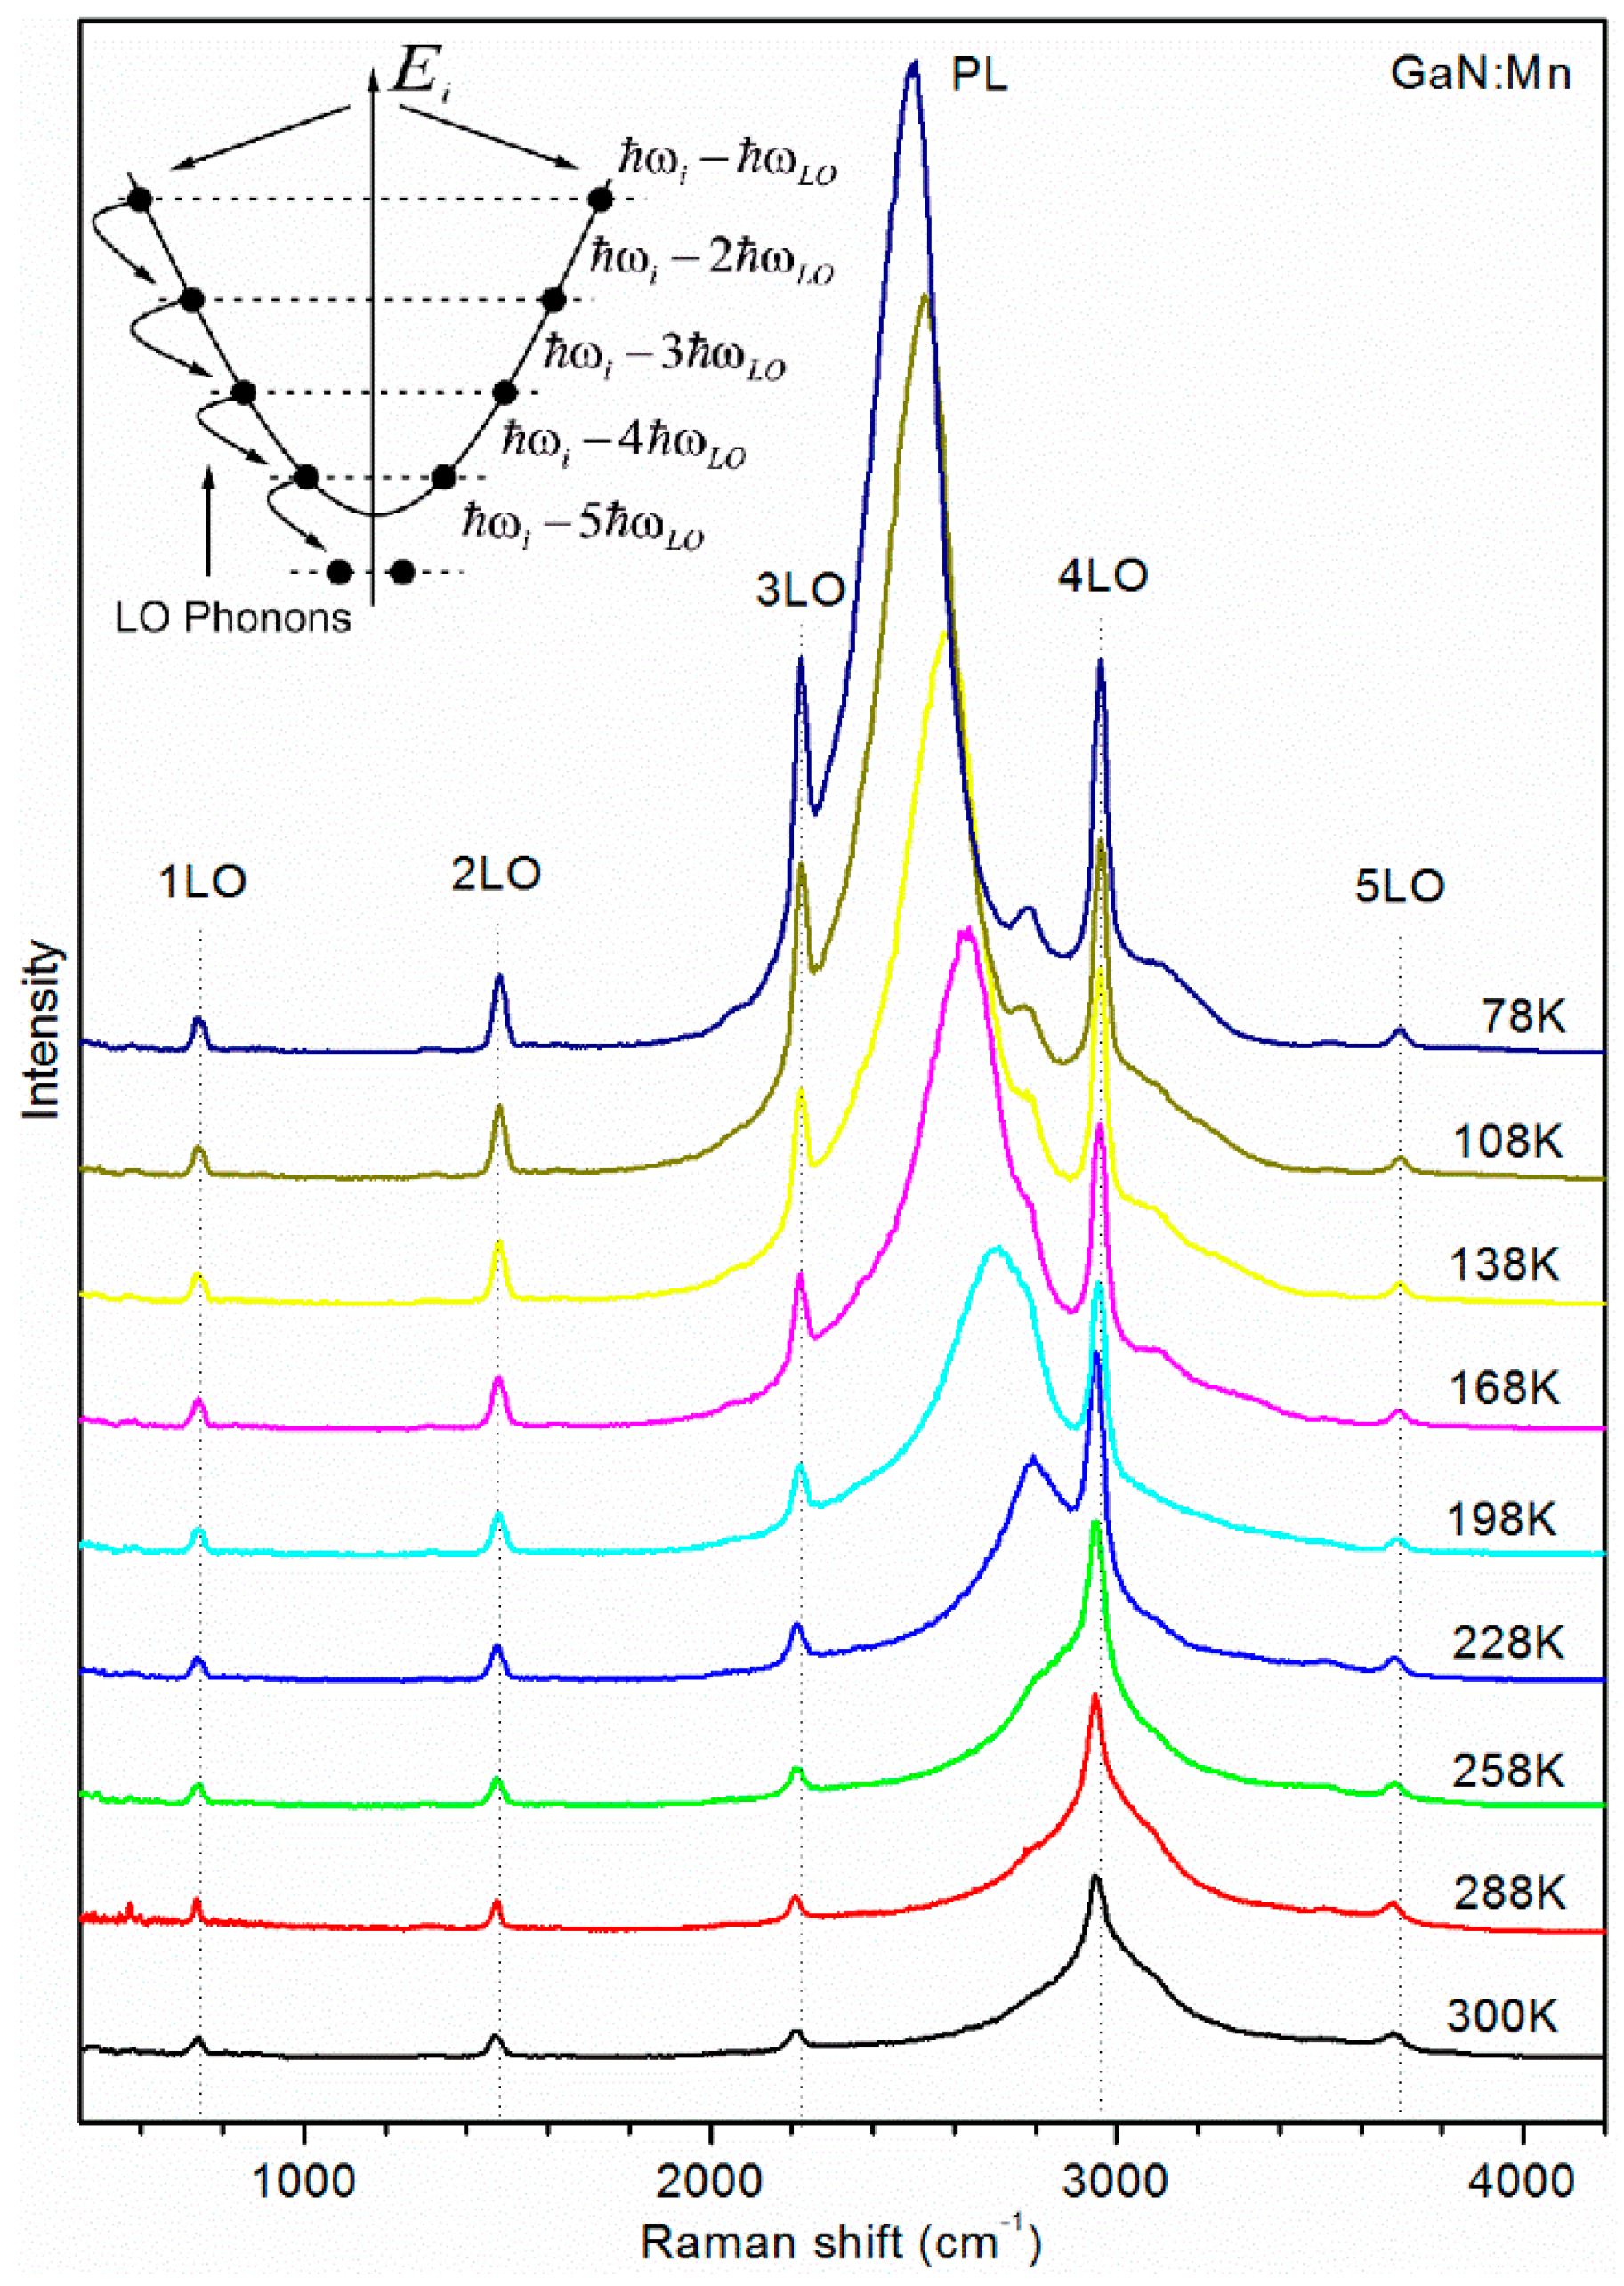
3.2. Raman Spectroscopy at Inter-Band Excitation

The resonance Raman spectra for the GaN:(Mn,Mg) samples excited by an inter-band excitation of 3.82 eV are shown in Figure 7. The inter-band luminescence collected from the Mg-doped and undoped GaN significantly drops in intensity in the case of the Mn-doped samples, whereas multiphonon Raman scattering is detected. The first-order E 2 high and A1(LO) phonon peaks of GaN are well-resolved at 571 cm−1 and 735 cm−1, respectively, and a strong resonance Raman scattering of the A1(LO) phonon is observed up to the seventh order. For excitation energies greater than the bandgap of GaN, the observed process is related to outgoing resonant Raman scattering (ORRS).
The intensity ratio between the overtone 2LO and the fundamental 1LO Raman bands makes it possible to evaluate the Huang-Rhys parameter S, which provides a measure of the strength of the electron-phonon interaction [25]. Specifically:
| I 2 L O I 1 L O | = S 2 ( E e x + ω L O ω 0 ) 2 + Γ 2 ( E e x + 2 ω L O ω 0 ) 2 + Γ 2 ,
where the exciton energy Eex is the difference between the energy bandgap Eg of GaN,—which depends on the Mn concentration [26]—and the exciton binding energy; Γ is the excitonic linewidth.
The dependence of the Huang-Rhys parameter S on the Mg/Mn ratio—estimated from the resonance Raman spectra in Figure 7—for the investigated GaN:(Mn,Mg) samples is shown in the inset to Figure 7. The Huang-Rhys parameter has a linear dependence on the Mg/Mn ratio, which points at an increment of the electron-phonon coupling strength. This result is consistent with theoretical ab initio calculations of spin density, which showed that complexing of Mn with one Mg tends to delocalize the spin density on the nitrogen atoms, while complexing with two or more Mg reduces the delocalization, thus enhancing the electron-phonon coupling [4].
The intensity of the multiphonon scattering is significantly dependent on the resonance condition of the ORRS process. The n-order LO-phonon peak increases in intensity up to the fourth order for GaN:Mn, where the 4LO peak is one order of magnitude higher than the 1LO. In contrast, for GaN:(Mn,Mg) this dependence is less pronounced and is superimposed to the general tendency of scattering peaks to decrease in intensity with the order n at a rate which depends on the Mg/Mn ratio.
The mechanism of ORRS acting here is pictured in the frame of the cascade model for exciton-mediated multiphonon resonant Raman scattering [27,28,29], whose schematic representation is shown in the inset to Figure 8. In this model the resonance features in the ORRS spectra are seen in the framework of a hot exciton cascade, and the scattering process is decomposed into sequential steps. In the first step, the incident photon (Eex = 3.185 eV) is absorbed, an exciton is generated, and subsequently a LO phonon is emitted. In the second step, the exciton relaxes into lower energy states with the emission of LO phonons in a cascade process. In the third step, the exciton recombines radiatively, with the emission of a scattered photon ( ω s ω 0 n ω L O ). Thus, the closer the exciton energy Eex and the difference between the excitation energy and n-order phonon mode are, the stronger the phonon mode is.
The behavior of multi-phonon Raman scattering, which is governed by the resonance with the band gap, can be tuned with temperature. The resonance Raman spectra of GaN:Mn at various temperatures in the range (78–300) K are shown in Figure 8. Besides causing a high-energy shift of the near-band edge (NBE) PL, the reduction of the temperature results in an enhancement of the multi-LO-phonon scattering, especially noticeable for the third and fourth order phonon scattering.
In the case of GaN:Mn the position of the NBE 3.511 eV PL peak at 77 K is about 30 meV lower than the position of the 3LO phonon peak and about 60 meV higher than the position of the 4LO peak. Considering the dependence of the (Ga1−xMnx)N band gap on the Mn concentration, i.e., Δ E g = x ( 27.4 ± 2.6 ) meV / % ( 0.89 ± 1.13 ) meV [22], the GaN band gap E g GaN = 3.507 eV at 77K, and the exciton binding energy of E x A = 20.4 meV [30], the observed NBE PL is assigned to the recombination of free excitons in GaN:Mn. The observed high-energy shift of the excitonic PL peak at low temperatures (low-frequency Raman shift in Figure 8) is due to the temperature-induced widening of the band gap of GaN:Mn [31]. This effect is well described by the Varshni empirical formula and is consistent with the temperature dependence of the band-gap of pristine GaN [32]. The increase of temperature leads to the shift of the NBE PL to lower energies, due to the decrease in band gap energy, according to the Varshni empirical equation E g ( T ) = E g ( 0 ) α T 2 / ( β + T ) [27], where α = 8.32 × 10 4   eV / K and β = 835.6   K . The increase in energy difference between the 3LO peak and the exciton energy at the OMRRS conditions leads to the gradual weakening of this phonon mode with temperature (Figure 9a). For sample temperatures >200 K, the 4LO phonon mode undergoes a significant enhancement in intensity due to the proximity to the ORRS conditions, with a maximum enhancement at ~260 K.
The multi-phonon Raman scattering in GaN:(Mn,Mg) has shown a reduced dependence of the intensity of the 3LO and 4LO peaks on temperature, with significantly lower I3LO/I2LO and I4LO/I3LO relative intensities than those found for GaN:Mn (Figure 9b–f). The maxima in the temperature dependence of the I4LO/I3LO are less pronounced and shifted to lower temperature as compared to GaN:Mn. In particular, the maximum enhancement of the 4LO peak for GaN:(Mn,Mg) with Mg/Mn = 2.25 is observed at ~170 K, whereas its relative intensity I4LO/I3LO is over 10 times lower than that of GaN:Mn (Figure 9e). Within the ORRS conditions, the measured shift of the maximum intensity of the 4LO peak to lower temperatures is related to the interplay between the reduction in the bandgap of (Ga1−xMnx)N due to the lower Mn content in GaN:(Mn,Mg) and the temperature-induced widening of the bandgap. The lower intensity of the multiphonon peaks and the weaker resonant enhancement is related to the broadening of the band edges due to potential fluctuations induced by the high concentration of dopants [33]. The potential fluctuations which arise due to the inhomogeneous distribution of charged defects play a significant role in the optical properties of compensated or highly doped semiconductors. The broadening of the impurity bands in heavily doped semiconductors due to potential fluctuation can be described in the frame of the model proposed by Morgan et al. [34], which was successfully used to account for the broadening of NBE PL lines in GaN doped by Si [35]. On the other hand, a serious breakdown of the wave-vector conservation may occur in heavily doped semiconductors, due to scattering by random impurities. The relaxation of the quasi-momentum conservation allows phonons with larger wave-vectors to participate in the Raman scattering, thus enhancing the intraband Fröhlich contribution and increasing the corresponding scattering cross section [33]. The correlation between the smearing of the band edges due to potential fluctuations and the mechanisms of resonant Raman scattering determines the temperature dependence of the multi-phonon LO peaks in the resonant Raman spectra. In addition, Mn-Mgk cation complexes and defects can affect the ORRS enhancement through the inter-band Fröhlich mechanism and via exciton–impurity interaction [27,28,29,36,37].

4. Conclusions

Resonance Raman studies at room temperature of GaN:(Mn,Mg) have shown that in contrast to the case of GaN:Mn, the resonance enhancement of the Mn-induced modes in Mg co-doped samples is not observed at an excitation of 2.4 eV, but shifts to lower energies. This effect is explained by the resonance Raman process of photoionization of a hole from the donor level of Mn to the valence band of GaN, followed by the recombination with an ionized Mn5+ donor with the emission of LO phonons. Selective excitation within the resonance Raman conditions allows the structure of the main Mn-induced phonon band at ~670 cm−1 to be resolved into two distinct components, whose relative intensity varies with the Mg/Mn ratio, and can thus be related to the different Mn-Mgk cation complexes. The enhancement of the Huang-Rhys factor at large Mg/Mn ratios reflects the increase of coupling strength of the electron-phonon interaction, in agreement with theoretical predictions. The selective enhancement of the 4LO phonon peak upon temperature reduction is due to the variation in resonance conditions of ORRS by detuning the band gap. The observed ORRS is explained via exciton-mediated multi-phonon Raman scattering and strong impurity-induced Fröhlich interaction. These findings contribute to the understanding of the vibrational properties and electron-phonon coupling of GaN:(Mn,Mg) with Mn-Mgk cation complexes, relevant to gain insight into electron-phonon relaxation mechanisms, charge transport in this system [38,39,40], and their effect on the efficiency of prospective full-nitride IR emitters [22] and optically active and tunable spintronic devices [4,41].

Author Contributions

Conceptualization, A.N., V.S., D.K., and A.B.; investigation A.N., B.T., and G.C.; formal analysis, A.N. and B.T.; funding acquisition, V.S. and A.B.; writing—original draft, A.N. and B.T.; writing—review and editing, D.K. and A.B.

Funding

This work was supported by NATO SfP Grant 984735, by the State Fund for Fundamental Research project F83/72, and by the Austrian Science Foundation—FWF P26830 and P31423.

Acknowledgments

A. Nikolenko acknowledges Olena Fesenko for Raman measurements at 632 nm, Oleksii Ilchenko for Raman measurements at 785 nm, Nadiia Korsunska and Roland Hayn for fruitful discussions.

Conflicts of Interest

The authors declare no conflict of interest.

References

  1. Passow, T.; Gutt, R.; Kunzer, M.; Pletschen, W.; Kirste, L.; Forghani, K.; Scholz, F.; Köhler, K.; Wagner, J. High Power Efficiency AlGaN-Based Ultraviolet Light-Emitting Diodes. Jpn. J. Appl. Phys. 2013, 52, 08JG16. [Google Scholar] [CrossRef]
  2. Yoshida, H.; Yamashita, Y.; Kuwabara, M.; Kan, H. A 342-nm ultraviolet AlGaN multiple-quantum-well laser diode. Nat. Photonics 2008, 2, 551–554. [Google Scholar] [CrossRef]
  3. Amano, H.; Baines, Y.; Beam, E.; Borga, M.; Bouchet, T.; Chalker, P.R.; Charles, M.; Chen, K.J.; Chowdhury, N.; Chu, R.; et al. The 2018 GaN power electronics roadmap. J. Phys. D. Appl. Phys. 2018, 51, 163001. [Google Scholar] [CrossRef] [Green Version]
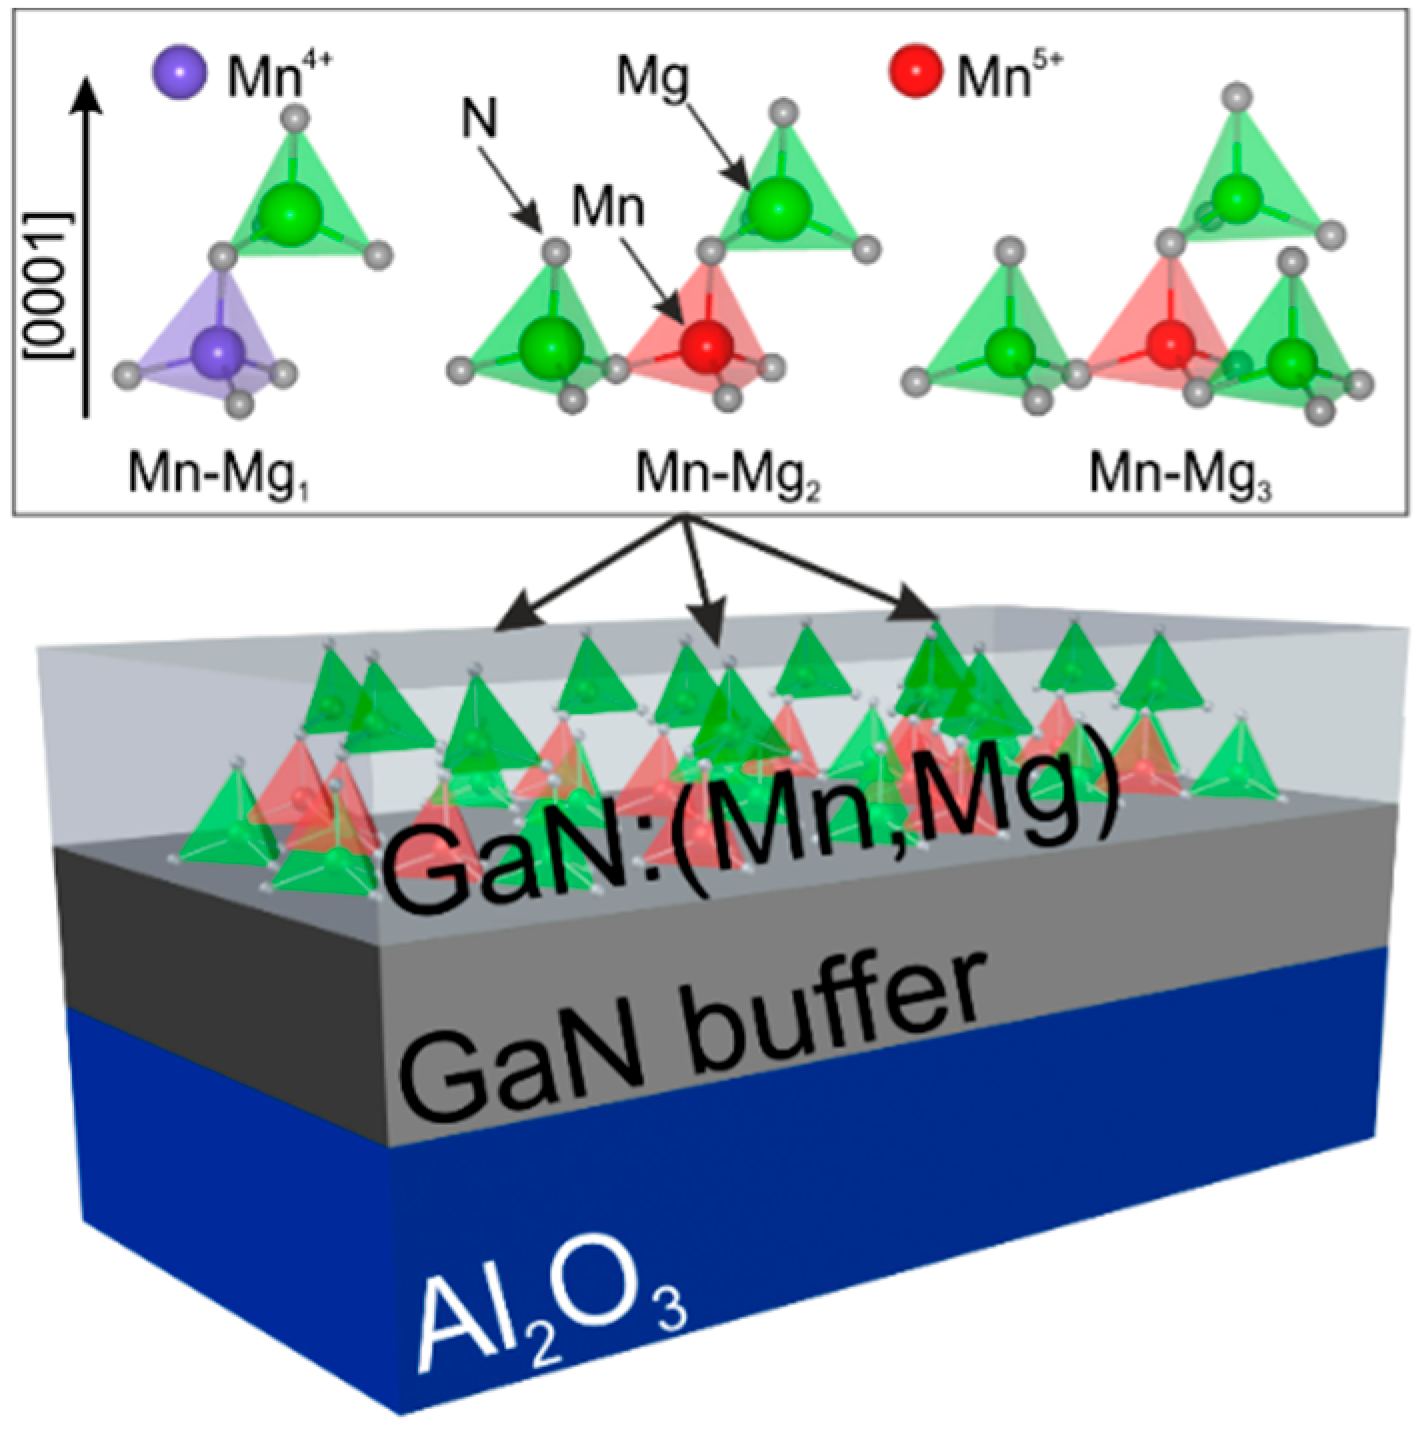
  4. Devillers, T.; Rovezzi, M.; Szwacki, N.G.; Dobkowska, S.; Stefanowicz, W.; Sztenkiel, D.; Grois, A.; Suffczyński, J.; Navarro-Quezada, A.; Faina, B.; et al. Manipulating Mn–Mgk cation complexes to control the charge- and spin-state of Mn in GaN. Sci. Rep. 2012, 2, 722. [Google Scholar] [CrossRef] [PubMed]
  5. Capuzzo, G.; Kysylychyn, D.; Adhikari, R.; Li, T.; Faina, B.; Tarazaga Martín-Luengo, A.; Bonanni, A. All-nitride AlxGa1−xN:Mn/GaN distributed Bragg reflectors for the near-infrared. Sci. Rep. 2017, 7, 42697. [Google Scholar] [CrossRef] [PubMed]
  6. Wagner, J. Raman spectroscopy for impurity characterization in III-V semiconductors. Appl. Surf. Sci. 1991, 50, 79–86. [Google Scholar] [CrossRef]
  7. Semiconductor Research; Patane, A.; Balkan, N. (Eds.) Springer Series in Materials Science; Springer: Berlin/Heidelberg, Germany, 2012; Volume 150, ISBN 978-3-642-23350-0. [Google Scholar] [CrossRef]
  8. Devillers, T.; Leite, D.M.G.; Dias da Silva, J.H.; Bonanni, A. Functional Mn–Mgk cation complexes in GaN featured by Raman spectroscopy. Appl. Phys. Lett. 2013, 103, 211909. [Google Scholar] [CrossRef]
  9. Gebicki, W.; Dominik, P.; Podsiadlo, S. Lattice dynamics and Raman scattering from GaN:Mn crystals. Phys. Rev. B 2008, 77, 245213. [Google Scholar] [CrossRef]
  10. Kaschner, A.; Siegle, H.; Kaczmarczyk, G.; Strassburg, M.; Hoffmann, A.; Thomsen, C.; Birkle, U.; Einfeldt, S.; Hommel, D. Local vibrational modes in Mg-doped GaN grown by molecular beam epitaxy. Appl. Phys. Lett. 1999, 74, 3281–3283. [Google Scholar] [CrossRef]
  11. Harima, H.; Inoue, T.; Nakashima, S.; Ishida, M.; Taneya, M. Local vibrational modes as a probe of activation process in p-type GaN. Appl. Phys. Lett. 1999, 75, 1383–1385. [Google Scholar] [CrossRef]
  12. Limmer, W.; Ritter, W.; Sauer, R.; Mensching, B.; Liu, C.; Rauschenbach, B. Raman scattering in ion-implanted GaN. Appl. Phys. Lett. 1998, 72, 2589–2591. [Google Scholar] [CrossRef]
  13. Hasuike, N.; Fukumura, H.; Harima, H.; Kisoda, K.; Hashimoto, M.; Zhou, Y.K.; Asahi, H. Optical studies on GaN-based spintronics materials. J. Physics-Condensed Matter 2004, 16, S5811–S5814. [Google Scholar] [CrossRef]
  14. Bonanni, A.; Sawicki, M.; Devillers, T.; Stefanowicz, W.; Faina, B.; Li, T.; Winkler, T.E.; Sztenkiel, D.; Navarro-Quezada, A.; Rovezzi, M.; et al. Experimental probing of exchange interactions between localized spins in the dilute magnetic insulator (Ga,Mn)N. Phys. Rev. B Condens. Matter Mater. Phys. 2011, 84, 1–11. [Google Scholar] [CrossRef]
  15. Flack, T.J.; Pushpakaran, B.N.; Bayne, S.B. GaN Technology for Power Electronic Applications: A Review. J. Electron. Mater. 2016, 45, 2673–2682. [Google Scholar] [CrossRef] [Green Version]
  16. Morkoc, H. Handbook of Nitride Semiconductors and Devices; Wiley-VCH Verlag GmbH & Co. KGaA: Weinheim, Germany, 2008; ISBN 9783527628438. [Google Scholar]
  17. Lee, H.-P.; Perozek, J.; Rosario, L.D.; Bayram, C. Investigation of AlGaN/GaN high electron mobility transistor structures on 200-mm silicon (111) substrates employing different buffer layer configurations. Sci. Rep. 2016, 6, 37588. [Google Scholar] [CrossRef] [PubMed] [Green Version]
  18. Ilchenko, O.; Pilgun, Y.; Makhnii, T.; Slipets, R.; Reynt, A.; Kutsyk, A.; Slobodianiuk, D.; Koliada, A.; Krasnenkov, D.; Kukharskyy, V. High-speed line-focus Raman microscopy with spectral decomposition of mouse skin. Vib. Spectrosc. 2016, 83, 180–190. [Google Scholar] [CrossRef]
  19. Dias da Silva, J.H.; Leite, D.M.G.; Zanatta, A.R. Resonant excitation of Mn local vibrational modes in the higher order Raman spectra of nanocrystalline Ga1−xMnxN films. J. Phys. Condens. Matter 2008, 20, 252201. [Google Scholar] [CrossRef]
  20. Demangeot, F.; Frandon, J.; Renucci, M.A.; Briot, O.; Gil, B.; Aulombard, R.L. Raman determination of phonon deformation potentials in α-GaN. Solid State Commun. 1996, 100, 207–210. [Google Scholar] [CrossRef]
  21. Graf, T.; Gjukic, M.; Brandt, M.S.; Stutzmann, M.; Ambacher, O. The Mn3+/2+ acceptor level in group III nitrides. Appl. Phys. Lett. 2002, 81, 5159–5161. [Google Scholar] [CrossRef]
  22. Kysylychyn, D.; Suffczyński, J.; Woźniak, T.; Gonzalez Szwacki, N.; Bonanni, A. Resonant excitation of infrared emission in GaN:(Mn,Mg). Phys. Rev. B 2018, 97, 245311. [Google Scholar] [CrossRef]
  23. Han, B.; Wessels, B.W.; Ulmer, M.P. Optical investigation of electronic states of Mn4+ ions in p-type GaN. Appl. Phys. Lett. 2005, 86, 1–4. [Google Scholar] [CrossRef]
  24. Zenneck, J.; Niermann, T.; Mai, D.; Roever, M.; Kocan, M.; Malindretos, J.; Seibt, M.; Rizzi, A.; Kaluza, N.; Hardtdegen, H. Intra-atomic photoluminescence at 1.41 eV of substitutional Mn in GaMnN of high optical quality. J. Appl. Phys. 2007, 101, 2005–2008. [Google Scholar] [CrossRef]
  25. Zhang, Q.; Zhang, J.; Utama, M.I.B.; Peng, B.; De La Mata, M.; Arbiol, J.; Xiong, Q. Exciton-phonon coupling in individual ZnTe nanorods studied by resonant Raman spectroscopy. Phys. Rev. B Condens. Matter Mater. Phys. 2012, 85, 1–9. [Google Scholar] [CrossRef]
  26. Suffczyński, J.; Grois, A.; Pacuski, W.; Golnik, A.; Gaj, J.A.; Navarro-Quezada, A.; Faina, B.; Devillers, T.; Bonanni, A. Effects of s,p-d and s-p exchange interactions probed by exciton magnetospectroscopy in (Ga,Mn)N. Phys. Rev. B Condens. Matter Mater. Phys. 2011, 83, 1–8. [Google Scholar] [CrossRef]
  27. Martin, R.M.; Varma, C.M. Cascade Theory of Inelastic Scattering of Light. Phys. Rev. Lett. 1971, 26, 1241–1244. [Google Scholar] [CrossRef]
  28. Sun, W.H.; Chua, S.J.; Wang, L.S.; Zhang, X.H. Outgoing multiphonon resonant Raman scattering and luminescence in Be- and C-implanted GaN. J. Appl. Phys. 2002, 91, 4917–4921. [Google Scholar] [CrossRef]
  29. Kaschner, A.; Hoffmann, A.; Thomsen, C. Resonant Raman scattering on free and bound excitons in GaN. Phys. Rev. B Condens. Matter Mater. Phys. 2001, 64, 1–7. [Google Scholar] [CrossRef]
  30. Muth, J.F.; Lee, J.H.; Shmagin, I.K.; Kolbas, R.M.; Casey, H.C.; Keller, B.P.; Mishra, U.K.; DenBaars, S.P. Absorption coefficient, energy gap, exciton binding energy, and recombination lifetime of GaN obtained from transmission measurements. Appl. Phys. Lett. 1997, 71, 2572–2574. [Google Scholar] [CrossRef]
  31. Guo, L.L.; Shen, W.Z.; Zhang, Y.H. Temperature dependence of the optical properties in GaMnN. J. Appl. Phys. 2006, 99, 113533. [Google Scholar] [CrossRef]
  32. Shan, W.; Schmidt, T.J.; Yang, X.H.; Hwang, S.J.; Song, J.J.; Goldenberg, B. Temperature dependence of interband transitions in GaN grown by metalorganic chemical vapor deposition. Appl. Phys. Lett. 1995, 66, 985–987. [Google Scholar] [CrossRef]
  33. Ursaki, V.V.; Tiginyanu, I.M.; Zalamai, V.V.; Rusu, E.V.; Emelchenko, G.A.; Masalov, V.M.; Samarov, E.N. Multiphonon resonant Raman scattering in ZnO crystals and nanostructured layers. Phys. Rev. B Condens. Matter Mater. Phys. 2004, 70, 1–8. [Google Scholar] [CrossRef]
  34. Morgan, T.N. Broadening of Impurity Bands in Heavily Doped Semiconductors. Phys. Rev. 1965, 139, A343–A348. [Google Scholar] [CrossRef]
  35. Iliopoulos, E.; Doppalapudi, D.; Ng, H.M.; Moustakas, T.D. Broadening of near-band-gap photoluminescence in n-GaN films. Appl. Phys. Lett. 1998, 73, 375–377. [Google Scholar] [CrossRef]
  36. García-Cristbal, A.; Cantarero, A.; Trallero-Giner, C.; Cardona, M. Excitonic model for second-order resonant Raman scattering. Phys. Rev. B 1994, 49, 13430–13445. [Google Scholar] [CrossRef]
  37. Martin, R.M. Resonance raman scattering near critical points. Phys. Rev. B 1974, 10, 2620–2631. [Google Scholar] [CrossRef]
  38. Jhalani, V.A.; Zhou, J.-J.; Bernardi, M. Ultrafast Hot Carrier Dynamics in GaN and Its Impact on the Efficiency Droop. Nano Lett. 2017, 17, 5012–5019. [Google Scholar] [CrossRef] [PubMed] [Green Version]
  39. Zhukov, V.P.; Tyuterev, V.G.; Chulkov, E.V.; Echenique, P.M. Electron-phonon relaxation and excited electron distribution in gallium nitride. J. Appl. Phys. 2016, 120, 085708. [Google Scholar] [CrossRef] [Green Version]
  40. Wang, K.; Simon, J.; Goel, N.; Jena, D. Optical study of hot electron transport in GaN: Signatures of the hot-phonon effect. Appl. Phys. Lett. 2006, 88, 1–3. [Google Scholar] [CrossRef]
  41. Smoleński, T.; Kazimierczuk, T.; Kobak, J.; Goryca, M.; Golnik, A.; Kossacki, P.; Pacuski, W. Magnetic ground state of an individual Fe2+ ion in strained semiconductor nanostructure. Nat. Commun. 2016, 7, 1–7. [Google Scholar] [CrossRef] [PubMed]
Figure 1. Schematic representation of the architecture of the samples.
Crystals 09 00235 g001
Figure 2. (a) Raman spectra of GaN:(Mn,Mg) as a function of the Mg/Mn ratio. The Raman spectra of GaN:Mn, GaN:Mg, and sapphire substrate are reported as reference; polarized Raman spectra of GaN:(Mn,Mg) (Mg/Mn = 0.92) (b) and GaN:Mn (c) measured in parallel z ( y , y ) z ¯ and crossed z ( x , y ) z ¯ scattering geometries. The spectra are recorded at an excitation wavelength λexc = 488 nm and normalized to the intensity of E 2 high mode of GaN.
Crystals 09 00235 g002
Figure 3. Resonance Raman spectra of GaN:Mn (a) and GaN:(Mn,Mg) as a function of the Mg/Mn ratio (bf), measured at different energies of the laser excitation. The spectra are normalized to the intensity of the A1(LO) mode of GaN.
Crystals 09 00235 g003
Figure 4. Integrated intensity of the Mn-induced feature C related to the A1(LO) phonon mode of GaN as a function of the excitation energy and normalized to its intensity at 2.54 eV. Solid lines: guide for the eye.
Crystals 09 00235 g004
Figure 5. (a) Raman spectra of GaN:(Mn,Mg) at an excitation of 1.58 eV as a function of the Mg/Mn ratio. The relative intensity of the Mn-induced modes (b), indicated with C1 and C2, and the peak positions of the different phonon modes (c) are given as a function of the Mg/Mn ratio.
Crystals 09 00235 g005
Figure 6. PL spectra from the GaN:(Mn,Mg) samples as a function of the Mg/Mn ratio measured (a) at an excitation of 1.58 eV at room temperature, and (b) at an excitation of 2.41 eV at T = 77 K. Insets to (a,b): term schemes of Mn3+ (a) and Mn5+ (b) in GaN.
Crystals 09 00235 g006
Figure 7. Resonance Raman spectra for the GaN:(Mn,Mg) samples measured at an inter-band excitation of 3.82 eV. Inset: dependence of the Huang-Rhys factor on the Mg/Mn.
Crystals 09 00235 g007
Figure 8. Resonance Raman spectra for the GaN:Mn sample measured at an inter-band excitation of 3.82 eV and in the temperature range (78–300) K. Inset: schematic diagram of the cascade model for the outgoing multiphonon resonant Raman scattering.
Crystals 09 00235 g008
Figure 9. Temperature dependence of the I3LO/I2LO and I4LO/I3LO intensity ratios for GaN:Mn (a) and GaN:(Mn,Mg) with different Mg/Mn ratio (bf).
Crystals 09 00235 g009
Table 1. List of investigated samples, together with the respective Mn content xMn (from SIMS analysis), Mg concentration xMg (from SIMS analysis), and Mg/Mn ratio (from EXAFS measurements).
#SamplexMn, %xMg, %Mg/Mn
1GaN:Mn0.75--
2GaN:Mg-0.25-
3GaN:(Mn,Mg)0.540.160.41
4GaN:(Mn,Mg)0.490.490.92
5GaN:(Mn,Mg)0.220.361.5
6GaN:(Mn,Mg)0.090.202.25
7GaN:(Mn,Mg)0.090.606.6

