Article

The Photorefractive Response of Zn and Mo Codoped LiNbO3 in the Visible Region

1
The MOE Key Laboratory of Weak-Light Nonlinear Photonics and School of Physics, Nankai University, Tianjin 300071, China
2
TEDA Institute of Applied Physics, Nankai University, Tianjin 300457, China
3
Institute of Crystal Growth, School of Materials Science and Engineering, Shanghai Institute of Technology, Shanghai 201418, China
*
Authors to whom correspondence should be addressed.
Crystals 2019, 9(5), 228; https://doi.org/10.3390/cryst9050228
Submission received: 2 April 2019 / Revised: 22 April 2019 / Accepted: 25 April 2019 / Published: 28 April 2019
(This article belongs to the Special Issue Recent Progress in Lithium Niobate)

Abstract

:
We mainly investigated the effect of the valence state of photorefractive resistant elements on the photorefractive properties of codoped crystals, taking the Zn and Mo codoped LiNbO3 (LN:Mo,Zn) crystal as an example. Especially, the response time and photorefractive sensitivity of 7.2 mol% Zn and 0.5 mol% Mo codoped with LiNbO3 (LN:Mo,Zn7.2) crystal are 0.65 s and 4.35 cm/J at 442 nm, respectively. The photorefractive properties of the LN:Mo,Zn crystal are similar to the Mg and Mo codoped LiNbO3 crystal, which are better than the Zr and Mo codoped LiNbO3 crystal. The results show that the valence state of photorefractive resistant ions is an important factor for the photorefractive properties of codoped crystals and that the LN:Mo,Zn7.2 crystal is another potential material with fast response to holographic storage.

1. Introduction

Volume holographic storage is a technology that can store information at high density inside a crystal, which exploits the “inside” of the storage material, rather than only using its surface, resulting in a massive increase in the capacity of the data storage. Lithium niobate (LN) crystal is an essential material in many applications [1,2,3,4,5], such as surface acoustic wave, waveguides, volume holographic storage, piezoelectric, pyroelectric, and integrated optics [6,7,8,9]. The performance of volume holographic storage is particularly prominent [10,11,12,13,14,15,16,17,18]. However, there are still some problems in applying it to real life. One of the critical issues is that the holographic response of existing bulk holographic materials is not fast enough. The photorefractive performance of the LN crystal can be improved by using the doping technique.
In 2012, the photorefraction of Mo-doped LN crystals was reported. T. Tian et al. found that Mo6+ doping promotes the photorefractive properties of LN crystals [19]. Then in 2013, they studied fast UV-Vis photorefractive response of Zr and Mg codoped LiNbO3:Mo and found that their experimental phenomena were very different [20]. To explore the effect of the valence state of optical-damage-resistant ions on the properties of codoped crystals, in 2018, L. Zhu et al. investigated into In and Hf codoped LiNbO3:Mo crystals [21,22]. They proposed that these crystals, likewise, can improve the photorefractive properties of codoped LN crystals. Although Zr and Mg, In, Hf are elements with optical damage resistance in LN crystal, their effects on the photorefraction of LN:Mo crystal are different. To further study the effect of the optical damage resistant on the photorefractive properties of the codoped LN crystals, and explore the specific defect structure inside the crystal, we chose Zn and Mo codoped LN crystals.

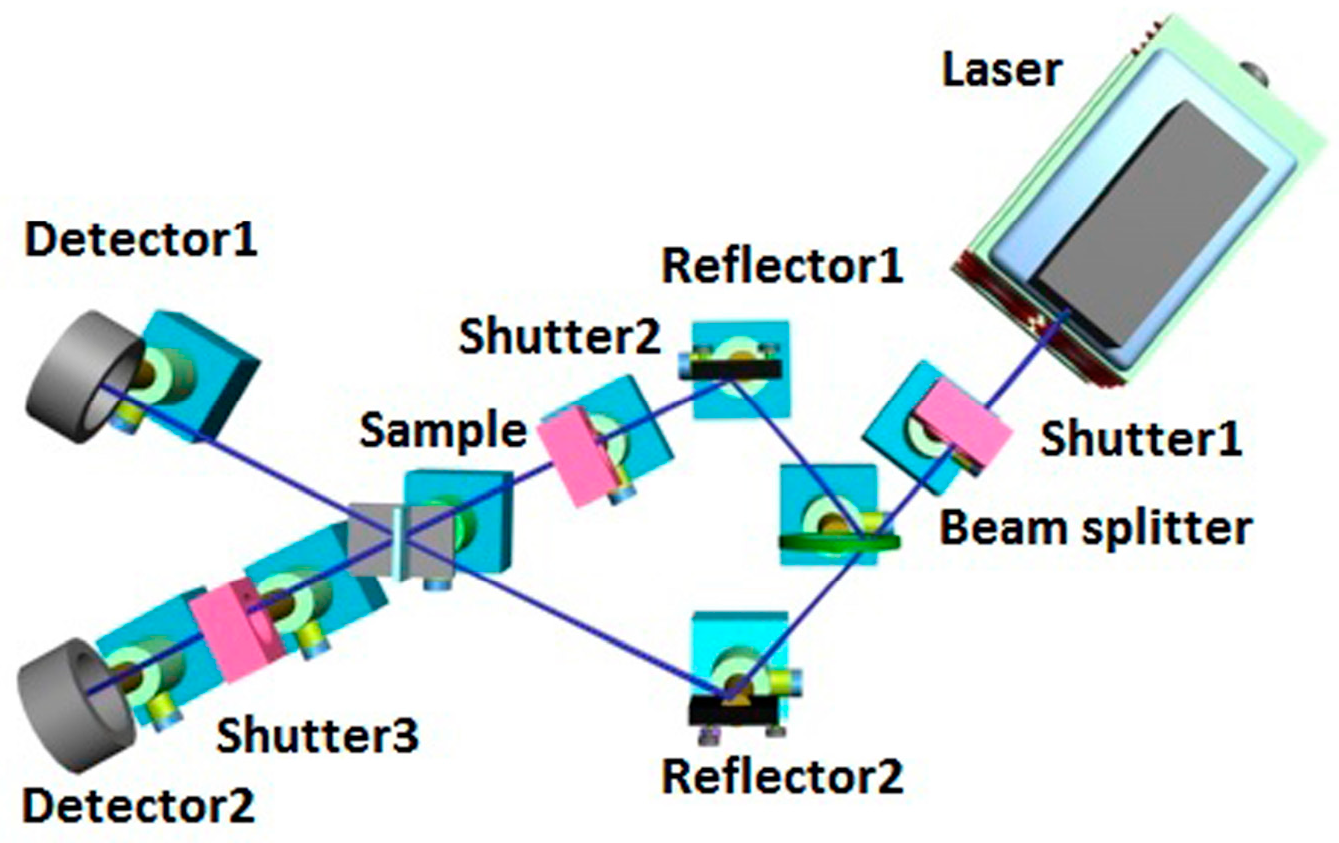
2. Materials and Methods

We grew crystals by using the Czochralski method. The raw materials used were Li2CO3, Nb2O5, MoO3, and ZnO with a purity of 99.99%. The Li/Nb ratio in the initial melt was 48.38/51.62. According to the previous experimental results, it was found that 0.5 mol% Mo was superior in the monodoped lithium niobate crystal, and the doping threshold of Zn was 7 mol%. So, the concentration we chose of MoO3 was 0.5 mol%, and the concentrations of ZnO were 5.4 and 7.2 mol%, respectively. For comparison, the congruent lithium niobate (CLN) and monodoped with Mo lithium niobate crystals were also grown. The crystals were labeled as CLN, LN:Mo0.5, LN:Mo,Zn5.4, and LN:Mo,Zn7.2. Before preparing polycrystals, these materials were thoroughly mixed and sintered. The conditions for crystal growth were a pulling rate of 0.6 mm/h and a rotation speed of 14 r/min. The boules were about 4.0 cm long and had a diameter of about 3.5 cm. The subsequent polarization was applied in the furnace, with a polarization current of 30 mA for 15 min. The crystals were then cut into 3 mm and 1 mm-thick plates after the annealing treatment, and optically polished in the y-face for optical measurement.
We measured the diffraction efficiency and response time of the crystals by the two wave coupling holographic experiment as shown in Figure 1. Two writing beams of extraordinary light with equal light intensity were employed to write the holograms, and their crossing angle was designed to be 30° in air. The instruments used in the experiments were helium cadmium laser (442 nm), argon ion laser (488 nm), and semiconductor solid state laser (532 nm and 671 nm). The total light intensities used here were 250 mW/cm2 for 442 nm, 400 mW/cm2 for 488 nm and 532 nm, and 1200 mW/cm2 for 671 nm. The measured diffraction efficiency was defined as η = I d / ( I d + I t ) , where Id and It is the diffracted and transmitted light intensities of the readout beam, respectively. The response time constant τr and the saturation diffraction efficiency ηs were deduced by fitting the function η ( t ) = η s [ 1 exp ( t / τ r ) ] 2 to the data. The photorefractive sensitivity [23] was defined as S = ( d η / d t ) t = 0 / ( I L ) , where I is the recording intensity and L is the grating thickness. The UV-visible transmission spectrum of the crystals was measured using a UV-4100 spectrophotometer (Hitachi Science and Technology, Tokyo, Japan) with a range of 300–800 nm and a resolution of 1 nm/step. The measurement of the infrared spectrum was carried out by A MAGNA-560 FT-IR spectrometer (Thermo Nicolet Corporation, Madison, America) with a range of 400–4000 cm−1 and a resolution of 2 cm−1/step.

3. Results

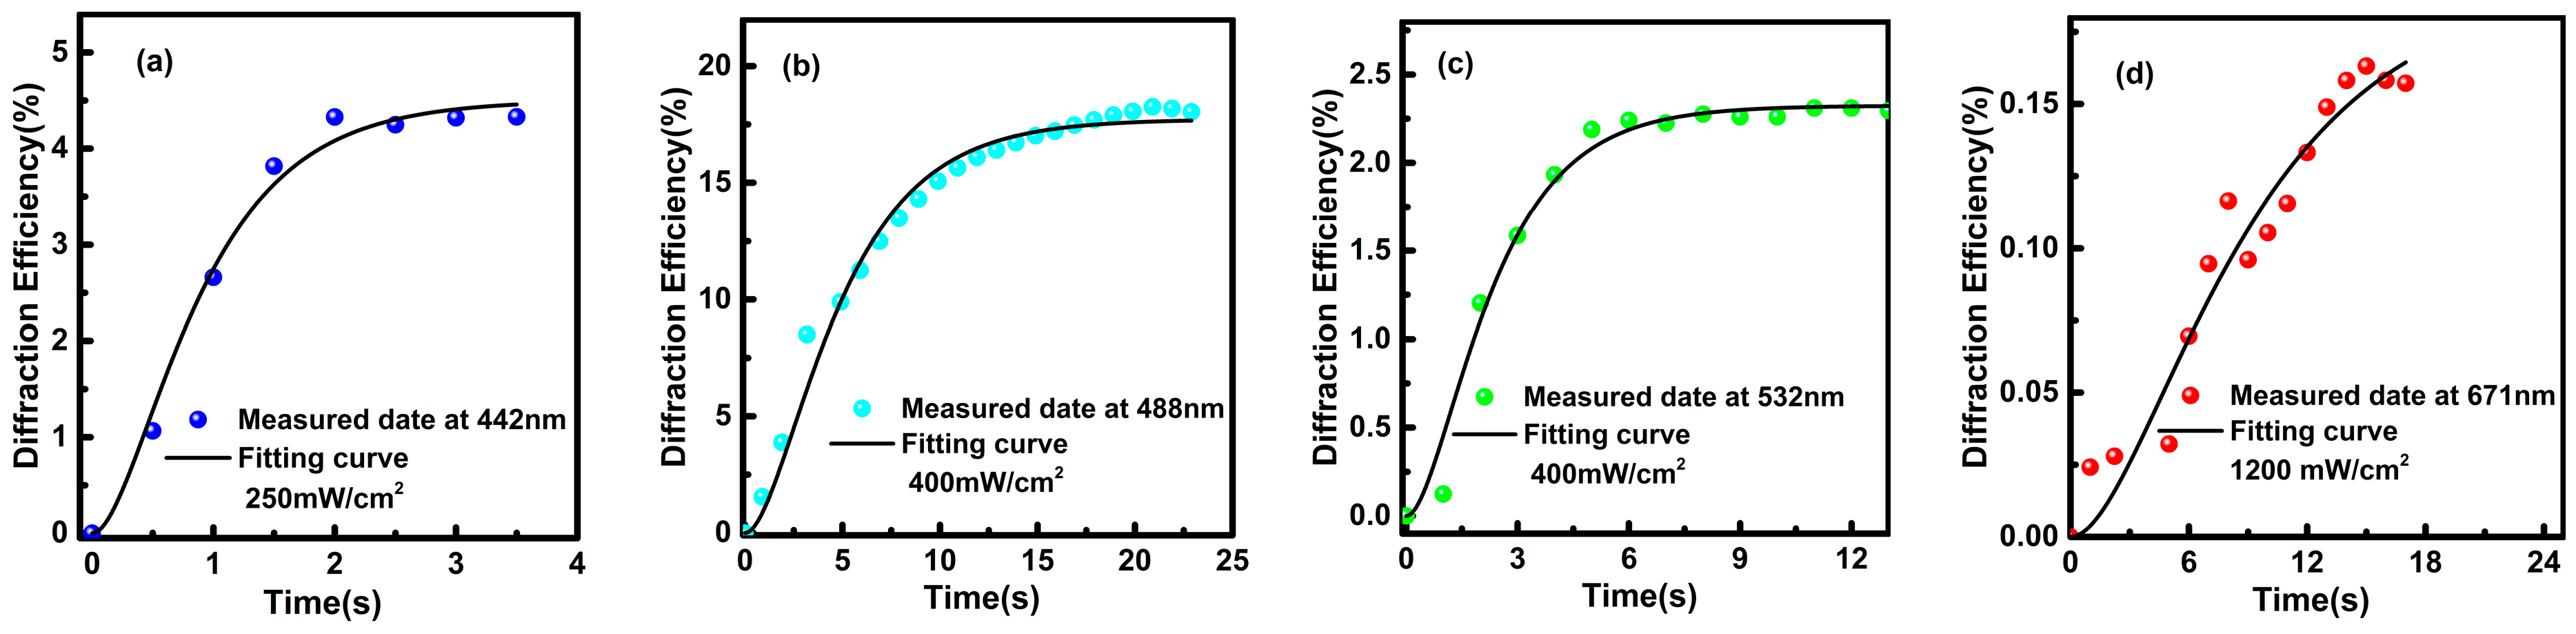
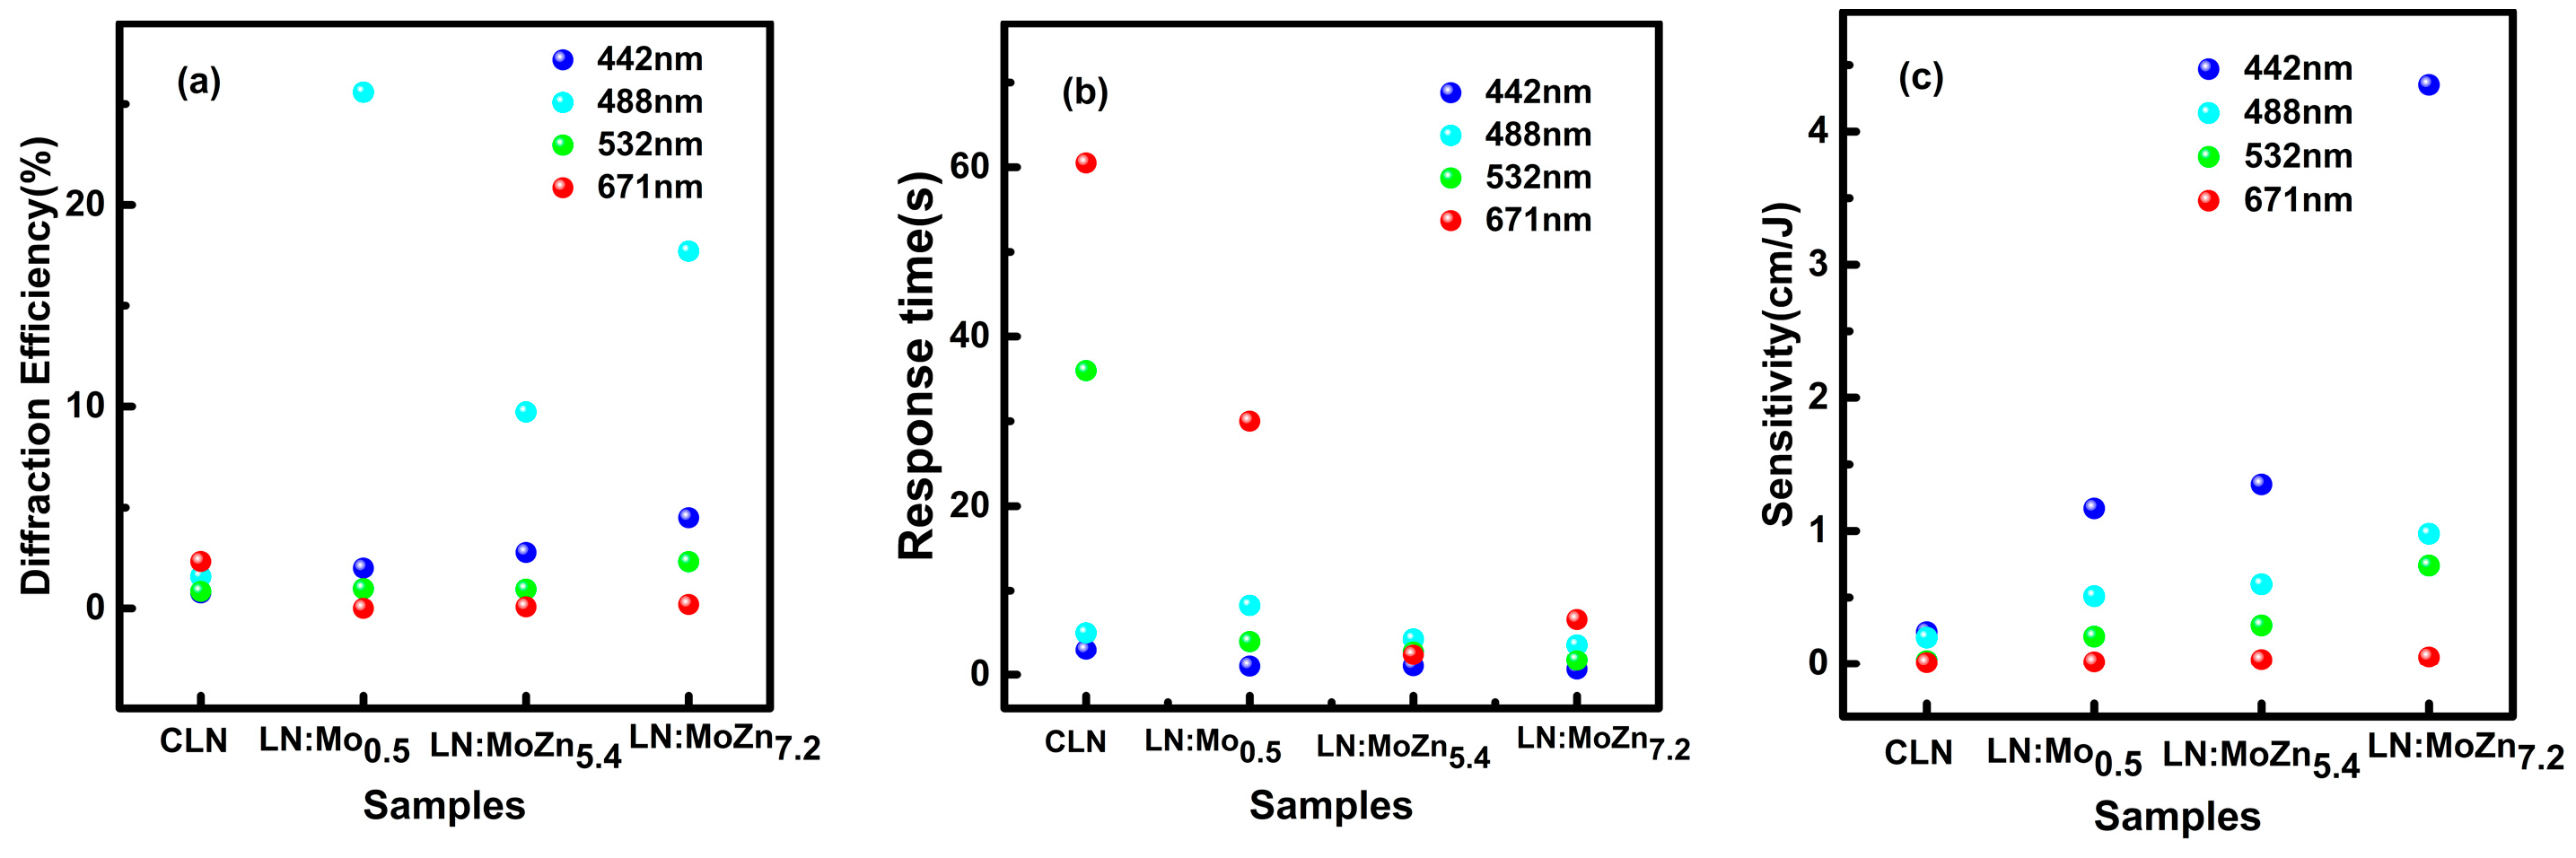
3.1. Photorefractive Properties

Figure 2a–d show the typical curves of diffraction efficiencies for the LN:Mo,Zn7.2 crystal as a function of time at 442 nm, 488 nm, 532 nm, and 671 nm lasers, respectively. The saturation diffraction efficiencies of the LN:Mo,Zn7.2 crystal to each wavelength were 4.50%, 17.72%, 2.32%, and 0.19%, respectively. From the figures, we can see that the diffraction efficiencies of the LN:Mo,Zn7.2 crystal increased with the shortening of the wavelength, but the mutation occurred at 488 nm, where the diffraction efficiency is four times that of 442 nm. The reason for this is probably due to the lower power of the 442 nm laser, which was the maximum laser power in our lab. However, the crystal had different responsiveness to each band. Among the lasers used in our experiments, especially in the 671 nm band, the required intensity was the highest.
The response times of the LN:Mo,Zn7.2 crystal were 0.65 s, 3.57 s, 1.71 s, and 6.61 s under the action of 442 nm, 488 nm, 532 nm, and 671 nm lasers, respectively. As the laser wavelength decreased, the response time of the LN:Mo,Zn7.2 crystal gradually decreased, but the response time at 488 nm was about two times longer than the response time taken at 532 nm. The reason for this phenomenon is likely to be related to its higher diffraction efficiency, so we used photorefractive sensitivity to reflect the comprehensive photorefractive ability of the LN:Mo,Zn7.2 crystal.
Figure 3 shows the photorefractive properties of LN:Mo,Zn crystals at 442 nm, 488 nm, 532 nm, and 671 nm laser wavelengths. For comparison, experimental data of CLN crystals is also included. The saturation diffraction efficiency is depicted in Figure 3a, the response time in Figure 3b, and the photorefractive sensitivity in Figure 3c. It can be seen from Figure 3a that the saturation diffraction efficiency of the LN:Mo,Zn crystal was improved due to the addition of zinc. In particular, LN:Mo, Zn7.2 had better performance in each band than other crystals and was more special at 488 nm. LN:Mo0.5 crystal had the highest saturation diffraction efficiency. Moreover, for all doped samples, the saturation diffraction efficiencies at 488 nm were higher than that at 442 nm. As shown in Figure 3b, the response time of the codoped crystal was greatly shortened due to the incorporation of Zn. In order to obtain a comparison of the crystals synthesis effects, we used the photorefractive sensitivity of the crystals to analyze that. Figure 3c shows that the photorefractive sensitivity of all our crystals increased with the shortening of the wavelength. When the zinc element exceeded the threshold, the photorefractive sensitivity of the LN:Mo,Zn crystal in different bands was improved. The photorefractive sensitivity of the LN:Mo,Zn7.2 crystal was significantly better than other crystals in each wavelength band. The photorefractive sensitivity of the LN:Mo,Zn7.2 crystal was 4.35 cm/J, 0.98 cm/J, 0.74 cm/J, and 0.02 cm/J at 442 nm, 488 nm, 532 nm, and 671 nm lasers, respectively. Compared with the data of LN:Mo,Zr2.5 and LN:Mo,Mg6.5 in Reference [20] in the same wavelength, the zinc doping enhanced the photorefractive properties of LN:Mo crystal, and its variation phenomena was the same as that of LN:Mo,Mg crystals, and was opposite to LN:Mo,Zr crystals. This indicates that the valence state of optical damage resistant ions plays a key role.

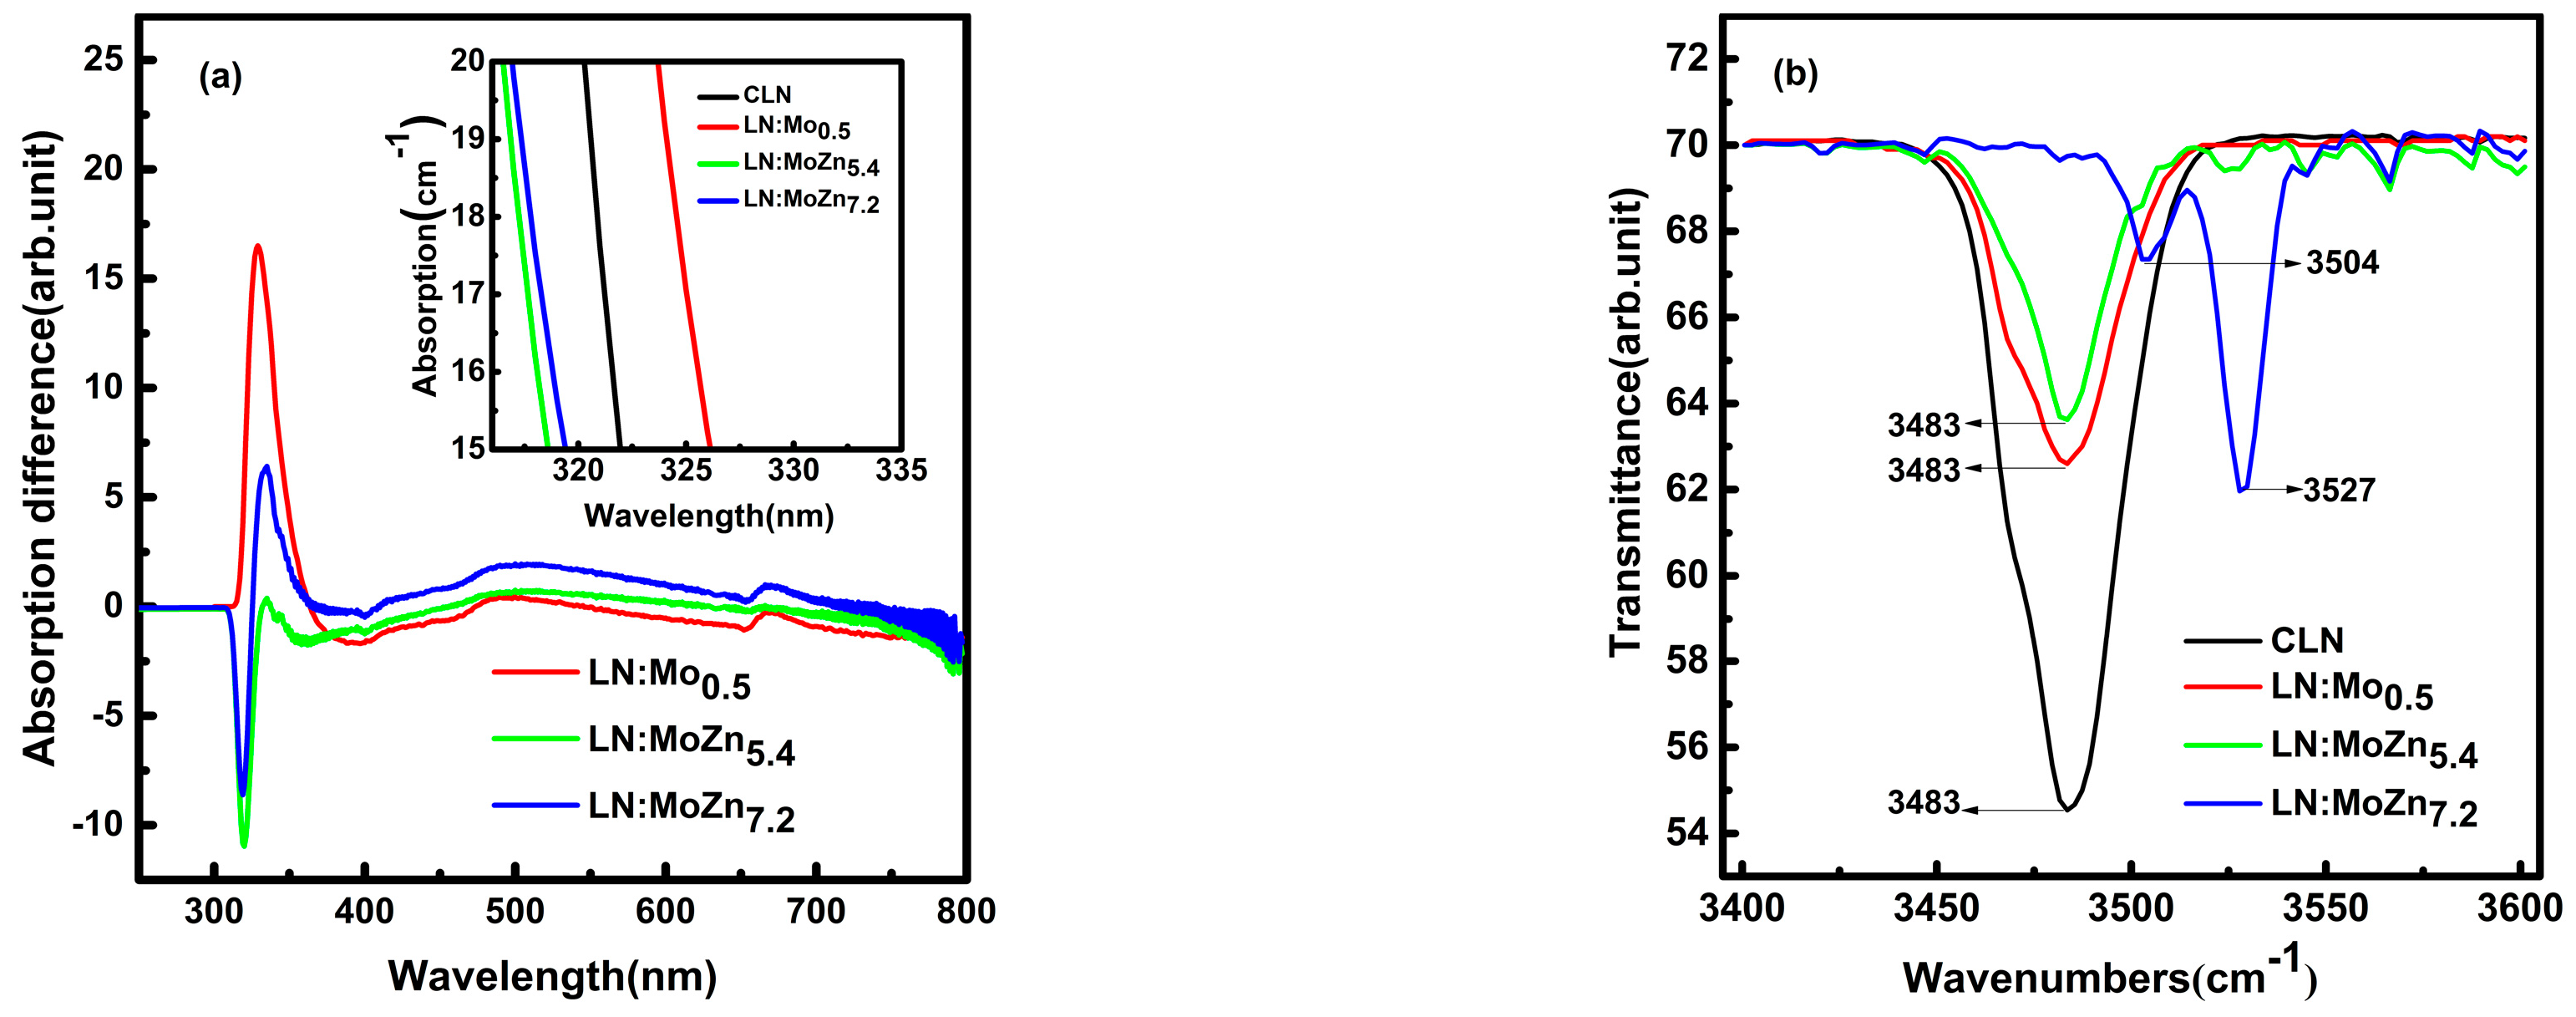
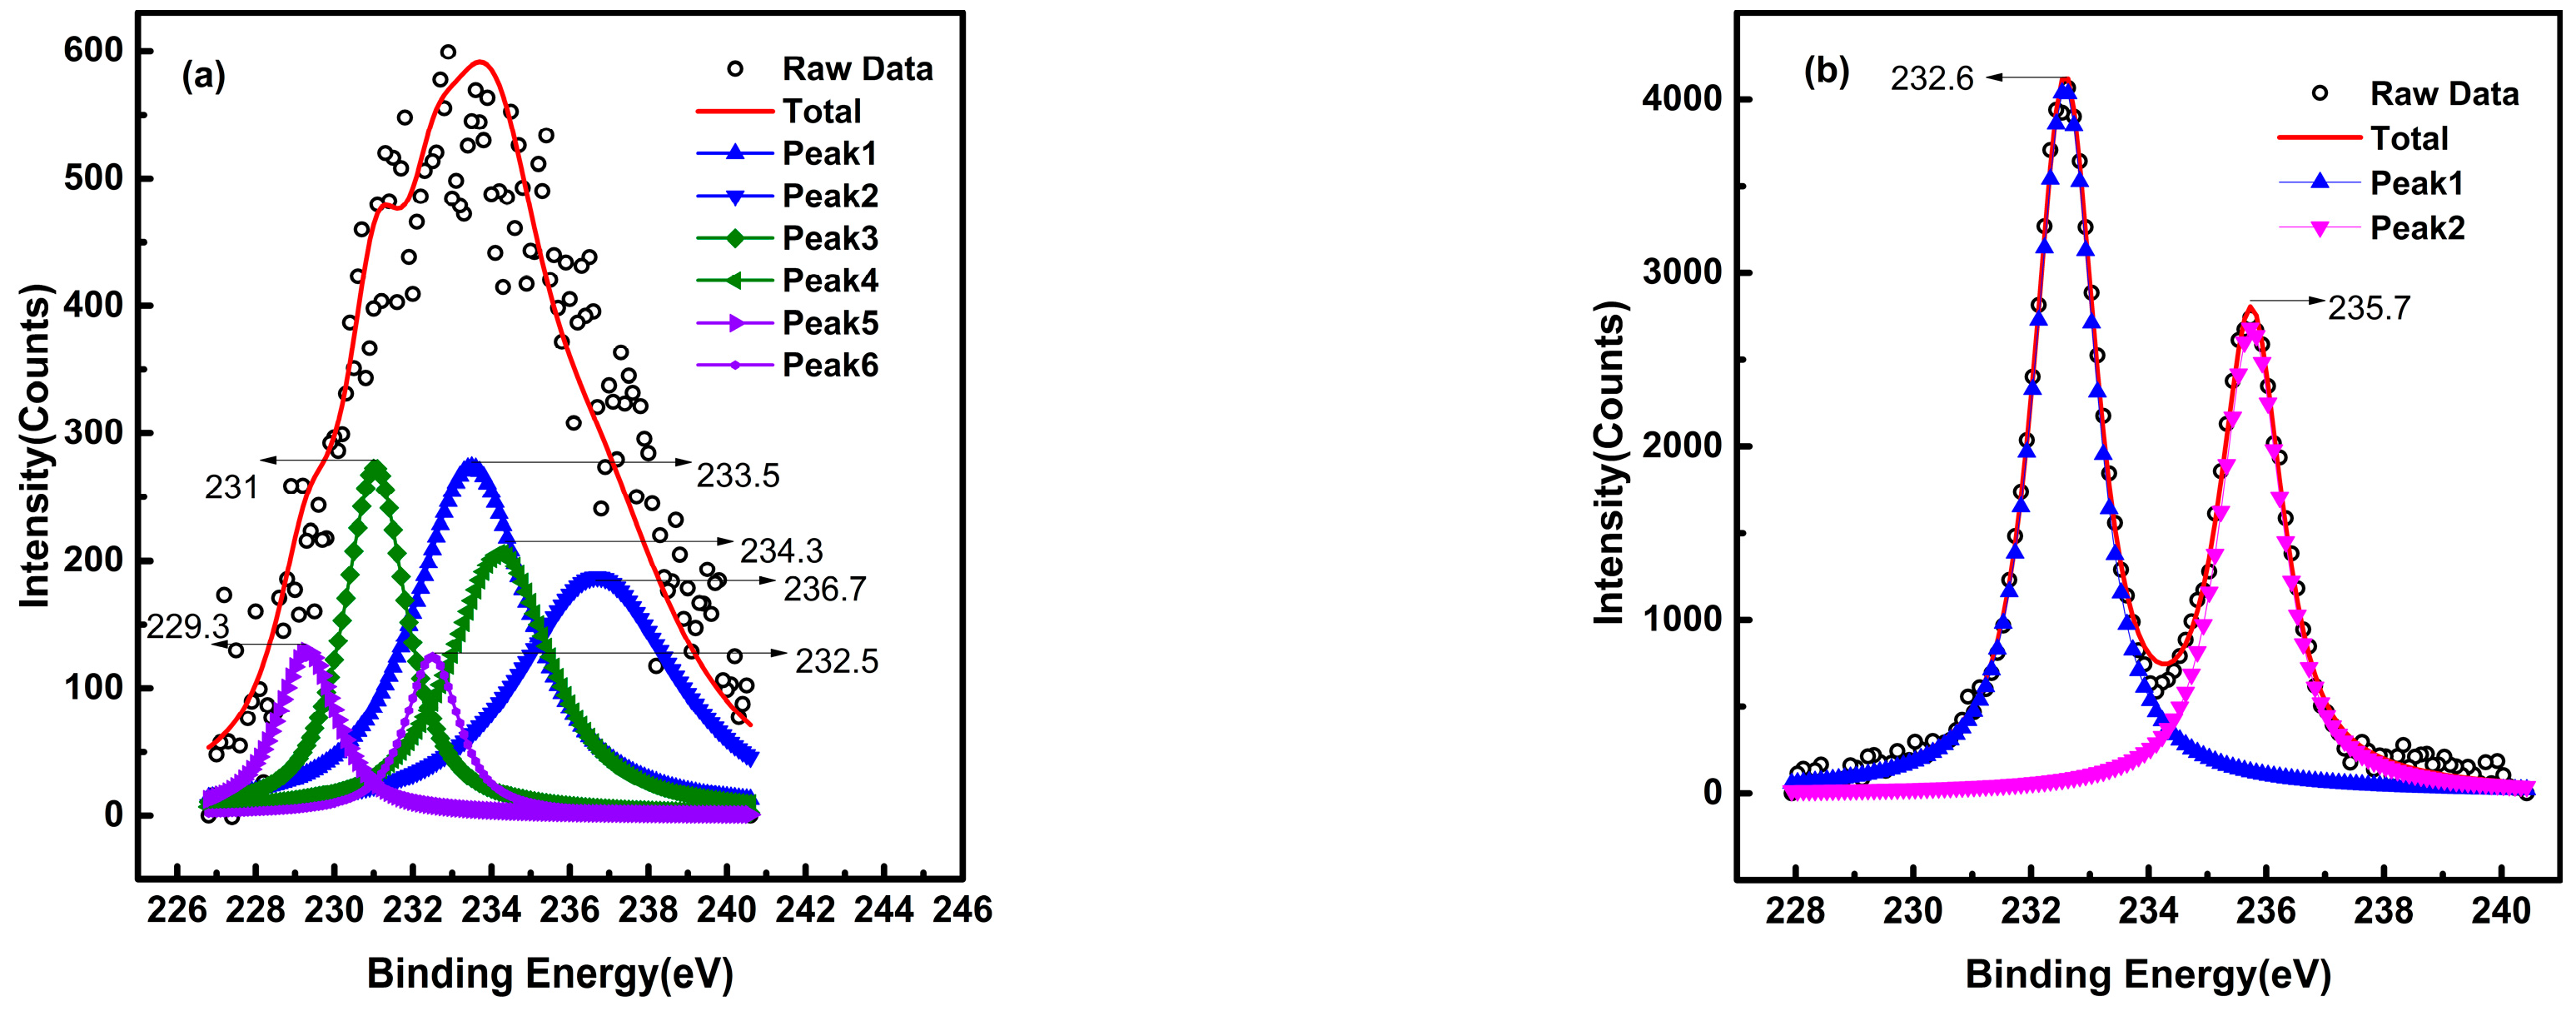
3.2. Spectral Analysis

The spectral characteristics of the crystals in different wavelengths can reveal the defect structure of the crystals. We recorded the wavelength of the absorption coefficient at 20 cm−1 as the absorption edge of the crystal. From the inset of Figure 4a, the absorption edge of the LN:Mo,Zn5.4 crystal had a blue-shift owing to the ZnO doping. The LN:Mo,Zn7.2 crystal occurred a red-shift for its doping concentration exceeding the threshold, but this move was very tiny. It can be seen from the UV-Vis absorption difference spectrum of Figure 4a, which indicates the difference in absorption between the test crystals and the CLN crystal, that the LN:Mo,Zn crystals have an absorption valley near 319 nm, and their values were very close to the absorption edge of the LN:Mo,Zn crystal. According to X. Li et al. research, the absorption edge of pure LN crystal is caused by the defect of lithium vacancy (VLi) [24]. Therefore, we speculate that the absorption valley was caused by VLi. There is a distinct absorption peak near 330 nm and 480 nm, which is similar to the LN:Mo,Mg and LN:Mo,Zr crystals. This is most likely due to the deep impurity level introduced by Mo ions. According to the existing energy band information of the ABO3 ferroelectric crystal, we know that for LN crystals, the valence band top is formed by the 2p orbital of oxygen, and the lowest layer of the empty conduction band is provided by the 4d orbit of the transition metal Nb5+ ions. Molybdenum ions and niobium ions belong to transition metal ions and have a 4d orbital. When molybdenum ions are incorporated into the LN crystal, its orbits will affect the bonding strength of the Nb-O bond, resulting in a change in the band gap width of the LN crystal. The absorption band of the visible band indicates that there are multiple energy levels in the band gap which contribute to the photorefractive processing.
From the FT-IR transmission spectrum which is shown in Figure 4b, we can observe that in the LN:Mo,Zn crystals, the main absorption peak of LN:Mo,Zn7.2 crystal appeared at 3527 cm−1, the minor peak appeared at 3504 cm−1, and the peak appeared at 3483 cm−1 in CLN, LN:Mo0.5 and LN:Mo,Zn5.4. The absorption peak transferred from 3483 cm−1 to 3527 cm−1, which implies that the Zn2+ concentration in LN:Mo,Zn7.2 crystal exceeded the threshold, the (NbLi)4+ defects disappeared, and the (ZnNb)3− appeared in the crystal.
To detect the defect structures inside the crystal, we analyzed the valence of Mo ions of LN:Mo,Zn7.2 crystal by the X-ray photoelectron spectroscopy (XPS) [25]. As shown in Figure 5a, molybdenum ions exhibited three valence states in the LN:Mo,Zn7.2 crystal, in which the combined peaks of 233.5 eV and 236.7 eV represent +6 valence, the peaks of 231 eV and 234.5 eV represent +5 valence, and the peaks of 229.3 eV and 232.5 eV represent +4 valence. As a comparison, the molybdenum element in the residue of the crucible only showed a +6 valence state formed by two combined peaks of 232.6 eV and 235.7 eV shown in Figure 5b. These results show that the valence states of Mo ions changed when they enter the crystals, which lead to the generation of new defects.

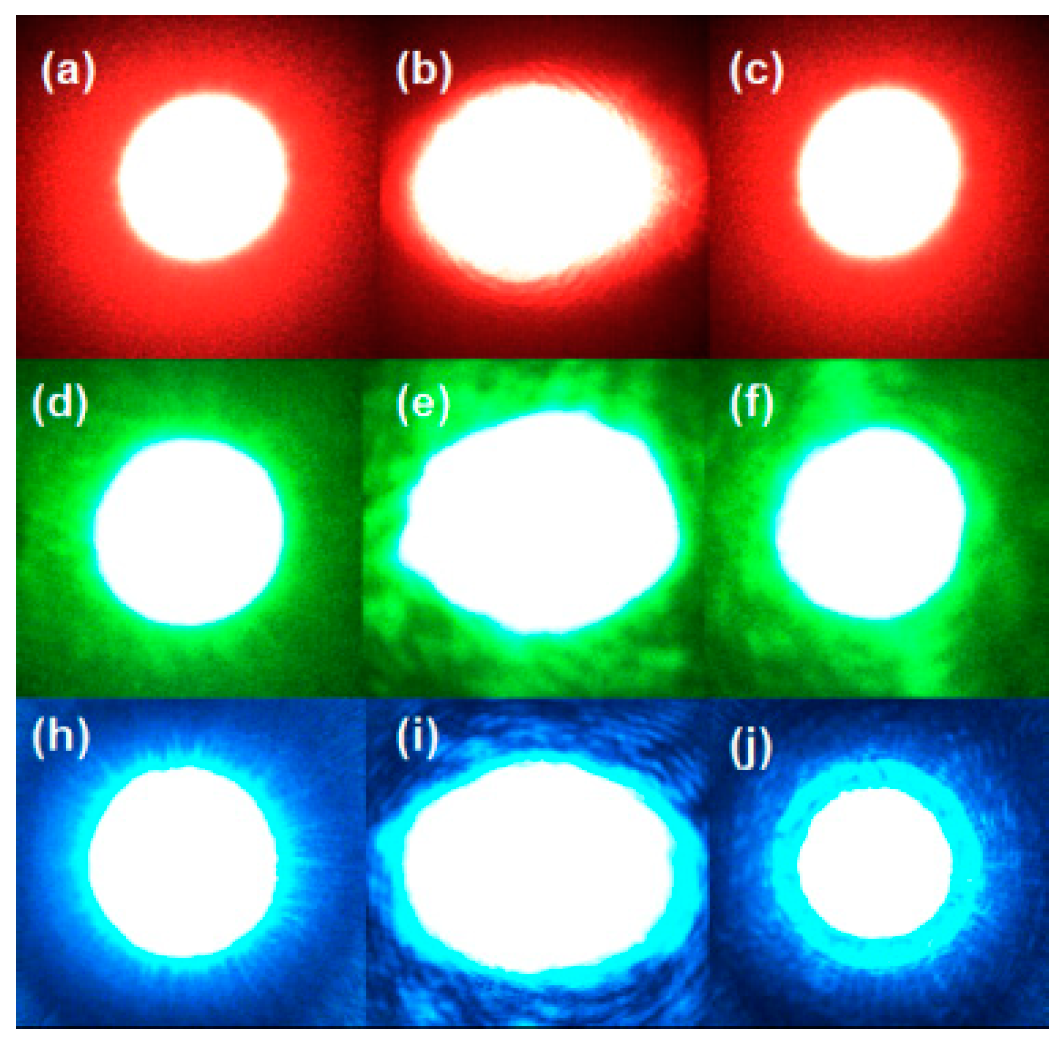
3.3. Optical Damage Resistance Ability

We used the light spot distortion method to measure the optical-damage-resistance ability of crystals. As shown in Figure 6, at the maximum laser power in our lab, we can observe that the transmitted spots of the LN:Mo,Zn7.2 crystal remained circular, under the effect of 671 nm laser, when the light intensity was maintained at an intensity of 7.8 × 10⁴ W/cm2 for 5 min. A similar phenomenon occurred when under the action of the 532 nm and 488 nm lasers, the light intensities were 2.6 × 10⁵ W/cm2 and 3.2 × 10⁵ W/cm2, respectively. However, the transmitted spot of the LN:Mo,Zn5.4 crystal was significantly stretched in the c-axis direction compared to the original incident one. This performance broadens the range of applications for the LN:Mo,Zn7.2 crystal, allowing it to operate at higher light levels. The above experiment shows that the LN:Mo,Zn7.2 crystal not only has realized itself as an excellent photorefractive material, but also a high-intensity-application crystal.

4. Discussion

In the absorption difference spectrum of Figure 4a, we can observe that the absorption near 488 nm is higher than other spectra in the visible band, which also confirms that it has higher diffraction efficiency than other bands. Also, the apparent absorption peak near 330 nm indicates that there may be a deep defect level here. Because of the low power of our laboratory 325 nm laser and the absence of working laser of suitable wavelength, further research on deep defect level is needed.
The XPS studies reveal that the valence change of Mo ions occurs before and after entering the LN:Mo,Zn crystal. In the process of crystal growth, the convertible Mo ions enter the crystal and are isolated from oxygen, so they are not easily oxidized and present three valence states. On the contrary, the Mo ions in the residue can come in contact with sufficient oxygen and be easily oxidized, so the Mo ions in the residue only exist in the +6 valence state. According to previous reports [17], the Mo4+ and Mo5+ ions may occupy the Li sites (MoLi3+/4+), and Mo6+ ions may occupy the Nb sites (MoNb+) severed as UV photorefractive centers. On the base of the lithium vacancy model, a large number of intrinsic defects (such as NbLi4+, small polaron, and bipolaron, etc.) limit the response time of the crystal. At low concentrations, the molybdenum and zinc ions tend to occupy the Li position, which could push the NbLi4+ out and shorten the response time. When the zinc ion concentration exceeds the threshold, all the NbLi4+ were replaced and the MoLi3+/4+ were also substituted due to their higher valence than +2 valence zinc ions and transferred to the MoNb+ ions. As the UV photorefractive center, the MoNb+ ions may attract an electron from O2‒, which could further speed up the photorefraction process [26]. However, for the +3 and +4 valence photorefractive resistant elements, the substitution for the MoLi3+/4+ defect is weak. Thus, the valence state of the optical damage resistant elements may be the critical factor determining the crystal properties.
As the main obstacle of the optical storage materials, the storage speed has been limiting the commercial application of LN crystals. The response time and sensitivity of LN:Mo,Zn crystal was optimized by the zinc codoping, compared with LN:Mo,Zr crystals, which is similar to the LN:Mo,Mg crystals. These results confirm that the valence state of the optical damage resistant elements may be the critical factor determining the crystal properties. Compared to the LN:Mo,Mg6.5 crystals, the response time in LN:Mo,Zn7.2 crystals was several times longer than that of LN:Mo,Mg6.5 crystals at the same wavelength. Especially with the shortening of wavelength, this gap was further widened. We think this due to the individuality of the elements, such as the ionic radius, electronegativity, outer electron configuration, etc. As it is well known, the conduction band is generally provided by d electrons. For Zn2+ and Mg2+, Zn2+ has d electrons, while Mg ions have no d electrons, which results in a significant difference in the effect of the two on the crystal. Overall, the valence state of the optical-damage-resistant elements and the individuality of the elements may be the main factor determining the crystal properties.

5. Conclusions

In summary, the LN:Mo,Zn crystals were grown with different concentrations and measured about photorefractive properties. Through the experiments, we find that its photorefractive properties are similar to those of LN:Mo,Mg crystals, but different from those of LN:Mo,Zr crystals, and the doping of zinc can shorten the response time and improve the photorefractive sensitivity of the LN:Mo,Zn crystal, especially 0.65 s and 4.35 cm/J at 442nm for the LN:Mo,Zn7.2 crystal. It is indicated that the valence state of ions has a significant effect on the photorefractive properties of crystals. The valence states of Mo ions in crystal was identified by the XPS results, and the MoNb+ and MoLi3+/4+ defects were served as the photorefractive center for fast photorefraction. The experimental results show that the LN:Mo,Zn7.2 crystal can be used as another candidate material for holographic storage.

Author Contributions

Conceptualization, L.X., H.L. and Y.K.; Funding acquisition, D.Z., T.T. and Y.K.; Investigation, L.X.; Methodology, L.X., D.Z., S.L., S.C., and L.Z.; Project administration, Y.K. and J.X.; Resources, L.X., S.L., S.C. and J.X.; Writing (original draft), L.X.; Writing (review and editing), L.X., H.L., D.Z., S.S., X.W., L.Z., and Y.K.

Funding

This research was partially supported by the National Natural Science Foundation of China (11674179, 61705116, and 61605116) and the Program for Changjiang Scholars and Innovative Research Team in University with grant [IRT_13R29], National Basic Research Program of China (2013CB328706), and International Science & Technology Cooperation Program of China (2013DFG52660).

Conflicts of Interest

The authors declare no conflicts of interest.

References

  1. Wang, C.; Zhang, M.; Stern, B.; Lipson, M.; Lončar, M. Nanophotonic lithium niobate electro-optic modulators. Opt. Express 2018, 26, 1547–1555. [Google Scholar] [CrossRef] [PubMed] [Green Version]
  2. Krasnokutska, I.; Tambasco, J.J.; Li, X.; Peruzzo, A. Ultra-low loss photonic circuits in lithium niobate on insulator. Opt. Express 2018, 26, 897–904. [Google Scholar] [CrossRef] [PubMed] [Green Version]
  3. Wang, C.; Li, Z.; Kim, M.H.; Xiong, X.; Ren, X.F.; Guo, G.C.; Yu, N.; Lončar, M. Metasurface-assisted phase-matching-free second harmonic generation in lithium niobate waveguides. Nat. Commun. 2017, 8, 4–10. [Google Scholar] [CrossRef] [PubMed]
  4. Hesselink, L.; Orlov, S.S.; Liu, A.; Akella, A.; Lande, D.; Neurgaonkar, R.R. Photorefractive materials for nonvolatile volume holographic data storage. Science 1998, 282, 1089–1094. [Google Scholar] [CrossRef]
  5. Xu, M.; Kang, H.; Guan, L.; Li, H.; Zhang, M. Facile Fabrication of a Flexible LiNbO3 Piezoelectric Sensor through Hot Pressing for Biomechanical Monitoring. ACS Appl. Mater. Interfaces 2017, 9, 34687–34695. [Google Scholar] [CrossRef] [PubMed]
  6. Qiu, W.; Ndao, A.; Vila, V.C.; Salut, R.; Courjal, N.; Baida, F.I.; Bernal, M.P. Fano resonance-based highly sensitive, compact temperature sensor on thin film lithium niobate. Opt. Lett. 2016, 41, 1106–1109. [Google Scholar] [CrossRef] [PubMed]
  7. Xu, H.; Dong, S.; Xuan, W.; Farooq, U.; Huang, S.; Li, M.; Wu, T.; Jin, H.; Wang, X.; Luo, J. Flexible surface acoustic wave strain sensor based on single crystalline LiNbO3 thin film. Appl. Phys. Lett. 2018, 112, 093502. [Google Scholar] [CrossRef]
  8. Bai, Y.; Kachru, R. Nonvolatile holographic storage with two-step recording in lithium niobate using cw lasers. Phys. Rev. Lett. 1997, 78, 2944. [Google Scholar] [CrossRef]
  9. Yoshinaga, H.; Kitayama, K.i.; Oguri, H. Holographic image storage in iron-doped lithium niobate fibers. Appl. Phys. Lett. 1990, 56, 1728–1730. [Google Scholar] [CrossRef]
  10. Imlau, M.; Brüning, H.; Schoke, B.; Hardt, R.; Conradi, D.; Merschjann, C. Hologram recording via spatial density modulation of NbLi4+/5+ antisites in lithium niobate. Opt. Express 2011, 19, 15322–15338. [Google Scholar] [CrossRef]
  11. Juodkazis, S.; Mizeikis, V.; Sūdžius, M.; Misawa, H.; Kitamura, K.; Takekawa, S.; Gamaly, E.G.; Krolikowski, W.Z.; Rode, A.V. Laser induced memory bits in photorefractive LiNbO3 and LiTaO3. Appl. Phys. A 2008, 93, 129–133. [Google Scholar] [CrossRef]
  12. Camarillo, E.; Murrieta, H.; Hernandez, J.M.; Zoilo, R.; Flores, M.C.; Han, T.P.J.; Jaque, F. Optical properties of LiNbO3:Cr crystals co-doped with germanium oxide. J. Lumin. 2008, 128, 747–750. [Google Scholar] [CrossRef]
  13. Luo, S.; Meng, Q.; Wang, J.; Sun, X. Effect of In3+ concentration on the photorefraction and scattering properties in In:Fe:CU:LiNbO3 crystals at 532nm wavelength. Opt. Commun. 2016, 358, 198–201. [Google Scholar] [CrossRef]
  14. Nie, Y.; Wang, R.; Wang, B. Growth and holographic storage properties of In:Ce:Cu:LiNbO3 crystal. Mater. Chem. Phys. 2007, 102, 281–283. [Google Scholar] [CrossRef]
  15. Zhen, X.H.; Li, H.T.; Sun, Z.J.; Ye, S.J.; Zhao, L.C.; Xu, Y.H. Holographic properties of double-doped Zn:Fe:LiNbO3 crystals. Mater. Lett. 2004, 58, 1000–1002. [Google Scholar] [CrossRef]
  16. Wei, Z.; Naidong, Z.; Qingquan, L. Growth and Holographic Storage Properties of Sc, Fe Co-Doped Lithium Niobate Crystals. J. Rare Earth. 2007, 25, 775–778. [Google Scholar] [CrossRef]
  17. Xu, C.; Leng, X.; Xu, L.; Wen, A.; Xu, Y. Enhanced nonvolatile holographic properties in Zn, Ru and Fe co-doped LiNbO3 crystals. Opt. Commun. 2012, 285, 3868–3871. [Google Scholar] [CrossRef]
  18. Pálfalvi, L.; Hebling, J.; Almási, G.; Péter, Á.; Polgár, K.; Lengyel, K.; Szipöcs, R. Nonlinear refraction and absorption of Mg doped stoichiometric and congruent LiNbO3. J. Appl. Phys. 2004, 95, 902. [Google Scholar] [CrossRef]
  19. Tian, T.; Kong, Y.; Liu, S.; Li, W.; Wu, L.; Chen, S.; Xu, J. Photorefraction of molybdenum-doped lithium niobate crystals. Opt. Lett. 2012, 37, 2679. [Google Scholar] [CrossRef]
  20. Tian, T.; Kong, Y.; Liu, S.; Li, W.; Chen, S.; Rupp, R.; Xu, J. Fast UV-Vis photorefractive response of Zr and Mg co-doped LiNbO3:Mo. Opt. Express 2013, 21, 128–132. [Google Scholar] [CrossRef]
  21. Zhu, L.; Zheng, D.; Saeed, S.; Wang, S.; Liu, H.; Kong, Y.; Liu, S.; Chen, S.; Zhang, L.; Xu, J. Photorefractive Properties of Molybdenum and Hafnium Co-Doped LiNbO3 Crystals. Crystals 2018, 8, 322. [Google Scholar] [CrossRef]
  22. Zhu, L.; Zheng, D.; Liu, H.; Saeed, S.; Wang, S.; Liu, S.; Chen, S.; Kong, Y.; Xu, J. Enhanced photorefractive properties of indium co-doped LiNbO3:Mo crystals. AIP Adv. 2018, 8, 095316. [Google Scholar] [CrossRef]
  23. Dischler, B.; Herrington, J.R.; Räuber, A.; Kurz, H. Correlation of the photorefractive sensitivity in doped LiNbO3 with chemically induced changes in the optical absorption spectra. Solid State Commun. 1974, 14, 1233–1236. [Google Scholar] [CrossRef]
  24. Li, X.; Kong, Y.; Liu, H.; Sun, L.; Xu, J.; Chen, S.; Zhang, L.; Huang, Z.; Liu, S.; Zhang, G. Origin of the generally defined absorption edge of non-stoichiometric lithium niobate crystals. Solid State Commun. 2007, 141, 113–116. [Google Scholar] [CrossRef]
  25. Grim, S.O.; Matienzo, L.J. X-Ray Photoelectron Spectroscopy of Inorganic and Organometallic Compounds of Molybdenum. Inorg. Chem. 1975, 14, 1014–1018. [Google Scholar] [CrossRef]
  26. Kong, Y.; Xu, J.; Zhang, W.; Zhang, G. The site occupation of protons in lithium niobate crystals. J. Phys. Chem. Solids 2000, 61, 1331. [Google Scholar] [CrossRef]
Figure 1. The schematic diagram of the experimental two-wave holographic setup.
Crystals 09 00228 g001
Figure 2. The diffraction efficiency of the 7.2 mol% Zn and 0.5 mol% Mo codoped with LiNbO3 (LN:Mo,Zn7.2) crystal versus time at (a) 442 nm, (b) 488 nm, (c) 532 nm, and (d) 671 nm laser, respectively.
Crystals 09 00228 g002
Figure 3. (a) The diffraction efficiency, (b) response time, and (c) photorefractive sensitivity of CLN, LN:Mo0.5, LN:Mo,Zn5.4, and LN:Mo,Zn7.2 crystals at 442 nm, 488 nm, 532 nm, and 671 nm lasers, respectively.
Crystals 09 00228 g003
Figure 4. (a) UV-visible absorption difference spectra of LN:Mo, LN:Mo,Zn relative to CLN crystals, and the inset shows absorption edges at 20 cm−1. (b) FT-IR transmission spectra of CLN, LN:Mo and LN:Mo,Zn crystals.
Crystals 09 00228 g004
Figure 5. X-ray photoelectron spectroscopy of Mo in LN:Mo,Zn7.2 crystal (a) in the crystal and (b) in the residue of the crucible.
Crystals 09 00228 g005
Figure 6. The incident spots of (a) 671nm, (d) 532nm, and (h) 488nm lasers; (b,e,i) transmitted spots of LN:Mo,Zn5.4 crystals under the action of different color lasers; (c,f,j) transmitted spots of LN:Mo,Zn7.2 crystal under the action of different color lasers.
Crystals 09 00228 g006

