Article

Representative Stress Correlation of Global Scratch Quantities at Scratch Testing: Experimental Verification

by
Per-Lennart Larsson
Department of Solid Mechanics, Royal Institute of Technology, SE-10044 Stockholm, Sweden
Crystals 2019, 9(3), 154; https://doi.org/10.3390/cryst9030154
Submission received: 28 February 2019 / Revised: 11 March 2019 / Accepted: 12 March 2019 / Published: 14 March 2019
(This article belongs to the Section Crystalline Materials)

Abstract

:
Evaluation and correlation of global quantities, i.e., normal and tangential hardness, at scratch testing in the context of a representative stress description was investigated. In particular, verification based on experimental results is at issue. It has been shown previously that within the framework of classical von Mises elasto-plasticity and quasi-static conditions, correlation can be achieved by using a combination of stresses at different levels of plastic strains to define representative quantities at scratching, accounting for the difference in mechanical behavior at elasto-plastic and rigid plastic scratching. However, verification from experimental results is required, which has been attempted in this study. Predictions based on previous theoretical results were compared with experimental findings for polymeric materials, as well as for different metals. Good agreement was found between the two sets of results, particularly so for the case of polymers modelled by von Mises elasto-plasticity. Accordingly, these results are of direct practical, accurate, and novel relevance for semi-crystalline polymers where viscoelastic effects are negligible.

1. Introduction

Material characterization using contact mechanics-based testing, in particular normal indentation (but also scratch testing), most often relies on the classical analyses by Sneddon [1], Tabor [2], and Johnson [3,4] pertinent to standard elasto-plasticity. In these studies, global indentation properties (i.e., normal hardness, Hn (average contact pressure), and normal indentation load-indentation depth curve (Pn-h-curve)) are related to elasto-plastic material properties.
Johnson [3,4] defined the fundamentals for a general analysis of normal indentation testing and, especially at normal sharp indentation on classical von Mises elasto-plastic materials, a general correlation parameter could be defined reading:
Λ = Etanβ/((1 − ν2rep)
In Equation (1), E is the Young’s modulus, ν is Poisson’s ratio, β is the angle between the (sharp) indenter and the undeformed surface, and σrep is the material flow stress at a representative value of the effective (accumulated) plastic strain εp. Based on the parameter Λ, three regions or levels of contact behavior can be defined. These levels, as shown in Figure 1, are: (1) Level I, with dominating elastic deformations (i.e., low indentation load), where an elastic contact analysis is sufficient; (2) Level II, where elastic and plastic deformations are of equal magnitude; and, (3) Level III, where plastic deformations are dominating in the contact region.
Johnson [3,4] concluded that:
H ~ ln Λ.
while in level III, Tabor [2] showed that at sharp indentation:
H = rep
For a Vickers indenter C ≈ 3 and εp ≈ 0.08 (Tabor [2]), and for a cone indenter C ≈ 2.55 and εp ≈ 0.11 (Atkins and Tabor [5]). The latter case is specified for a cone indenter with an angle of 22° between the indenter and the undeformed surface.
The complexity of the normal indentation problem results in the fact that finite element methods are an essential part of the solution procedure, as specified in, for example, [6,7,8,9,10,11,12,13]. Finite element methods are obviously a very important part of an analysis of scratch testing, as shown in [14,15,16,17,18,19,20,21,22] (just to mention a few), where an important conclusion from these results was that the Johnson parameter [3,4] in Equation (1) governed correlation also at scratch problems. This was further clarified in [23,24], where explicit formulae for this correlation for a number of global scratch quantities—accounting for the difference in scratch behavior at level II and level III scratching—were presented. These global scratch quantities included normal and tangential scratch hardness, which were further investigated in this study. Experimental verification of these scratch relations is of great importance, which was attempted here using predictions from [23,24]. These predictions were compared to corresponding experimental results originally presented by Wredenberg and Larsson [20]. The experimental results are pertinent to both polymeric and metallic materials and—accordingly—a large range of values on the Λ–parameter in Equation (1) were covered. When it comes to polymeric materials in particular, semi-crystalline ones were at issue, as viscoelastic effects were negligible and von Mises elasto-plasticity was a reliable approach for constitutive description. In this context it should be emphasized that reliable relations for level II contact conditions—pertinent to polymers—have not been presented or validated previously in the literature. Both the theoretical/numerical and experimental results were valid for cone scratching with β = 22°, see Figure 2 for the indenter geometry, and classical elasto-plasticity was relied upon as a foundation for the constitutive behavior.

2. Theoretical Background

The outline of the theory below is—essentially—a repetition of the foundation laid down previously by Larsson [23,24]. This presentation is, therefore, very brief. The main objective of the present investigation was instead to determine, by comparison with pertinent previous experimental results, the validity of the closed-form relations given by the theory.
The following features constituted the basis (and notation) for the issue at hand:
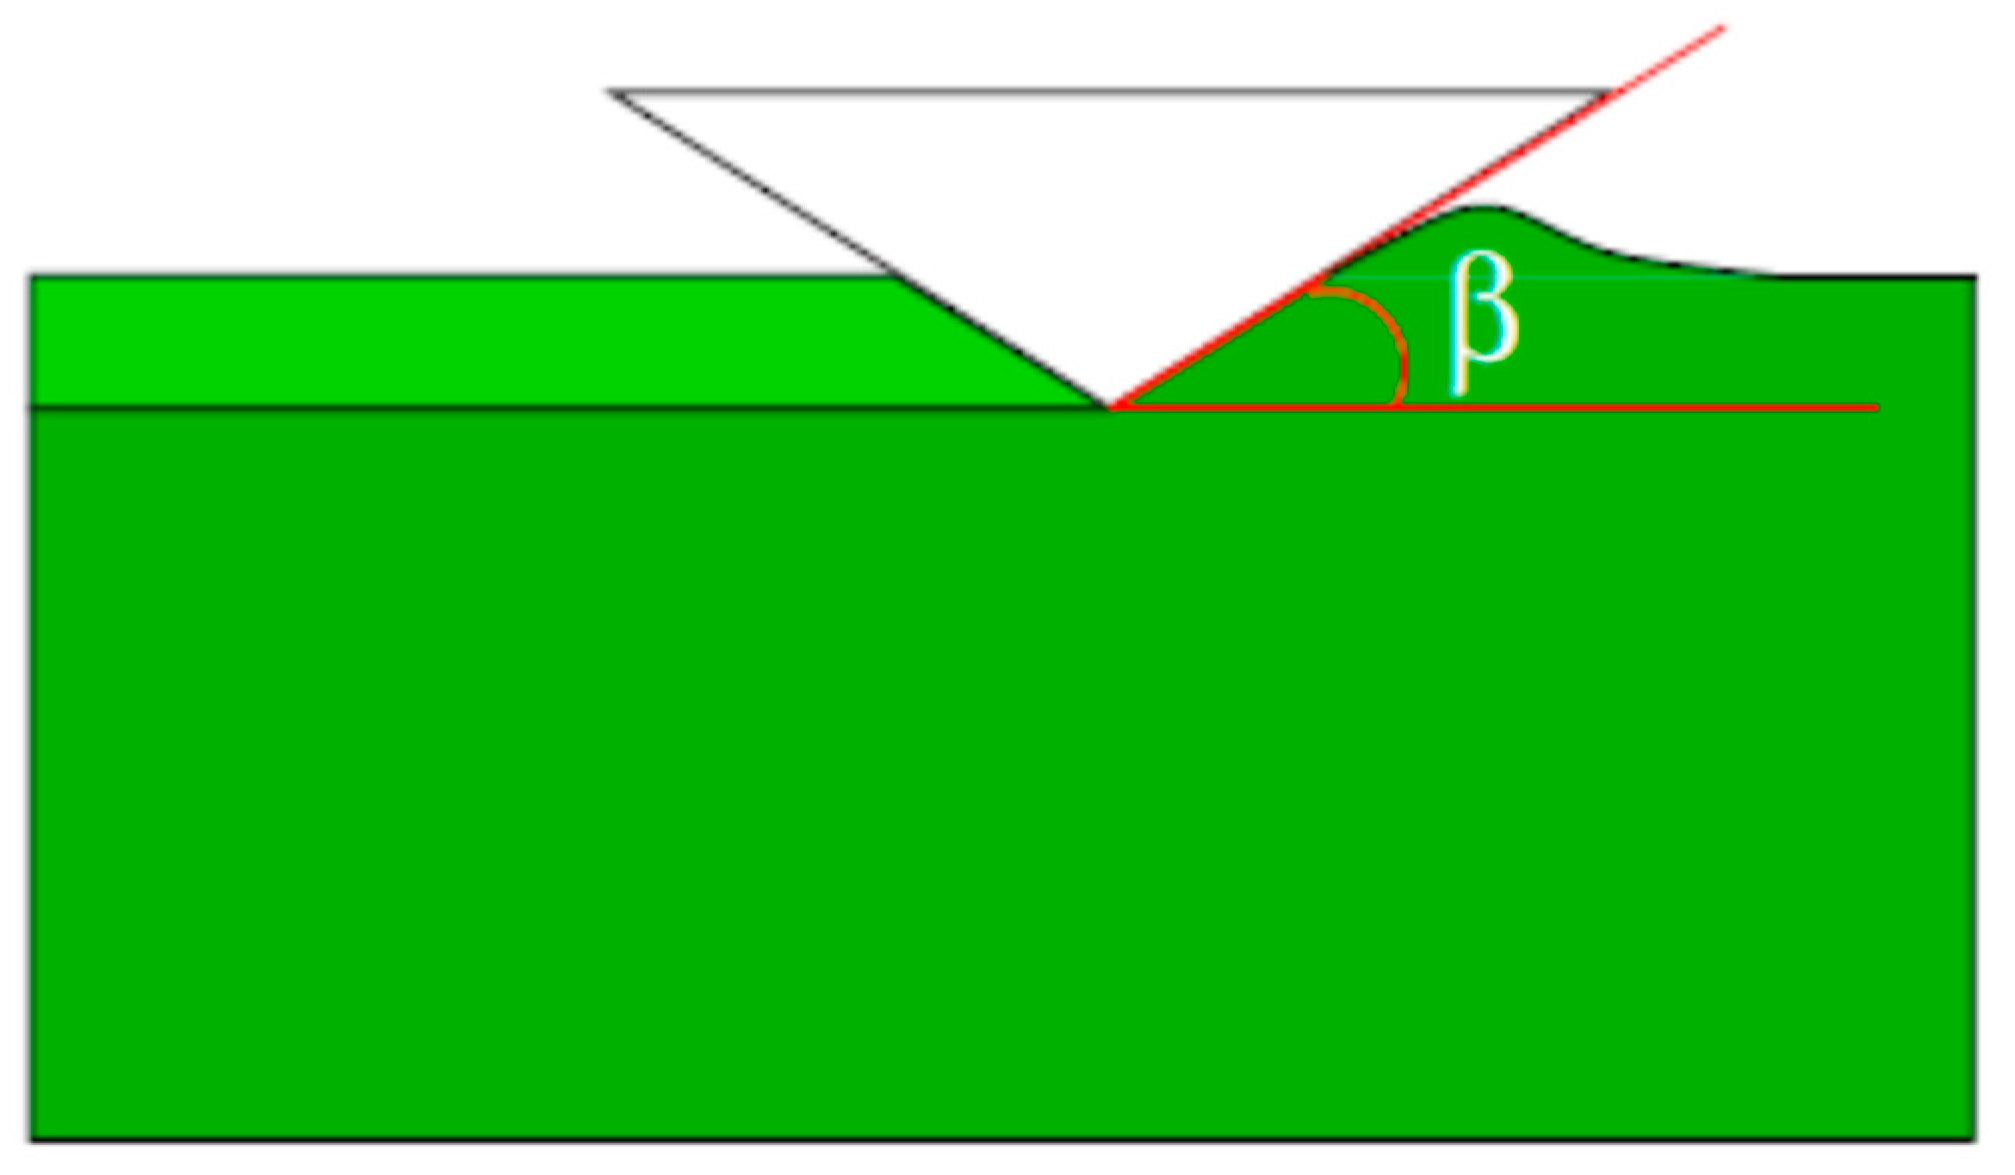
  • Scratching is performed with a sharp rigid cone indenter with β = 22°, see Figure 2 with definition of β. In this context it seems appropriate to define clearly the sharp indenter as a pointed upside-down cone with sufficiently small tip radius to ensure self-similarity conditions.
  • The indented material specimen is large and the material is monolithic.
  • Quasi-static and steady-state conditions are assumed.
  • The indentation depth h is defined positive in the negative surface normal direction.
  • An is the normally projected contact area between stylus and material, At the corresponding tangentially projected contact area, Pn is the normal contact load at scratching and Pt is the corresponding tangential load. This defines normal scratch hardness as:
    Hn = Pn/An
    and the tangential hardness as:
    Ht = Pt/At.
    Classical rate-independent elasto-plasticity, accounting for large deformations, is assumed to prevail with a power law strain-hardening behavior:
    σ(εp) = σY + σ0(εp)n
    where σ(εp) is the flow stress, σY is the initial yield stress, εp is, as previously stated, the effective plastic strain, and n is the hardening exponent.
  • The representative stress value is defined as:
    σrep = σ(εrep),
    where εrep is the effective strain at a representative value of the plastic strain.
It should be emphasized that with this foundation there is no characteristic length introduced and, consequently, the problem is self-similar with scratch hardness, independent of indentation depth h. From finite element simulations, it was then shown by Larsson [23] that the normal scratch hardness correlates well with the Johnson parameter Λ, according to:
Ĥn = Hn/σrep = 0.75 + 0.583lnΛ (Level II, Λ ≤ 20 approximately)
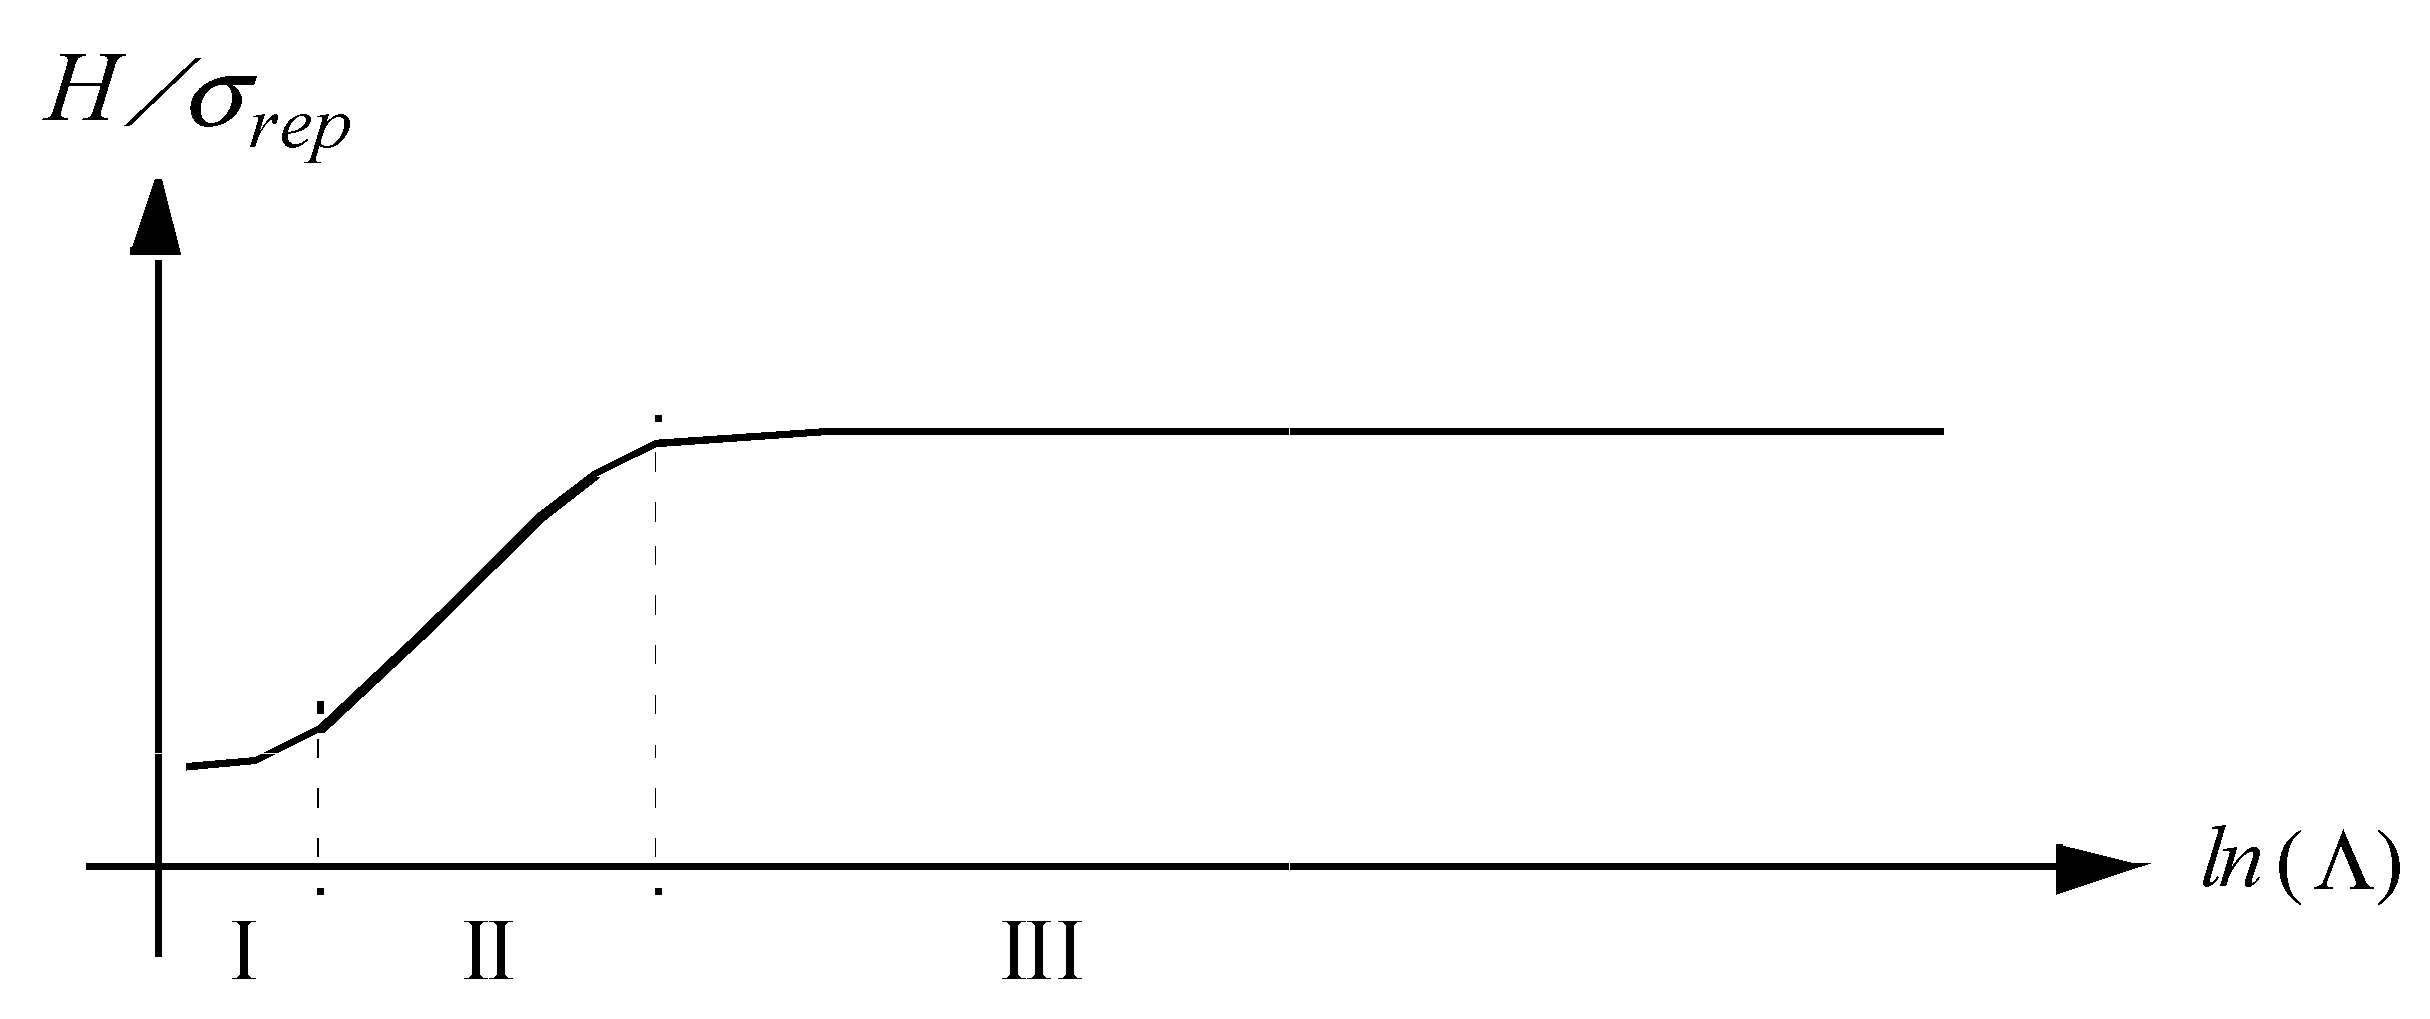
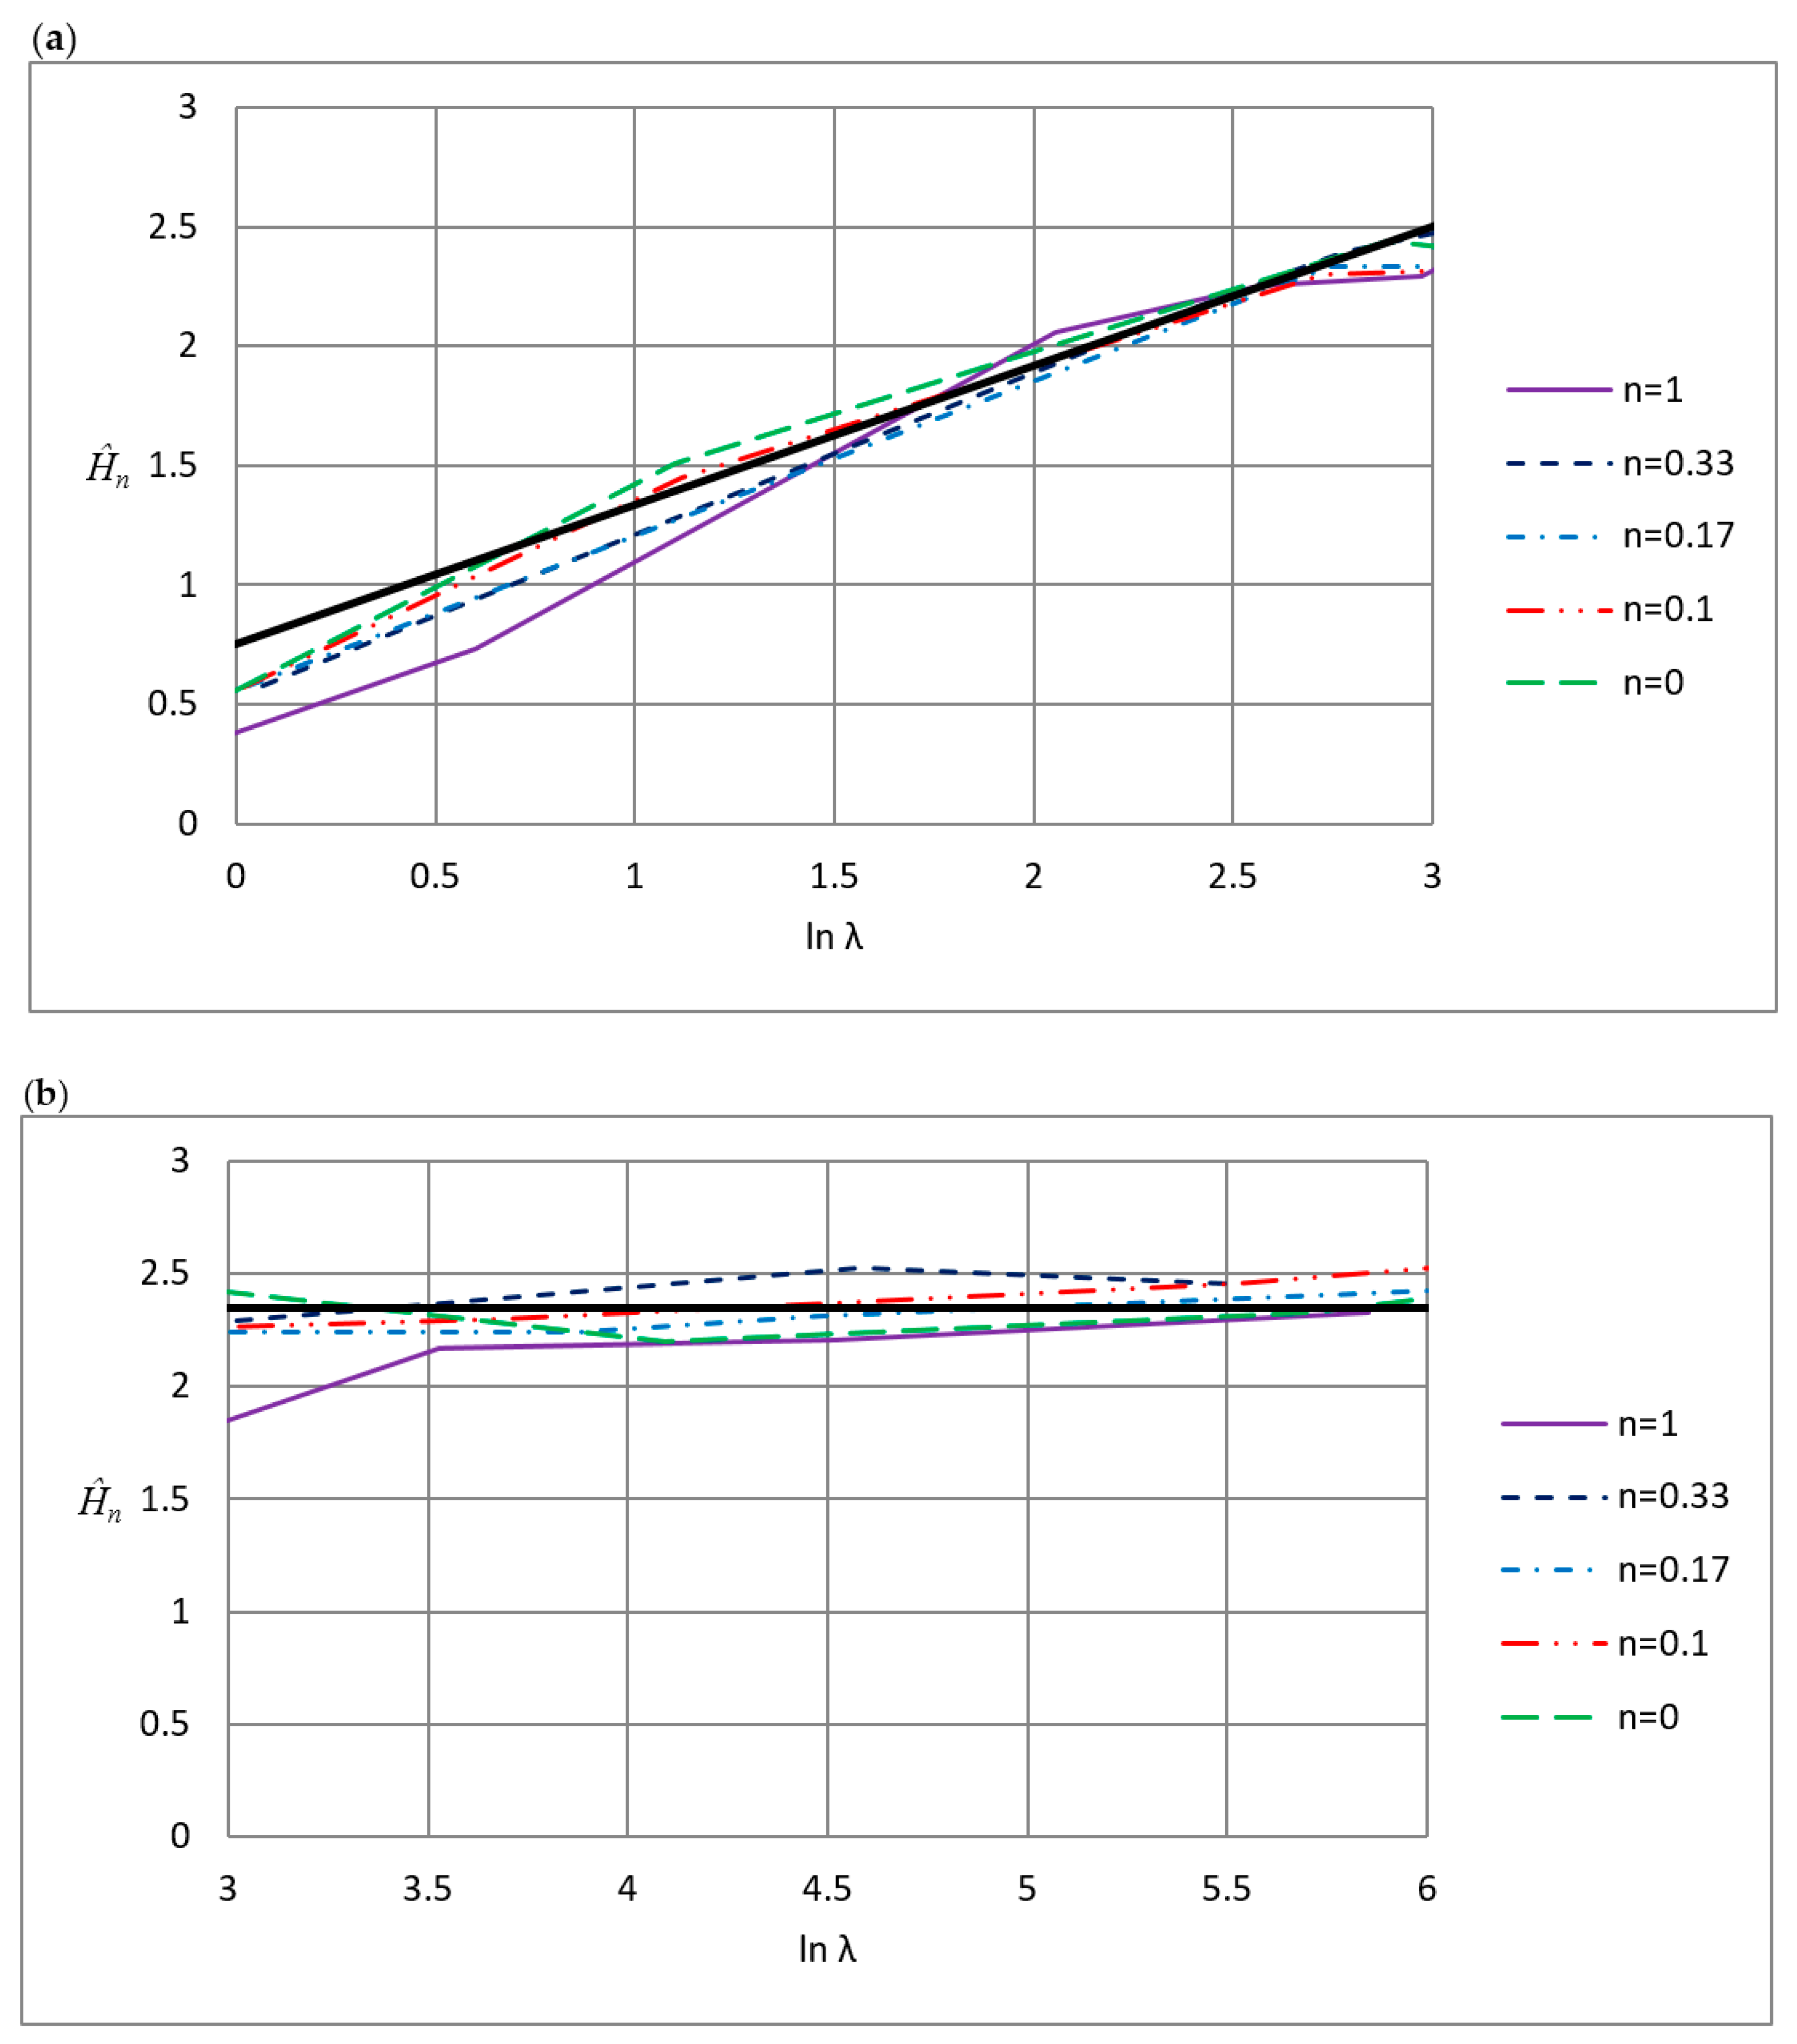
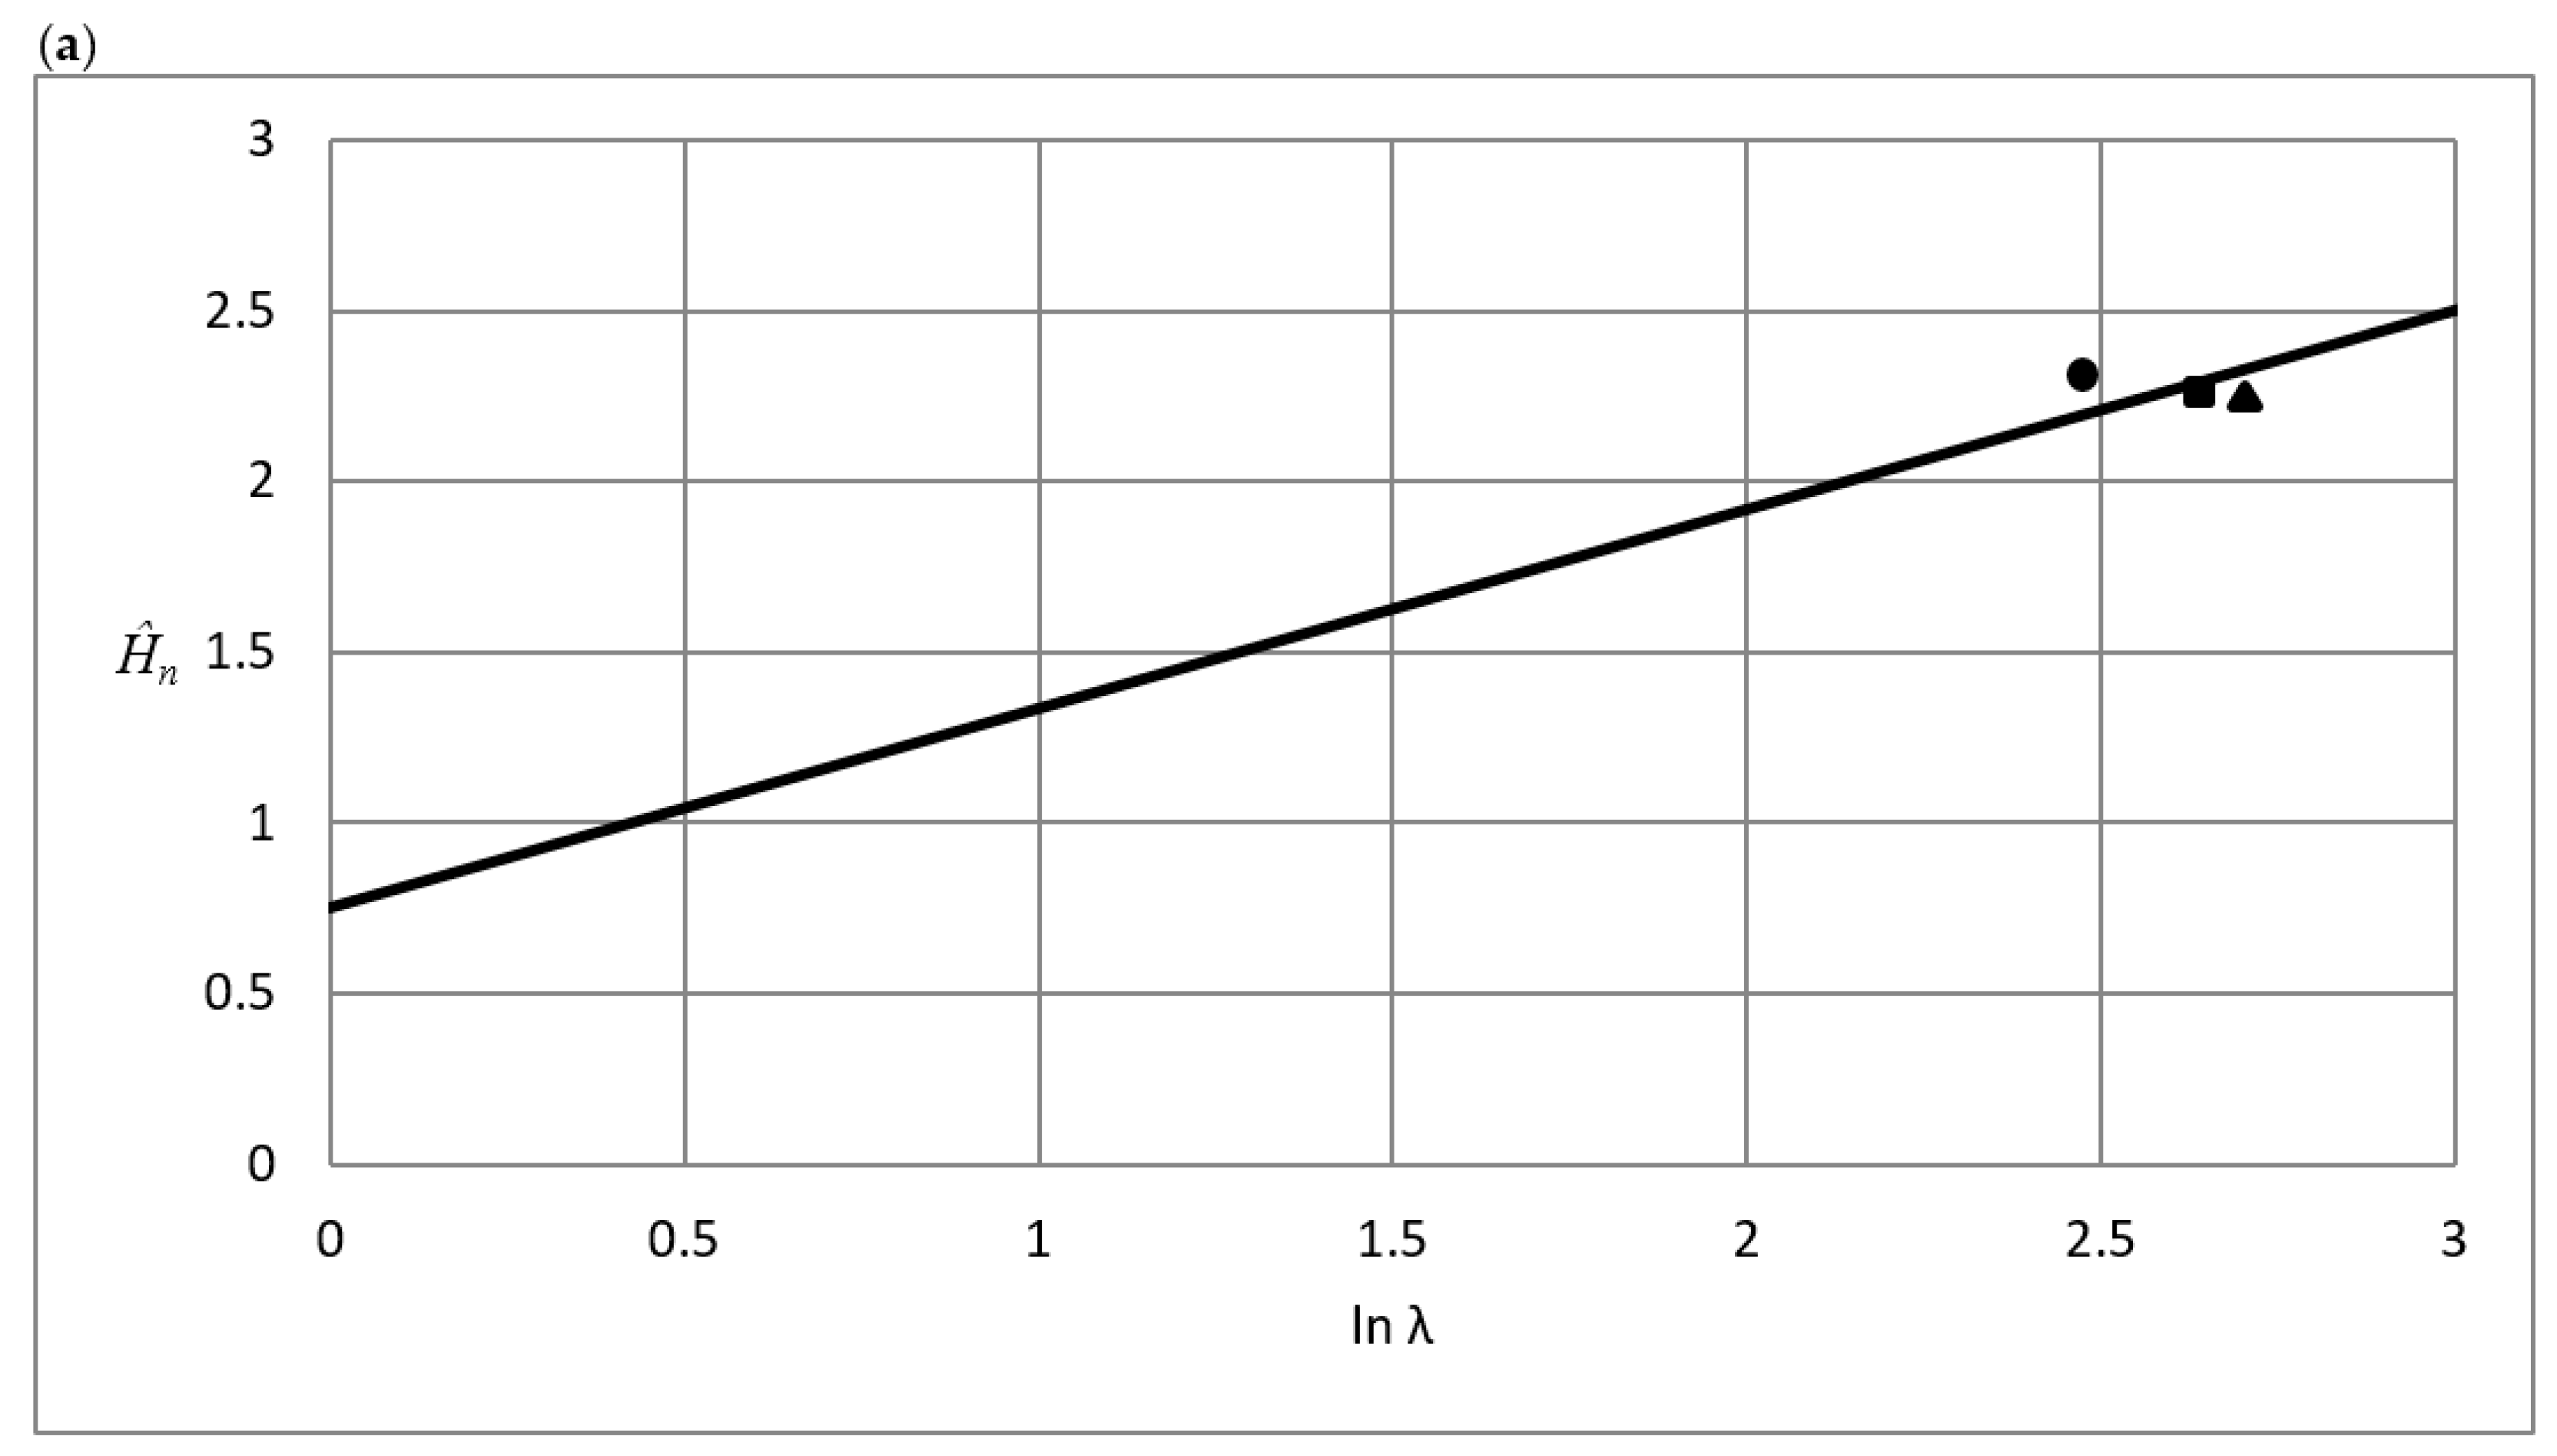
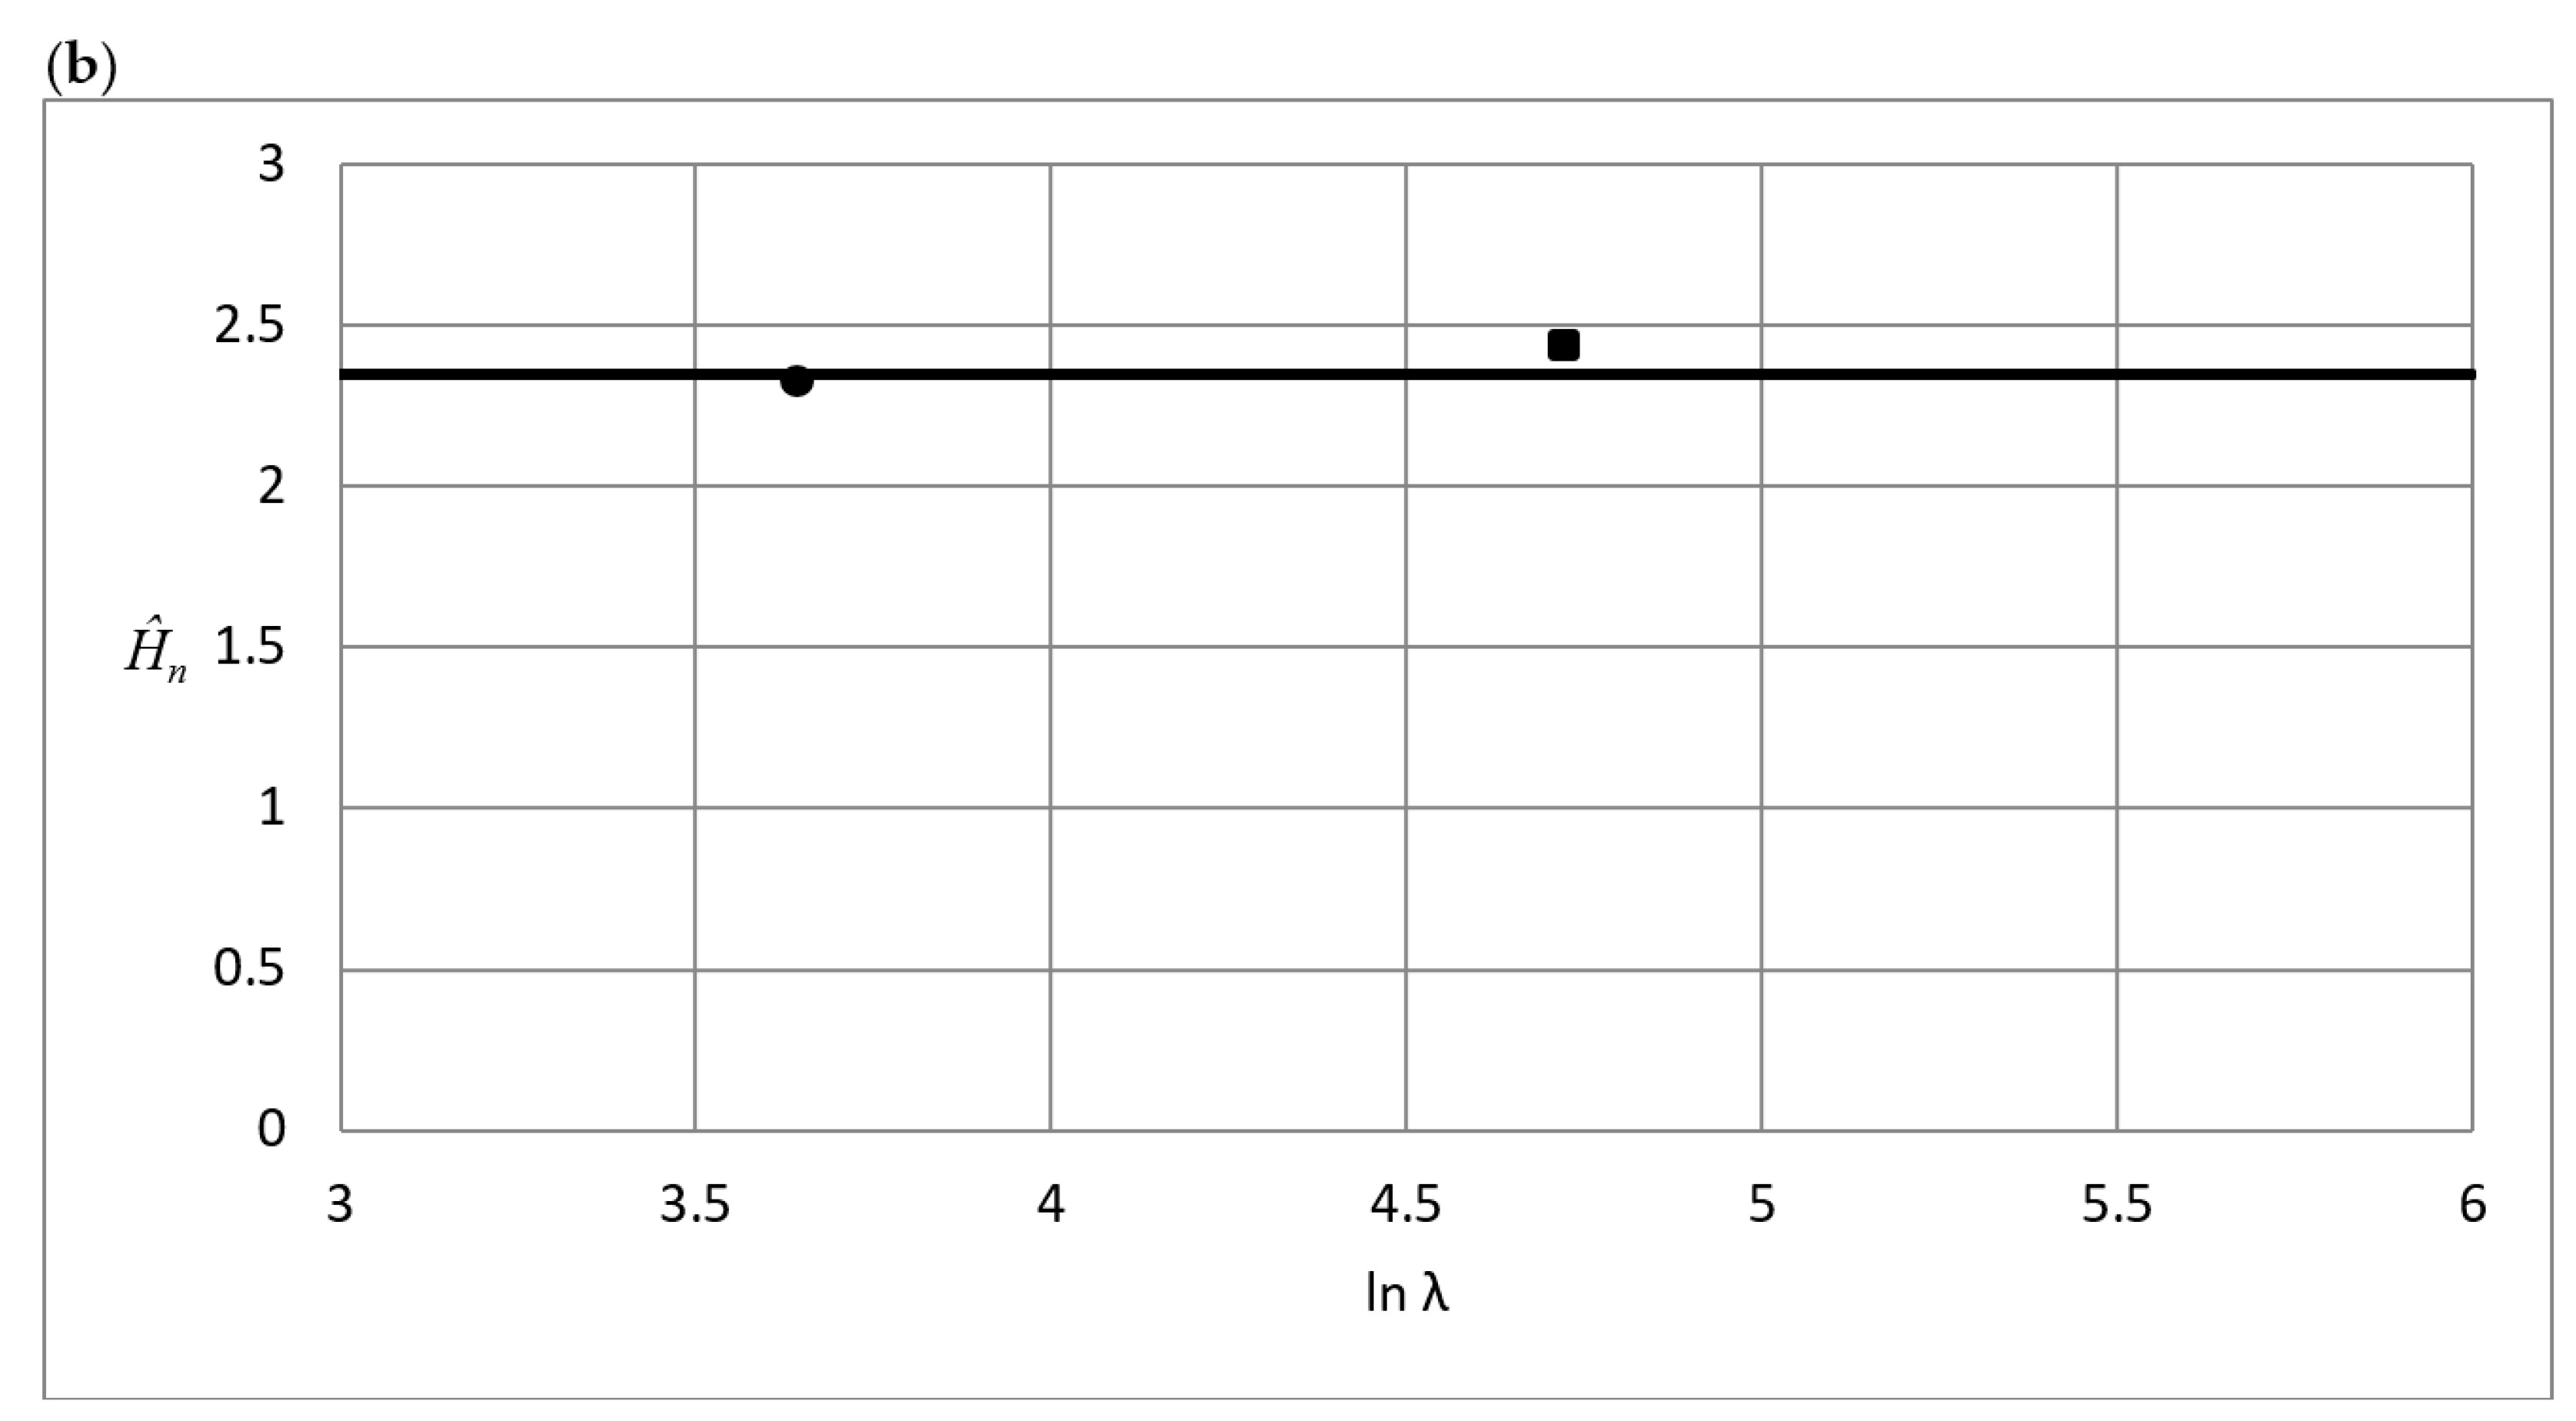
Ĥn = Hn/σrep = 2.35 (Level III, Λ ≥ 25 approximately)
with the choice of representative stress in Equation (1) being:
σrep = σ(εp = 0.25) (Level II, Λ ≤ 20 approximately)
σrep = σ(εp = 0.39) (Level III, Λ ≥ 25 approximately)
Corresponding results for the tangential hardness were derived in a similar manner in [24]. Explicitly, these relations read:
Ĥt = Ht/σrep = −0.605 + 0.822lnΛ (Level II, Λ ≤ 20 approximately)
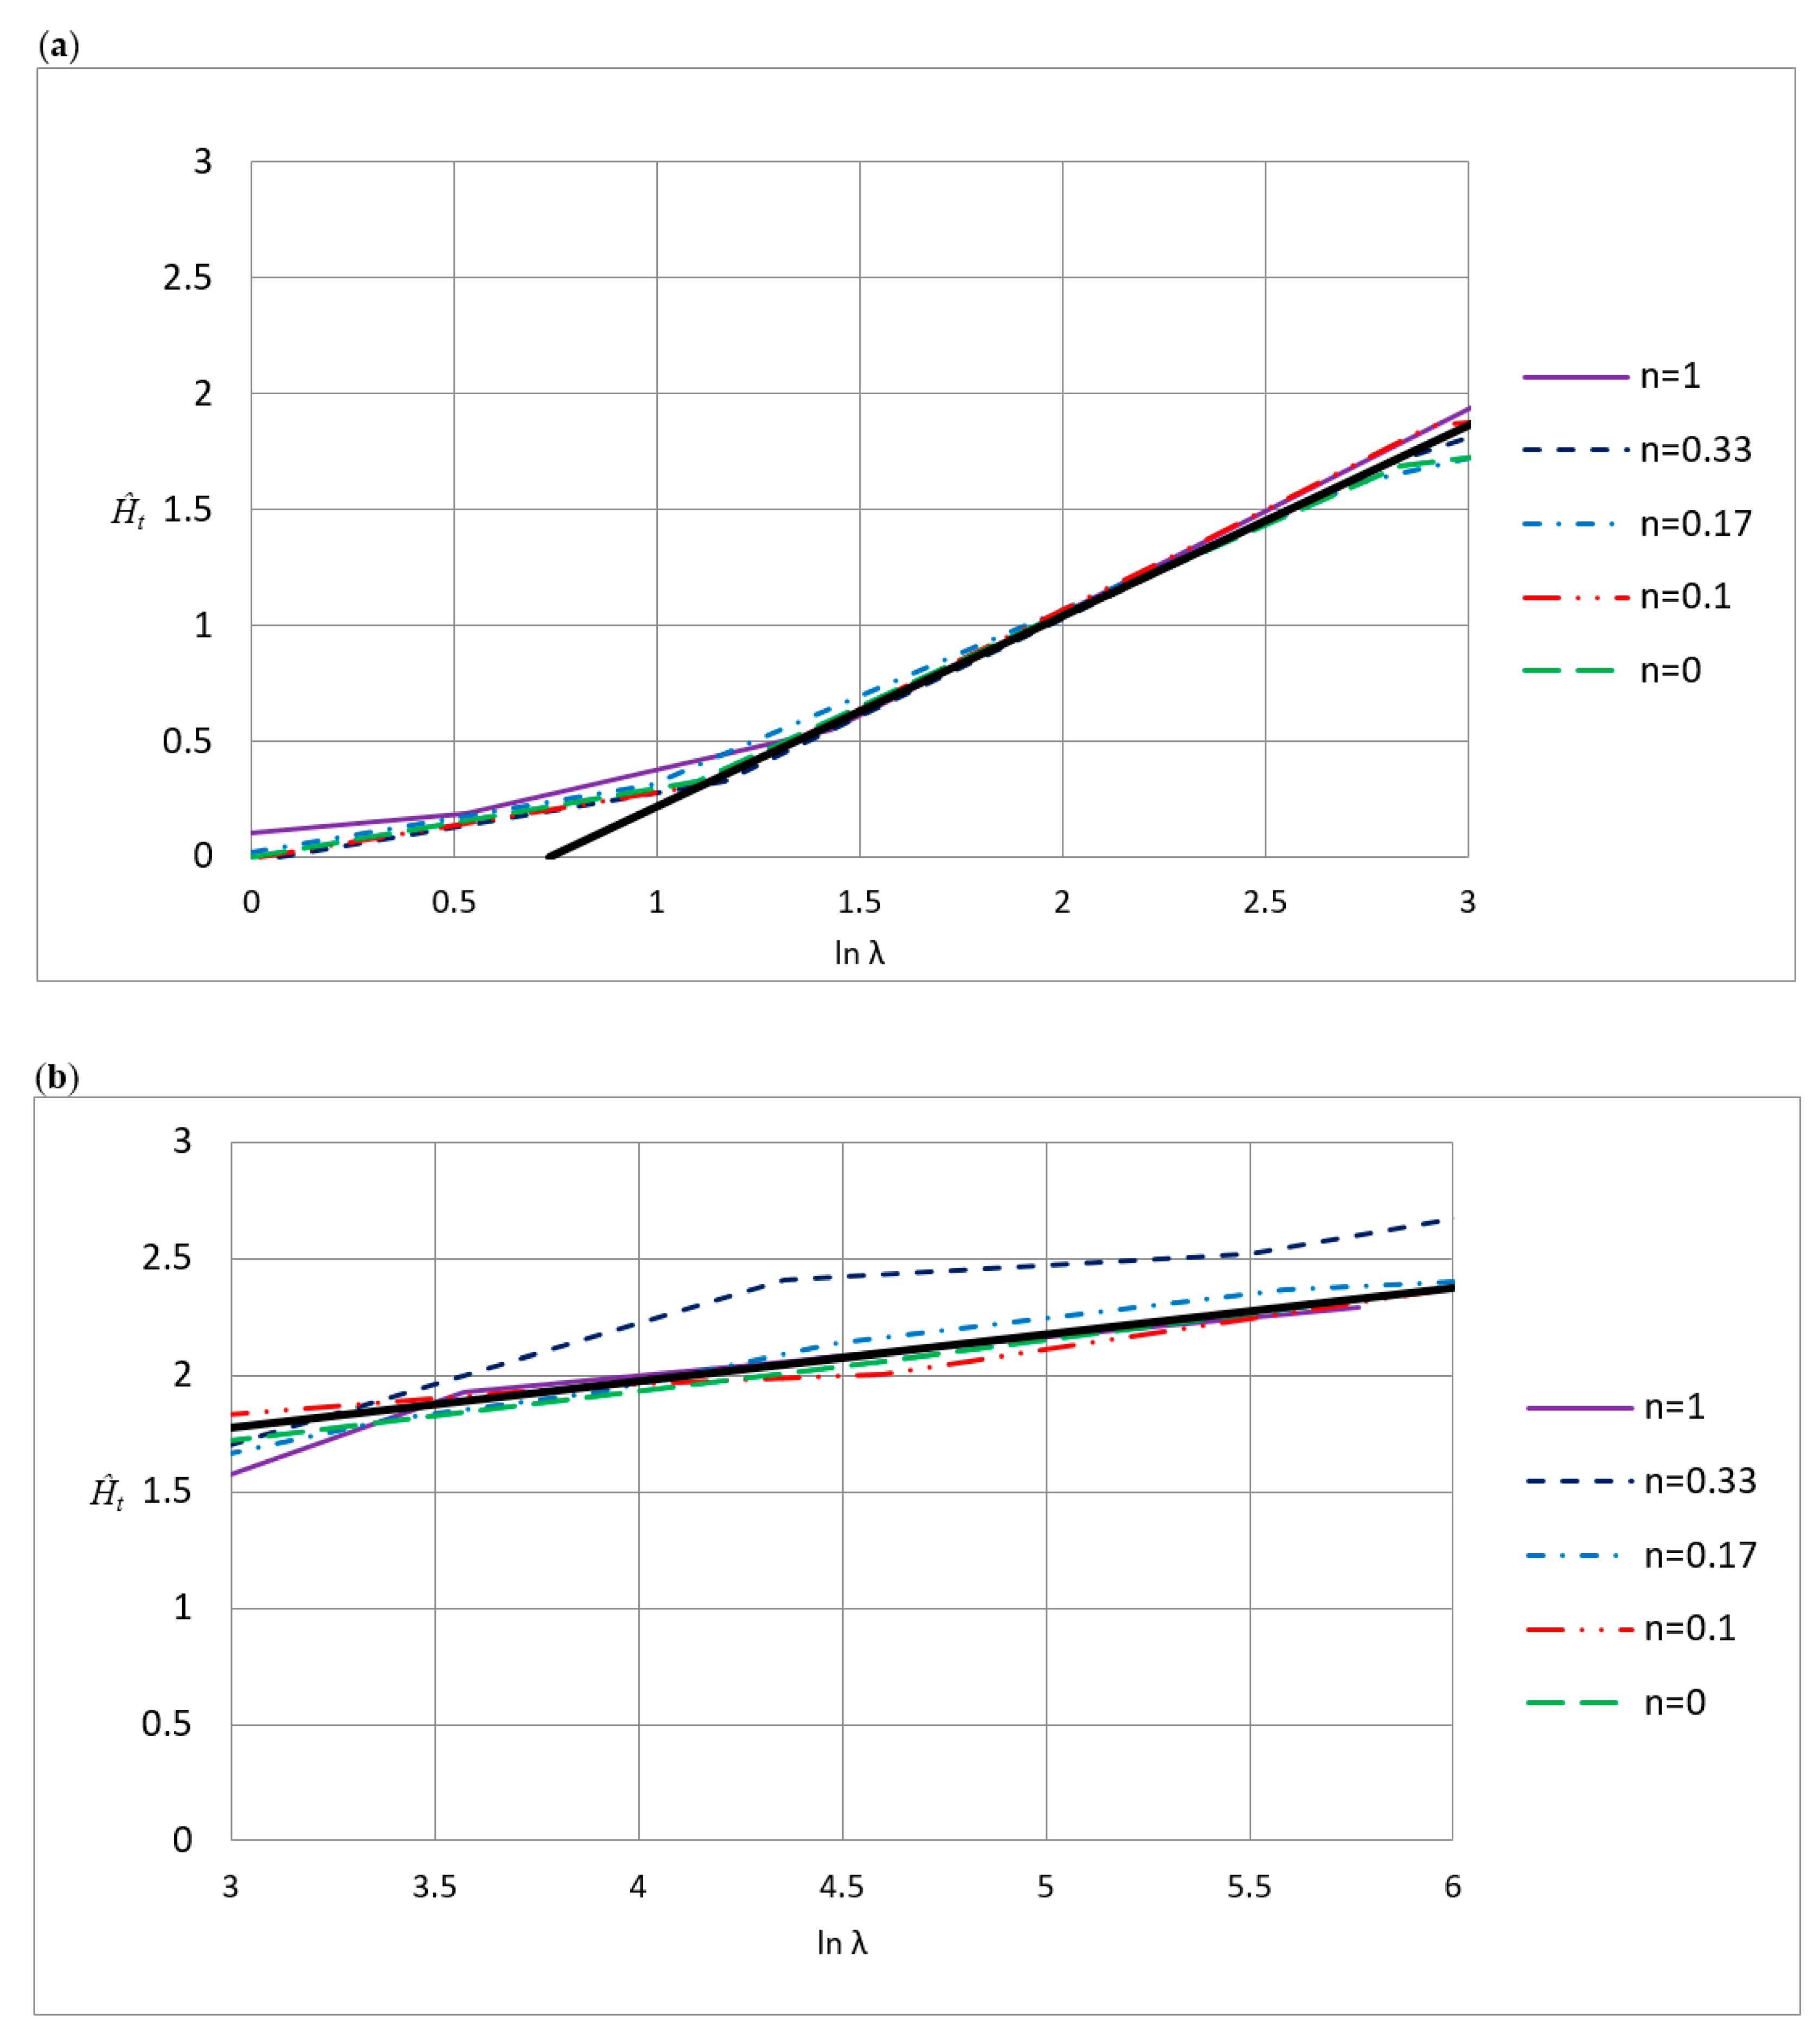
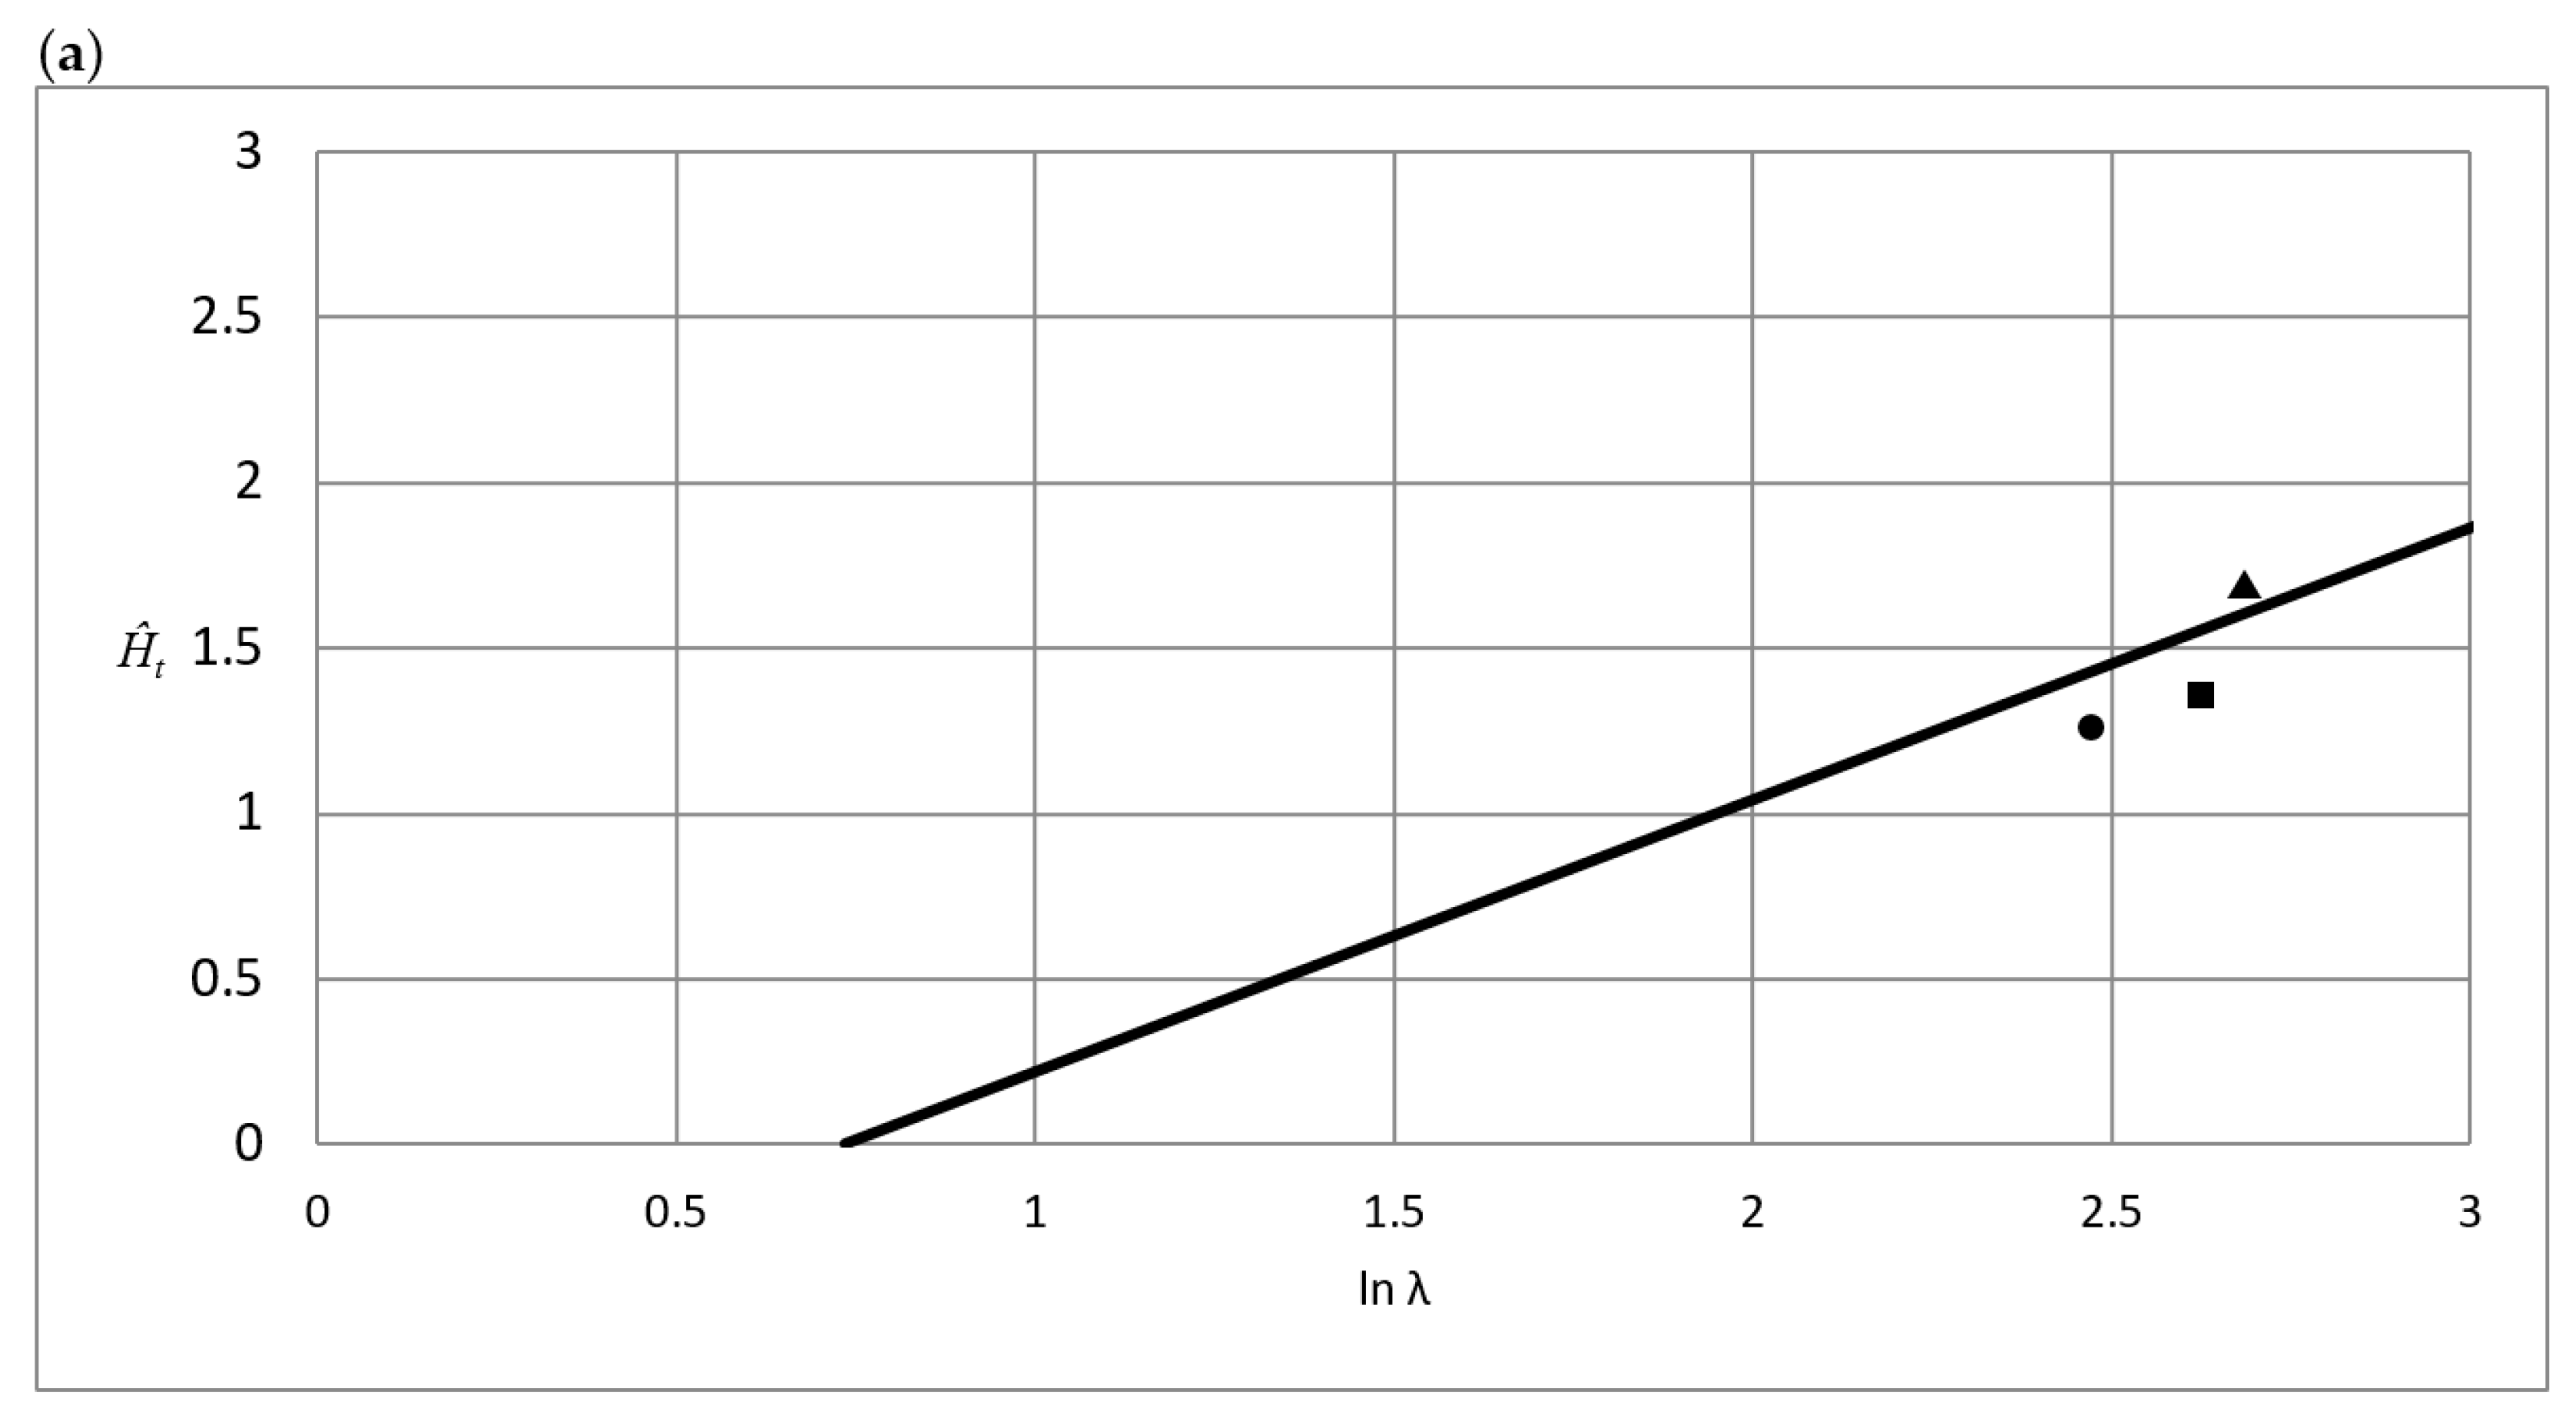
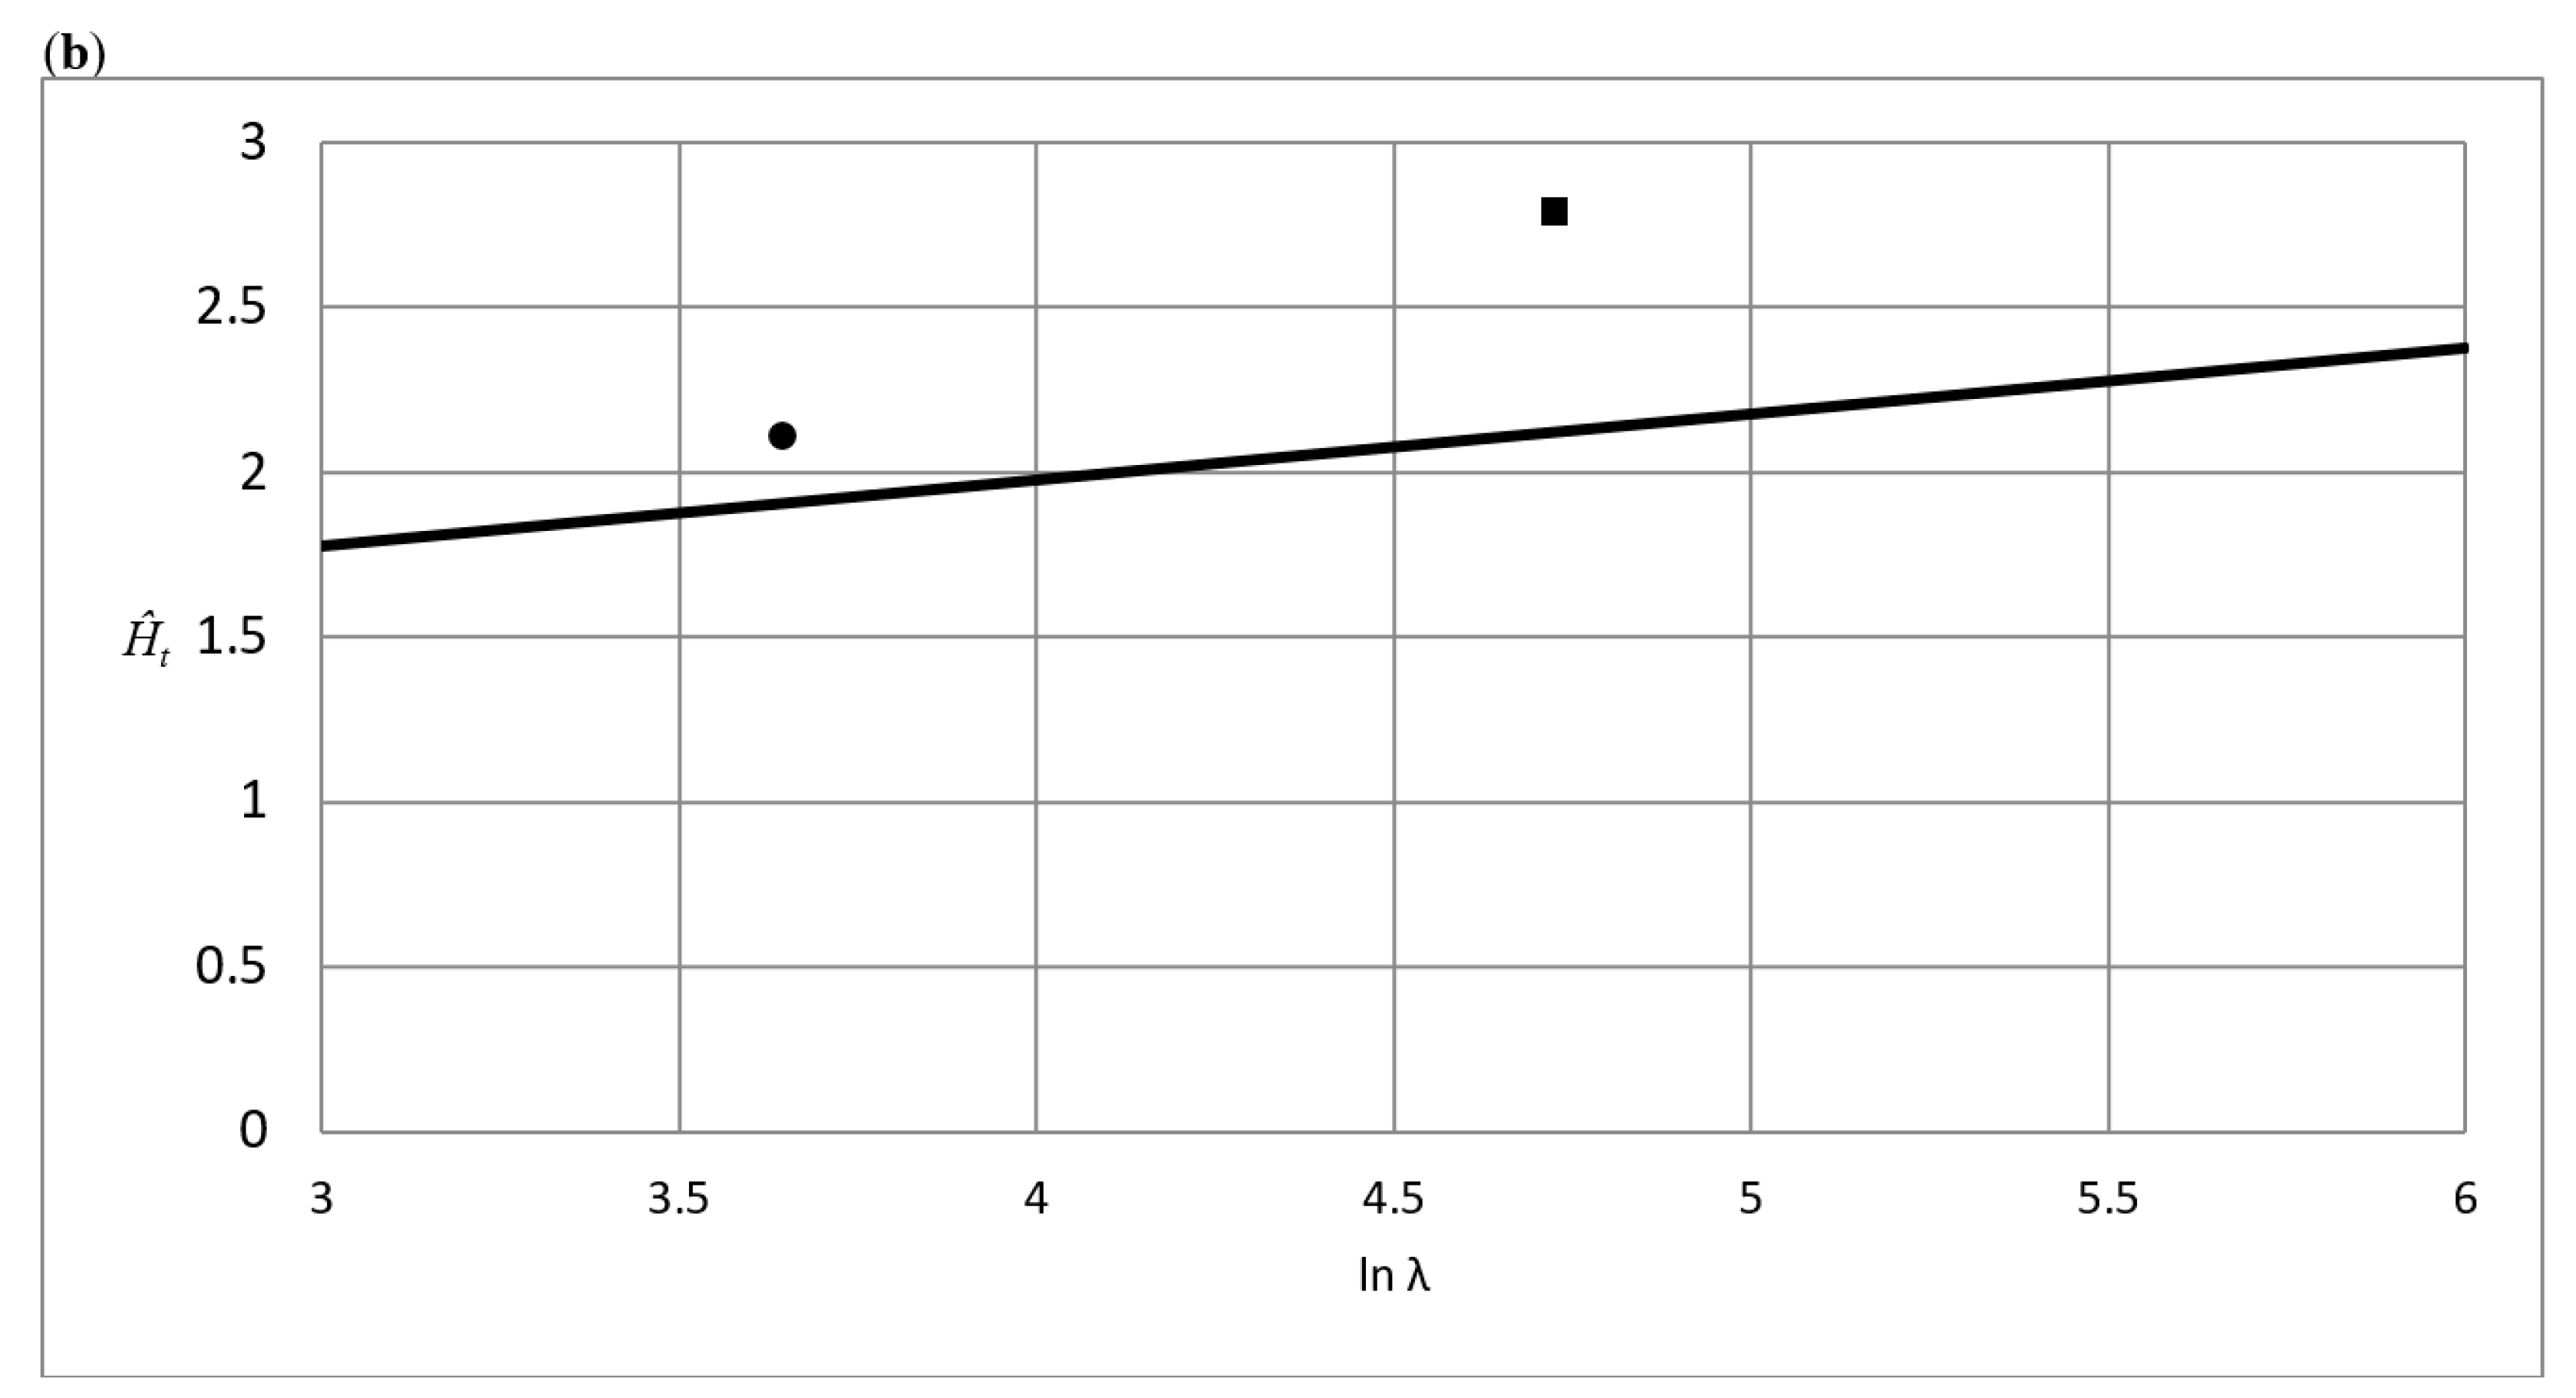
Ĥt = Ht/σrep = 1.175 + 0.2lnΛ (Level III, Λ ≥ 25 approximately)
with the same choice of representative stress as in Equation (9) for the normal hardness.
As, for example, frictional effects were not included in the analysis leading to Equations (8) and (10), it goes almost without saying that experimental verification is crucial. This was also attempted below, pertinent to materials described in the next section.

3. Experiments and Materials

In [20], cone scratching with an indenter angle β = 22° (see Figure 2) was performed on five different materials—including 3 polymers and 2 metals. A diamond indenter was used in order to secure, as much as possible, a non-deforming stylus. The tip radius of the indenter was measured to be 20 μm, which was sufficiently small (in comparison to the indentation depth at scratching) to ensure that self-similarity prevailed during the tests. The normal and tangential forces were recorded and, among other things, normal and scratch hardness were determined based on the measured contact area. A detailed description of the experimental procedure can be found in [20] (see in particular Section 3.1 in [20]).
It deserves a mention that, once again, the intention of the present study was to determine the validity of the theoretically derived closed-form relations presented above. This was done by comparing these theoretical results to the corresponding experimental ones from [20], as discussed in this section.
A complete mechanical description of the materials is shown in Table 1. The strain hardening behavior of the materials—as detailed in [20]—has been defined here by the values of the two representative stresses as specified in Equation (9).

4. Results and Discussion

As mentioned above, in this section the predictions from [23,24]—as detailed in Equations (8) and (10)—were compared with the corresponding experimental results presented in [20]. The experimental scratch hardness values, presented and discussed below, were averages taken from the experiments, and standard deviations have not been shown here for brevity but have been clearly presented in [20].
Figure 3 and Figure 4 describe the theoretical/numerical results which led to the relations in Equations (8) and (10). This is done in Figure 3 and Figure 4. In doing so, the representative stress measures in all the below figures are those presented in Equation (9), separated based on the type of contact condition (level II or level III).
In Figure 3a, pertinent to level II contact, and Figure 3b, pertinent to level III contact, the results for the nondimensionalized normal hardness Ĥn are shown as first presented in [23]. Results for different values on the power law exponent n in Equation (6) are depicted, together with the predictions from Equation (8). According to Equation (9) then, in Figure 3a, σ(εp = 0.25) was used as a representative stress and, correspondingly, σ(εp = 0.39) was used in Figure 3b. Except for very low values on ln Λ, where elastic level I contact effects intervened, the different curves clearly come together as a single universal curve with good accuracy. This universal curve is then represented by Equation (8) with the representative stresses as detailed in Equation (9).
In Figure 4, the corresponding results for the nondimensionalized tangential hardness Ĥt are shown as first presented in [24]. Again, results for different values on the power law exponent n in Equation (6) are depicted, together with the predictions from Equation (10). In the same way as above, according to Equation (9), in Figure 4a, σ(εp = 0.25) was used as a representative stress and, correspondingly, in Figure 4b, σ(εp = 0.39) was used. In this case, a universal curve can be determined with good accuracy, based on the representative stresses chosen in Equation (9) (the sole singular exception being n = 0.33 at level III scratching). It should be noted in passing that, in contrast to the situation for the normal scratch hardness, the tangential hardness shows a clear dependence of ln Λ—also in the level III contact regime.
The main purpose of the present study was to determine if the universal results in Figure 3 and Figure 4—and specifically, then, the relations presented in Equations (8) and (10)—were sufficient enough to predict experimental results for the materials presented and described in Table 1. Consequently, the representative stresses determined according to Equation (9) were used to determine the experimental values on nondimensionalized normal and tangential hardness for the materials in Table 1, and then compared with the predictions from Equations (8) and (10). The outcome of this comparison is detailed in Figure 5 and Figure 6.
In Figure 5a, results for the nondimensionalized normal scratch hardness are shown for level II contact conditions. This corresponds to upper Equation (8), which can be identified as the continuous straight line in the figure. Corresponding experimental results for the three polymers in Table 1 are also shown. Clearly, the agreement between predictions and experiments was very good.
Corresponding results for rigid plastic (level III) contact are shown in Figure 5b. Again, the agreement between predictions (lower Equation (8)) and experimental results (for aluminum and steel in Table 1) was very good. Accordingly, based on the results in Figure 5, it can be concluded that Equation (8), with representative stresses according to Equation (9), provides an accurate tool for predictions of normal scratch hardness values. At least so when the material behavior can be described by classical von Mises elasto-plasticity.
In Figure 6a then, results for the nondimensionalized tangential scratch hardness are shown for level II contact conditions. In this case, the agreement between predictions—represented by upper Equation (10)—and experimental results for the three polymers in Table 1 was very good. Indeed, any difference between the two sets of results can be explained by frictional effects that should be slightly more pronounced for the tangential contact problem.
Finally, then, in Figure 6b, rigid plastic contact results are shown for the tangential hardness. Unfortunately, in this case, the agreement between predictions and experimental results was not good. For example, the difference between the two sets of results for the stainless steel was more than 25%. Most likely, this was due to influence from remaining elastic deformations (“level II effects”) but another possible reason for this discrepancy is the combined effect from friction and piling-up of material in-front of the conical stylus. The latter feature is particularly dominant at rigid-plastic conditions, cf. [13]. However, in a parallel investigation [25] the corresponding frictional behavior at scratching was investigated and no clear explanation for the behavior in Figure 6b could be determined based on this feature. Other effects that could have caused the discrepancies in Figure 6b are fracture and/or delamination [26,27]. At present though, this matter is left for future studies.
The results shown in Figure 6b are certainly a drawback. Despite this, the present results are encouraging as they suggest that the relations explicitly shown in Equations (8) and (10) are sufficient (in most cases) for an accurate prediction of global scratch quantities, regardless of whether the contact behavior corresponds to level II or level III contact. This is certainly an important practical application of the present study. It is also of practical importance to emphasize that these relations (Equations (8) and (10)) can be used as a tool for material characterization based on the experimentally determined values of the global scratch quantities.
In summary, the objective of the present investigation was to determine the validity of the theoretical relations presented in [23,24] pertinent to normal and tangential scratch hardness. This was done by comparing the theoretical results with corresponding previous experimental findings [20]. It was indeed encouraging to find that for level II contact conditions (but also for level III contact conditions in case of normal scratch hardness), in particular, very good agreement was found between theory and experiments. Accordingly, the present findings are very much important for semi-crystalline solids pertinent to level II contact, which are well-described by von Mises elasto-plasticity, remembering that time-dependence is less of an issue for such materials. The validation performed here has, to the author’s knowledge, not been attempted previously—at least not for the general case including both normal and tangential scratch hardness at both level II and level III contact conditions.

5. Conclusions

Global quantities (i.e., normal and tangential hardness) at scratch testing have been studied. It has been shown previously that correlation can be achieved by using a combination of stresses at different levels of plastic strains to define representative quantities at scratching. In this study, these theoretical correlational relations were compared to experimental results for different material behavior pertinent to polymers, as well as metals. In general, very good agreement was found between the two sets of results, except for the singular case of tangential scratch hardness values at contact conditions where plastic deformations were dominating close to the indenter. This would suggest that the validated relations are of novel and particular importance for semi-crystalline polymers, accurately described by von Mises elasto-plasticity, for which plastic and elastic deformations are of equal magnitude in the contact region. The most important practical consequence of the present work, perhaps, together with the obvious advantage of being able to accurately predict explicit values on global scratch quantities, concerns the fact that the validated relations provide a tool to accurately use scratch testing for the purpose of mechanical characterization of materials. In particular, this tool is available for materials pertinent to both elasto-plastic (semi-crystalline polymers and ceramics) and rigid plastic (metals) contact conditions at scratching.

Funding

The author wants to acknowledge the funding through grant 621-2005-5803 from the Swedish Research Council.

Conflicts of Interest

The author declare no conflicts of interest.

References

  1. Sneddon, I.N. The relation between load and penetration in the axisymmetric Boussinesq problem for a punch of arbitrary profile. Int. J. Eng. Sci. 1965, 3, 47–57. [Google Scholar] [CrossRef]
  2. Tabor, D. Hardness of Metals; Cambridge University Press: Cambridge, UK, 1951. [Google Scholar]
  3. Johnson, K.L. The correlation of indentation experiments. J. Mech. Phys. Solids 1970, 18, 115–126. [Google Scholar] [CrossRef]
  4. Johnson, K.L. Contact Mechanics; Cambridge University Press: Cambridge, UK, 1985. [Google Scholar]
  5. Atkins, A.G.; Tabor, D. Plastic indentation in metals with cones. J. Mech. Phys. Solids 1965, 13, 149–164. [Google Scholar] [CrossRef]
  6. Bhattachharya, A.K.; Nix, W.D. Finite element simulation of indentation experiments. Int. J. Solids Struct. 1988, 24, 881–891. [Google Scholar] [CrossRef]
  7. Bhattachharya, A.K.; Nix, W.D. Analysis of elastic and plastic deformation associated with indentation testing of thin films on substrates. Int. J. Solids Struct. 1988, 24, 1287–1298. [Google Scholar] [CrossRef]
  8. Laursen, T.A.; Simo, J.C. A study of the mechanics of microindentation using finite elements. J. Mater. Res. 1992, 7, 618–626. [Google Scholar] [CrossRef]
  9. Giannakopoulos, A.E.; Larsson, P.L.; Vestergaard, R. Analysis of Vickers indentation. Int. J. Solids Struct. 1994, 31, 2679–2708. [Google Scholar] [CrossRef]
  10. Larsson, P.L.; Giannakopoulos, A.E.; Söderlund, E.; Rowcliffe, D.J.; Vestergaard, R. Analysis of Berkovich indentation. Int. J. Solids Struct. 1996, 33, 221–248. [Google Scholar] [CrossRef]
  11. Mesarovic, S.D.; Fleck, N.A. Spherical indentation of elastic-plastic solids. Int. J. Solids Struct. 2000, 37, 7071–7091. [Google Scholar] [CrossRef]
  12. Mesarovic, S.D.; Fleck, N.A. Frictionless indentation of dissimilar elastic–plastic spheres. Proc. R. Soc. Lond. A 1999, 455, 2707–2728. [Google Scholar] [CrossRef]
  13. Larsson, P.L. Investigation of sharp contact at rigid plastic conditions. Int. J. Mech. Sci. 2001, 43, 895–920. [Google Scholar] [CrossRef]
  14. Bucaille, J.L.; Felder, E.; Hochstetter, G. Mechanical analysis of the scratch test on elastic and perfectly plastic materials with three-dimensional finite element modeling. Wear 2001, 249, 422–432. [Google Scholar] [CrossRef]
  15. Bucaille, J.L.; Felder, E.; Hochstetter, G. Experimental and three-dimensional finite element study of scratch test of polymers at large deformations. J. Tribol. 2004, 126, 372–379. [Google Scholar] [CrossRef]
  16. Felder, E.; Bucaille, J.L. Mechanical analysis of the scratching of metals and polymers with conical indenters at moderate and large strains. Tribol. Int. 2006, 39, 70–87. [Google Scholar] [CrossRef]
  17. Bellemare, S.; Dao, M.; Suresh, S. The frictional sliding response of elasto-plastic materials in contact with a conical indenter. Int. J. Solids Struct. 2007, 44, 1970–1989. [Google Scholar] [CrossRef] [Green Version]
  18. Wredenberg, F.; Larsson, P.L. On the numerics and correlation of scratch testing. J. Mech. Mater. Struct. 2007, 2, 573–594. [Google Scholar] [CrossRef] [Green Version]
  19. Ben Tkaya, M.; Zidi, M.; Mezlini, S.; Zahouani, H.; Kapsa, P. Influence of the attack angle on the scratch testing of an aluminium alloy by cones: Experimental and numerical studies. Mater. Des. 2008, 29, 98–104. [Google Scholar] [CrossRef]
  20. Wredenberg, F.; Larsson, P.L. Scratch testing of metals and polymers—Experiments and numerics. Wear 2009, 266, 76–83. [Google Scholar] [CrossRef]
  21. Aleksy, N.; Kermouche, G.; Vautrin, A.; Bergheau, J.M. Numerical study of scratch velocity effect on recovery of viscoelastic-viscoplastic solids. Int. J. Mech. Sci. 2010, 52, 455–463. [Google Scholar] [CrossRef]
  22. Bellemare, S.; Dao, M.; Suresh, S. A new method for evaluating the plastic properties of materials through instrumented frictional sliding tests. Acta Mater. 2010, 58, 6385–6392. [Google Scholar] [CrossRef]
  23. Larsson, P.L. On the correlation of scratch testing using separated elastoplastic and rigid plastic descriptions of the representative stress. Mater. Des. 2013, 43, 153–160. [Google Scholar] [CrossRef]
  24. Larsson, P.L. On representative stress correlation of global scratch quantities at scratch testing of elastoplastic materials. Mater. Des. 2013, 49, 536–544. [Google Scholar] [CrossRef]
  25. Larsson, P.L. On the plowing frictional behavior during scratch testing: A comparison between experimental and theoretical/numerical results. Crystals 2019, 9, 33. [Google Scholar] [CrossRef]
  26. Larsson, P.L. On delamination buckling and growth in circular and annular orthotropic plates. Int. J. Solids Struct. 1991, 27, 15–28. [Google Scholar] [CrossRef]
  27. Hutchinson, J.W.; Suo, Z. Mixed mode cracking in layered materials. Adv. Appl. Mech. 1992, 29, 63–191. [Google Scholar]
Figure 1. Sketch of the characteristic behaviour at indentation [4]. The indentation hardness H divided by the representative stress σrep is plotted against the non-dimensional strain parameter Λ. The different levels at indentation are indicated.
Crystals 09 00154 g001
Figure 2. Schematic of the scratching problem. The angle β defines the geometry of the conical stylus where presently β = 22°. The scratch direction is from left to right.
Crystals 09 00154 g002
Figure 3. Normalized normal scratch hardness, Ĥn = Hn/σrep, as a function of ln Λ where Λ is the Johnson parameter defined in Equation (1). The results were taken from Larsson [23]. (a) The representative stress was determined from σrep = σ(εp = 0.25). The thick line represents upper Equation (8). (b) The representative stress was determined from σrep = σ(εp = 0.39). The thick line represents lower Equation (8).
Crystals 09 00154 g003
Figure 4. Normalized tangential scratch hardness, Ĥt = Hn/σrep, as function of ln Λ where Λ is the Johnson parameter defined in Equation (1). The results were taken from Larsson [24]. (a) The representative stress was determined from σrep = σ(εp = 0.25). The thick line represents upper Equation (10). (b) The representative stress was determined from σrep = σ(εp = 0.39). The thick line represents lower Equation (10).
Crystals 09 00154 g004
Figure 5. Normalized normal scratch hardness, Ĥn = Hn/σrep, as function of lnΛ where Λ is the Johnson parameter defined in Equation (1). Results taken from Wredenberg and Larsson [20]. (a) The representative stress was determined from σrep = σ(εp = 0.25). The thick line represents upper Equation (8). (●), experimental results for PMMA as detailed in Table 1. (■), experimental results for epoxy as detailed in Table 1. (▲), experimental results for vinyl ester as detailed in Table 1. (b) The representative stress was determined from σrep = σ(εp = 0.39). The thick line represents lower Equation (8). (●), experimental results for Al7050 as detailed in Table 1. (■), experimental results for stainless steel as detailed in Table 1.
Crystals 09 00154 g005aCrystals 09 00154 g005b
Figure 6. Normalized tangential scratch hardness, Ĥt = Ht/σrep, as function of lnΛ where Λ is the Johnson parameter defined in Equation (1). Results taken from Wredenberg and Larsson [20]. (a) The representative stress was determined from σrep = σ(εp = 0.25). The thick line represents upper Equation (10). (●), experimental results for PMMA as detailed in Table 1. (■), experimental results for epoxy as detailed in Table 1. (▲), experimental results for vinyl ester as detailed in Table 1. (b) The representative stress was determined from σrep = σ(εp = 0.39). The thick line represents lower Equation (10). (●), experimental results for Al7050 as detailed in Table 1. (■), experimental results for stainless steel as detailed in Table 1.
Crystals 09 00154 g006aCrystals 09 00154 g006b
Table 1. Material properties as presented by Wredenberg and Larsson [20] and utilized in the present analysis. The value on Young’s modulus is given in GPa, while all stress quantities are given in MPa. The parameter Λ as defined in Equation (1) is dimensionless.
MaterialEσYσ(εp = 0.25)σ(εp = 0.39) Λ(εp = 0.25)Λ(εp = 0.39)
Vinyl Ester3.51081081081515
PMMA2.91101101101212
Epoxy3.19797971414
Al70507056072481642.538
Stainless steel200560625805146113

