Investigation of Y2.1Er0.9(ScxGa1−x)5O12 Matrix Components on the Spectral Properties around 3.0 μm by Micro-Pulling-Down Method


Abstract
:1. Introduction
2. Materials and Methods
(x + y = 1)
3. Results
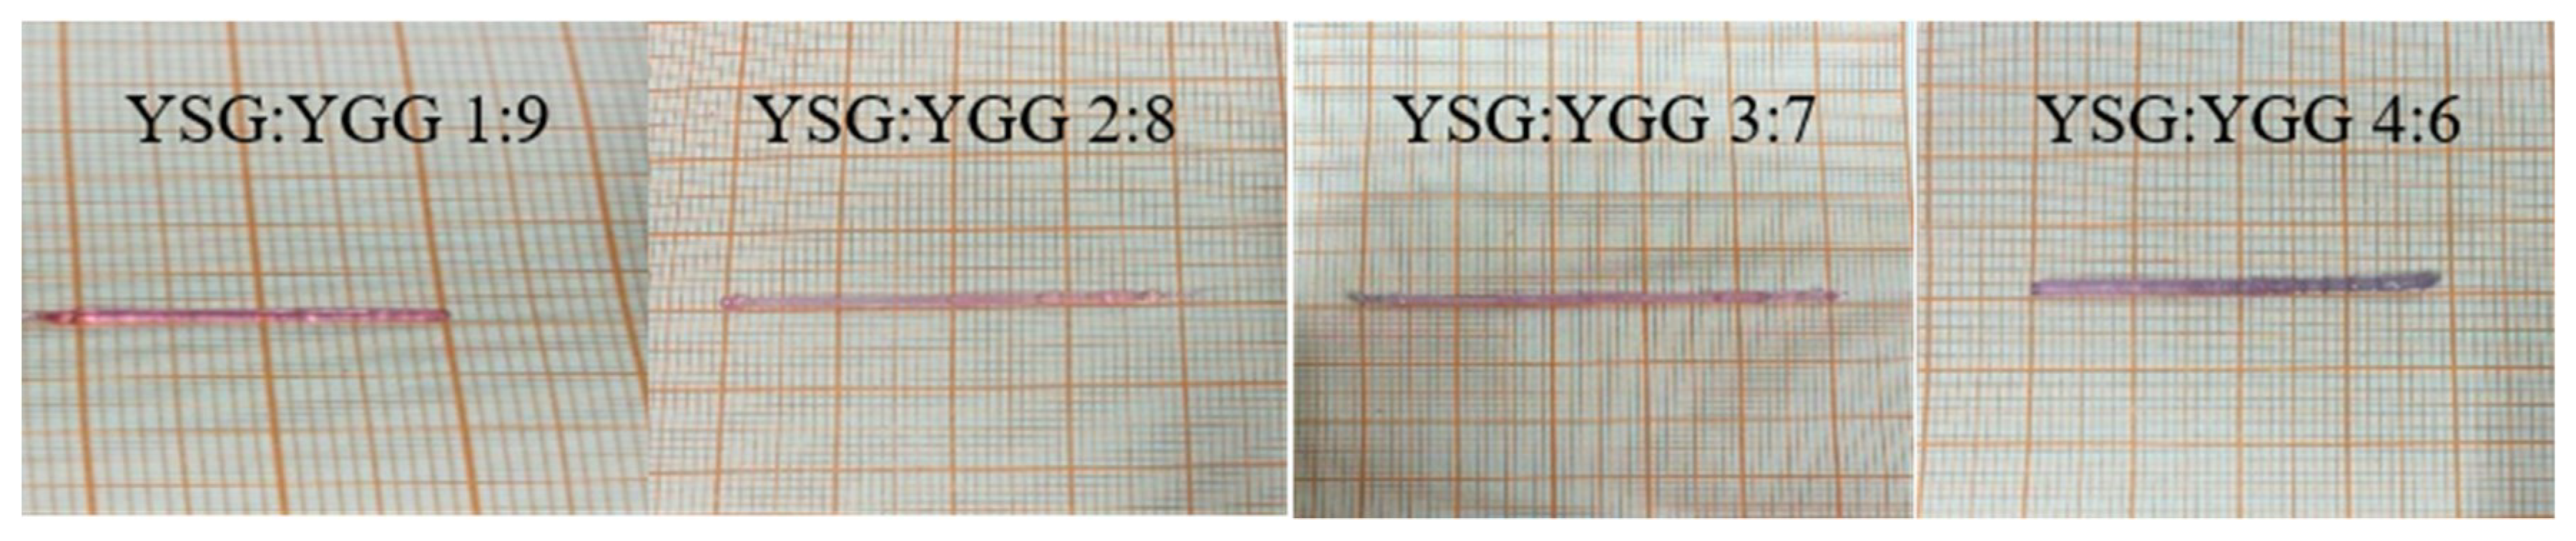
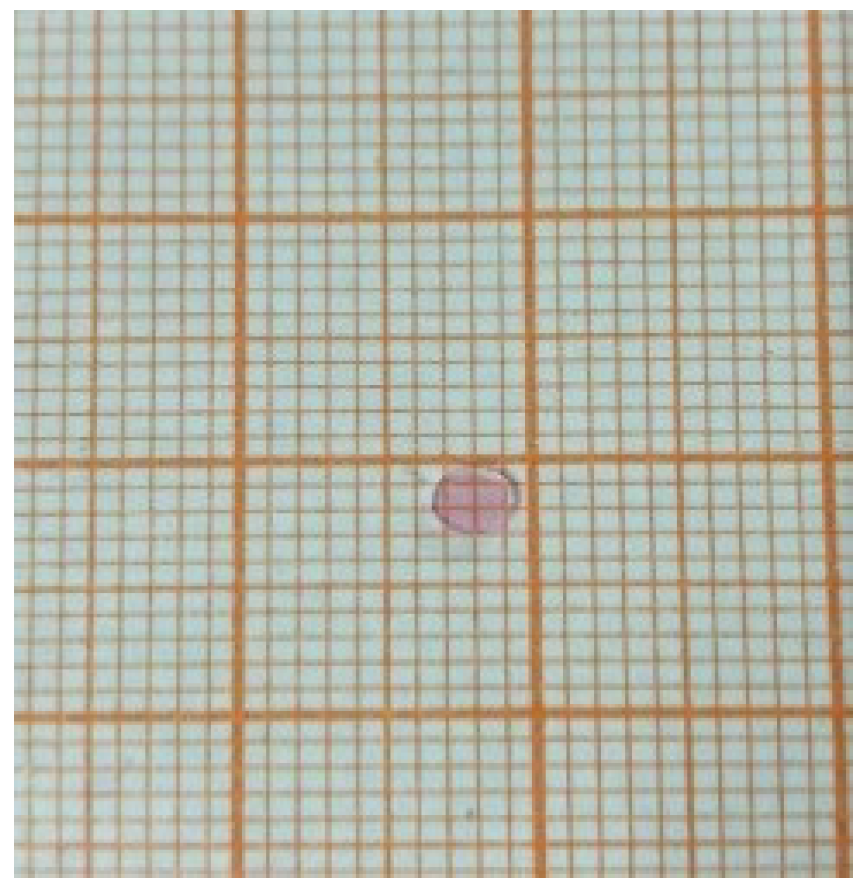
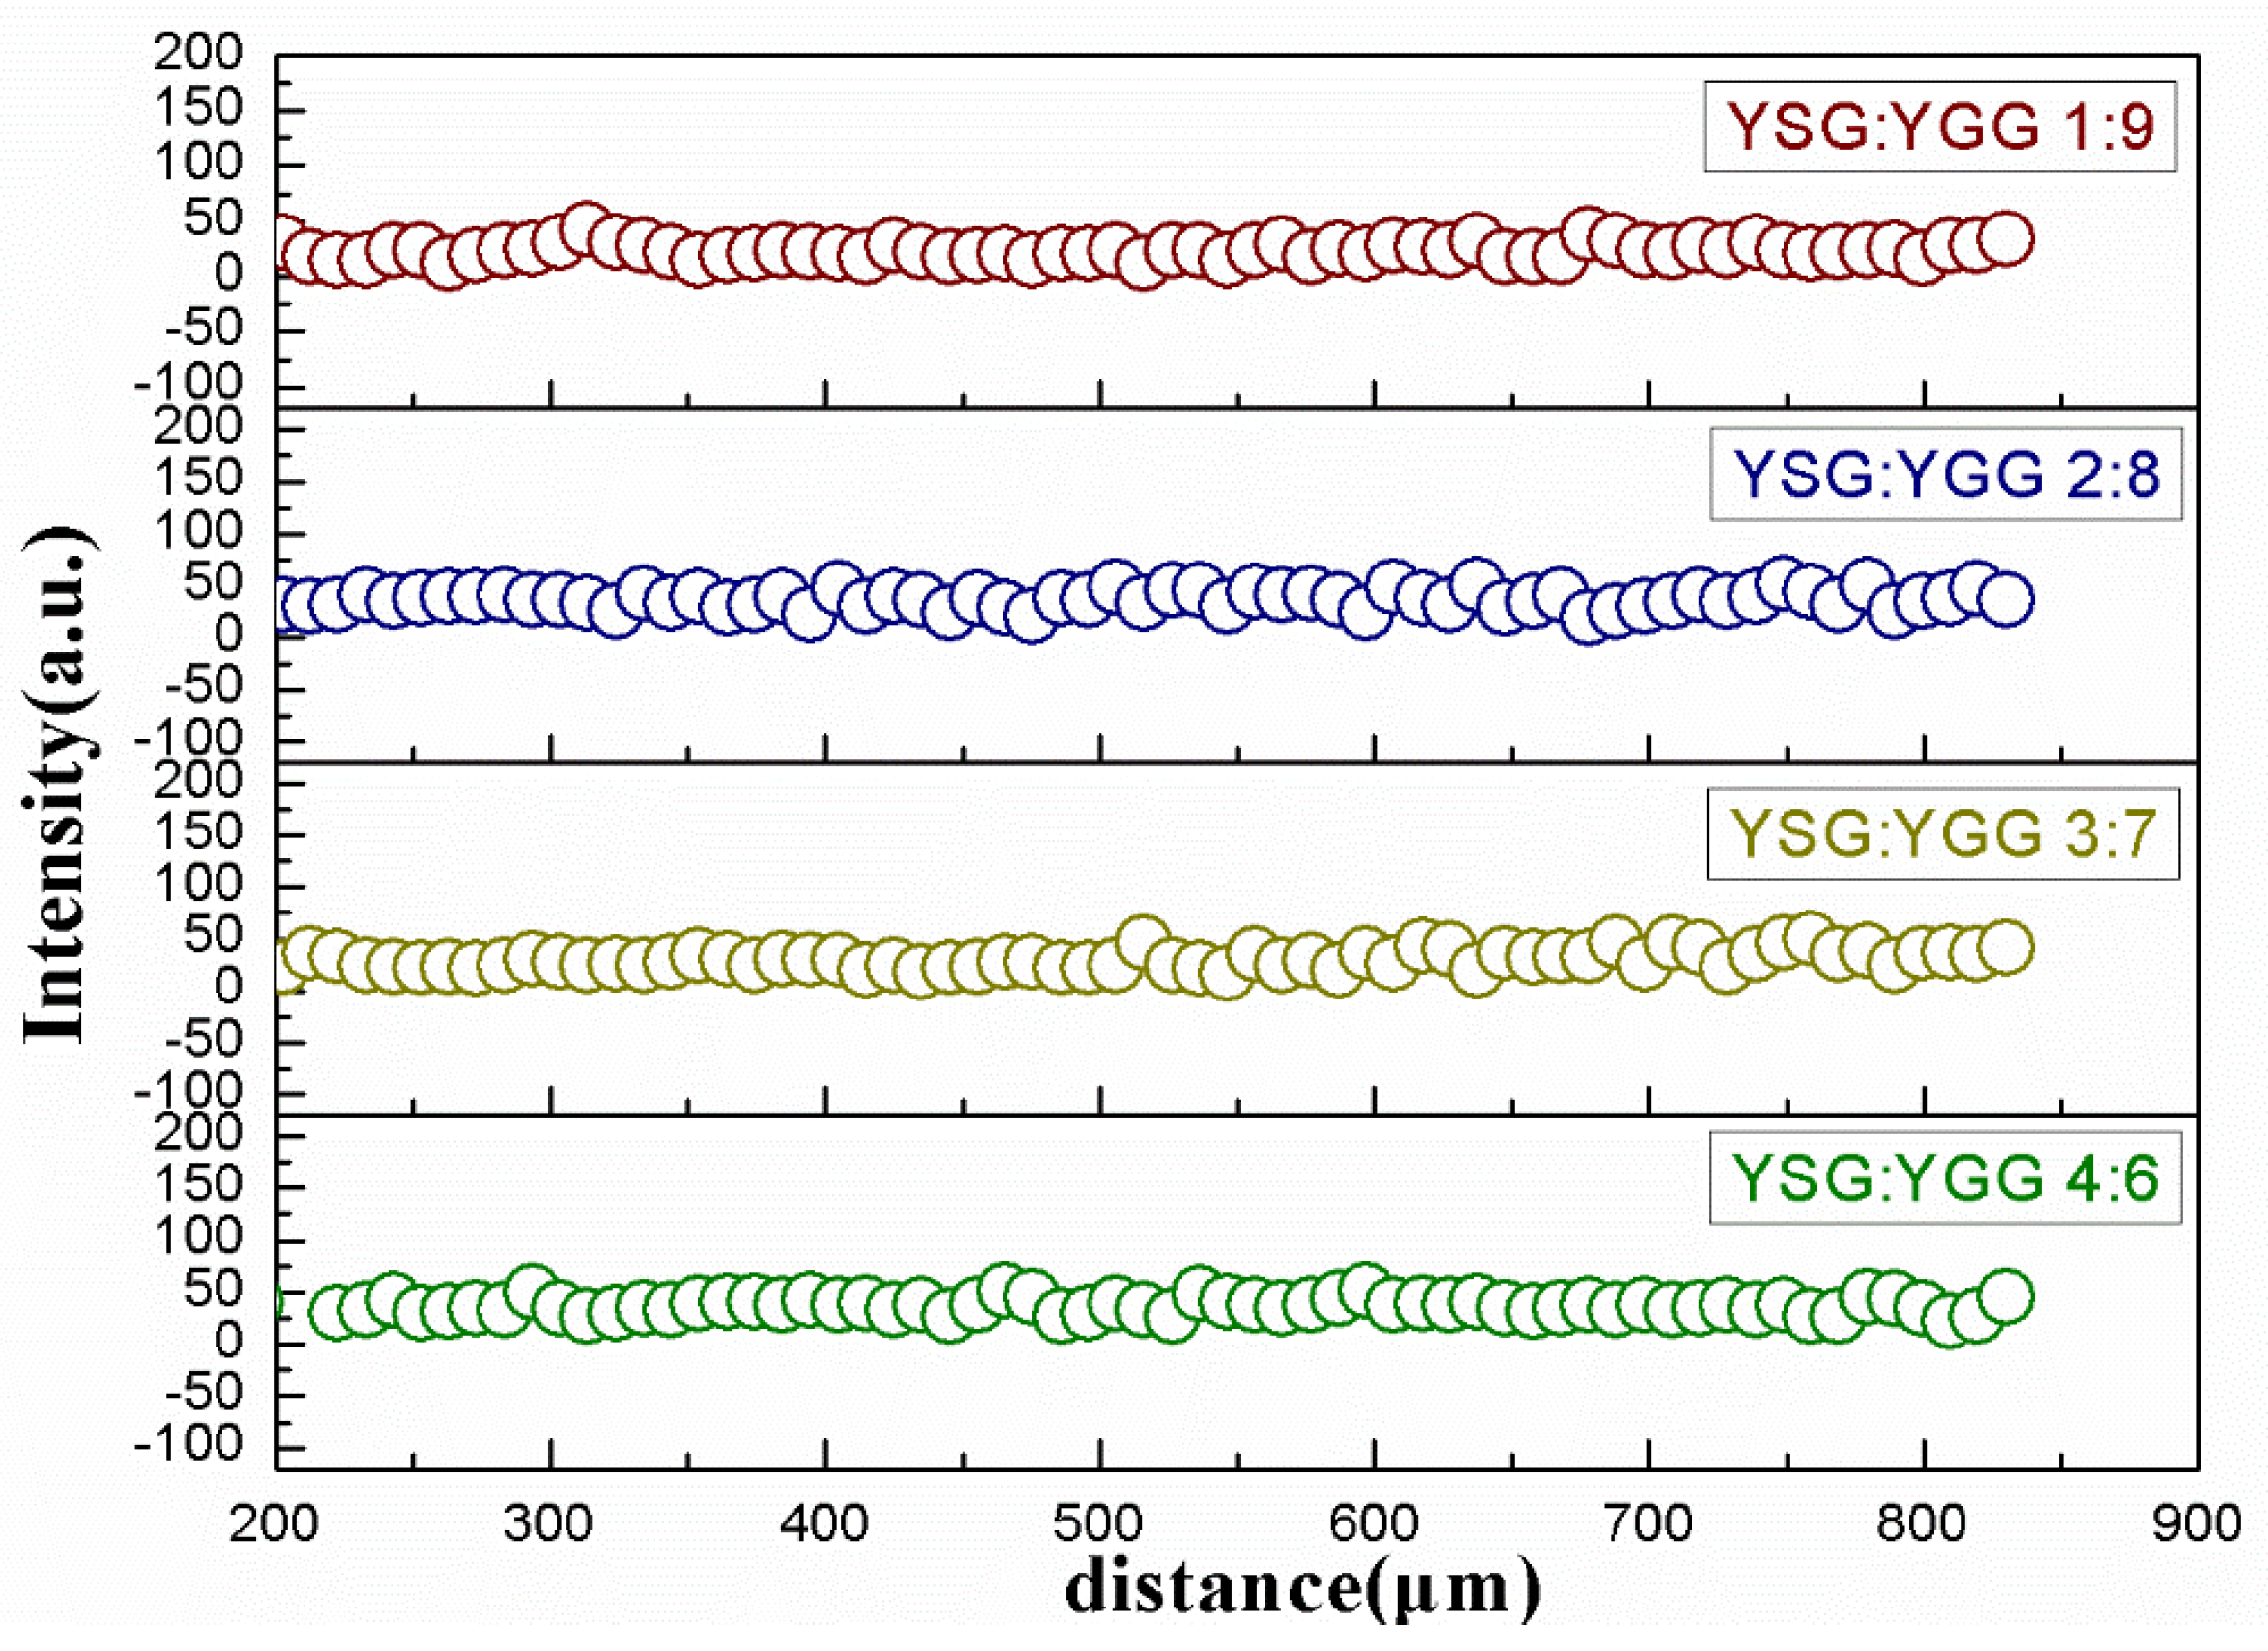
3.1. X-ray Fluorescence Spectrometry and EPMA Analyses
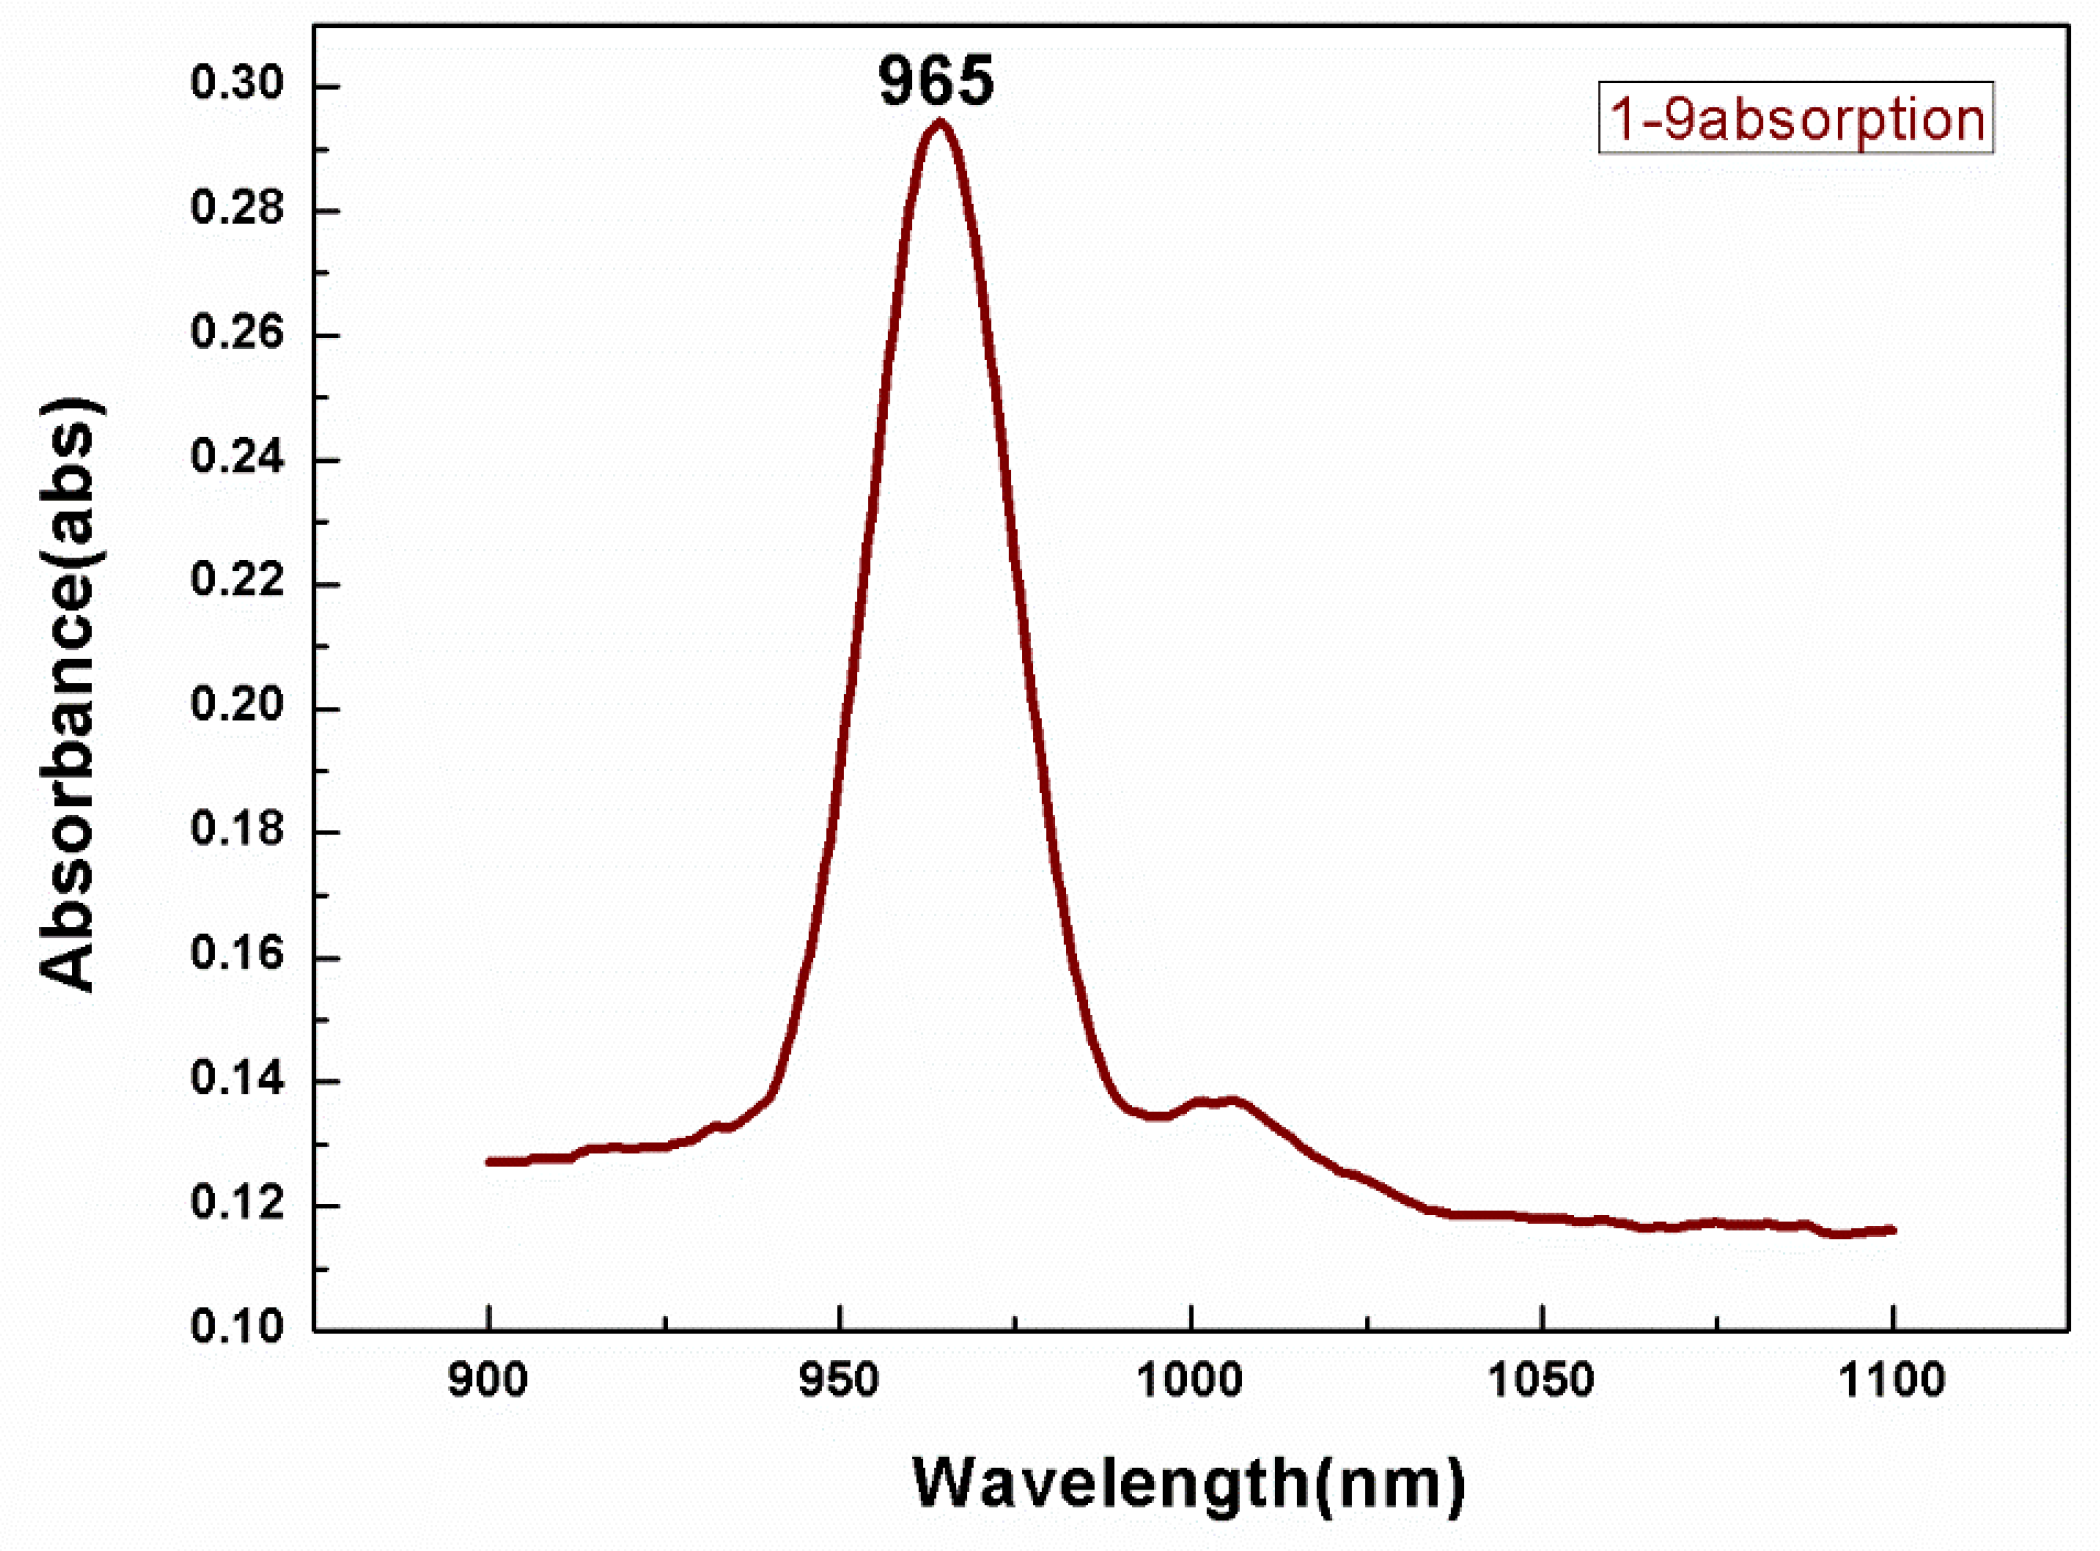
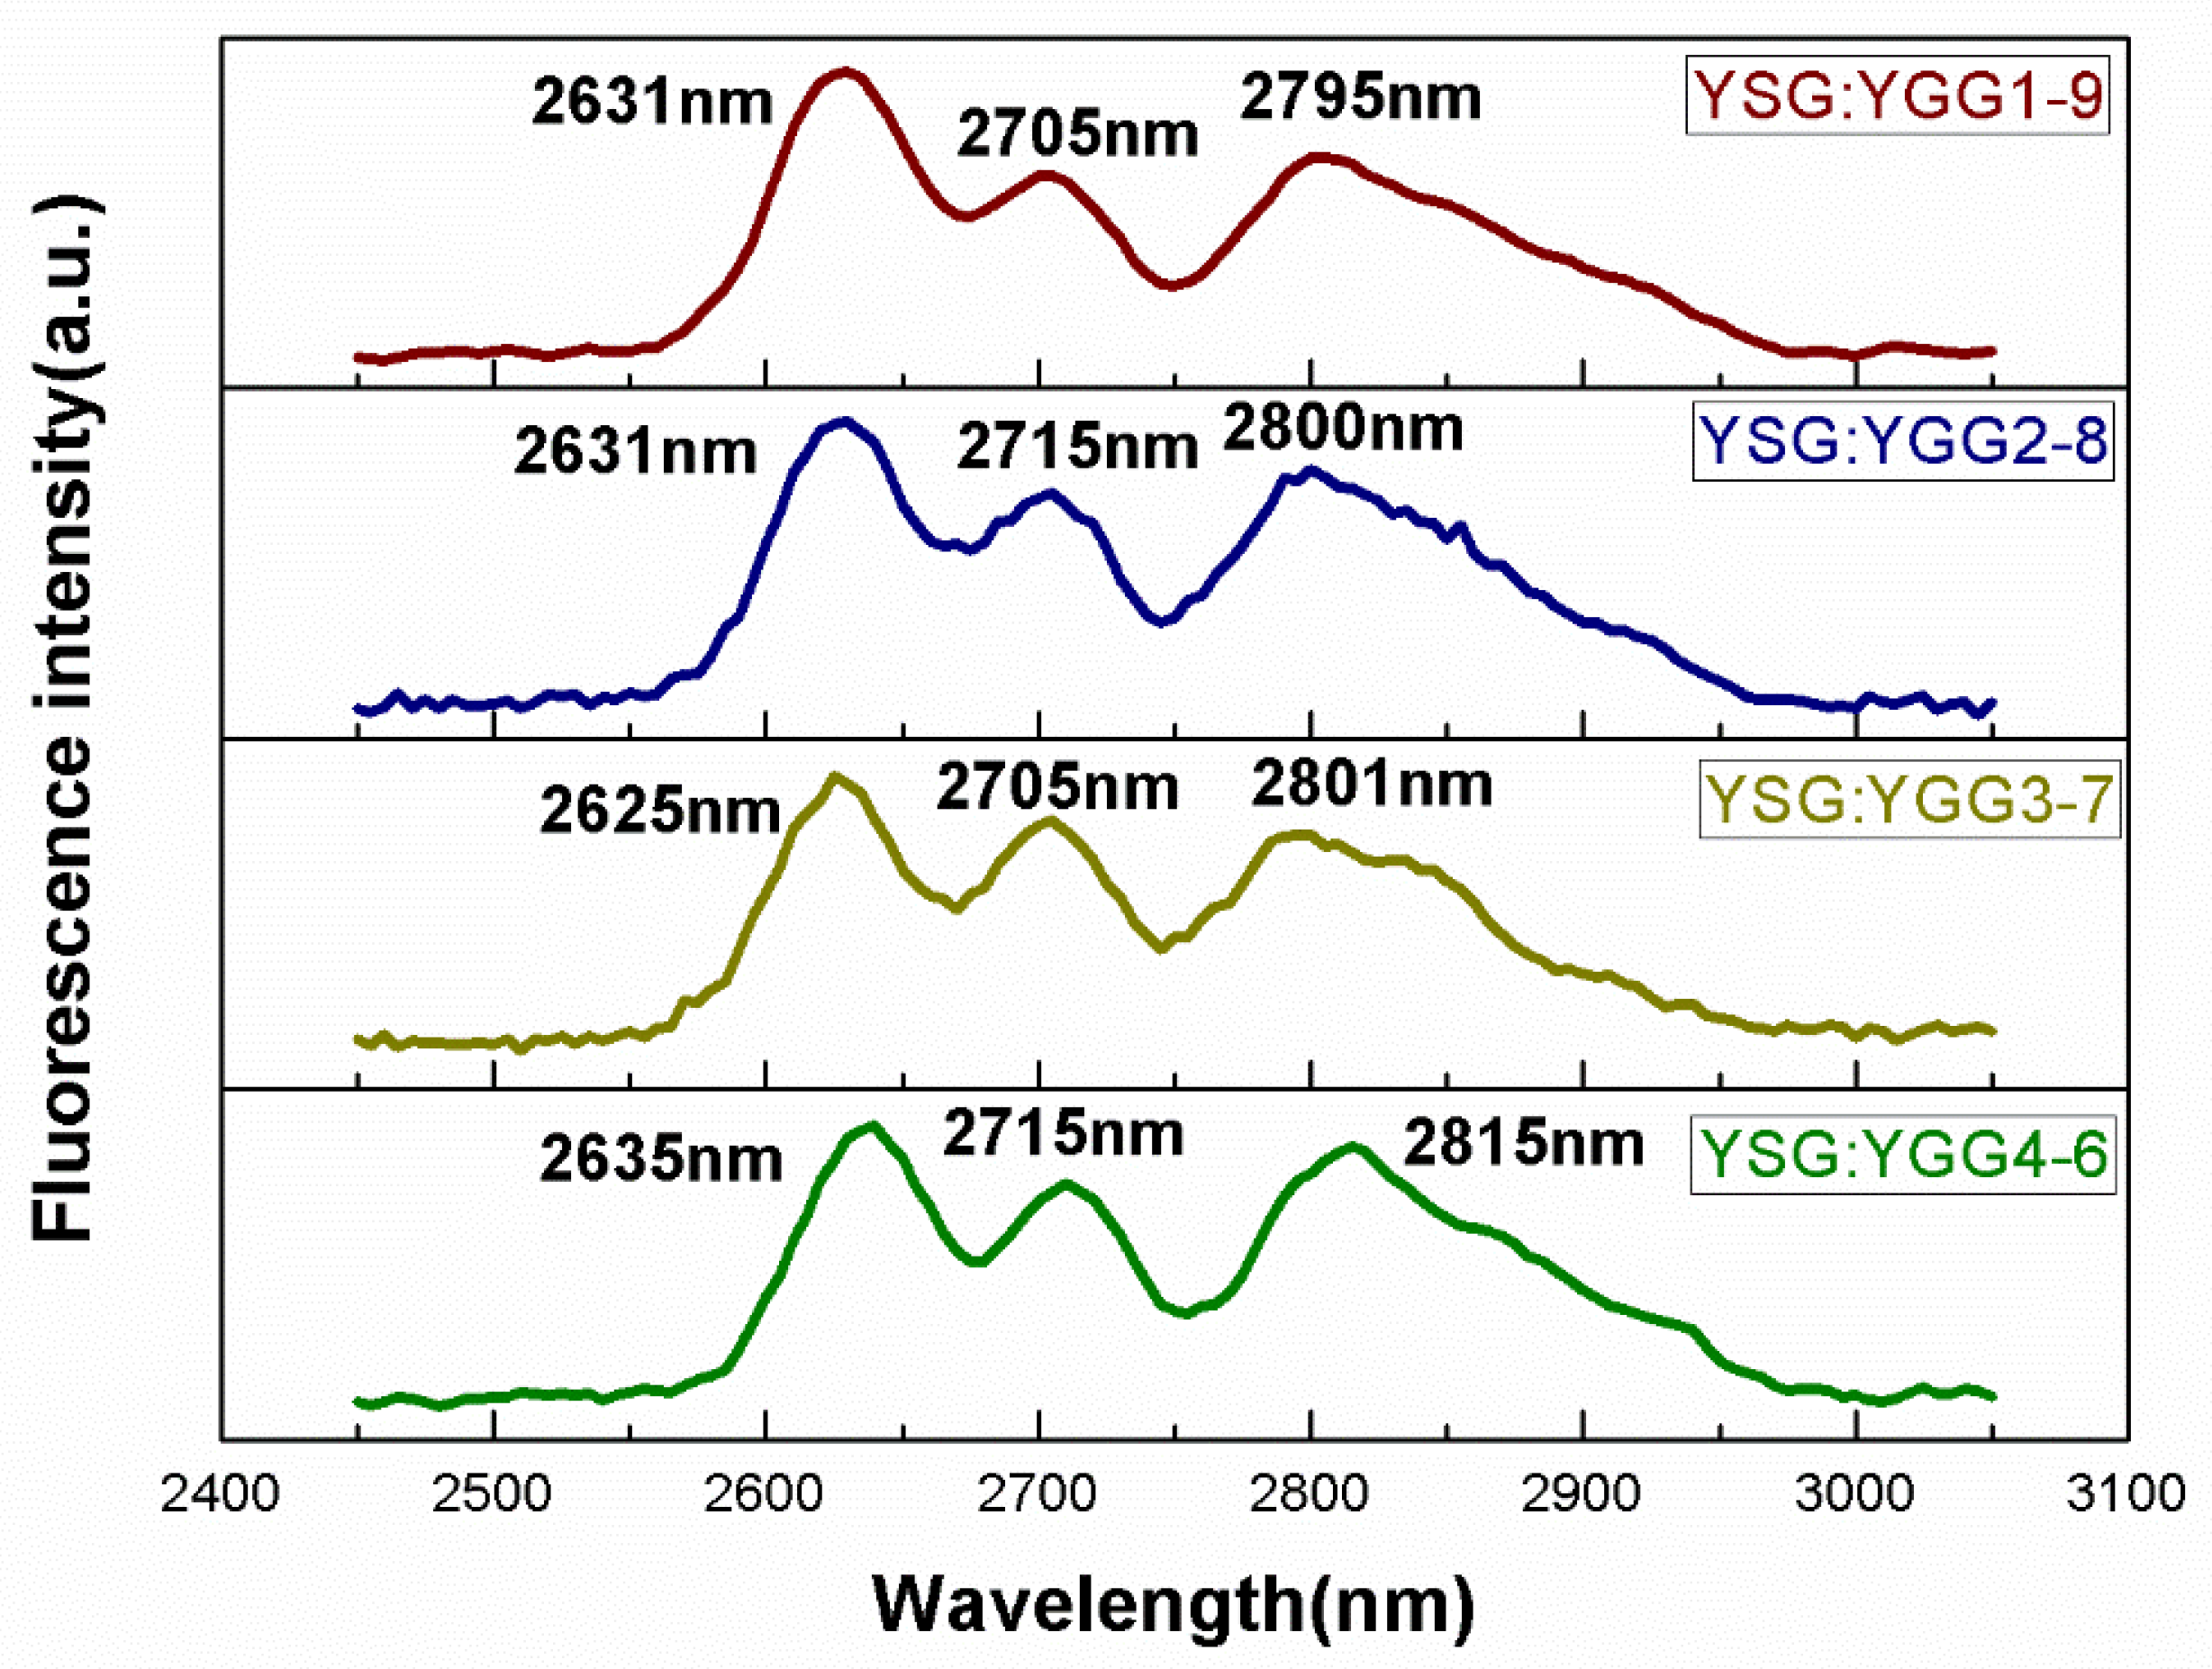
3.2. Spectroscopic Properties Analyses
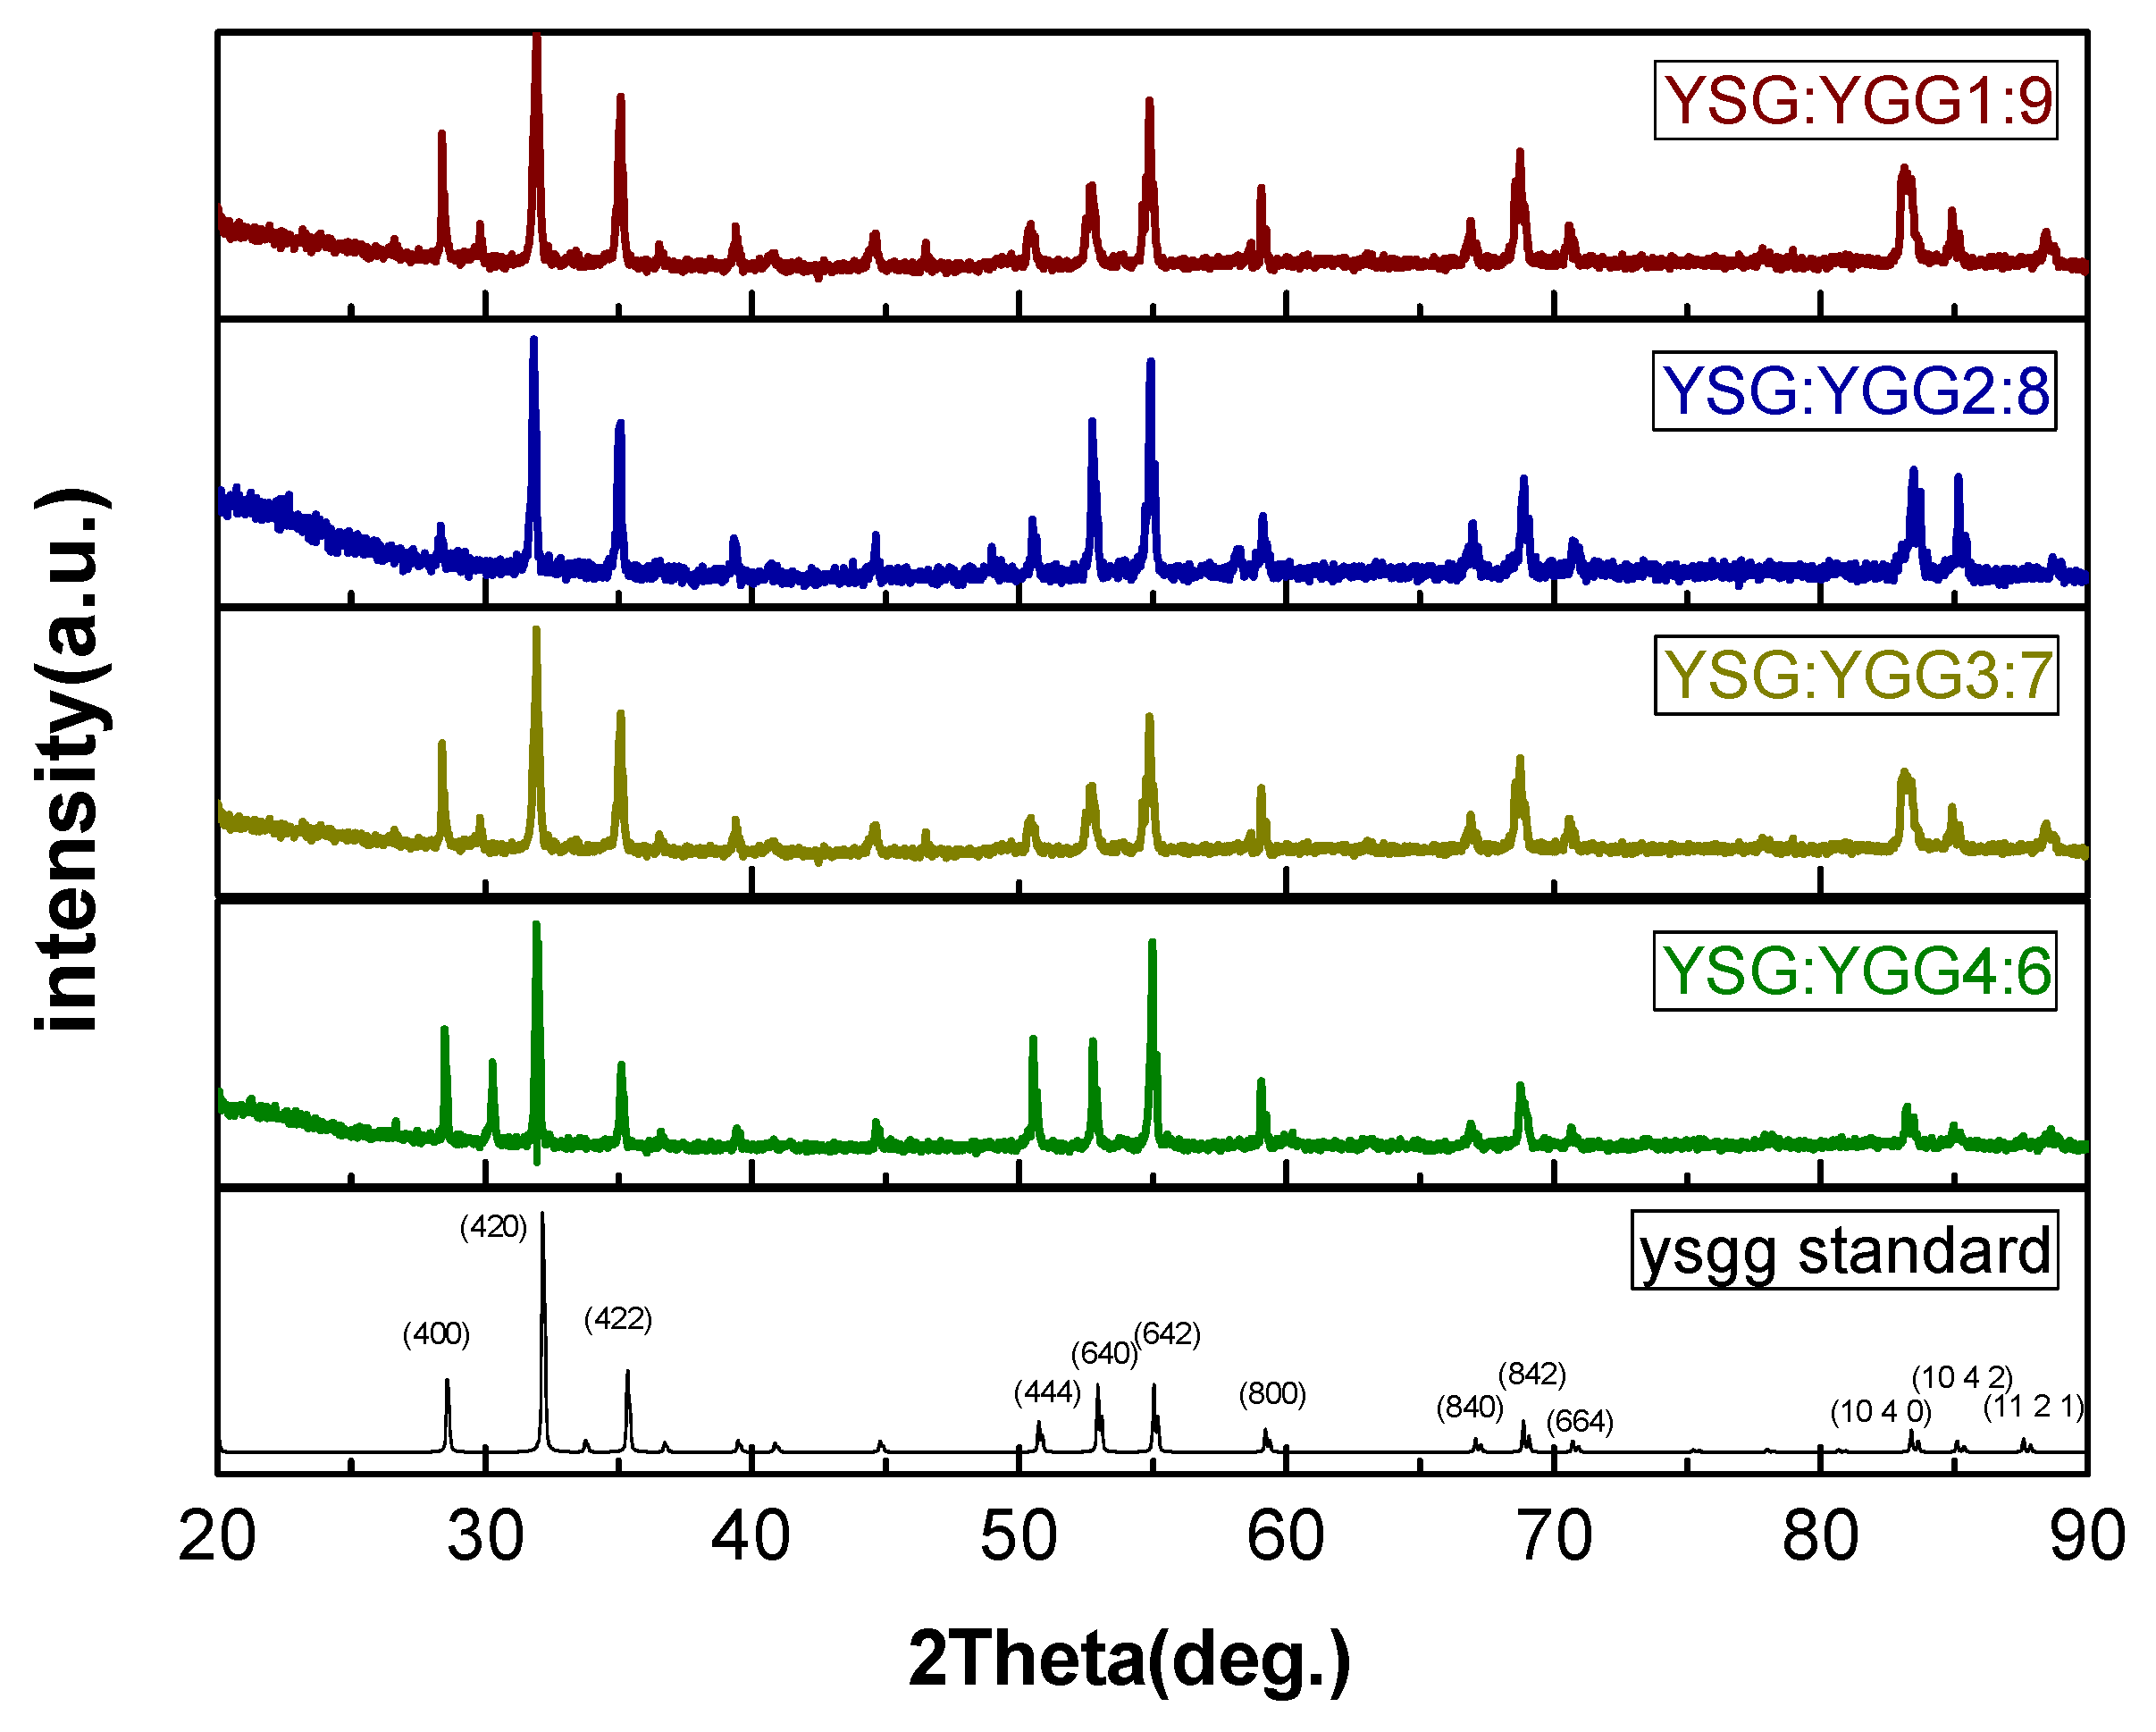
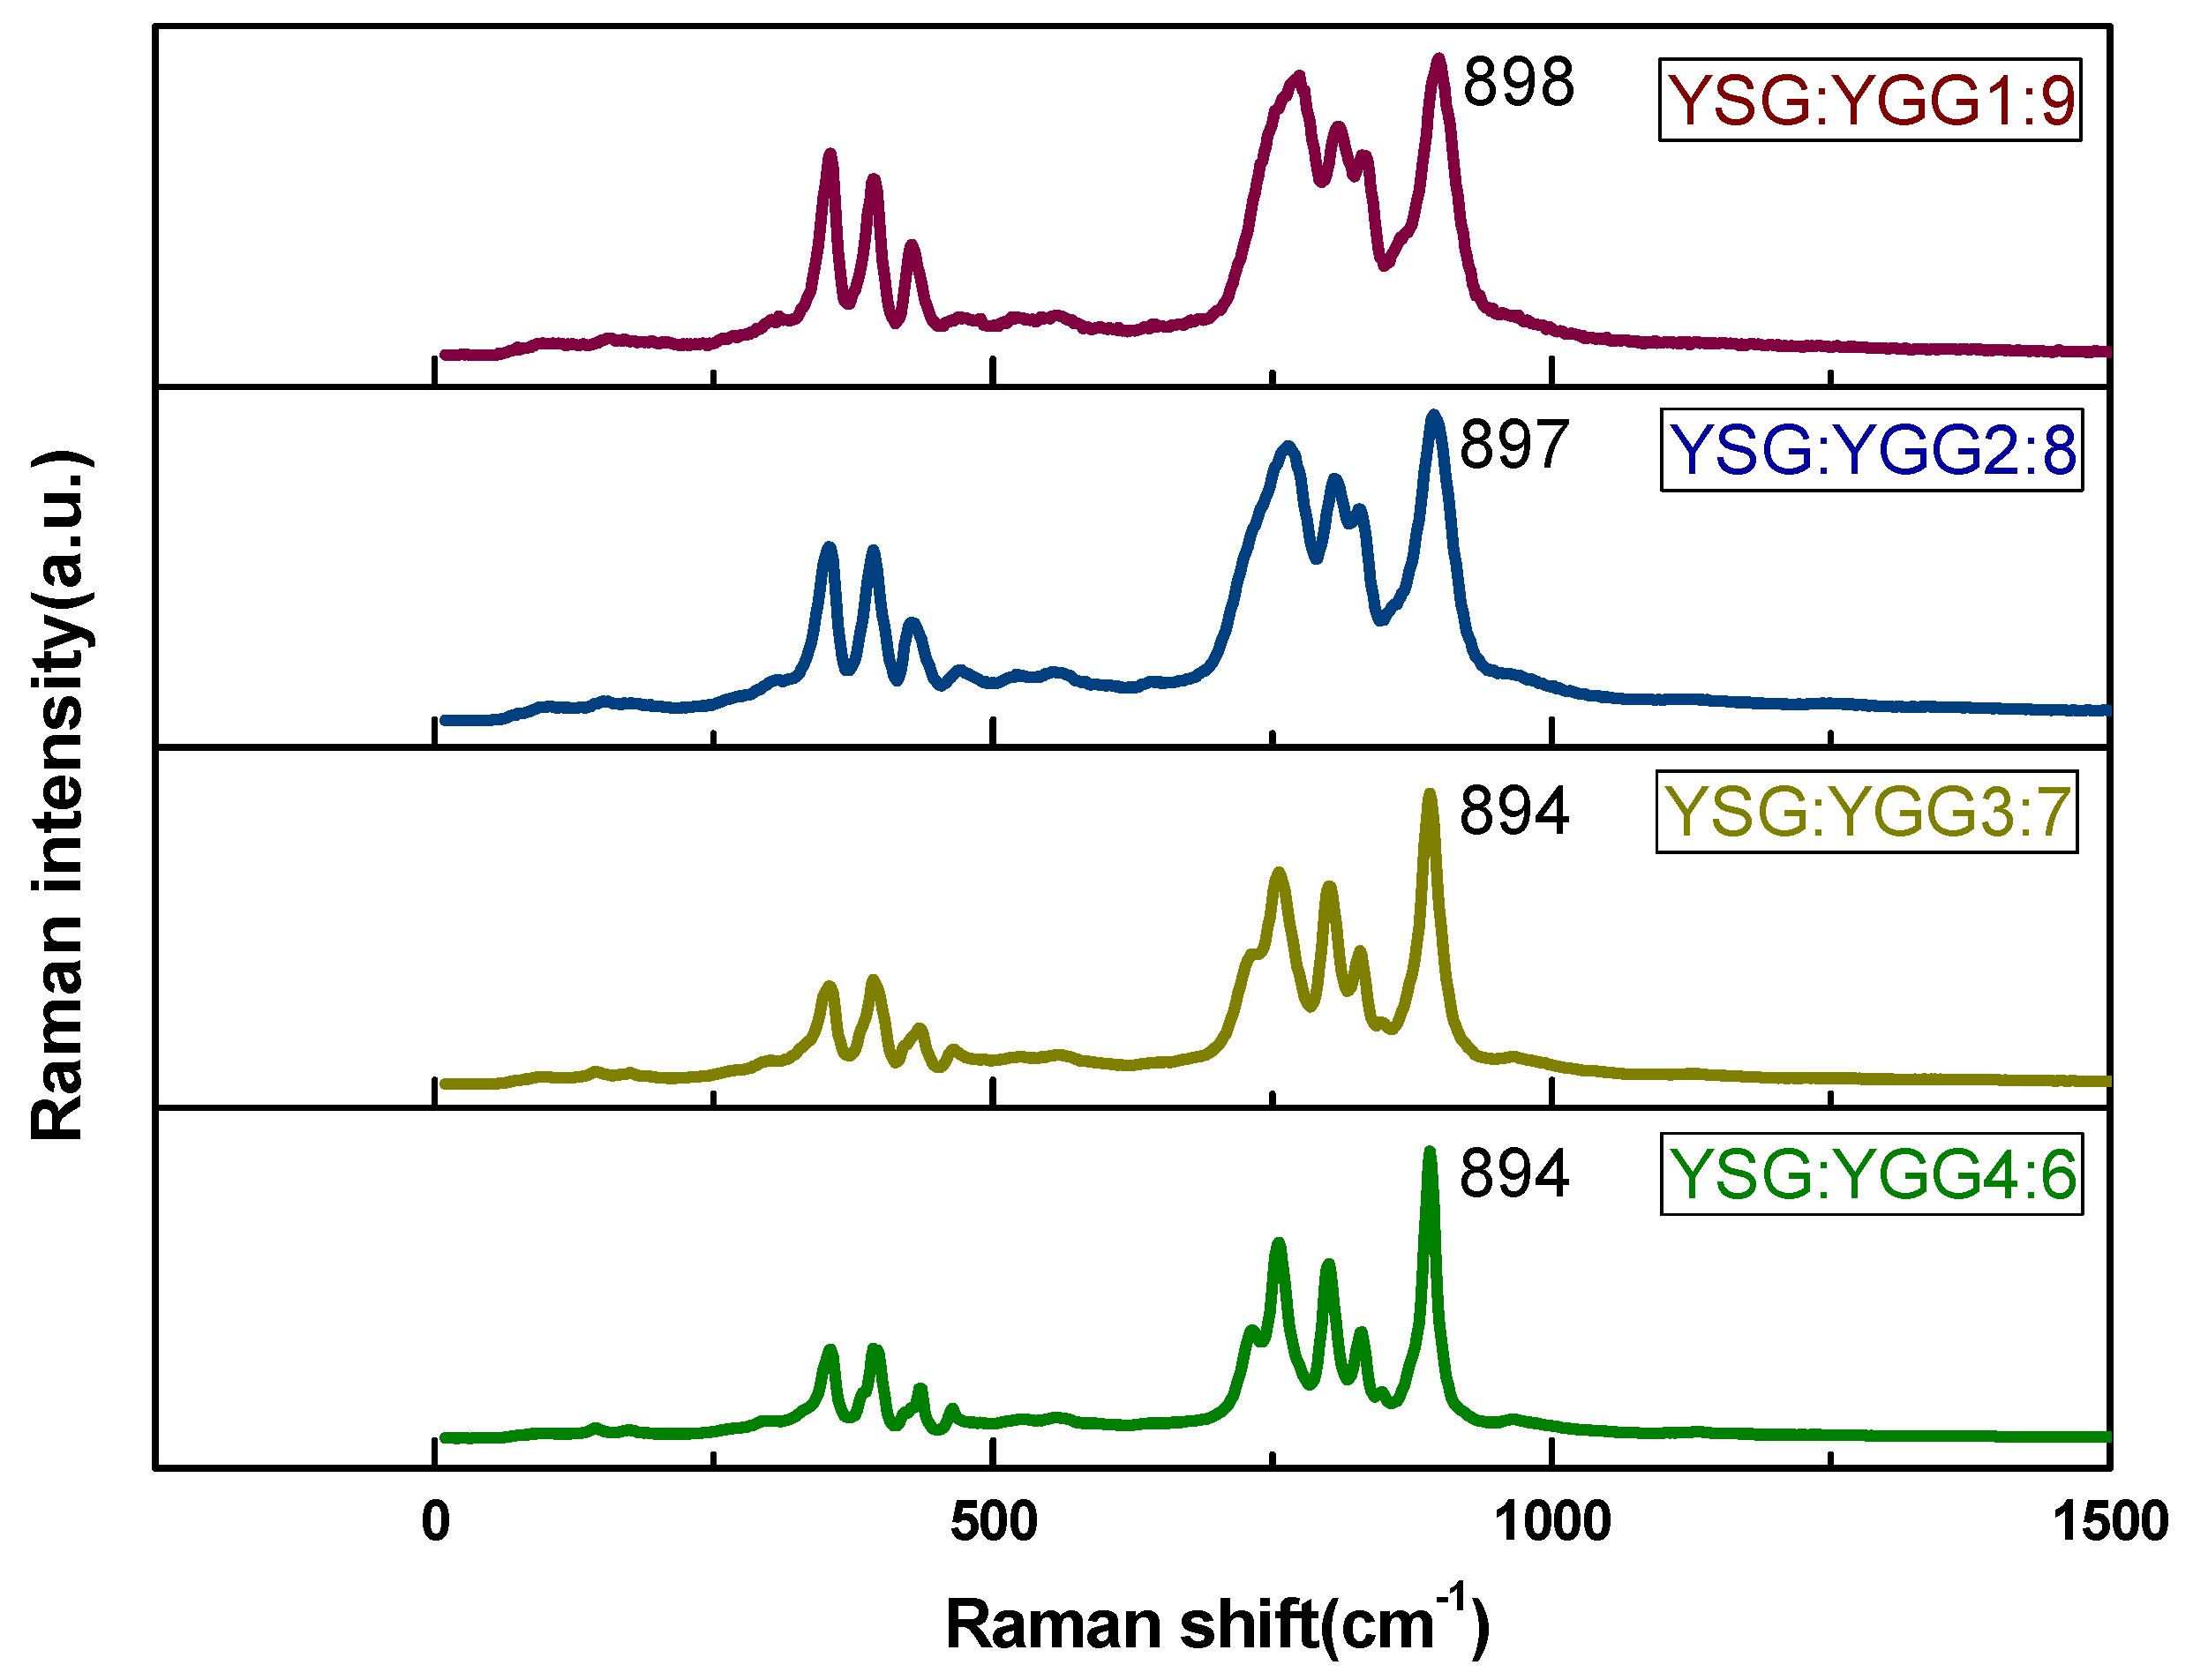
3.3. XRD and Raman Analyses
4. Conclusions
Author Contributions
Funding
Conflicts of Interest
References
- Högele, A.; Hörbe, G.; Lubatschowski, H.; Welling, H.; Ertmer, W. 2.70 μm Cr Er:YSGG laser with high output energy and FTIR-Q-switch. Opt. Commun. 1996, 125, 90–94. [Google Scholar] [CrossRef]
- Li, X.; Liu, X.; Zhang, L.; Hu, L.; Zhang, J. Emission enhancement in Er3+/Pr3+-co-doped germanate glasses and their use as a 2.7-mm laser material. Chin. Opt. Lett. 2013, 11, 121601. [Google Scholar]
- Kasper, E.; Kittler, M.; Oehme, M.; Arguirov, T. Germanium tin: Silicon photonics toward the mid-infrared. Photonics Res. 2013, 1, 69–76. [Google Scholar] [CrossRef]
- Zhang, H.; Sun, D.; Luo, J.; Peng, F.; Fang, Z.; Zhao, X.; Cheng, M.; Zhang, Q.; Guo, Q.; Yin, S. Growth, structure, and spectroscopic properties of a Cr3+, Tm3+, Ho3+, and Pr3+ co-doped LuYAG single crystal for 2.9 μm laser. CrystEngComm 2016, 18, 5826–5831. [Google Scholar] [CrossRef]
- Dou, R.; Zhang, Q.; Sun, D.; Luo, J.; Yang, H.; Liu, W.; Sun, G. Growth, thermal, and spectroscopic properties of a 2.911 μm Yb, Ho: GdYTaO 4 laser crystal. CrystEngComm 2014, 16, 11007–11012. [Google Scholar] [CrossRef]
- Zhang, H.; Sun, D.; Luo, J.; Fang, Z.; Zhao, X.; Cheng, M.; Zhang, Q.; Yin, S. Growth and spectroscopic properties of the 2.9 μm Tm, Ho:LuYAG laser crystals. Opt. Mater. 2015, 47, 490–494. [Google Scholar] [CrossRef]
- Wang, Y.; Li, J.; Zhu, Z.; You, Z.; Xu, J.; Tu, C. Impact of codopant ions on 2.5–3.0 µm emission of Er3+: 4I11/→ 4I13/2 transition in Yb, Er, Eu:LaYSGG crystal. J. Quant. Spectrosc. Radiat. Transf. 2015, 167, 76–81. [Google Scholar] [CrossRef]
- Su, J.; Yang, C.; Li, Q.; Zhang, Q.; Luo, J. Optical spectroscopy of Er:YSGG laser crystal. J. Luminesc. 2010, 130, 1546–1550. [Google Scholar] [CrossRef]
- Dinerman, B.J.; Moulton, P.F. CW Laser Operation from Er:YAG, Er:GGG, Er:YSGG and Er:BYF. In Proceedings of the 1992 Annual Meeting LEOS’92; Boston, MA, USA, 16–19 November 1992; IEEE: Piscataway, NJ, USA, 1992; pp. 310–311. [Google Scholar]
- Xia, H.; Feng, J.; Ji, Y.; Sun, Y.; Wang, Y.; Jia, Z.; Tu, C. 2.7 μm emission properties of Er3+/Yb3+/Eu3+: SrGdGa3O7 and Er3+/Yb3+/Ho3+: SrGdGa3O7 crystals. J. Quant. Spectrosc. Radiat. Transf. 2016, 173, 7–12. [Google Scholar] [CrossRef]
- Chen, X.; Collins, J.; DiBartolo, B.; Bowlby, B.; Dinerman, B.; Weyburne, D. Up-conversion luminescence of Er3+-doped yttrium, scandium, gallium garnet at different temperatures. J. Luminesc. 1997, 72, 168–170. [Google Scholar] [CrossRef]
- Liu, Y.; Xia, H.; Wang, Y.; Zhu, Z.; You, Z.; Li, J.; Tu, C. Effect of erbium concentration on spectroscopic properties of Er: CaLaGa3O7 crystals with 2.7 μm emission. Opt. Mater. 2017, 72, 685–690. [Google Scholar] [CrossRef]
- Wang, Y.; You, Z.; Li, J.; Zhu, Z.; Ma, E.; Tu, C. Spectroscopic investigations of highly doped Er3+: GGG and Er3+/Pr3+: GGG crystals. J. Phys. D Appl. Phys. 2009, 42, 215406. [Google Scholar] [CrossRef]


| No. | x/y | Y2.1Er0.9(ScxGay)5O12 |
|---|---|---|
| 1 | 1:9 | Y2.1Er0.9(Sc0.1Ga0.9)5O12 |
| 2 | 2:8 | Y2.1Er0.9(Sc0.2Ga0.8)5O12 |
| 3 | 3:7 | Y2.1Er0.9(Sc0.3Ga0.7)5O12 |
| 4 | 4:6 | Y2.1Er0.9(Sc0.4Ga0.6)5O12 |
| YSG:YGG | Sc | Ga | Y | Er | Sc:Ga | Er% |
|---|---|---|---|---|---|---|
| 1:9 | 0.076 | 0.670 | 0.305 | 0.133 | 1:8.82 | 30.4 |
| 2:8 | 0.118 | 0.545 | 0.352 | 0.152 | 2:8.24 | 30.2 |
| 3:7 | 0.225 | 0.502 | 0.364 | 0.135 | 3:6.69 | 29.1 |
| 4:6 | 0.309 | 0.416 | 0.369 | 0.145 | 4:5.93 | 29.2 |
| 1:9 | 2:8 | 3:7 | 4:6 | |
|---|---|---|---|---|
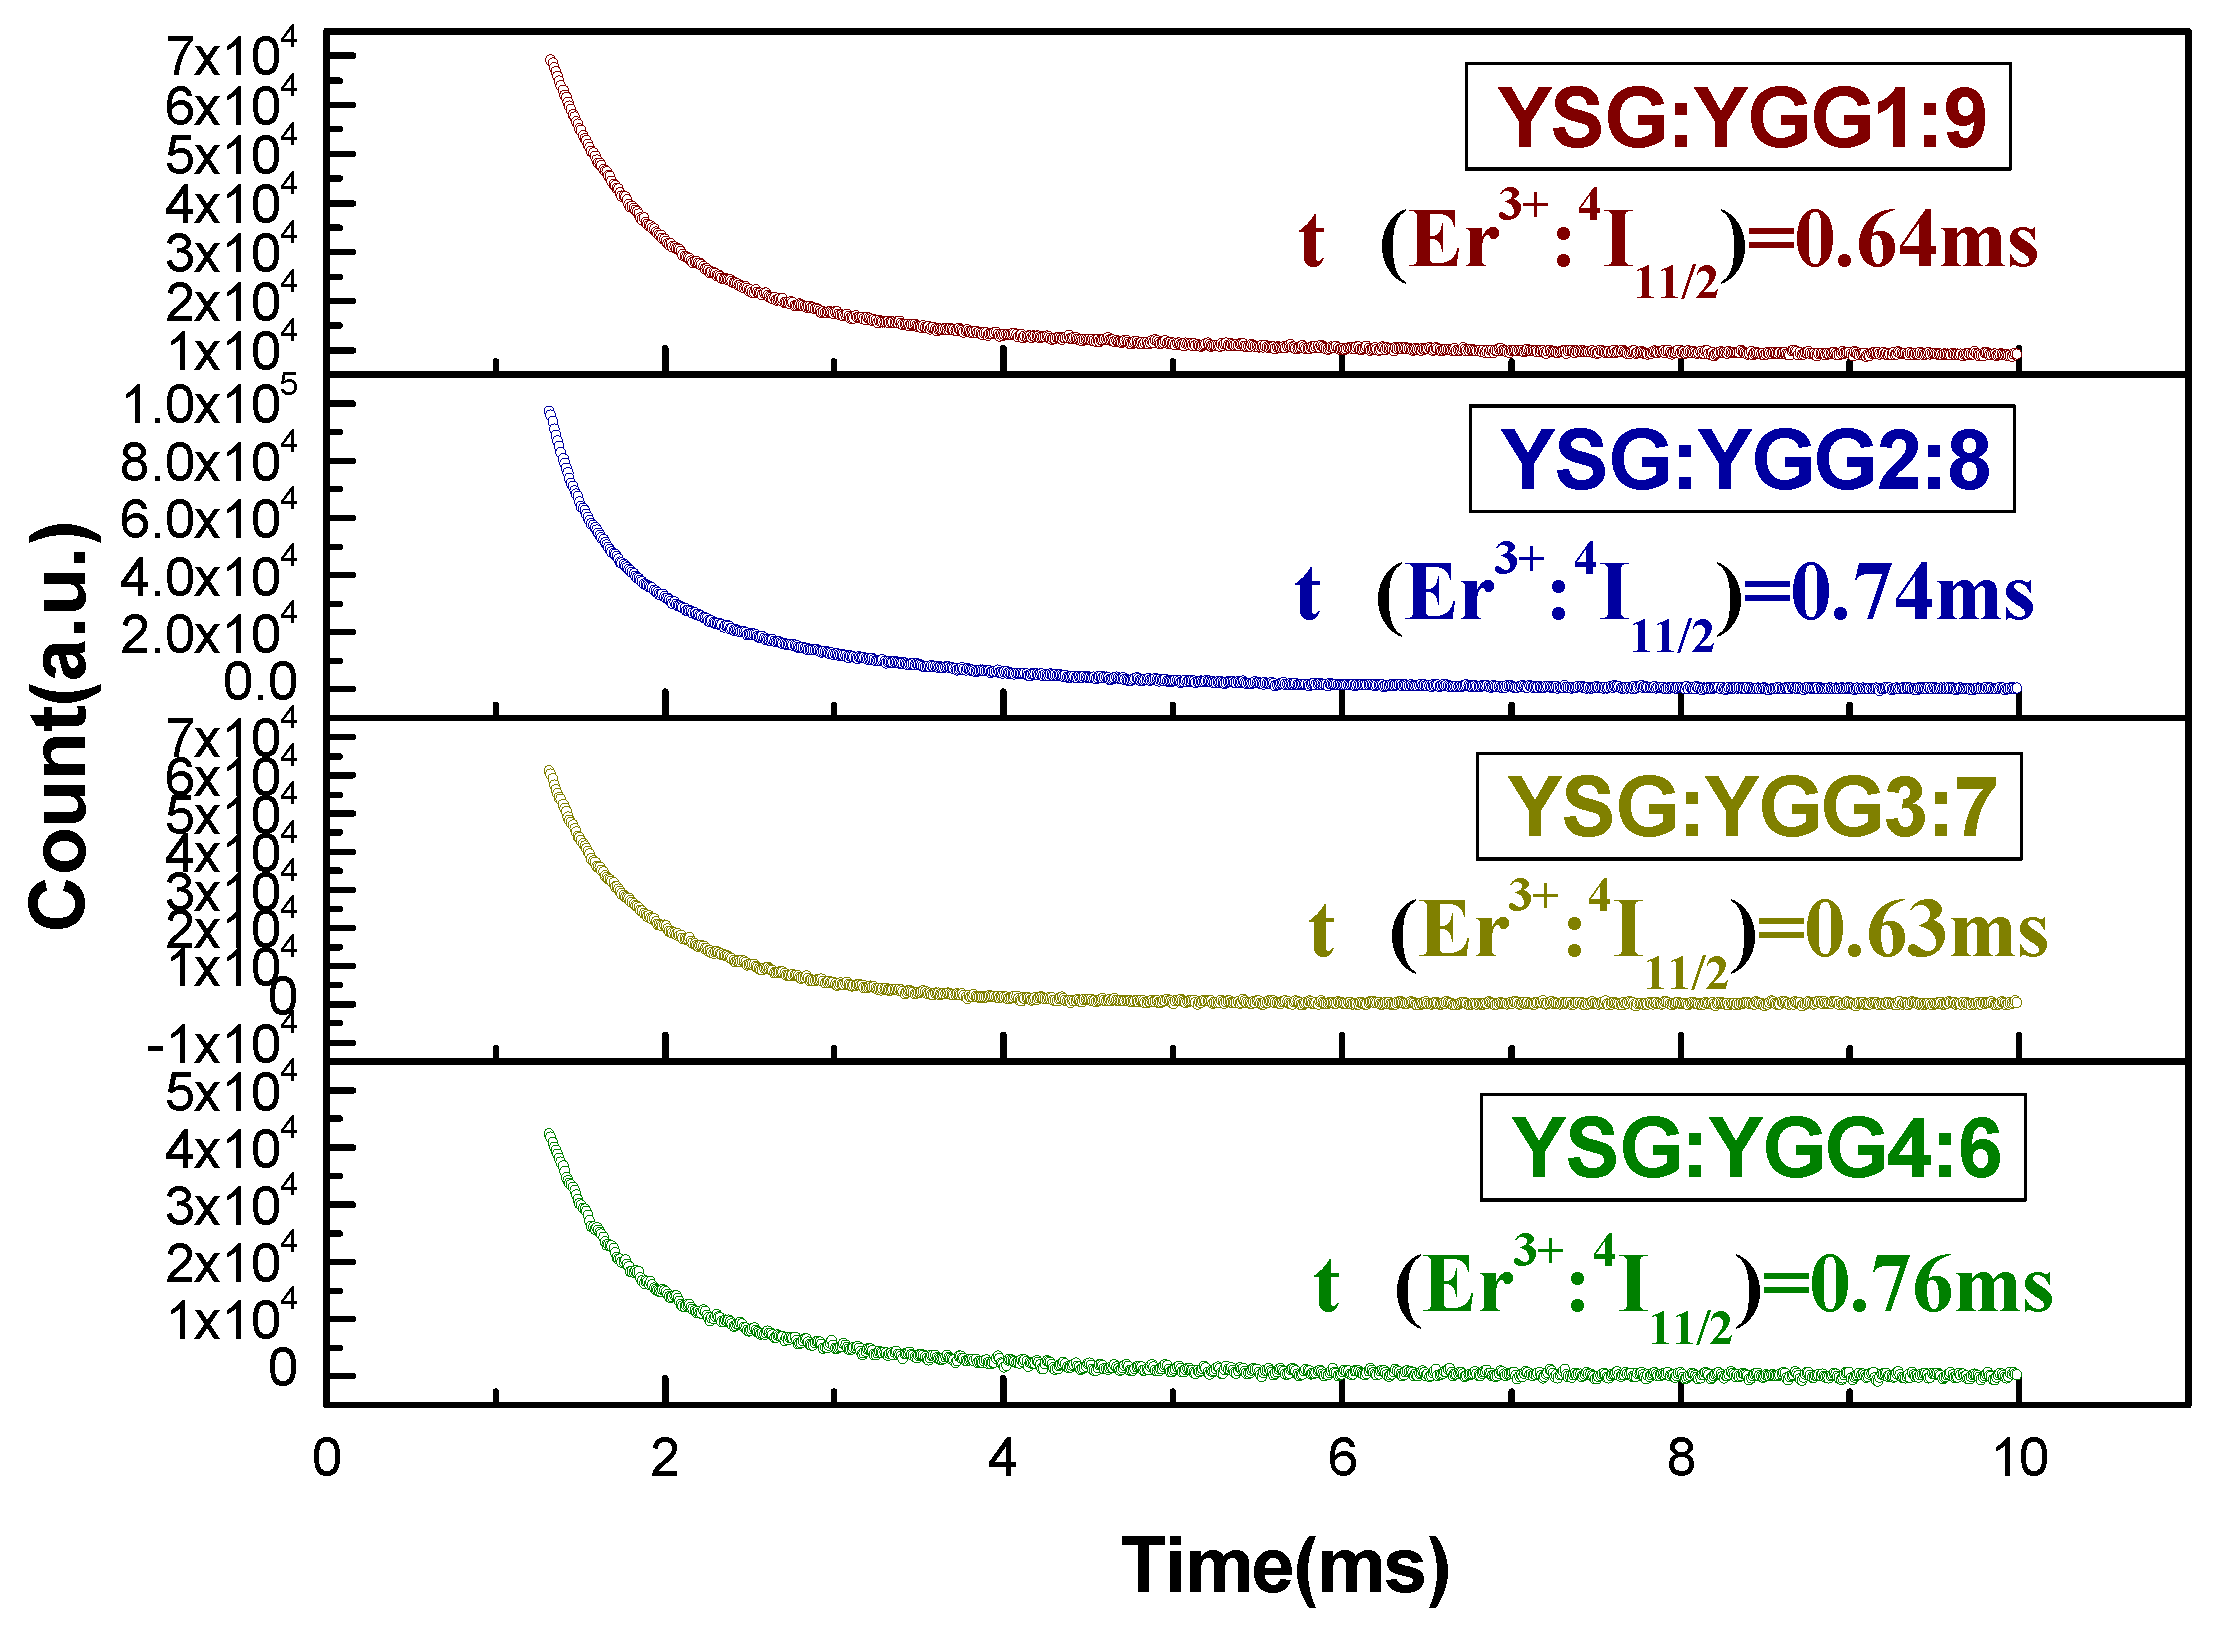
| 4I11/2 | 0.64 ms | 0.74 ms | 0.63 ms | 0.76 ms |
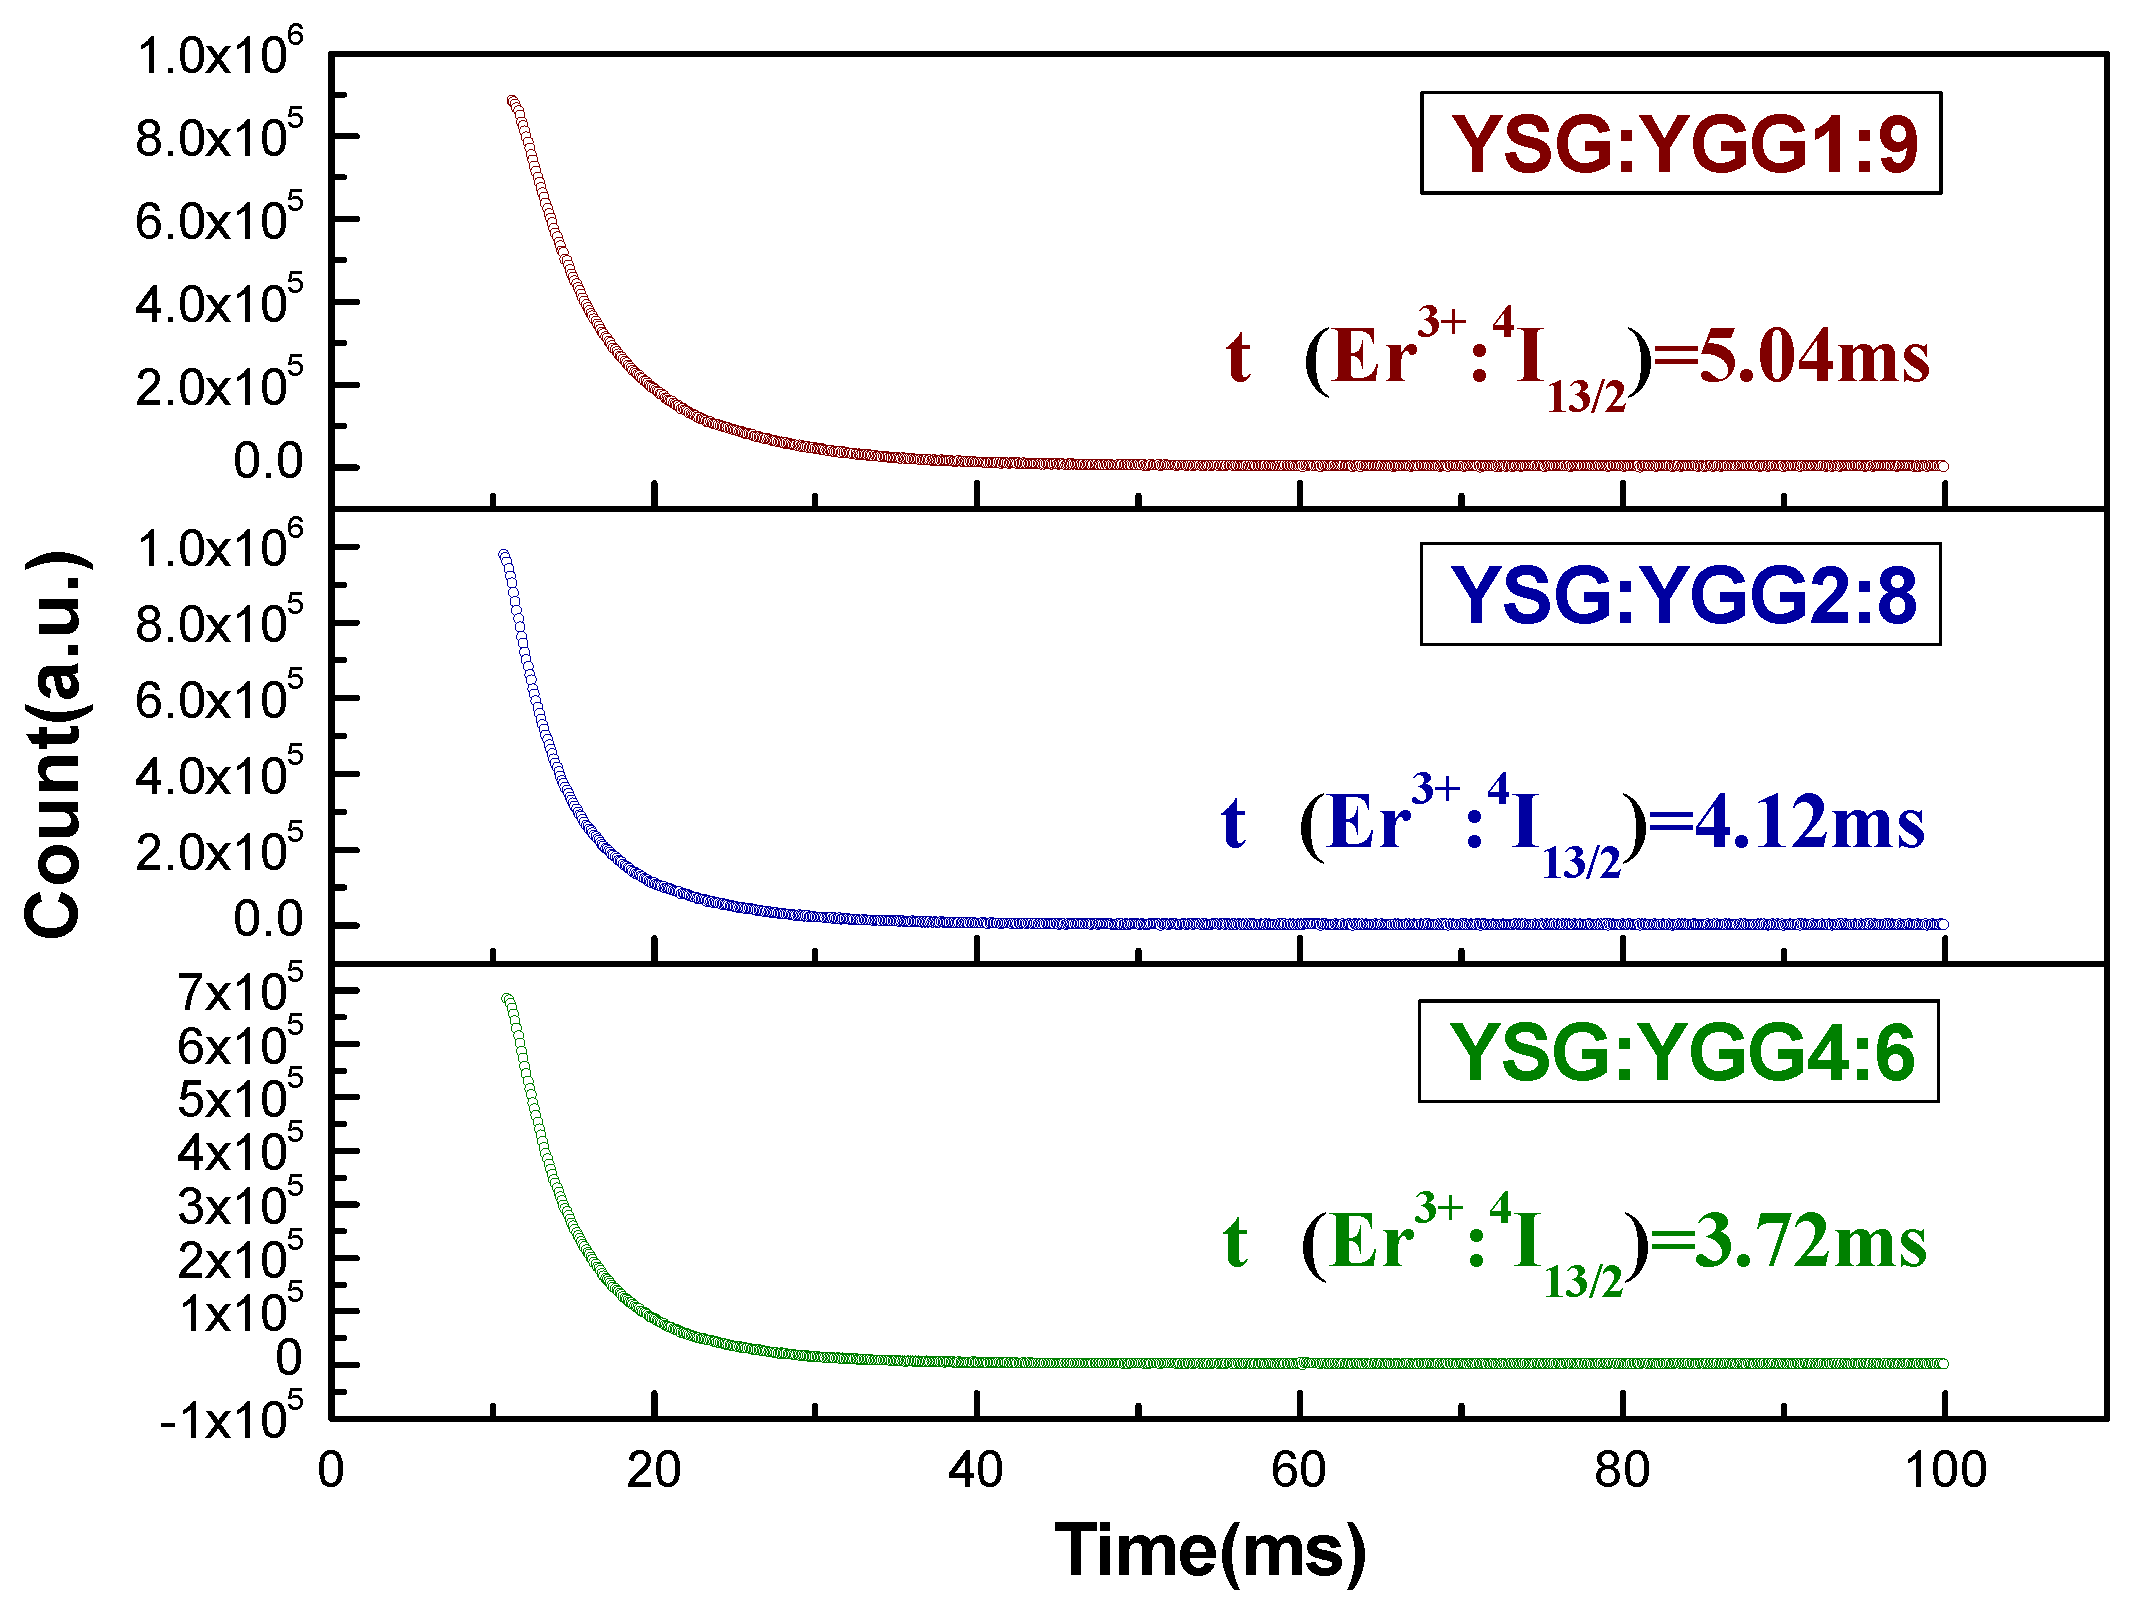
| 4I13/2 | 6.04 ms | 4.32 ms | 1.95 ms | 3.72 ms |
© 2019 by the authors. Licensee MDPI, Basel, Switzerland. This article is an open access article distributed under the terms and conditions of the Creative Commons Attribution (CC BY) license (http://creativecommons.org/licenses/by/4.0/).
Share and Cite
Che, Z.; Zhang, J.; Wu, B.; Hu, Q.; Mu, W.; Yin, Y.; Jia, Z. Investigation of Y2.1Er0.9(ScxGa1−x)5O12 Matrix Components on the Spectral Properties around 3.0 μm by Micro-Pulling-Down Method. Crystals 2019, 9, 138. https://doi.org/10.3390/cryst9030138
Che Z, Zhang J, Wu B, Hu Q, Mu W, Yin Y, Jia Z. Investigation of Y2.1Er0.9(ScxGa1−x)5O12 Matrix Components on the Spectral Properties around 3.0 μm by Micro-Pulling-Down Method. Crystals. 2019; 9(3):138. https://doi.org/10.3390/cryst9030138
Chicago/Turabian StyleChe, Zhijiang, Jian Zhang, Baiyi Wu, Qiangqiang Hu, Wenxiang Mu, Yanru Yin, and Zhitai Jia. 2019. "Investigation of Y2.1Er0.9(ScxGa1−x)5O12 Matrix Components on the Spectral Properties around 3.0 μm by Micro-Pulling-Down Method" Crystals 9, no. 3: 138. https://doi.org/10.3390/cryst9030138
APA StyleChe, Z., Zhang, J., Wu, B., Hu, Q., Mu, W., Yin, Y., & Jia, Z. (2019). Investigation of Y2.1Er0.9(ScxGa1−x)5O12 Matrix Components on the Spectral Properties around 3.0 μm by Micro-Pulling-Down Method. Crystals, 9(3), 138. https://doi.org/10.3390/cryst9030138