Structure and Properties of 1,3-Phenylenediboronic Acid: Combined Experimental and Theoretical Investigations

 ,
,
Abstract

1. Introduction
2. Materials and Methods
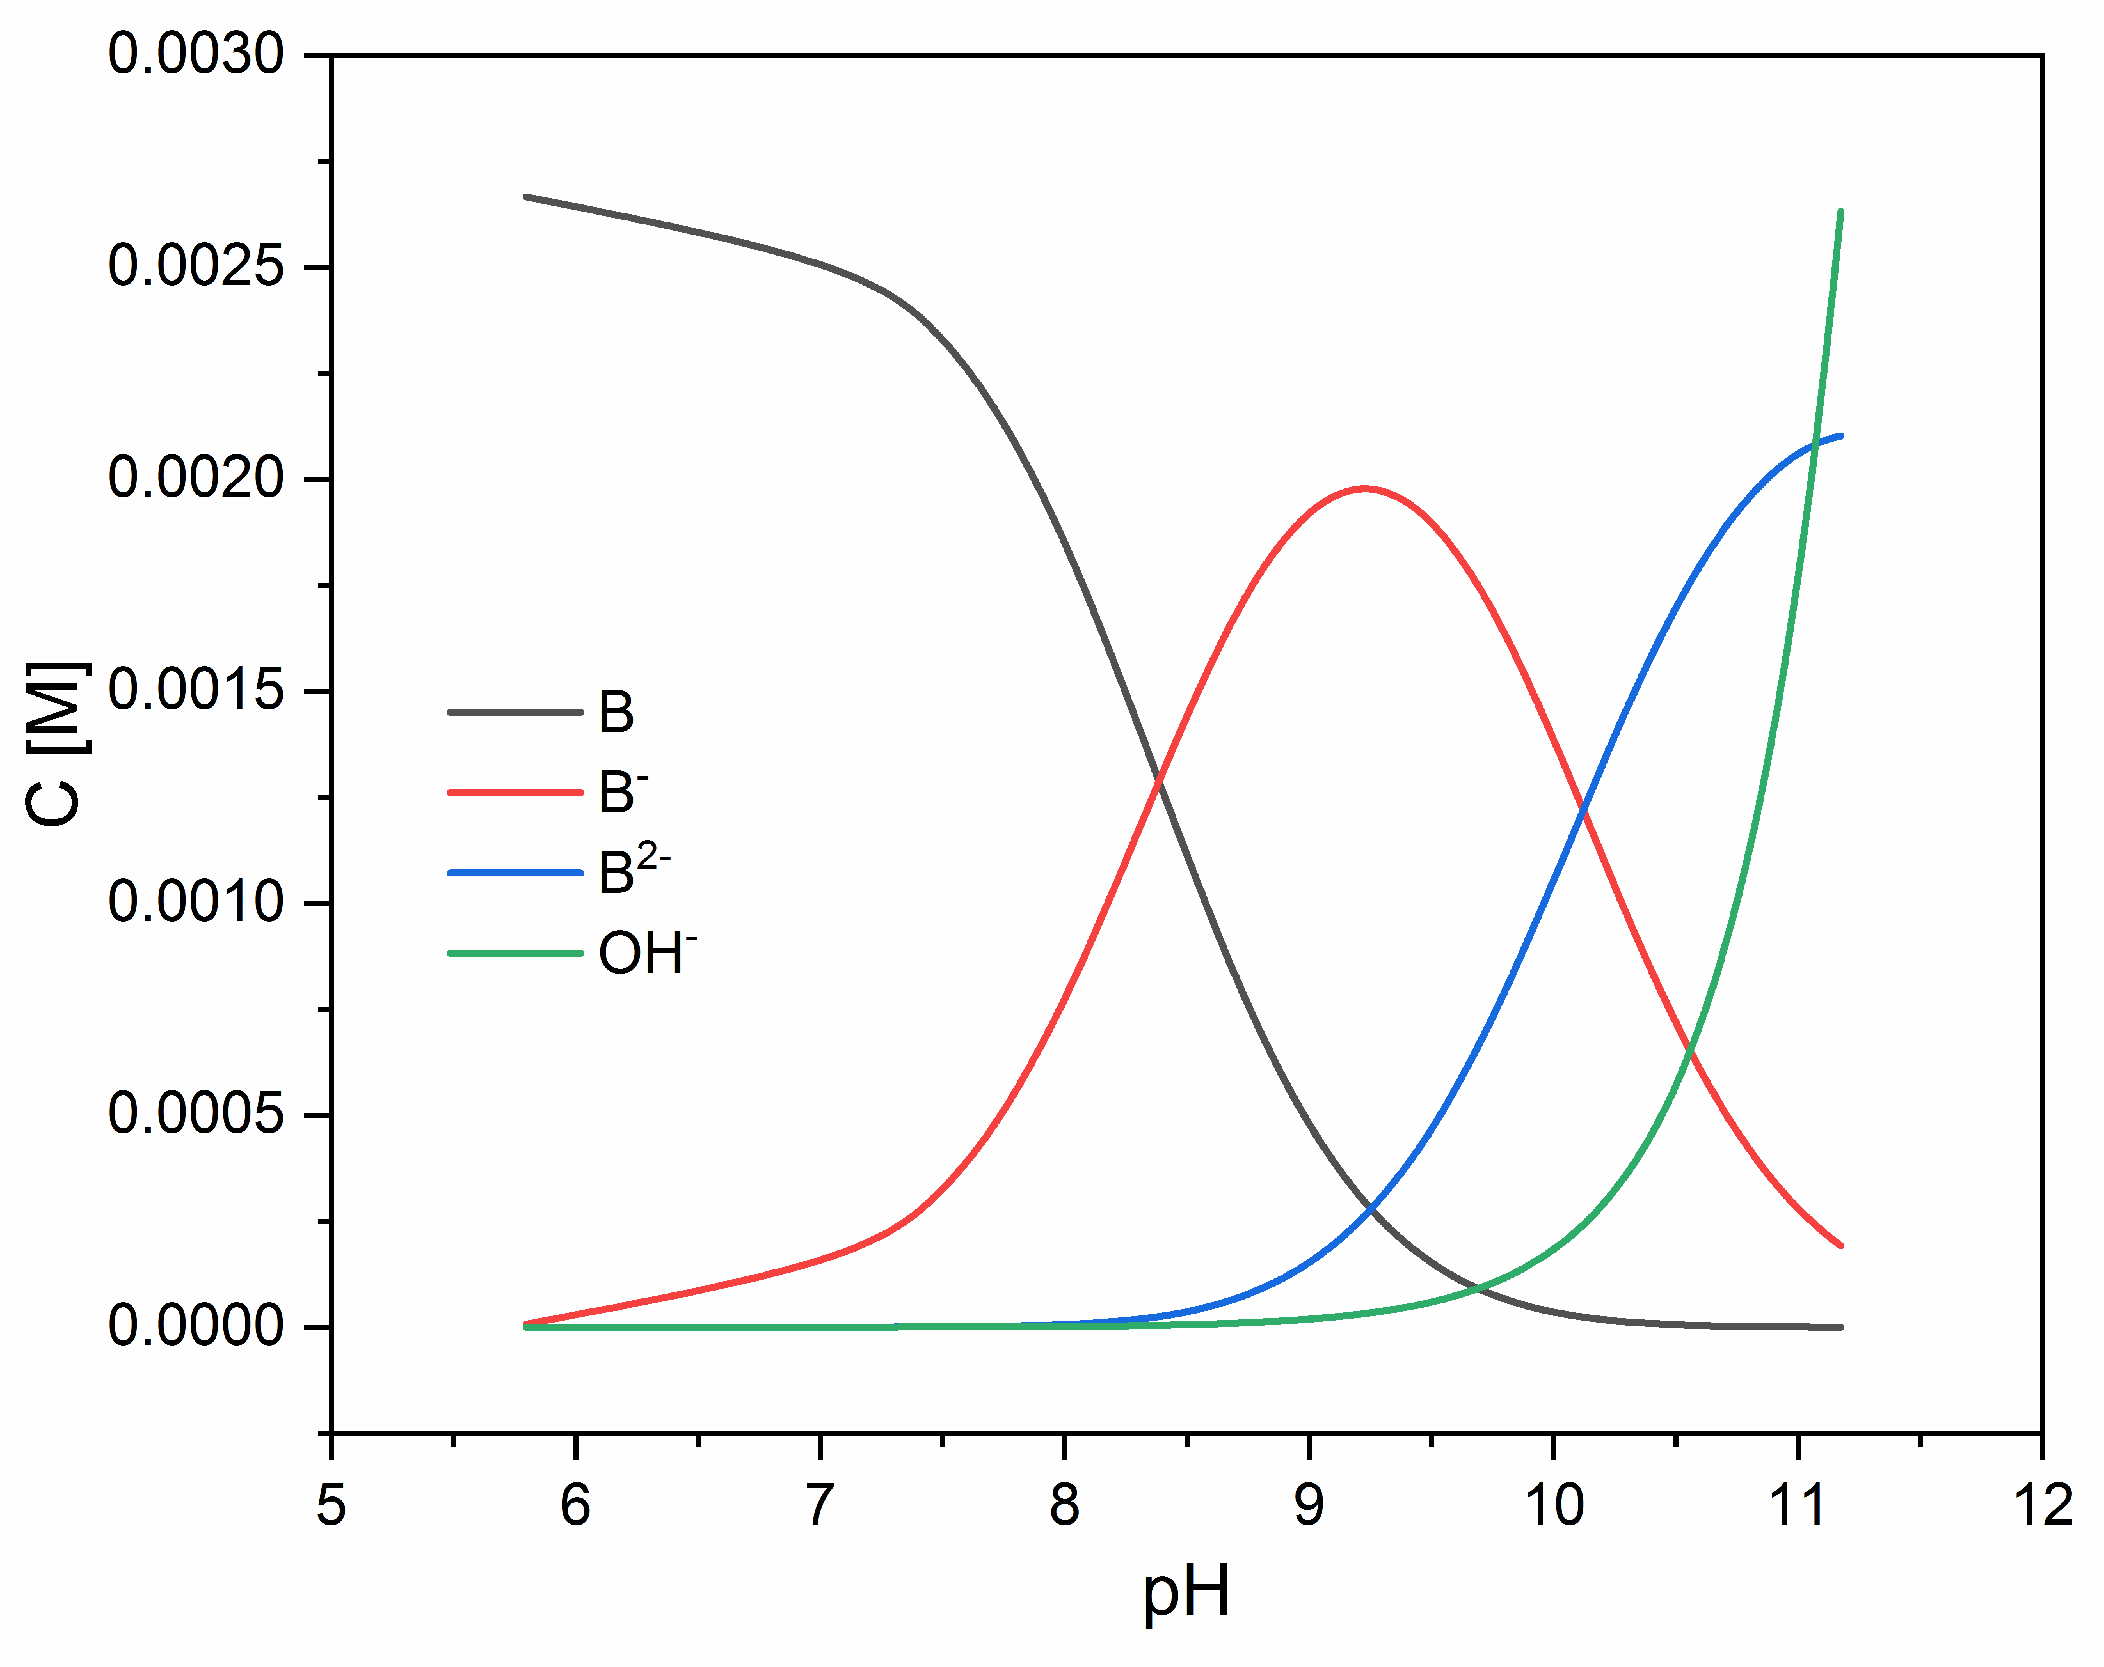
2.1. pKa Determination
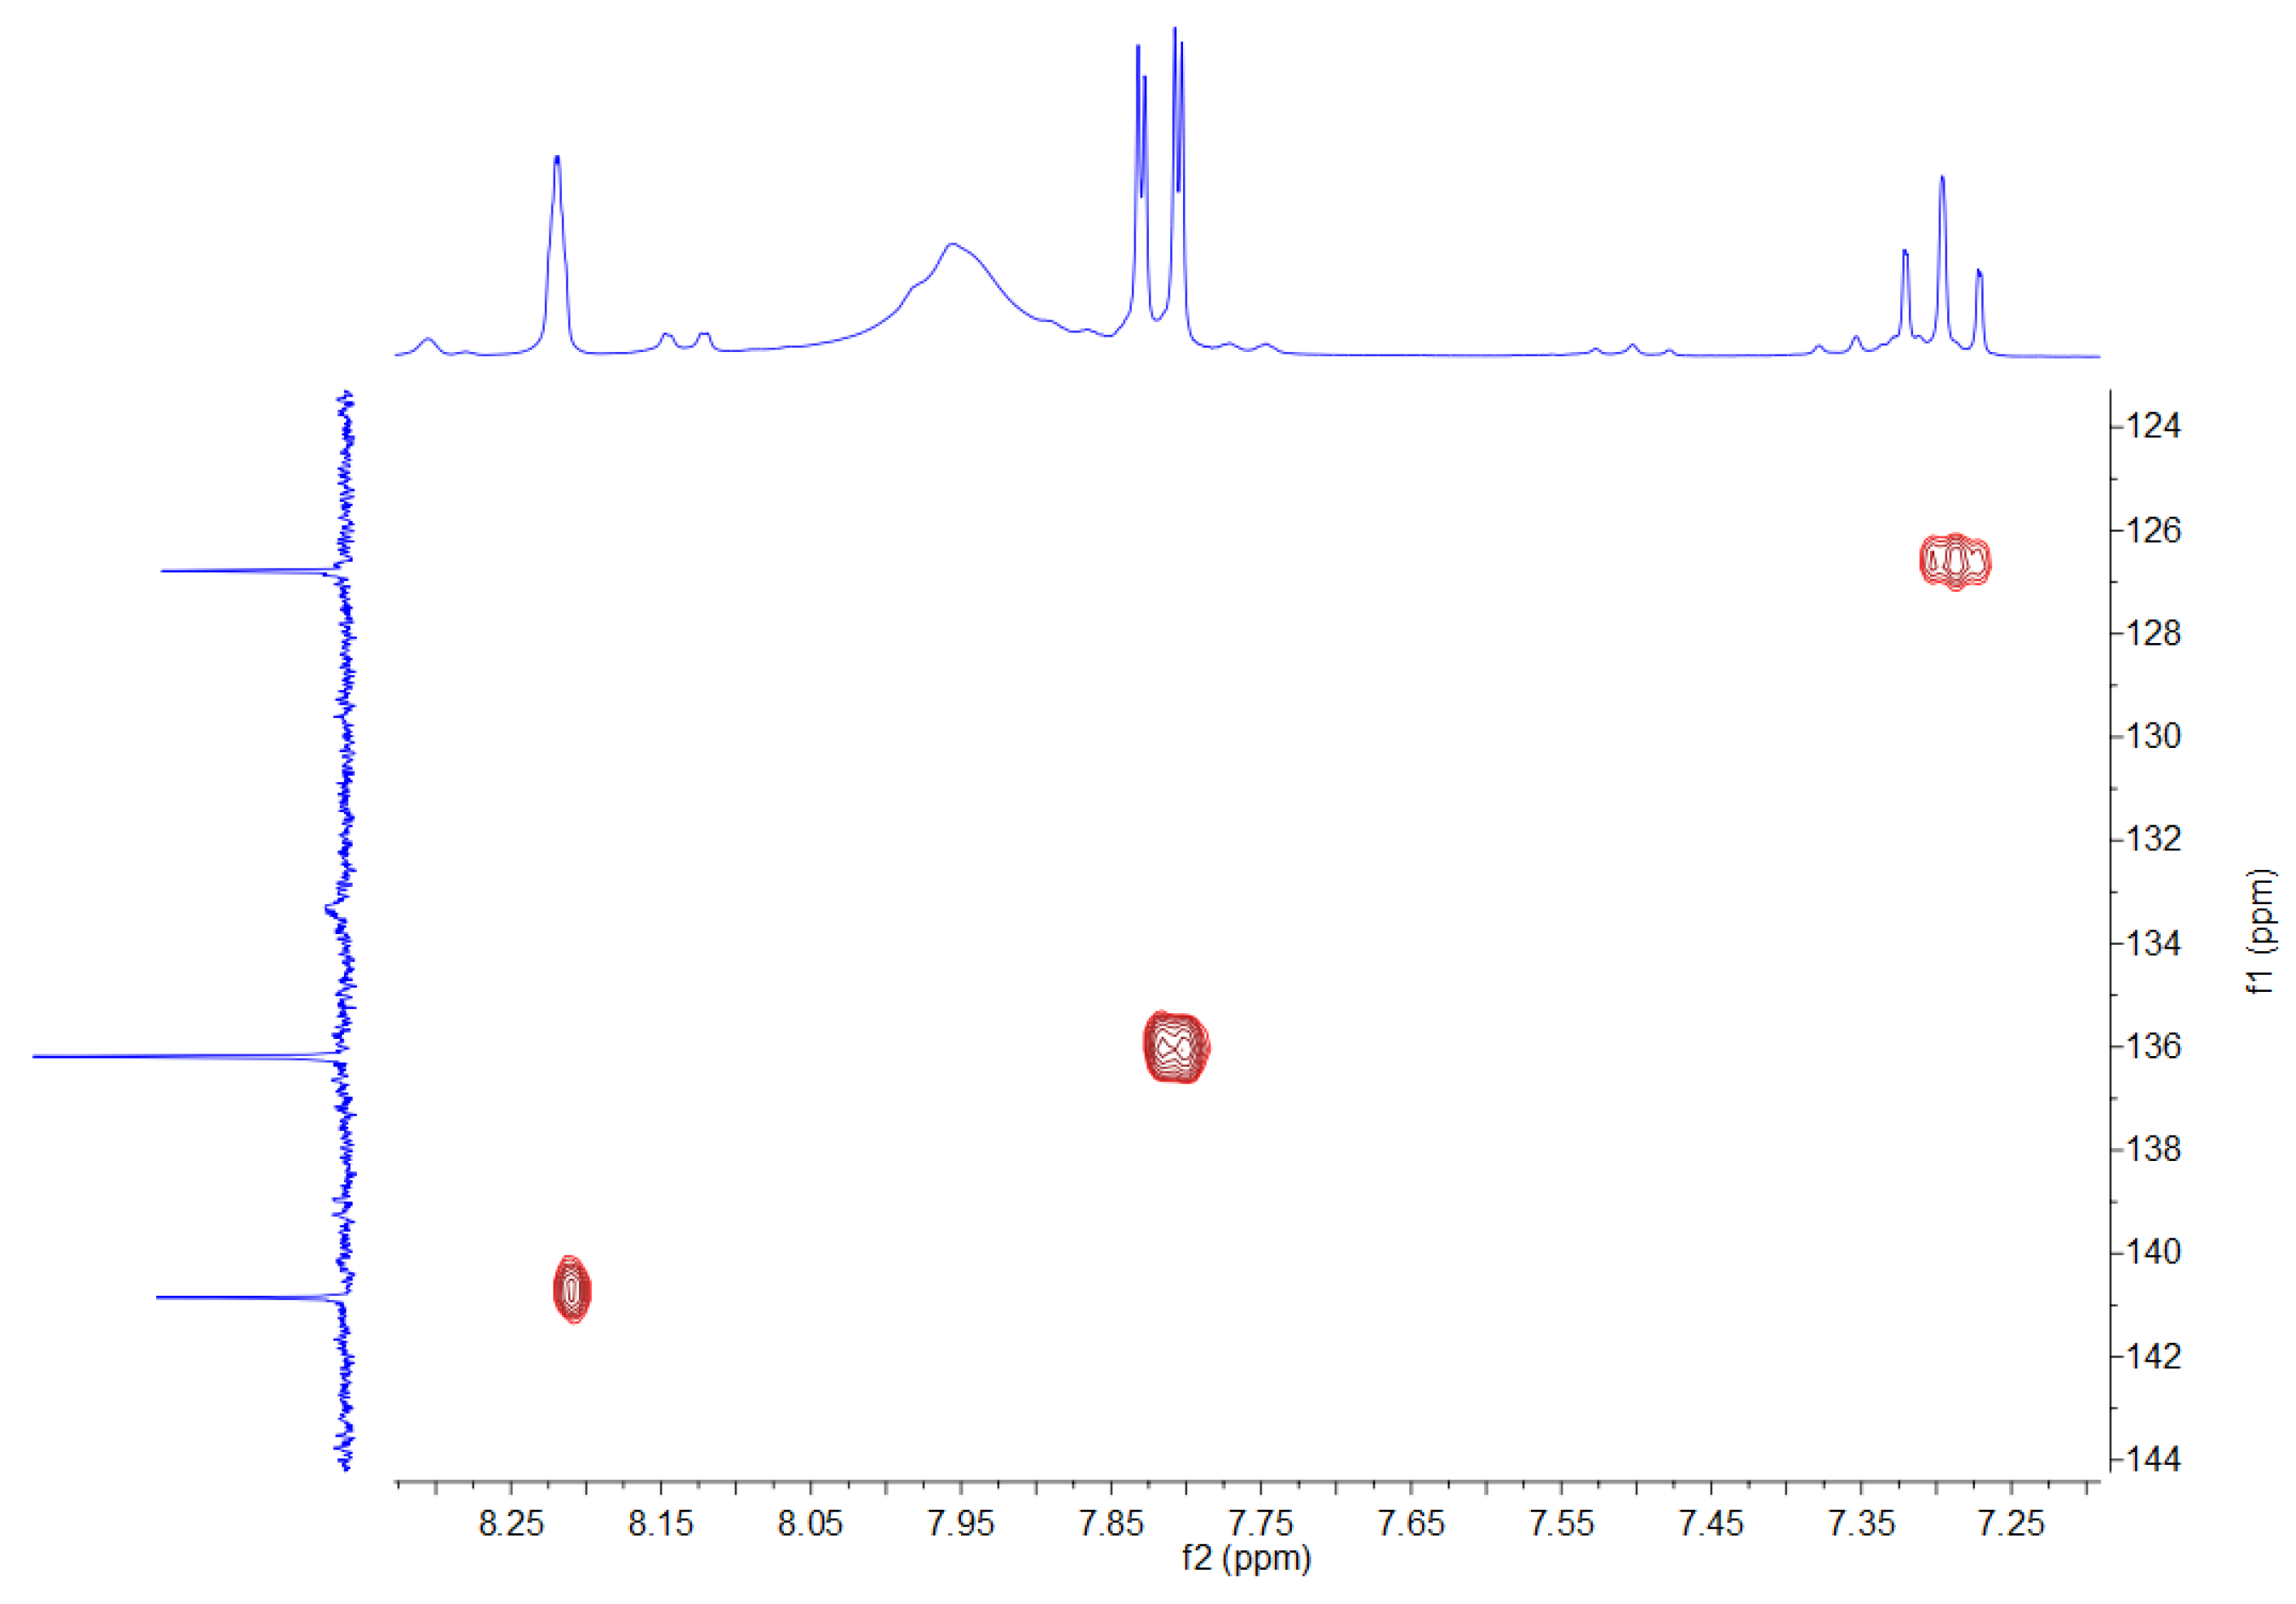
2.2. NMR Measurements
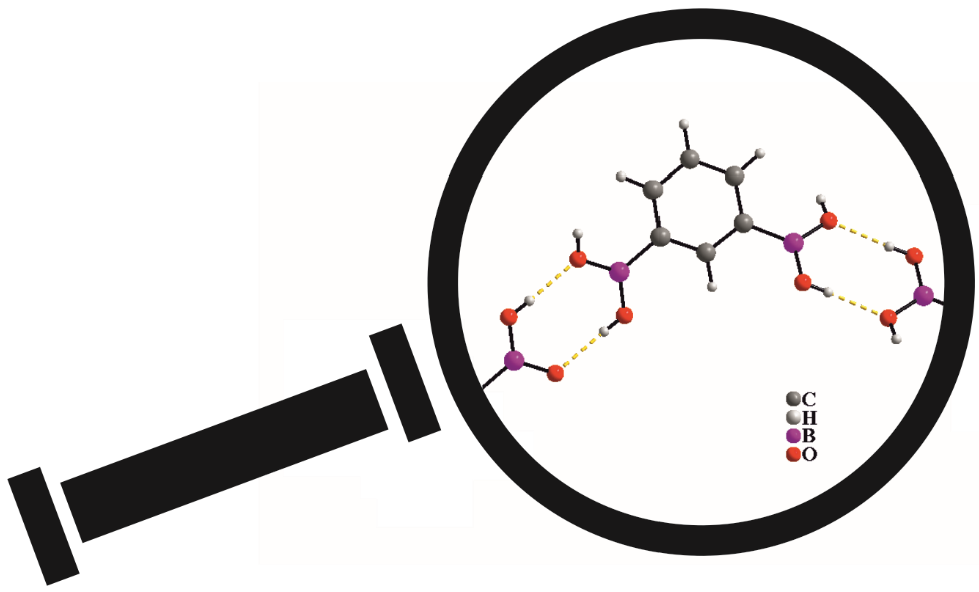
2.3. Single Crystal X-ray Diffraction
2.4. X-ray Powder Diffraction (XRPD)
2.5. Thermal Analysis
2.6. Differential Scanning Calorimetry (DSC)
2.7. Theoretical Calculations
2.7.1. CRYSTAL09 Calculations
2.7.2. Gaussian09 Calculations
2.7.3. Topological Analysis of Electron Density
3. Results
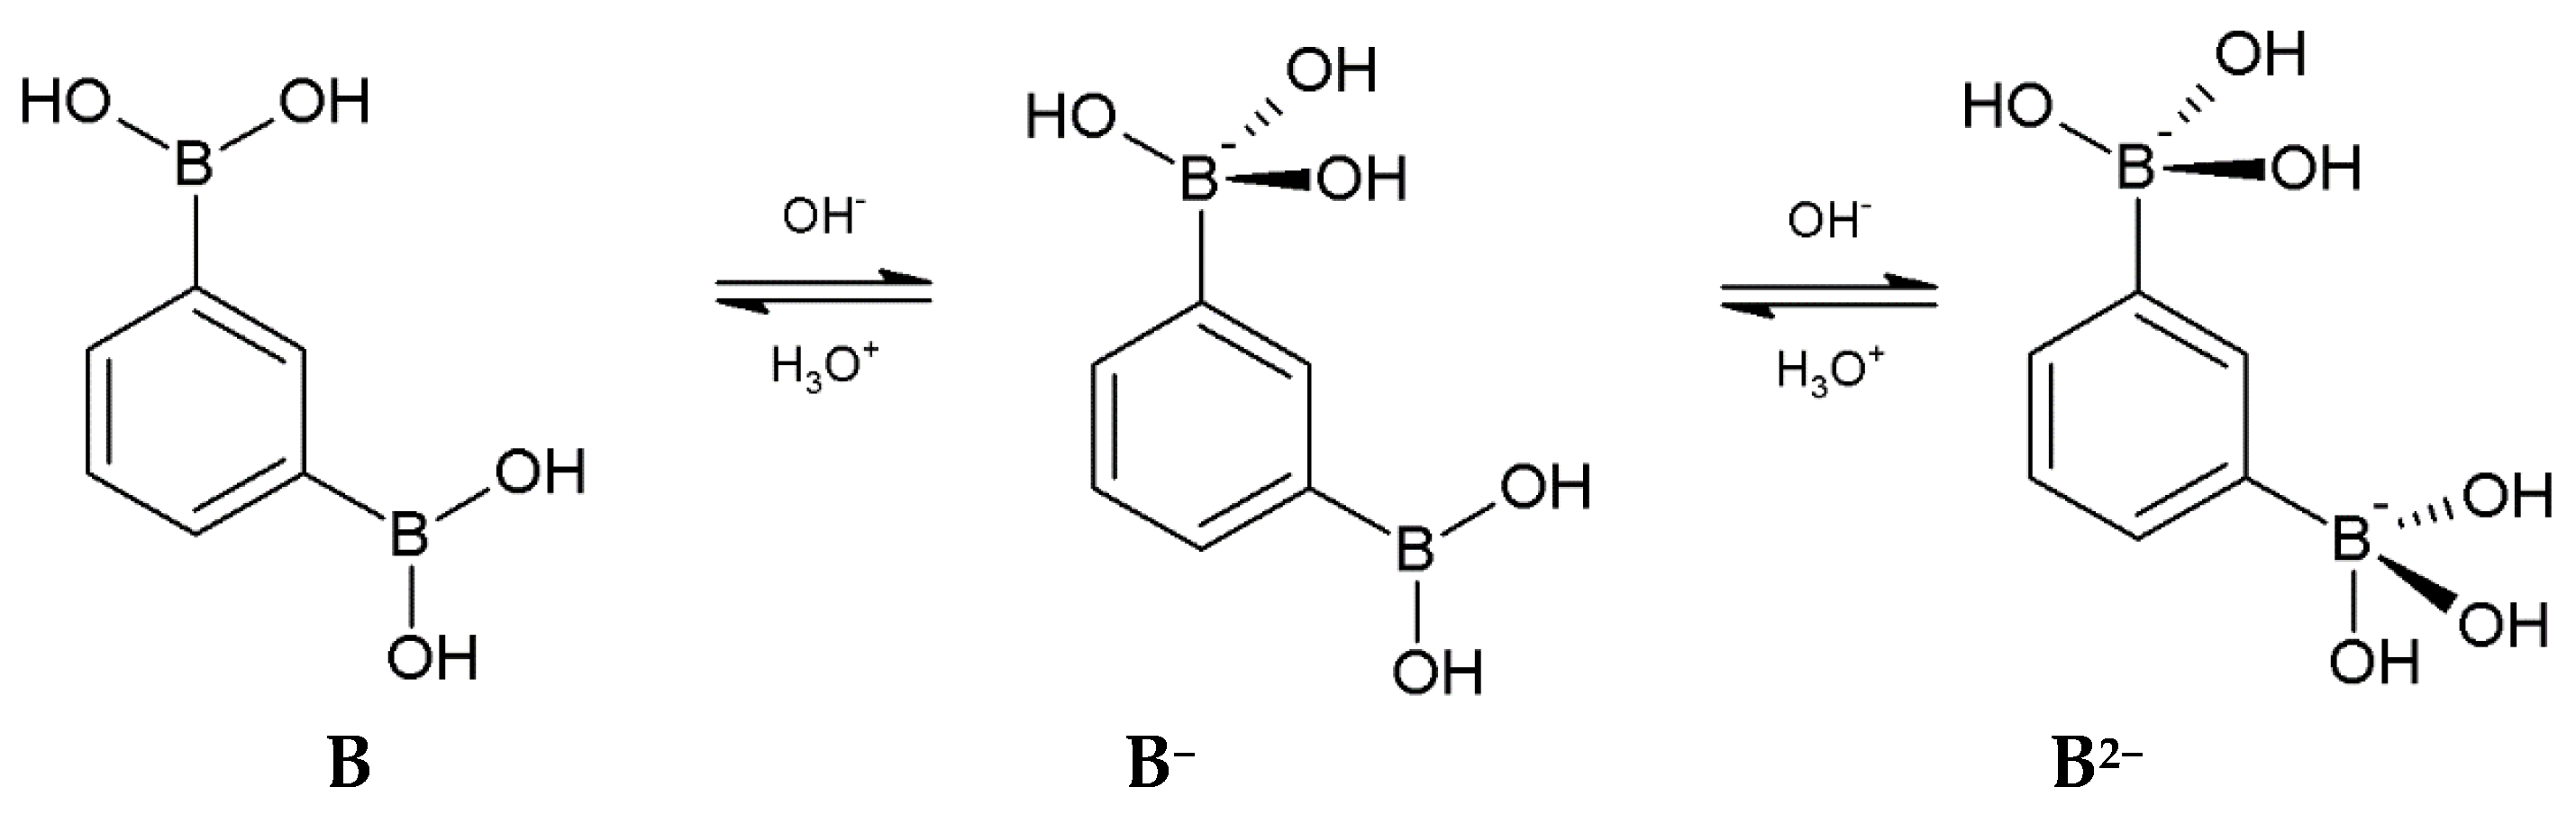
3.1. Acidity Constants
3.2. NMR Spectra
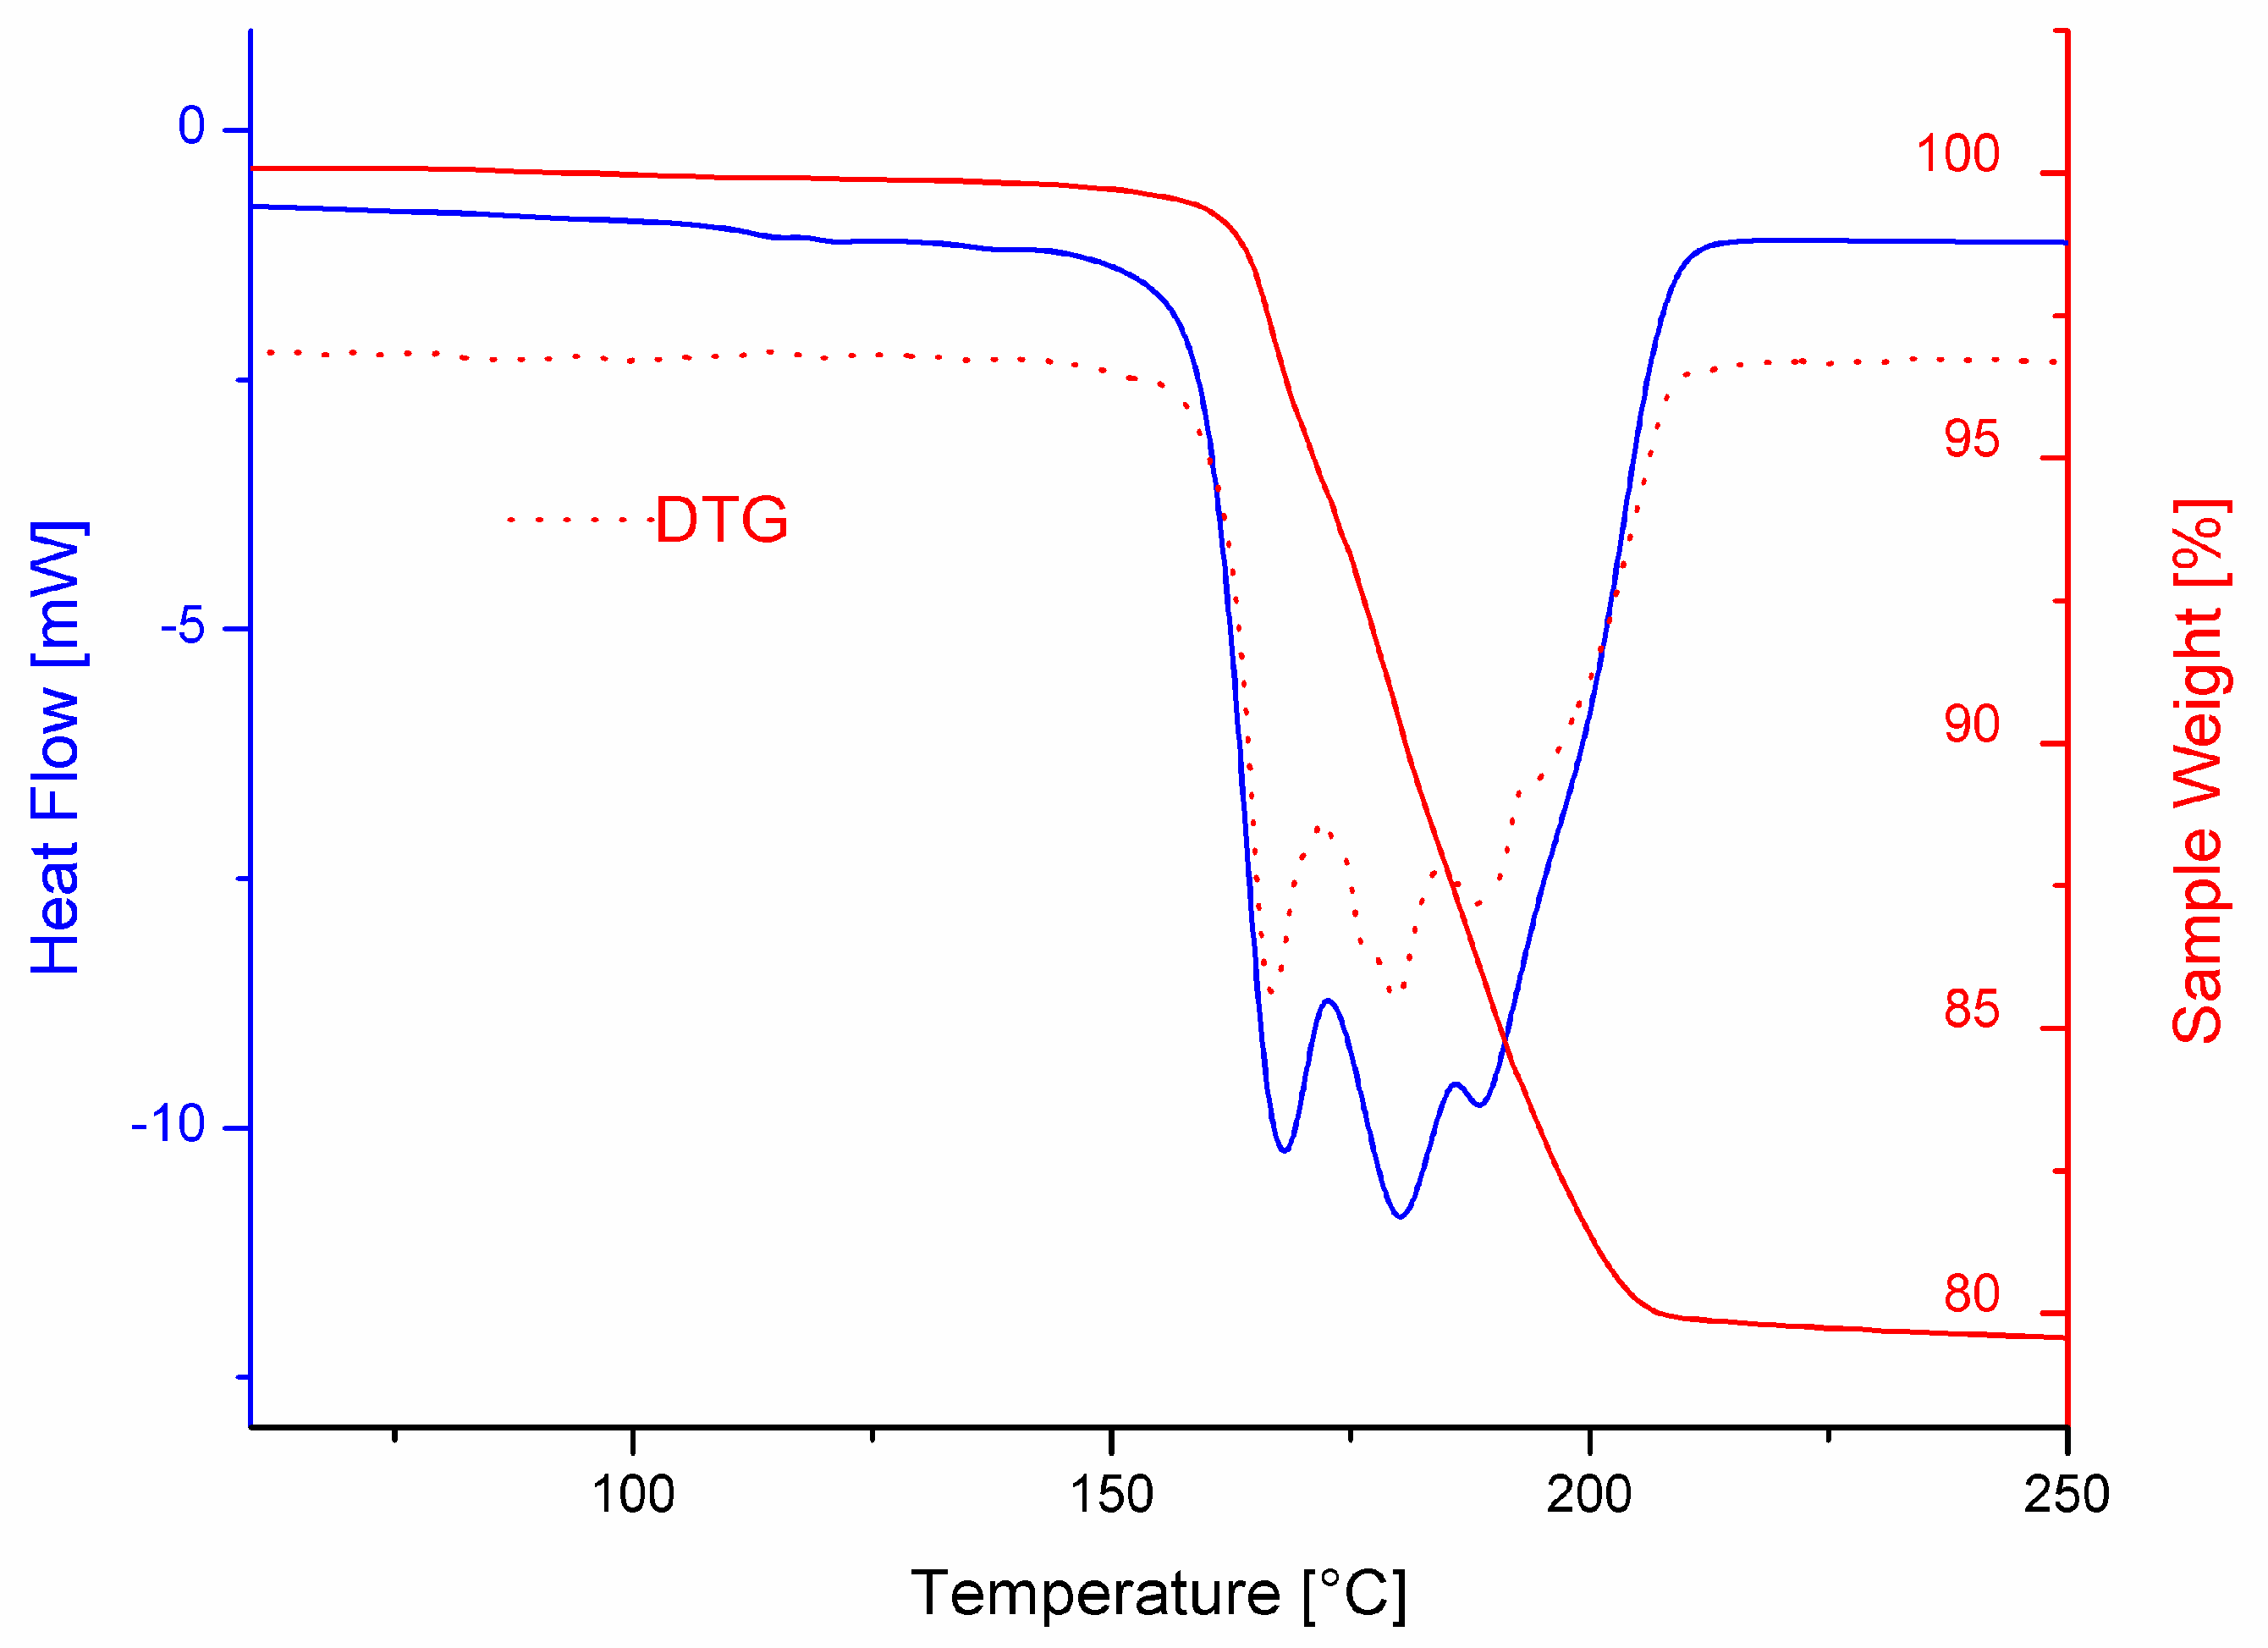
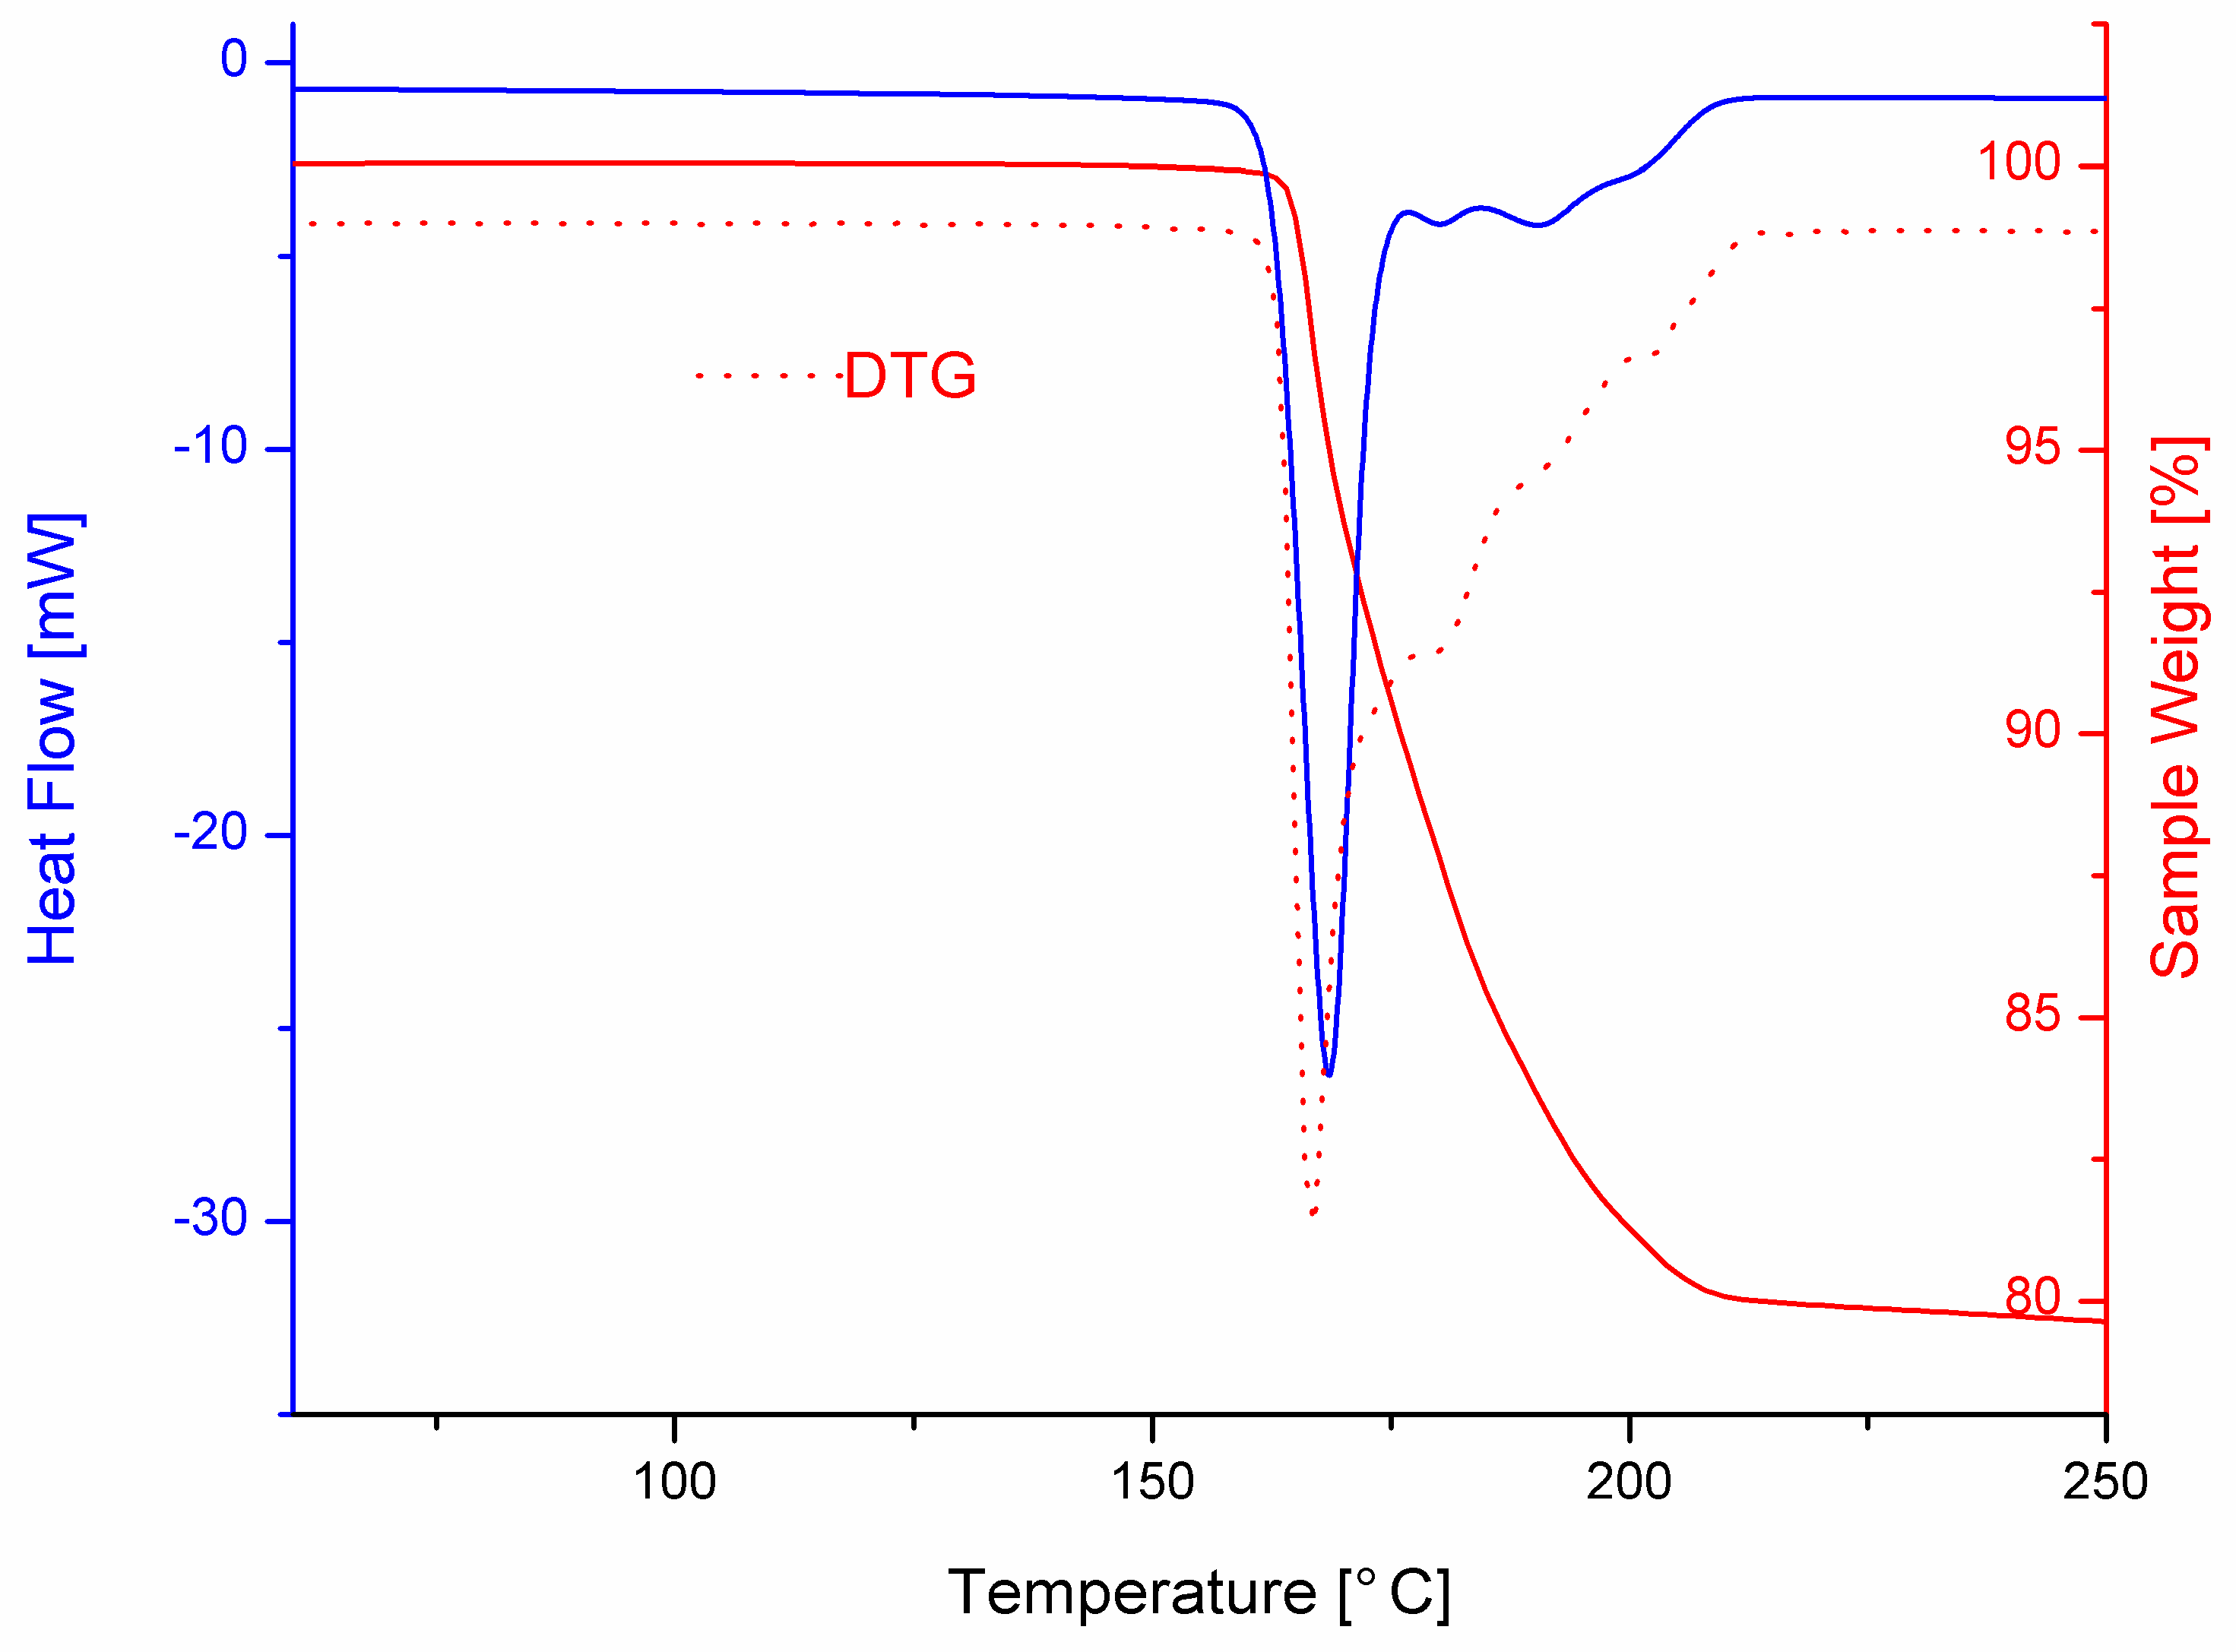
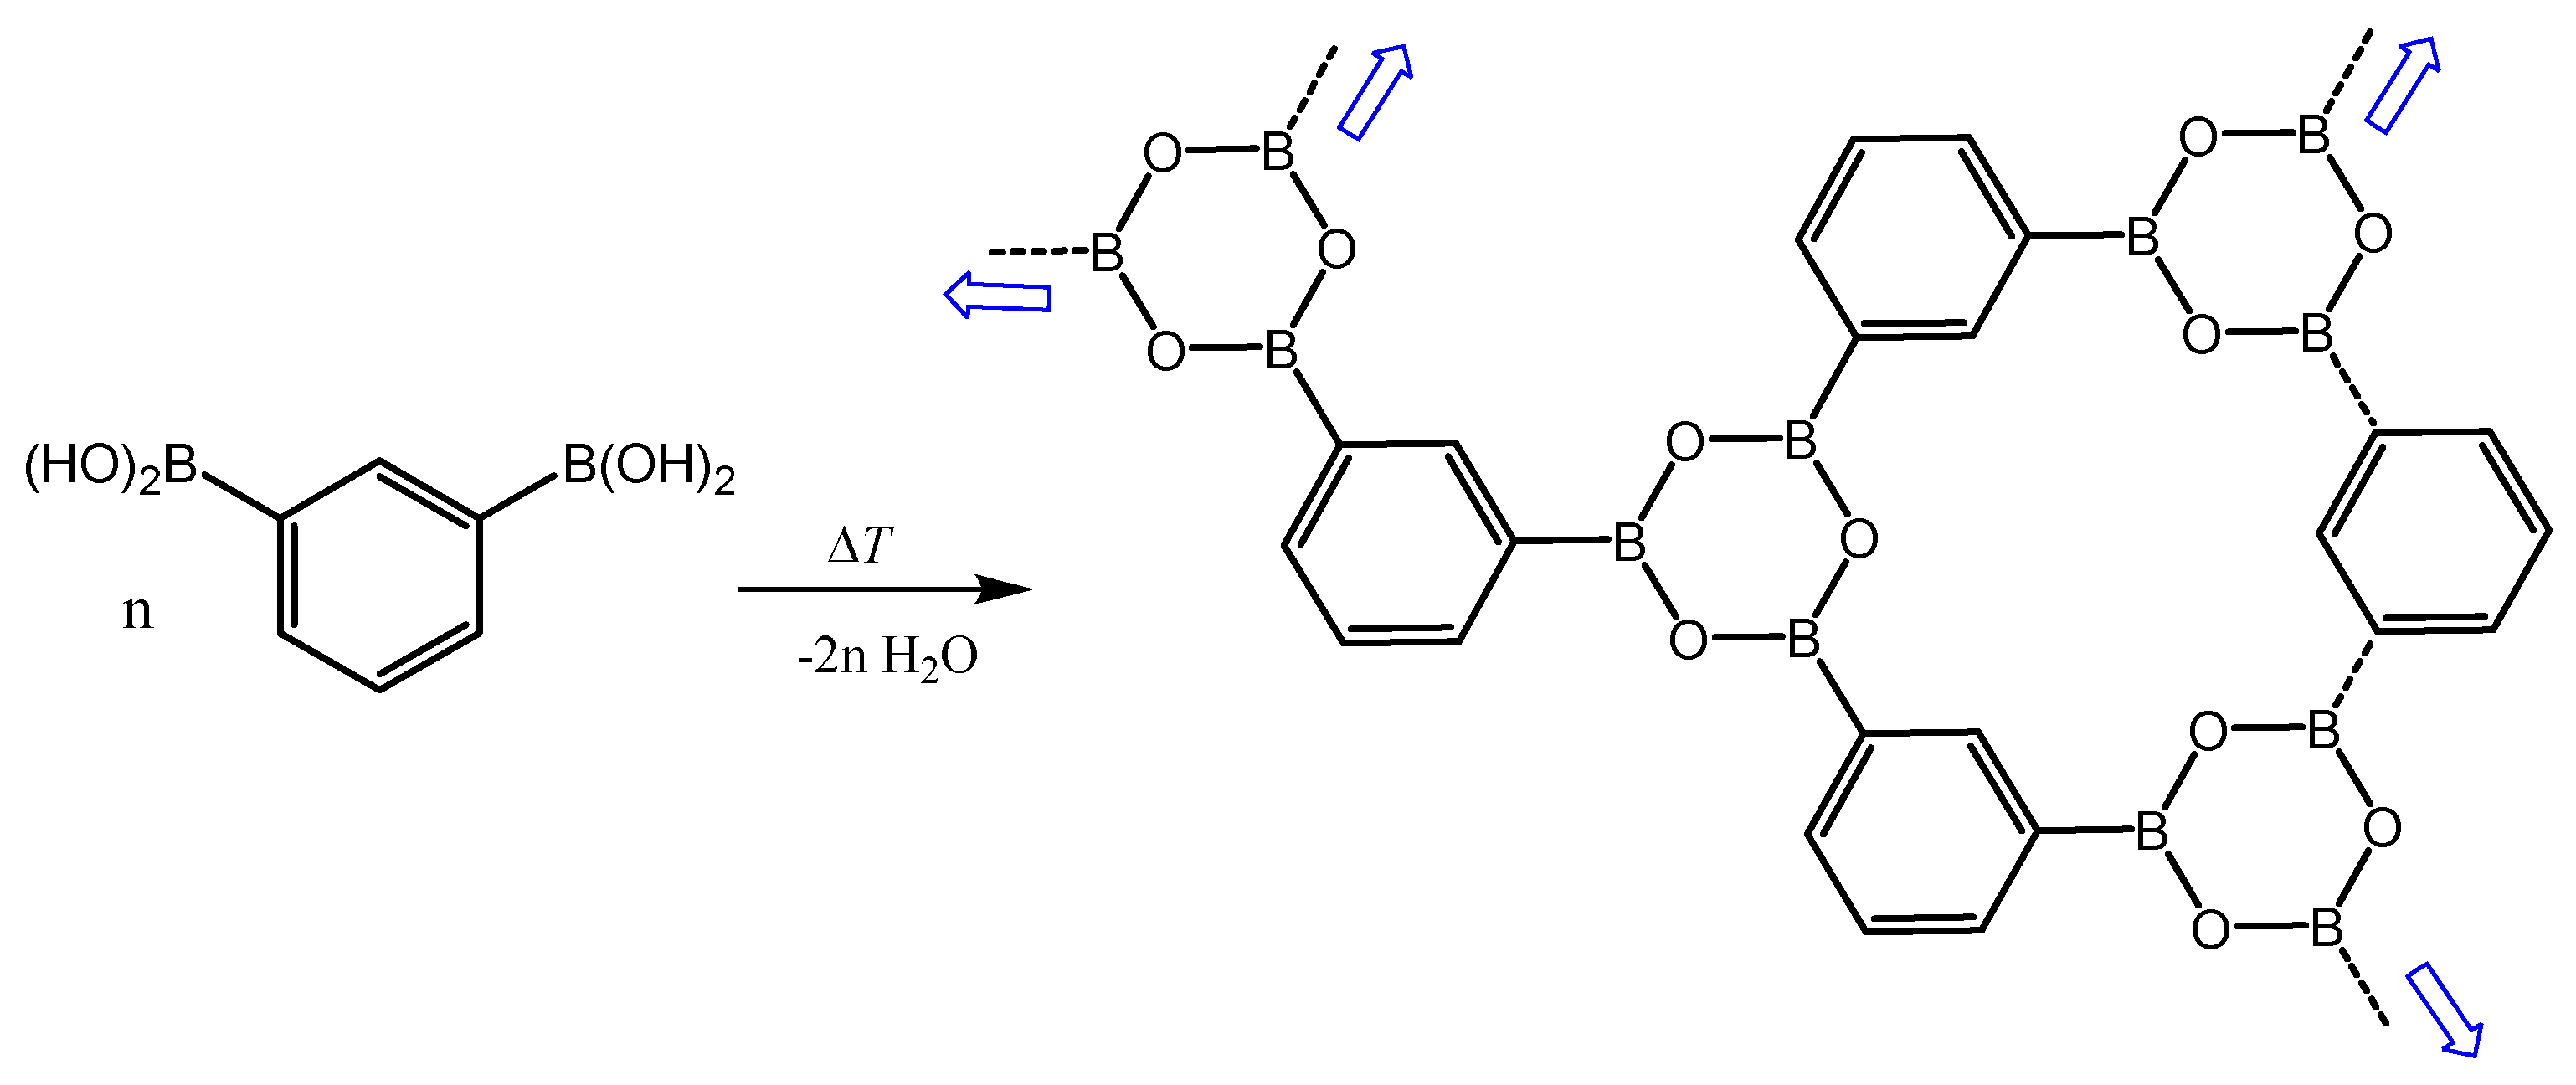
3.3. Thermal Behavior
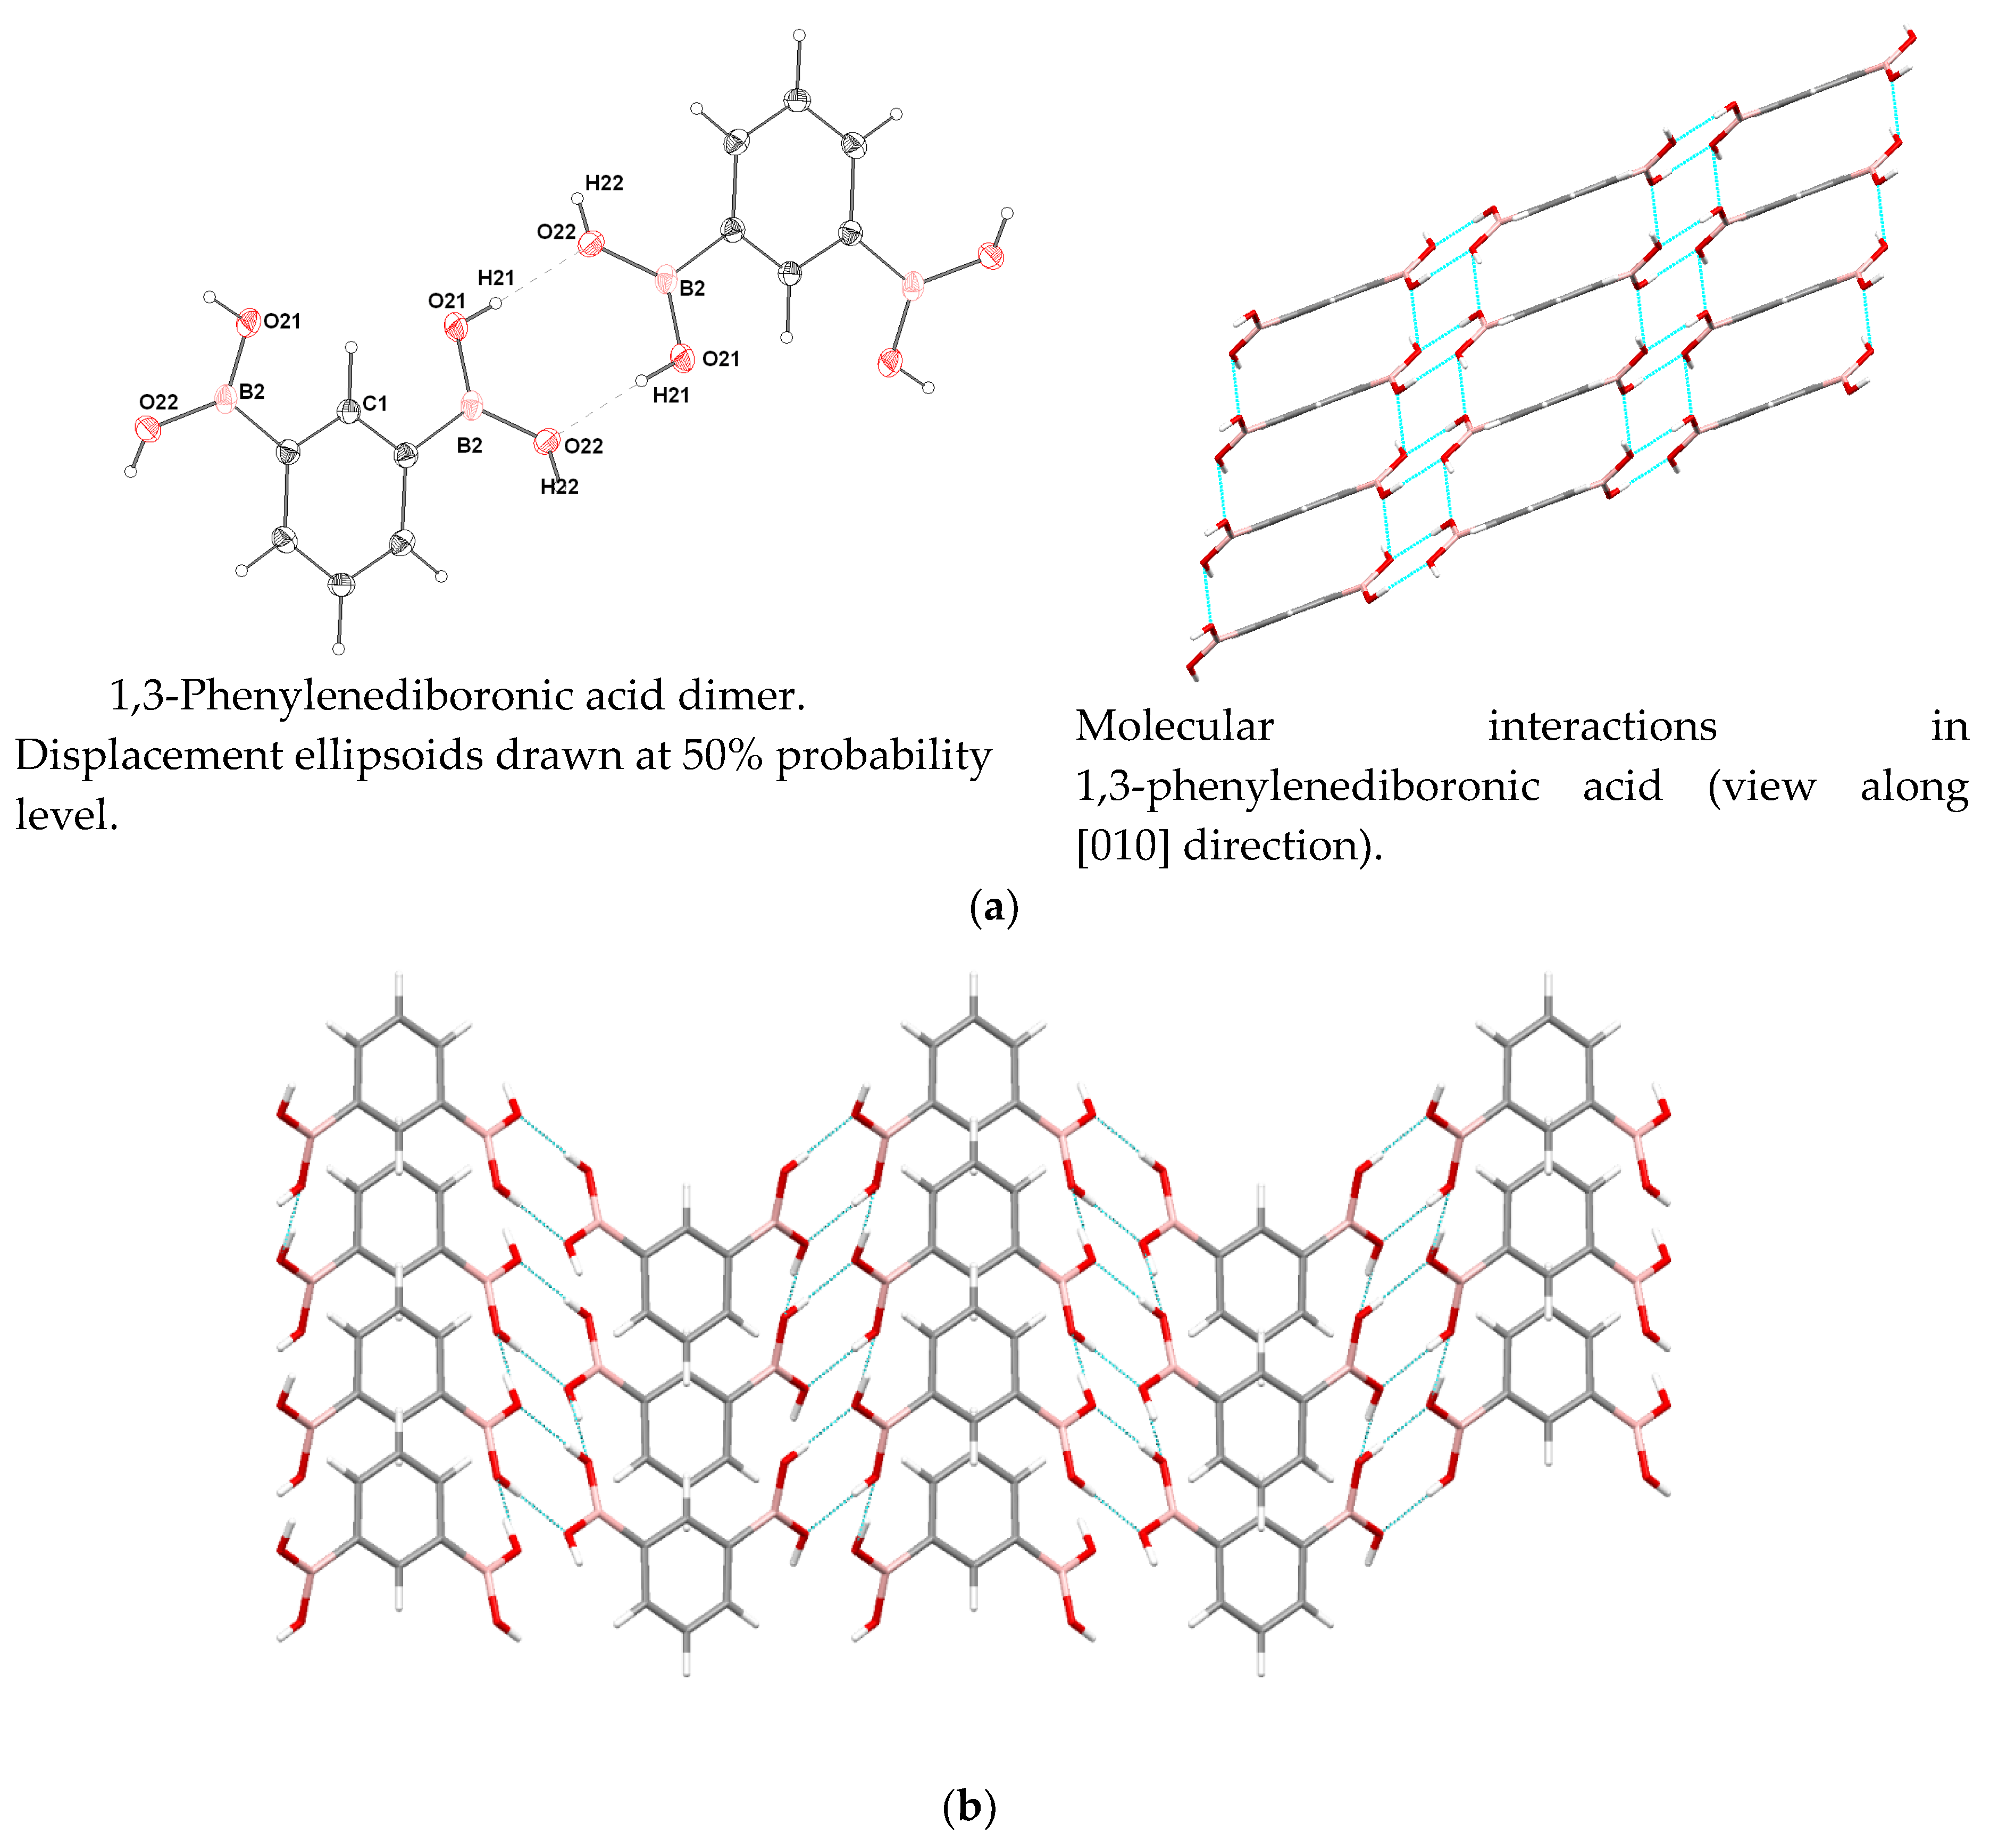
3.4. Molecular and Crystal Structure
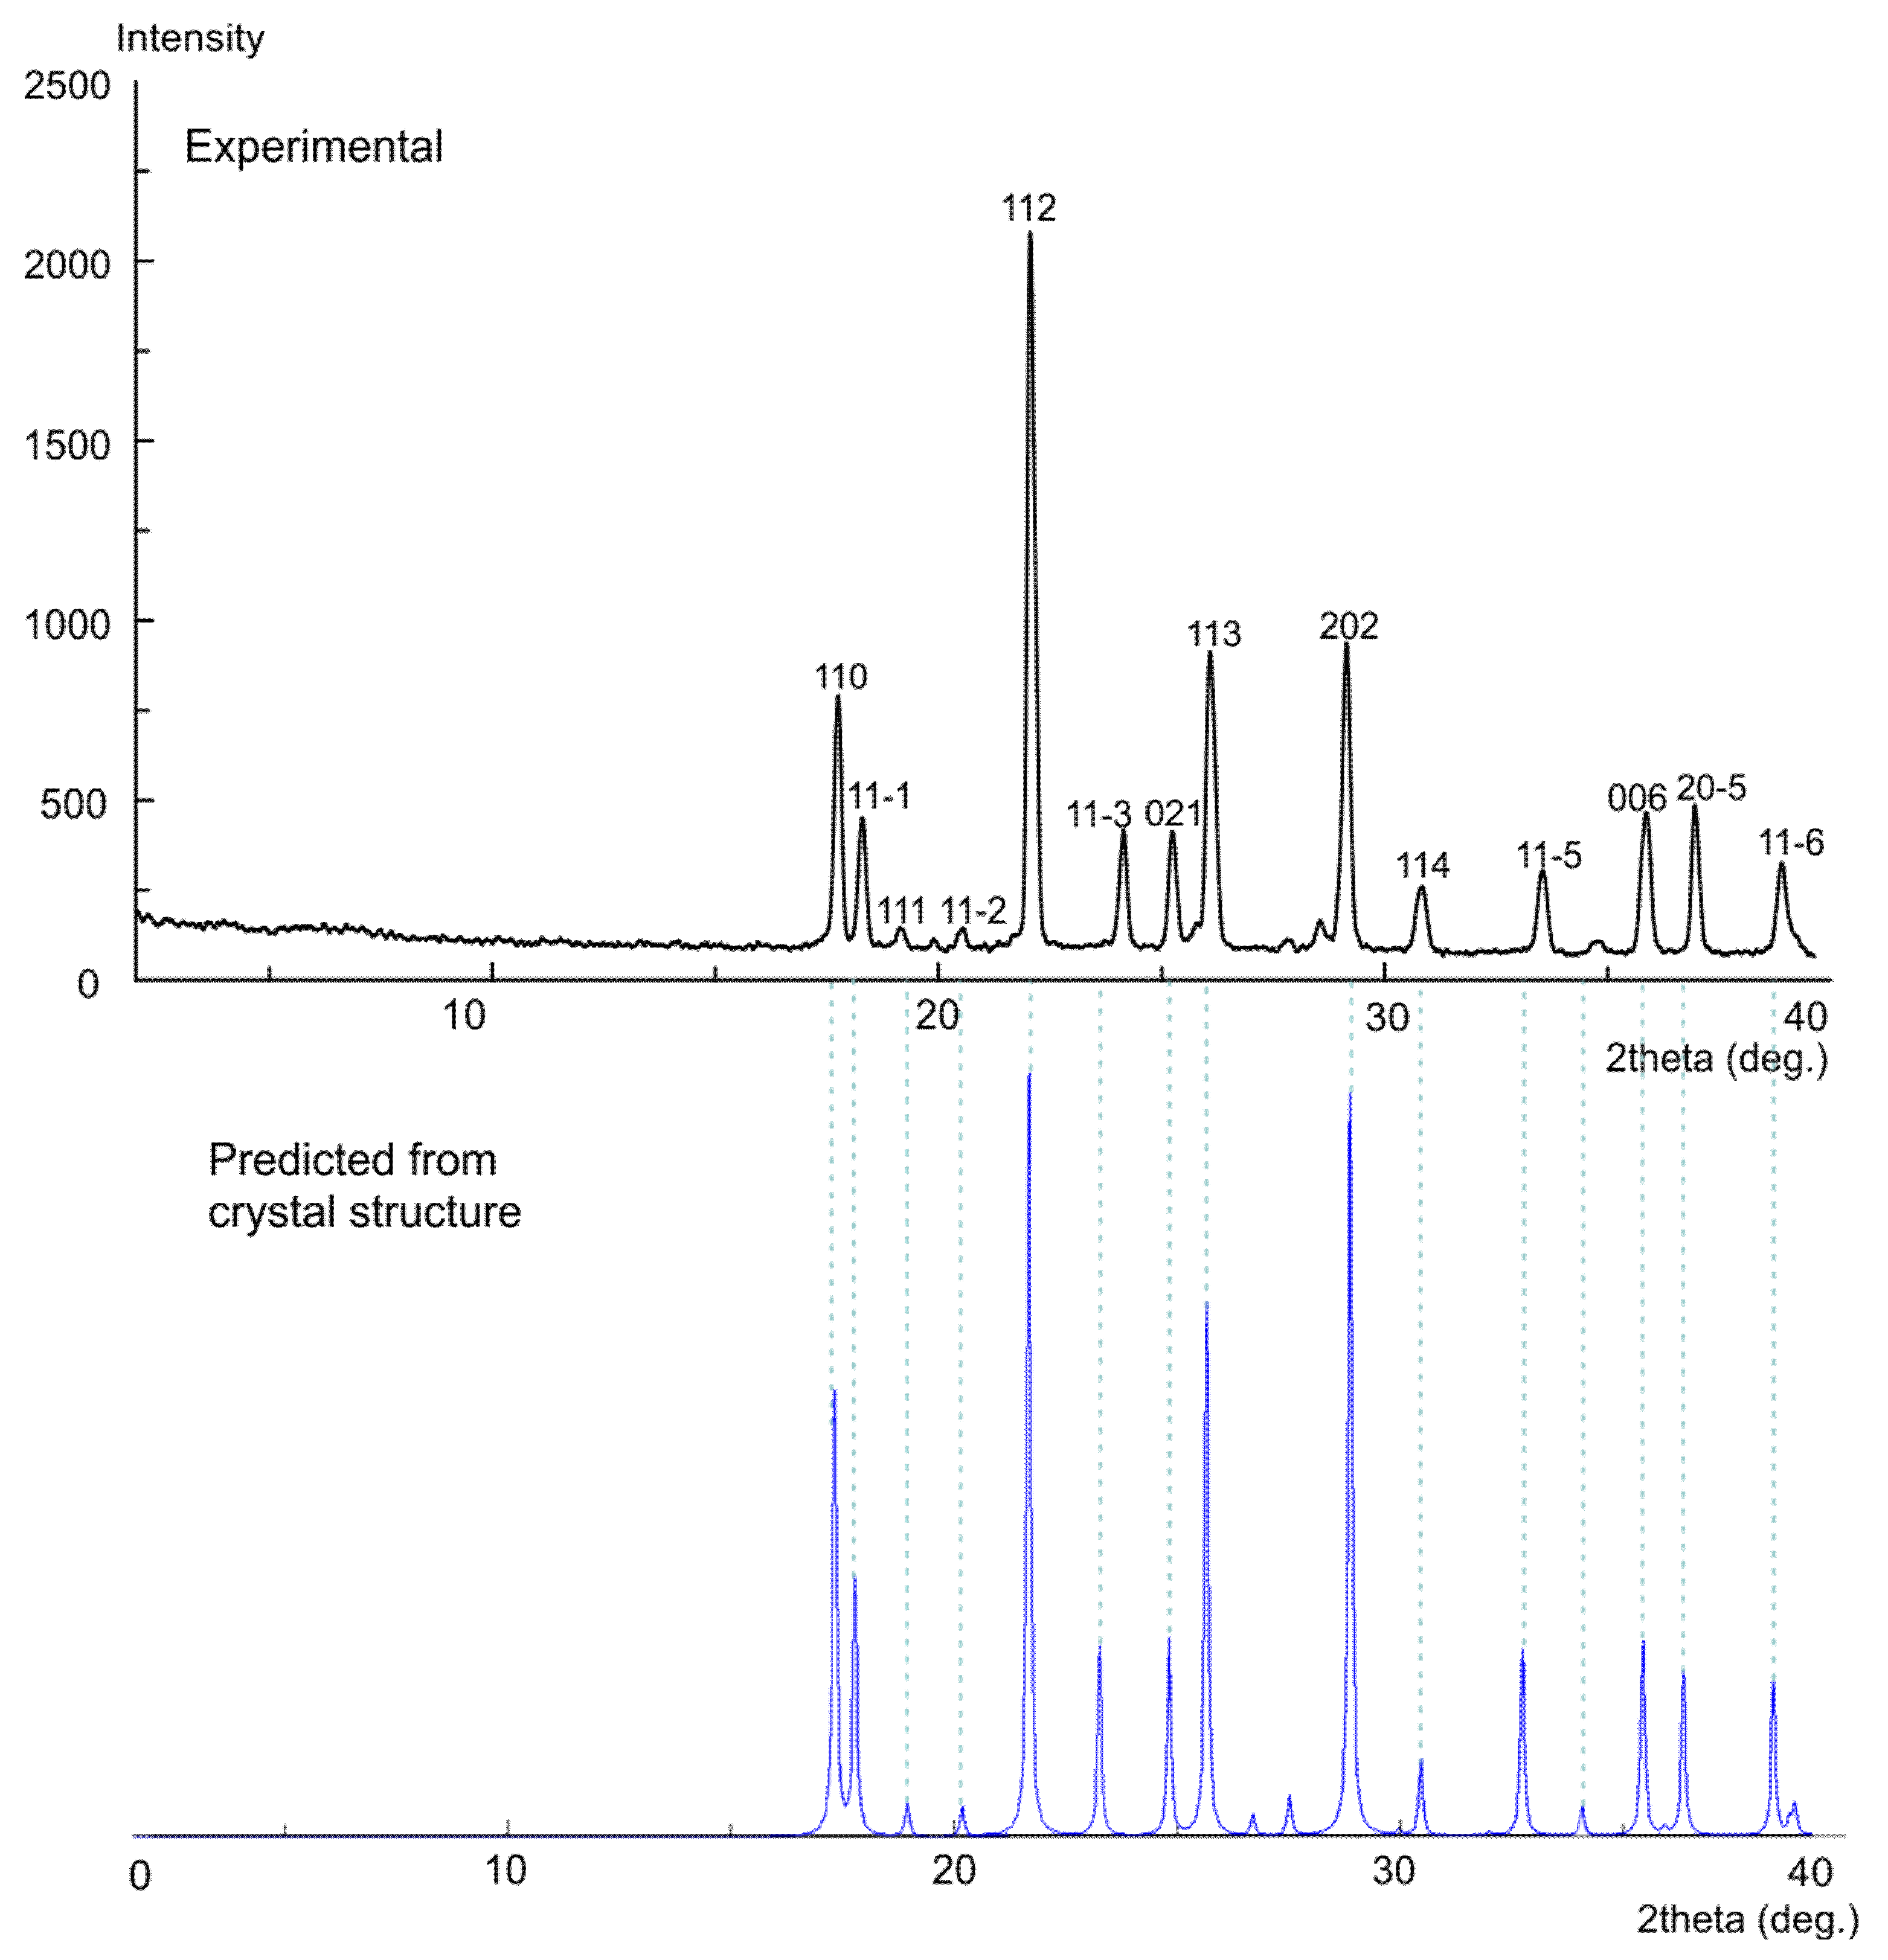
3.5. X-ray Powder Diffraction (XRPD)
3.6. Periodic DFT Calculations
3.7. Rotation Barrier
4. Conclusions
Supplementary Materials
Author Contributions
Acknowledgments
Conflicts of Interest
References
- WILEY-VCH. Boronic Acids. Preparation and Applications in Organic Synthesis, Medicine and Materials, 2nd ed.; Hall, D.G., Ed.; WILEY-VCH: Weinheim, Germany, 2011. [Google Scholar]
- Nishiyabu, R.; Kubo, Y.; James, T.D.; Fossey, J.S. Boronic acid building blocks: Tools for self assembly. Chem. Commun. 2011, 47, 1124–1150. [Google Scholar] [CrossRef] [PubMed]
- Adamczyk-Woźniak, A.; Borys, K.M.; Sporzyński, A. Recent Developments in the Chemistry and Biological Applications of Benzoxaboroles. Chem. Rev. 2015, 115, 5224–5247. [Google Scholar] [CrossRef] [PubMed]
- Dembitsky, V.M.; Al Quntar, A.A.A.; Srebnik, M. Natural and synthetic small boron-containing molecules as potential inhibitors of bacterial and fungal quorum sensing. Chem. Rev. 2011, 111, 209–237. [Google Scholar] [CrossRef] [PubMed]
- Feng, X.; Ding, X.; Jiang, D. Covalent organic frameworks. Chem. Soc. Rev. 2012, 41, 6010–6022. [Google Scholar] [CrossRef]
- Ding, S.Y.; Wang, W. Covalent organic frameworks (COFs): From design to applications. Chem. Soc. Rev. 2013, 42, 548–568. [Google Scholar] [CrossRef] [PubMed]
- Waller, P.J.; Gándara, F.; Yaghi, O.M. Chemistry of Covalent Organic Frameworks. Acc. Chem. Res. 2015, 48, 3053–3063. [Google Scholar] [CrossRef] [PubMed]
- Côté, A.P.; Benin, A.I.; Ockwig, N.W.; O’Keeffe, M.; Matzger, A.J.; Yaghi, O.M. Porous, Crystalline, Covalent Organic Frameworks. Science 2005, 310, 1166–1170. [Google Scholar] [CrossRef]
- Adamczyk-Woźniak, A.; Sporzyński, A. Diboronic Acids and Their Derivatives: New Perspectives in Sensing and Materials’ Chemistry. In Advances in Materials Science Research Vol. 32; Wythers, M.C., Ed.; Nova Science Publishers, Inc.: New York, NY, USA, 2018; pp. 201–233. ISBN 978-1-53613-329-5. [Google Scholar]
- Rodríguez-Cuamatzi, P.; Vargas-Díaz, G.; Maris, T.; Wuest, J.D.; Höpfl, H. 1,4-Phenylenediboronic acid. Acta Crystallogr. Sect. E Struct. Rep. Online 2004, E60, o1316–o1318. [Google Scholar] [CrossRef]
- Rodríguez-Cuamatzi, P.; Vargas-Díaz, G.; Höpfl, H. Modification of 2D water that contains hexameric units in chair and boat conformations—A contribution to the structural elucidation of bulk water. Angew. Chem. Int. Ed. 2004, 43, 3041–3044. [Google Scholar] [CrossRef]
- Maly, K.E.; Maris, T.; Wuest, J.D. Two-dimensional hydrogen-bonded networks in crystals of diboronic acids. CrystEngComm 2006, 8, 33–35. [Google Scholar] [CrossRef]
- Durka, K.; Jarzembska, K.N.; Kamiński, R.; Luliński, S.; Serwatowski, J.; Woźniak, K. Nanotubular hydrogen-bonded organic framework architecture of 1,2-phenylenediboronic acid hosting ice clusters. Cryst. Growth Des. 2013, 13, 4181–4185. [Google Scholar] [CrossRef]
- Durka, K.; Luliński, S.; Serwatowski, J.; Woźniak, K. Influence of fluorination and boronic group synergy on the acidity and structural behavior of o-phenylenediboronic acids. Organometallics 2014, 33, 1608–1616. [Google Scholar] [CrossRef]
- Jarzembska, K.N.; Kaminski, R.; Durka, K.; Kubsik, M. Engineering of solvatomorphs of the luminescent complex of ortho-phenylenediboronic acid and 8-hydroxyquinoline. Cryst. Growth Des. 2017, 17, 6836–6851. [Google Scholar] [CrossRef]
- Da̧browski, M.; Luliński, S.; Serwatowski, J. (2-Methoxy-1,3-phenylene)diboronic acid. Acta Crystallogr. Sect. E Struct. Rep. Online 2008, 64, o414–o415. [Google Scholar] [CrossRef] [PubMed]
- Durka, K.; Luliński, S.; Smȩtek, J.; Da̧browski, M.; Serwatowski, J.; Woźniak, K. The influence of boronate groups on the selectivity of the Br-Li exchange in model dibromoaryl boronates. Eur. J. Org. Chem. 2013, 2013, 3023–3032. [Google Scholar] [CrossRef]
- Rodríguez-Cuamatzi, P.; Luna-García, R.; Torres-Huerta, A.; Bernal-Uruchurtu, M.I.; Barba, V.; Höpfl, H. On the Organizing Role of Water Molecules in the Assembly of Motifs & DESIGN 2009. Cryst. Growth Des. 2009, 9, 1575–1583. [Google Scholar]
- Kostrowicki, J.; Liwo, A. Determination of equilibrium parameters by minimization of an extended sum of squares. Talanta 1990, 37, 645–650. [Google Scholar] [CrossRef]
- Kostrowicki, J.; Liwo, A. DECFAM—A new computer oriented algorithm for the determination of equilibrium constants from potentionmetric and/or spectrophotometric measurements—I: Basic principles of the method and calculations of equilibrium concentrations. Comput. Chem. 1984, 8, 91–99. [Google Scholar] [CrossRef]
- Kostrowicki, J.; Liwo, A. DECFAM—A new computer oriented algorithm for the determination of equilibrium constants from potentiometric and/or spectrophotometric measurements—II: Methods based on analytical expressions. Comput. Chem. 1984, 8, 101–105. [Google Scholar] [CrossRef]
- Chylewska, A.; Jacewicz, D.; Zarzeczańska, D.; Chmurzyński, L. Determination of dissociation constants for coordination compounds of Cr(III) and Co(III) using potentiometric and spectrophotometric methods. J. Chem. Thermodyn. 2008, 40, 1290–1294. [Google Scholar] [CrossRef]
- Oxford Diffraction Ltd. CrysAlis CCD and CrysAlis RED 2001, version 1.171.28 cycle2 beta; Oxford Diffraction Ltd.: Wrocław, Poland, 2005. [Google Scholar]
- Sheldrick, G.M. Phase annealing in SHELX-90: Direct methods for larger structures. Acta Crystallogr. Sect. A Found. Adv. 1990, 46, 467–473. [Google Scholar] [CrossRef]
- Sheldrick, G.M. SHELXL93. Program for the Refinement of Crystal Structures; University of Göttingen: Göttingen, Germany, 1993. [Google Scholar]
- International Union of Crystallography. International Tables for Crystallography: Mathematical, Physical, and Chemical Tables; Wilson, A.J.C., Ed.; International Union of Crystallography: Chester, UK, 1992; Volume 3. [Google Scholar]
- Dovesi, R.; Orlando, R.; Civalleri, B.; Roetti, R.; Saunders, V.R.; Zicovich-Wilson, C.M. CRYSTAL: A computational tool for the ab initio study of the electronic properties of crystals. Zeitschrift für Kristallographie 2005, 220, 571–573. [Google Scholar] [CrossRef]
- Dovesi, R.; Saunders, V.R.; Roetti, R.; Orlando, R.; Zicovich-Wilson, C.M.; Pascale, F.; Civalleri, B.; Doll, K.; Harrison, N.M.; Bush, I.J.; et al. CRYSTAL09; University of Torino: Torino, Italy, 2009. [Google Scholar]
- Allen, F.H.; Bruno, I.J. Bond lengths in organic and metal-organic compounds revisited: X—H bond lengths from neutron diffraction data. Acta Crystallogr. Sect. B Struct. Sci. 2010, 66, 380–386. [Google Scholar] [CrossRef] [PubMed]
- Peintinger, M.F.; Oliveira, D.V.; Bredow, T. Consistent Gaussian basis sets of triple-zeta valence with polarization quality for solid-state calculations. J. Comput. Chem. 2013, 34, 451–459. [Google Scholar] [CrossRef] [PubMed]
- Grimme, S. Accurate description of van der Waals complexes by density functional theory including empirical corrections. J. Comput. Chem. 2004, 25, 1463–1473. [Google Scholar] [CrossRef] [PubMed]
- Grimme, S. Semiempirical GGA-type density functional constructed with a long-range dispersion correction. J. Comput. Chem. 2006, 27, 1787–1799. [Google Scholar] [CrossRef] [PubMed]
- Frisch, M.J.; Trucks, G.W.; Schlegel, H.B.; Scuseria, G.E.; Robb, M.A.; Cheeseman, J.R.; Montgomery, J.A., Jr.; Vreven, T.; Kudin, K.N.; Burant, J.C.; et al. Gaussian09, Revision B.01; Gaussian Inc.: Wallingford, CT, USA, 2010. [Google Scholar]
- Zhao, Y.; Truhlar, D.G. The M06 suite of density functionals for main group thermochemistry, thermochemical kinetics, noncovalent interactions, excited states, and transition elements: Two new functionals and systematic testing of four M06-class functionals and 12 other function. Theor. Chem. Acc. 2008, 120, 215–241. [Google Scholar] [CrossRef]
- Lee, C.; Yang, W.; Parr, R.G. Development of the Colle-Salvetti correlation-energy formula into a functional of the electron density. Phys. Rev. B 1988, 37, 785–789. [Google Scholar] [CrossRef]
- Bader, R.F.W. Atoms in Molecules. A Quantum Theory; Clarendon Press: Oxford, UK, 1990. [Google Scholar]
- Popelier, P.L.A.; Aicken, F.M.; O’Brien, S.E. Atoms in Molecules. In Chemical Modelling: Applications and Theory, Vol. 1; Hinchliffe, A., Ed.; Royal Society of Chemistry: Cambridge, UK, 2000; pp. 143–198. ISBN 0-85404-254-7. [Google Scholar]
- Biegler-König, F.; Schönbohm, J.; Bayles, D. Software News and Updates. AIM2000—A Program to Analyse and Visualize Atoms in Molecules. J. Comput. Chem. 2001, 22, 545–559. [Google Scholar] [CrossRef]
- Zarzeczańska, D.; Adamczyk-Woźniak, A.; Kulpa, A.; Ossowski, T.; Sporzyński, A. Fluorinated Boronic Acids: Acidity and Hydrolytic Stability of Fluorinated Phenylboronic Acids. Eur. J. Inorg. Chem. 2017, 2017, 4493–4498. [Google Scholar] [CrossRef]
- Adamczyk-Woźniak, A.; Kaczorowska, E.; Kredátusova, J.; Madura, I.; Marek, P.H.; Matuszewska, A.; Sporzyński, A.; Uchman, M. Dehydration of ortho-, meta- and para-Alkoxy Phenylboronic Acids to their Corresponding Boroxines. Eur. J. Inorg. Chem. 2018, 2018, 1492–1498. [Google Scholar] [CrossRef]
- Durka, K.; Jarzembska, K.N.; Kamiński, R.; Luliński, S.; Serwatowski, J.; Woźniak, K. Structural and energetic landscape of fluorinated 1,4-phenylenediboronic acids. Cryst. Growth Des. 2012, 12, 3720–3734. [Google Scholar] [CrossRef]
- Filthaus, M.; Oppel, I.M.; Bettinger, H.F. Supramolecular structures and spontaneous resolution: The case of ortho-substituted phenylboronic acids. Org. Biomol. Chem. 2008, 6, 1201–1207. [Google Scholar] [CrossRef] [PubMed]
- Jaffe, H.H. A Reexamination of the Hammett Equation. Chem. Rev. 1953, 53, 191–261. [Google Scholar] [CrossRef]
- Hansch, C.; Leo, A.; Taft, R.W. A survey of Hammett substituent constants and resonance and field parameters. Chem. Rev. 1991, 91, 165–195. [Google Scholar] [CrossRef]


| Method | Potentiometric | Spectrophotometric |
|---|---|---|
| pKa1 | 8.26 ± 0.07 | 8.31 ± 0.01 |
| pKa2 | 9.97 ± 0.09 | 10.11 ± 0.01 |
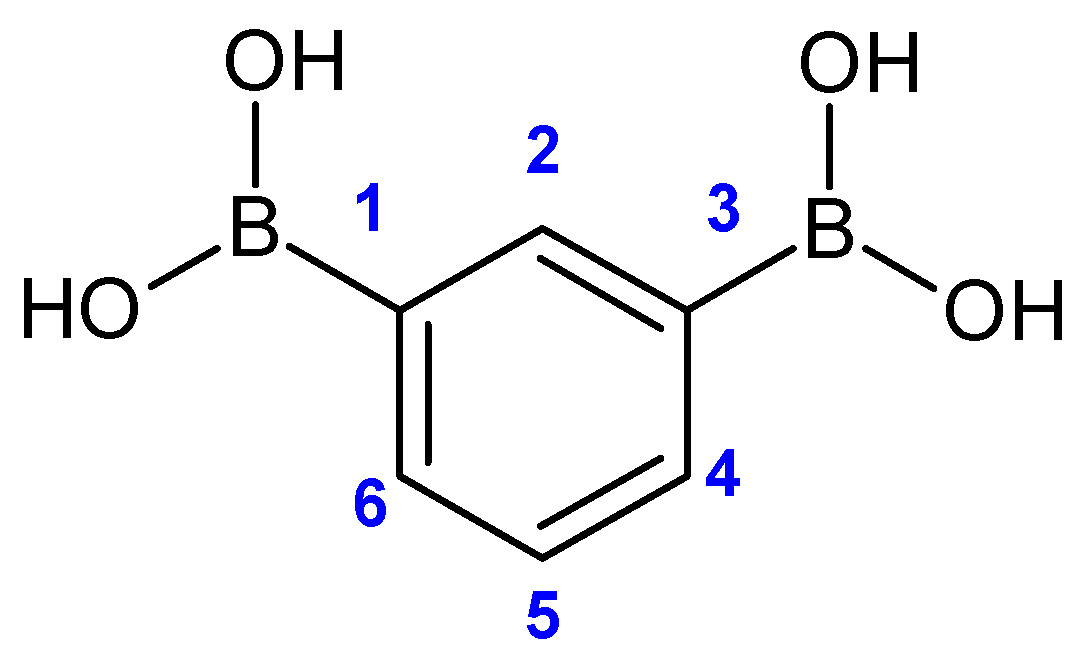
| 1H NMR (500 MHz) | OH | H2 | H4, H6 | H5 |
|---|---|---|---|---|
| 7.94 (broad) | 8.21 (s) | 7.81 (dd) 1J = 7.39 Hz 4J = 1.35 Hz | 7.29 (t) 1J = 7.39 Hz | |
| 13C NMR (75 MHz) | C1, C3 | C2 | C4, C6 | C5 |
| 132.8 (broad) | 140.3 | 135.8 | 126.4 | |
| 11B NMR (96 MHz) | 30 | |||
| Donor–H | d (D-H) | d (H...A) | <DHA | d(D...A) | Acceptor, Symmetry Code |
|---|---|---|---|---|---|
| O21-H21 | 0.81(2) | 1.96(3) | 177(2) | 2.764(2) | O22 [−x+0.5, −y+1.5, −z] |
| O22-H22 | 0.84(2) | 2.03(3) | 149(2) | 2.788(2) | O21 [x+0.5, y−0.5, z] |
© 2019 by the authors. Licensee MDPI, Basel, Switzerland. This article is an open access article distributed under the terms and conditions of the Creative Commons Attribution (CC BY) license (http://creativecommons.org/licenses/by/4.0/).
Share and Cite
Adamczyk-Woźniak, A.; Cyrański, M.K.; Durka, K.; Gozdalik, J.T.; Klimentowska, P.; Rusiecki, R.; Sporzyński, A.; Zarzeczańska, D. Structure and Properties of 1,3-Phenylenediboronic Acid: Combined Experimental and Theoretical Investigations. Crystals 2019, 9, 109. https://doi.org/10.3390/cryst9020109
Adamczyk-Woźniak A, Cyrański MK, Durka K, Gozdalik JT, Klimentowska P, Rusiecki R, Sporzyński A, Zarzeczańska D. Structure and Properties of 1,3-Phenylenediboronic Acid: Combined Experimental and Theoretical Investigations. Crystals. 2019; 9(2):109. https://doi.org/10.3390/cryst9020109
Chicago/Turabian StyleAdamczyk-Woźniak, Agnieszka, Michał K. Cyrański, Krzysztof Durka, Jan T. Gozdalik, Paulina Klimentowska, Rafał Rusiecki, Andrzej Sporzyński, and Dorota Zarzeczańska. 2019. "Structure and Properties of 1,3-Phenylenediboronic Acid: Combined Experimental and Theoretical Investigations" Crystals 9, no. 2: 109. https://doi.org/10.3390/cryst9020109
APA StyleAdamczyk-Woźniak, A., Cyrański, M. K., Durka, K., Gozdalik, J. T., Klimentowska, P., Rusiecki, R., Sporzyński, A., & Zarzeczańska, D. (2019). Structure and Properties of 1,3-Phenylenediboronic Acid: Combined Experimental and Theoretical Investigations. Crystals, 9(2), 109. https://doi.org/10.3390/cryst9020109