Article

Cohesive Element Model for Fracture Behavior Analysis of Al2O3/Graphene Composite Ceramic Tool Material

1
School of Mechanical and Automotive Engineering, Qilu University of Technology (Shandong Academy of Sciences), Jinan 250353, China
2
Key Laboratory of Advanced Manufacturing and Measurement and Control Technology for Light Industry in Universities of Shandong, Qilu University of Technology (Shandong Academy of Sciences), Jinan 250353, China
*
Author to whom correspondence should be addressed.
Crystals 2019, 9(12), 669; https://doi.org/10.3390/cryst9120669
Submission received: 18 November 2019 / Revised: 7 December 2019 / Accepted: 9 December 2019 / Published: 11 December 2019

Abstract

:
The microstructure model of Al2O3/graphene (AG) composite ceramic tool material is established based on Voronoi tessellation. The cohesive element method was used to simulate the crack growth of AG. The effect of cohesive parameters at the grain boundary of Al2O3 and graphene on the crack propagation was investigated. The results show that the grain strength of graphene is too high, the crack propagation to graphene grains will be hindered and cannot propagate forward. Cracks tend to spread along the paths where the crack propagation drive force was high and the resistance was low. When the interface strength between Al2O3 and graphene was at the weak interface, the crack propagation path and length were relatively straight and short. The average energy release rate G C is 1.042 × 10⁻³ J/m2, which is 2.4% higher than that of single-phase Al2O3 ceramic tool materials. However, if the interface strength between Al2O3 and graphene was at the strong interface, the crack propagated along graphene particles for a short distance, consuming a large amount of fracture energy. Furthermore, the crack will deflect around graphene grains, which increases the crack propagation length. The average energy release rate G C is 1.039 × 10⁻³ J/m2, which is 2% higher than that of single-phase Al2O3 ceramic tool materials.

1. Introduction

Graphene was discovered in 2004 as a new kind of nanocarbon material, and has been extensively used in the fields of energy, microelectronics, information, biomedicine, and other fields due to good electrical conductivity, thermal conductivity, and excellent mechanical properties [1,2]. Various studies have indicated that graphene dramatically improved the mechanical properties of ceramic tool materials. Yin et al. [3] prepared TiB2/TiC composite ceramic tool material toughened by graphene nanosheets using spark plasma sintering. Compared with TiB2/TiC without graphene nanosheets, the fracture toughness was increased by 31.7% when only 0.1 wt% of graphene was added. Cui et al. [4] prepared Al2O3/(W,Ti)C/graphene ceramic tool material using hot pressing sintering and found its fracture toughness with only 0.2 wt% graphene was 35.3% higher than that of the sample without graphene.
The mechanical properties of ceramic tool materials are closely related to the microstructure [5]. The microstructure of ceramic tool materials is complex (composed of crystal grains, grain boundaries, etc.). The fracture mode tends to be affected by the particle diameter and distribution, particle shape, composition phase, and interface properties [6,7,8]. In order to establish the relationship between microstructure and mechanical properties of ceramic tool materials, micro fracture behavior simulation is a more suitable method [9]. Therefore, it needs a method that can not only characterize the microstructure, but also track the destruction process of the microstructure. The cohesive element method based on Voronoi tessellation is a method that can meet the above requirements. Many researchers use Voronoi tessellation to characterize polycrystalline materials. Bolander and Saito [10] used Voronoi tessellation to isotropic homogeneous materials to discretization treatment, and establish a rigid-body-spring network to simulate the brittle fracture of concrete materials. Wang et al. [11] established a microstructure model to study the failure of ceramic materials. The model is based on Voronoi tessellation, in which random functions are used to consider the volume fraction of the second stage, distribution of grain centroid, distribution of grain diameter, and volume distribution of grain boundary. The basic idea of cohesive element model was put forward by Barenblatt [12] with the concept of the stress–displacement curve when studying the cohesion of atomic lattices. Xu [13] and Hillerborg et al. [14] used the cohesive element method to investigate the crack propagation in the brittle solids and in the concrete, respectively. They demonstrated that the cohesive element method can unravel the micro-crack propagation behavior of different kinds of materials. Different cohesive constitutive models (traction–separation laws) can be used to study the fracture behavior of different kinds of materials. In order to explore the relationship between microstructure inhomogeneity and mechanical behavior, the cohesive element method is used to study the cracking behavior of ceramic materials. Zhou et al. [5] established the microstructure model of Al2O3 by the cohesive element method and carried out a series of simulation work on its grain size, grain boundary strength, and micro-crack to the crack propagation. Zhai et al. [9] also studied the dynamic fracture process of Al2O3/TiB2 microstructure by the cohesive element method.
In this paper, Voronoi tessellation representing microstructure can be obtained through open source software Neper. Graphene microstructure was generated by Python script language on the basis of Voronoi tessellation, and a microscopic model for characterizing the microstructure of AG composite ceramic tool is established. The cohesive elements with fracture criterion are embedded into the microstructure as prospective paths for crack propagation. Material properties are assigned to the different cohesive elements. The boundary conditions and loads are applied to the whole model, and then the finite element calculation is carried out in ABAQUS. The effects of different grain boundary bonding strength of the interface of Al2O3 and graphene on the crack growth of AG were investigated.

2. Simulation Method

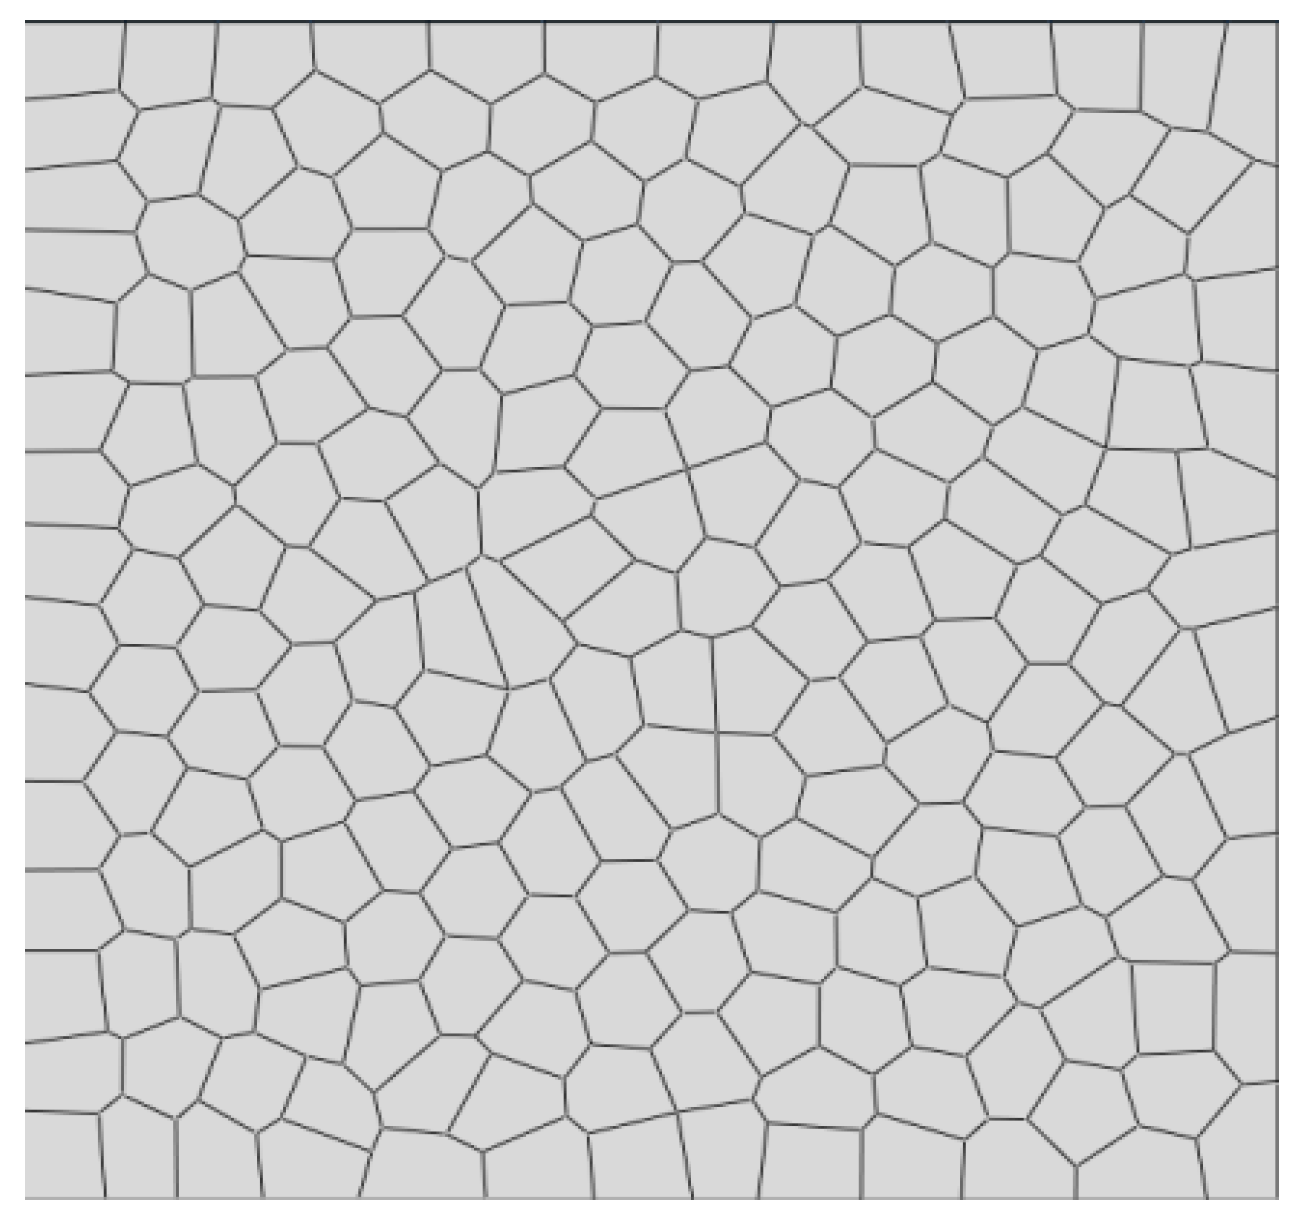
2.1. Voronoi Tessellation

Voronoi tessellation method represents the microstructure of materials by generating a checkerboard layout of Voronoi tessellation. Voronoi tessellation is composed of polygons similar to grain geometry, and these polygons are composed of perpendicular bisector connecting straight lines connecting adjacent points. Ceramic materials are polycrystalline materials. Voronoi tessellation can reflect the inhomogeneity of the microstructure of polycrystalline materials and the influence of neighboring phases on the grain shape. These properties enable Voronoi tessellation to quantitatively describe some characteristic parameters of microstructure, such as the content of each phase and the size and shape of phase components. Many researchers have used Voronoi tessellation to characterize polycrystalline materials. Ghosh et al. [15] used Voronoi tessellation to describe the microstructure of multiphase materials and porous materials and carried out stress–strain analysis. Voronoi tessellation programming is simple and has high computational efficiency. In this paper, Voronoi tessellation is constructed by using Neper program developed by Quey et al. [16]. Figure 1 shows a closed Voronoi tessellation obtained by Neper. A Voronoi tessellation model with 160 grains is shown in Figure 1, with the size of 10 μm × 10 μm and the average grain diameter of 0.8 μm.

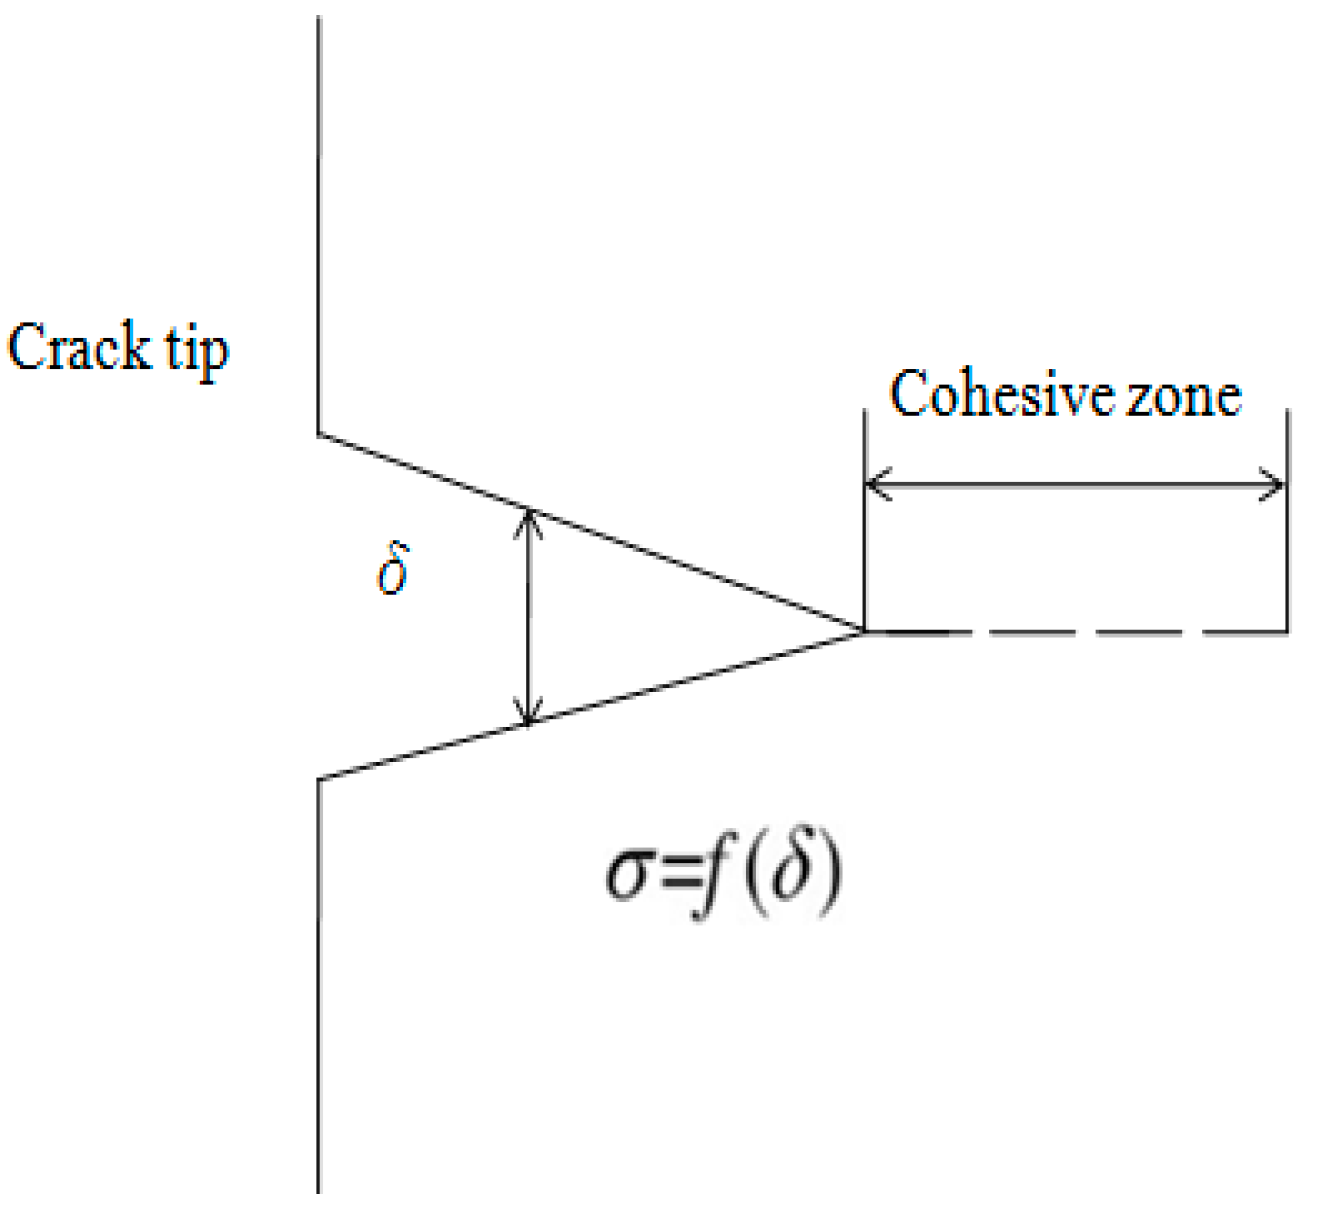
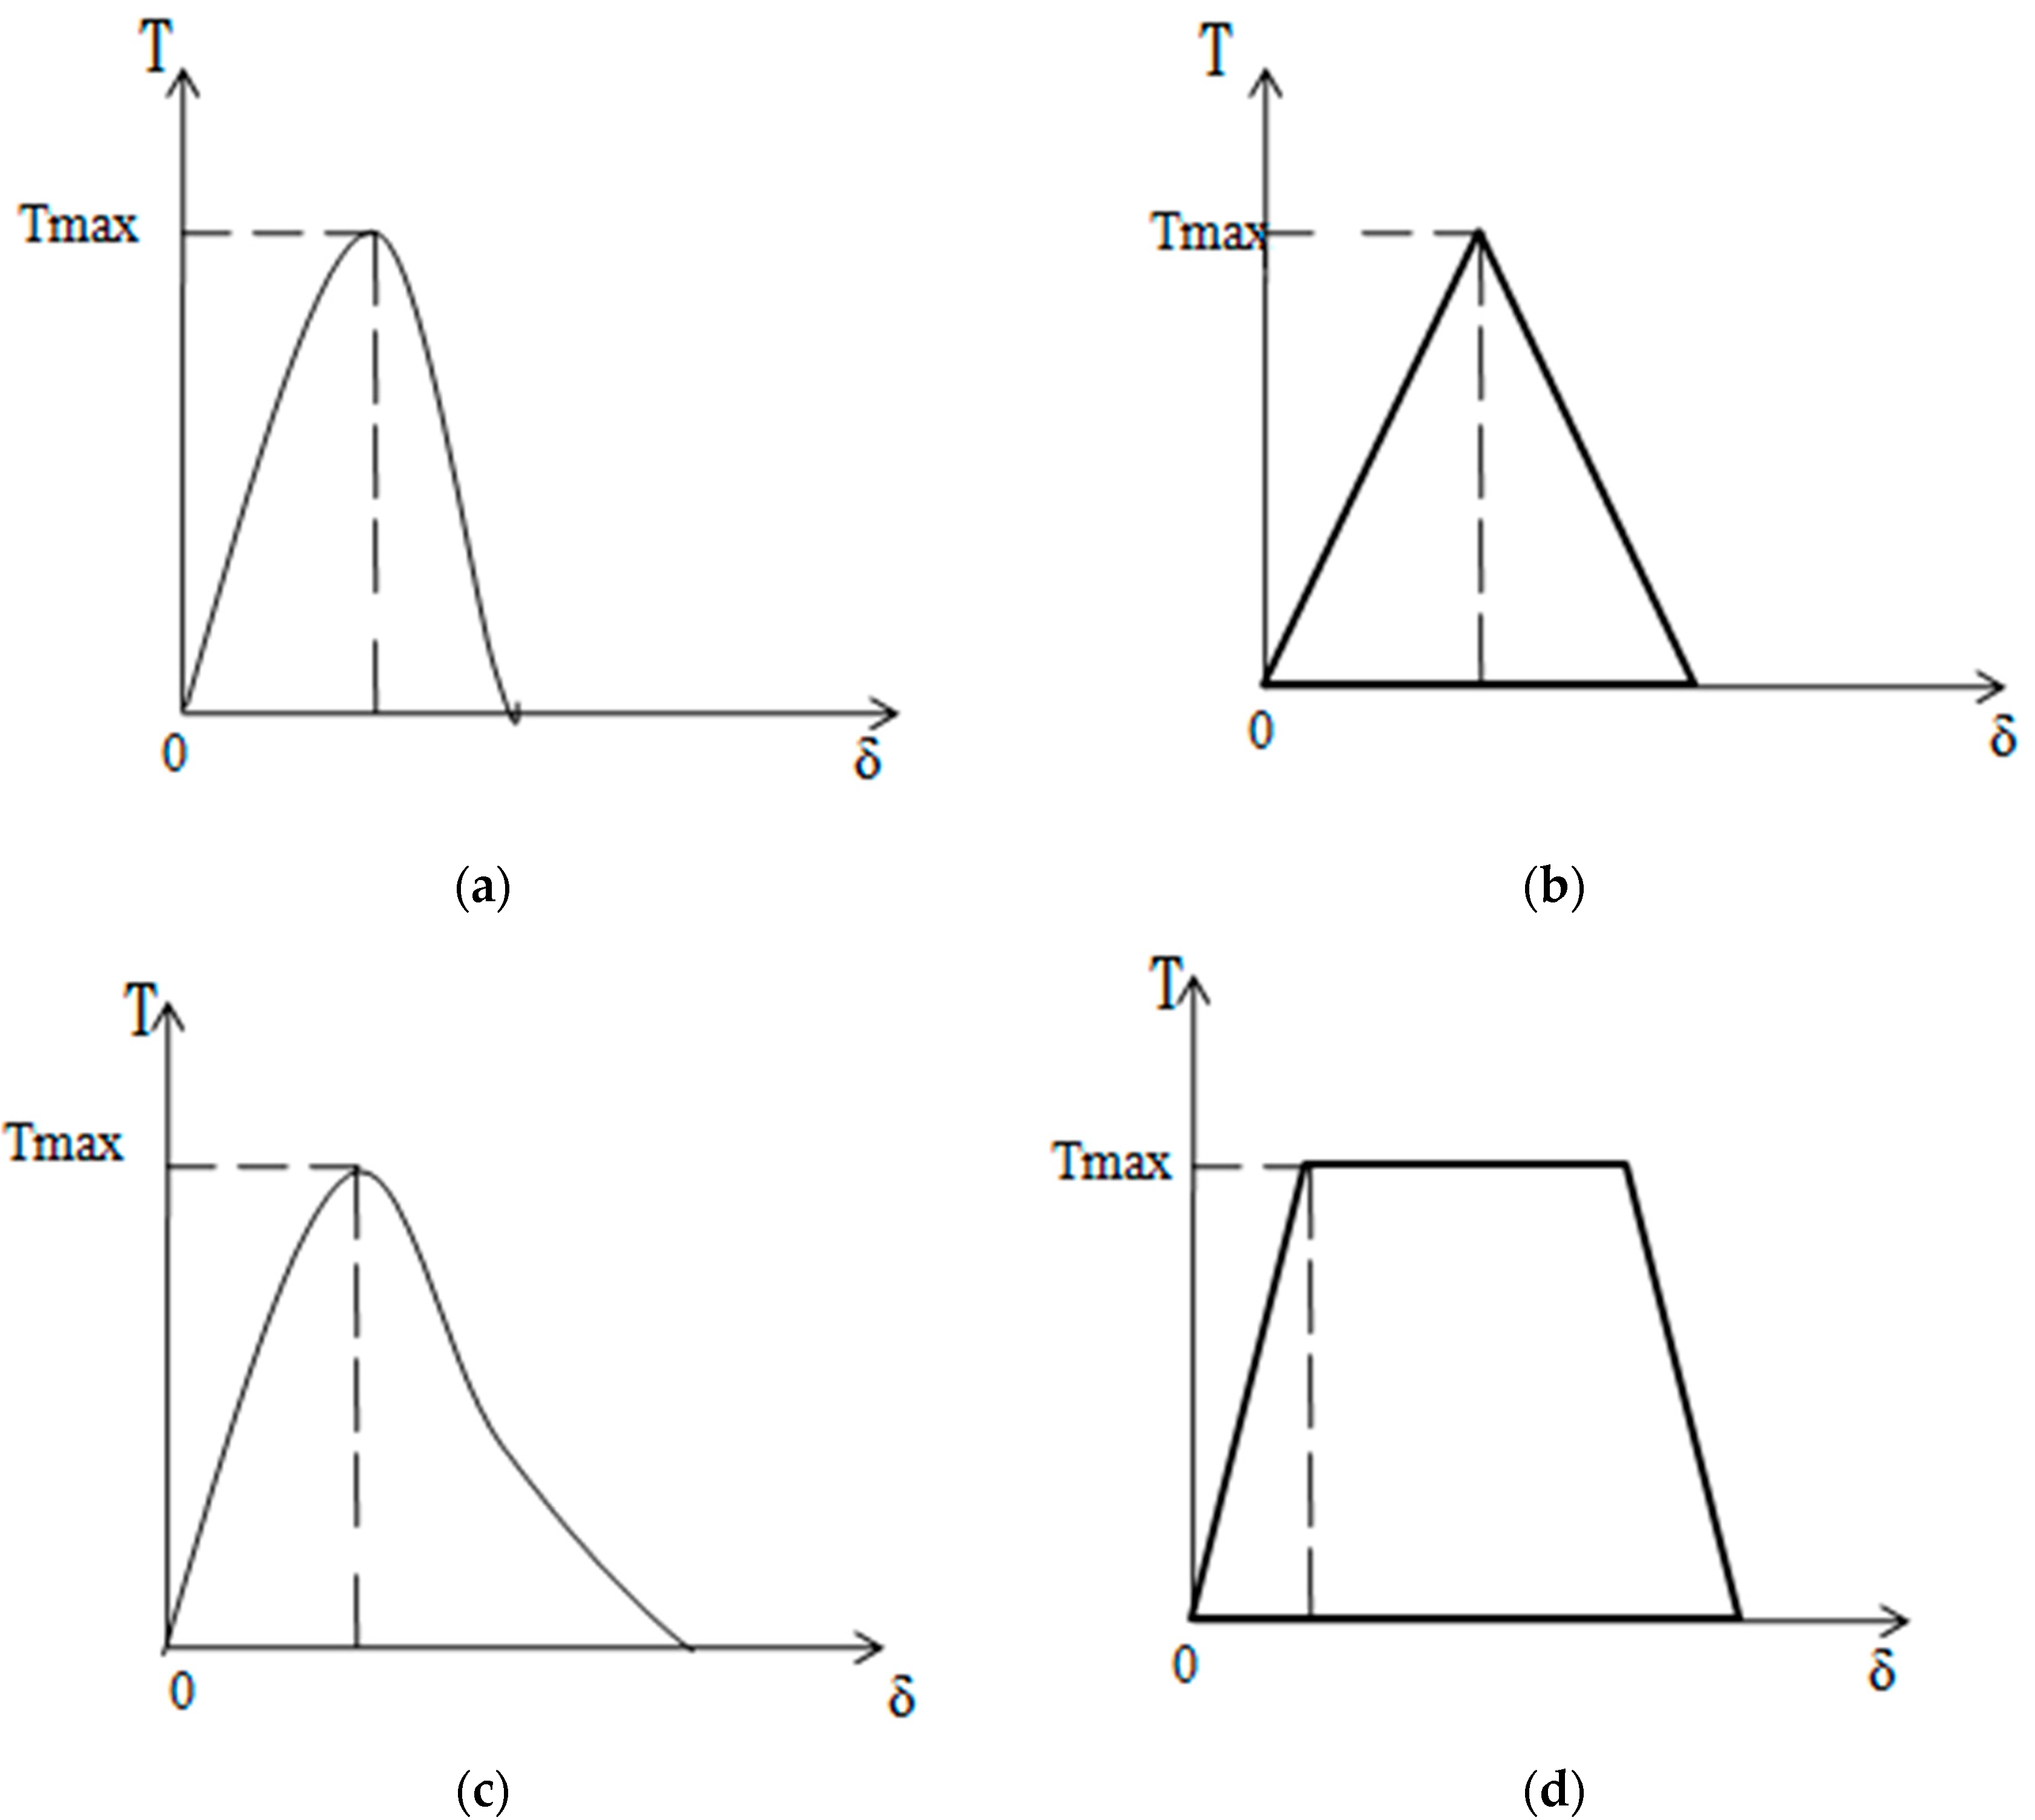
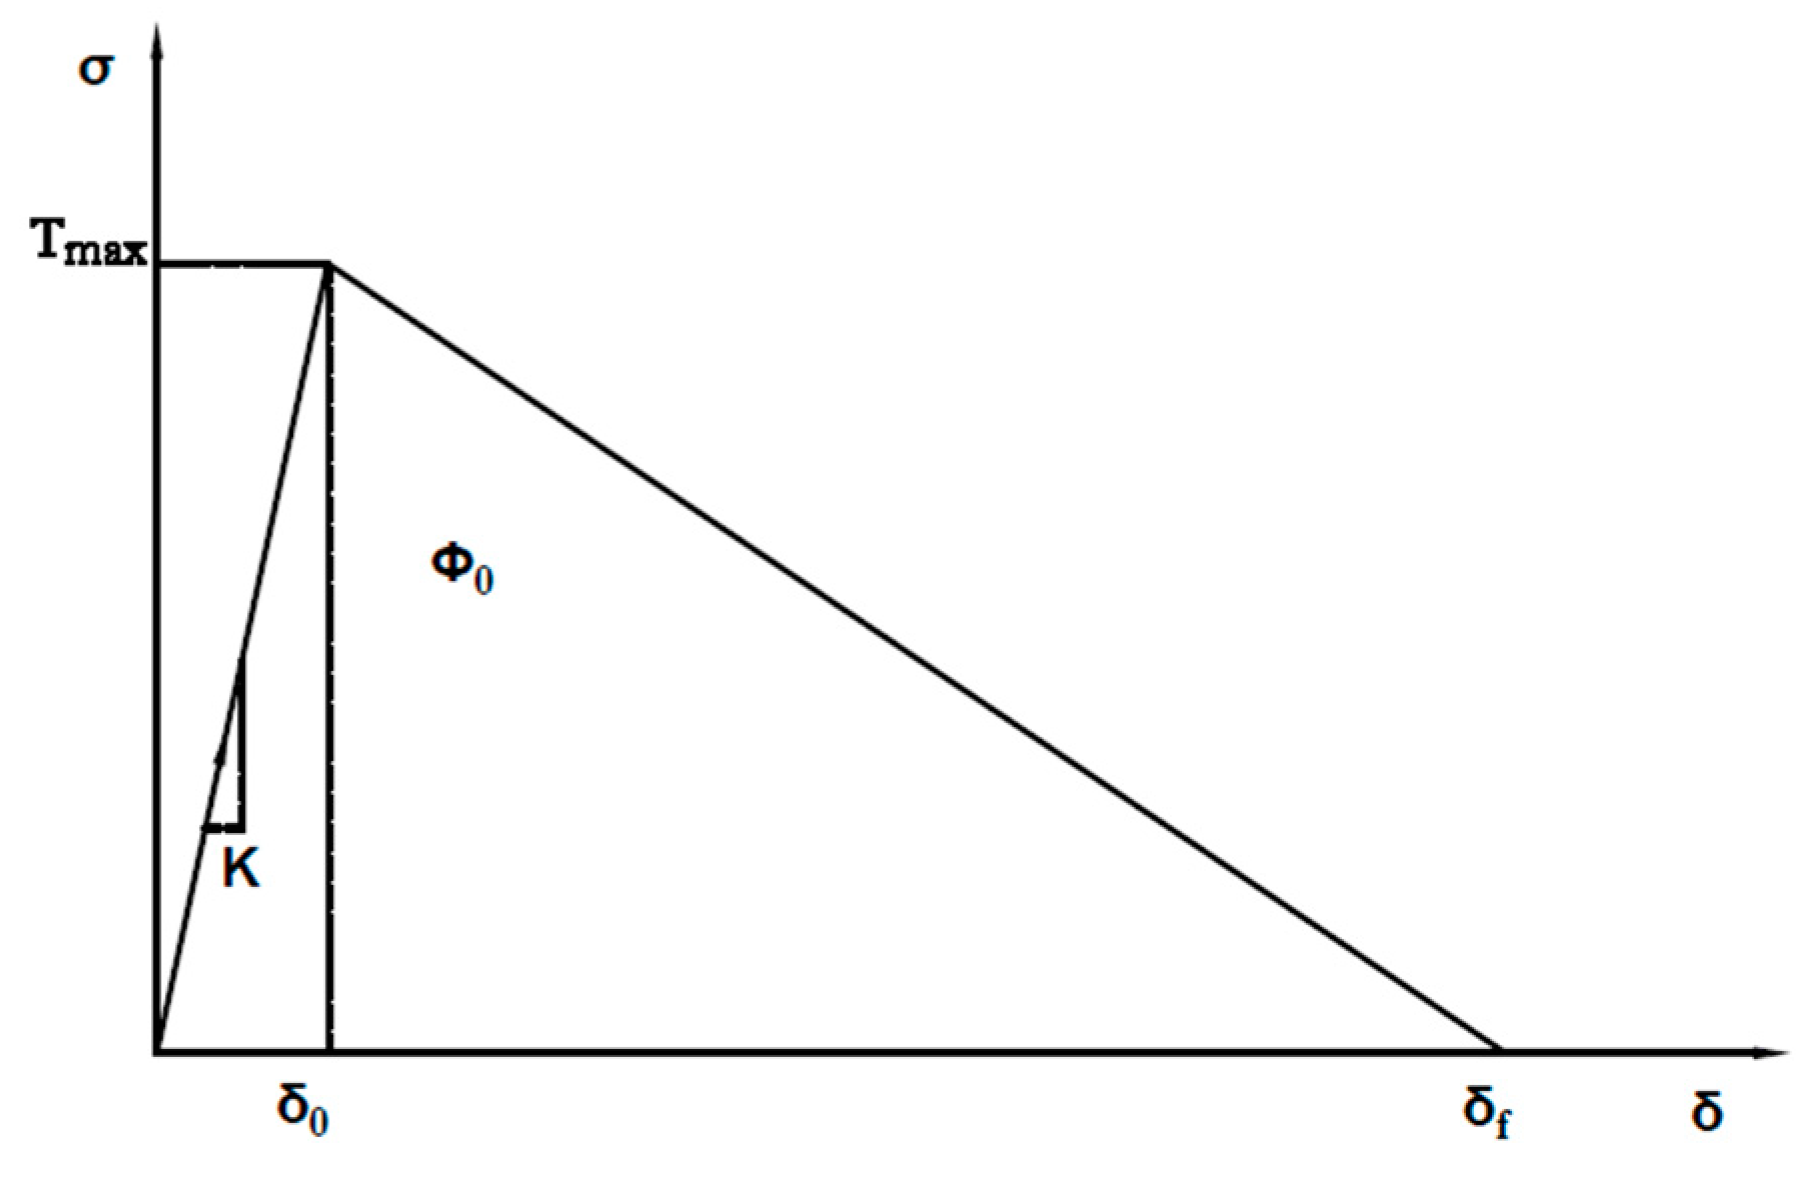
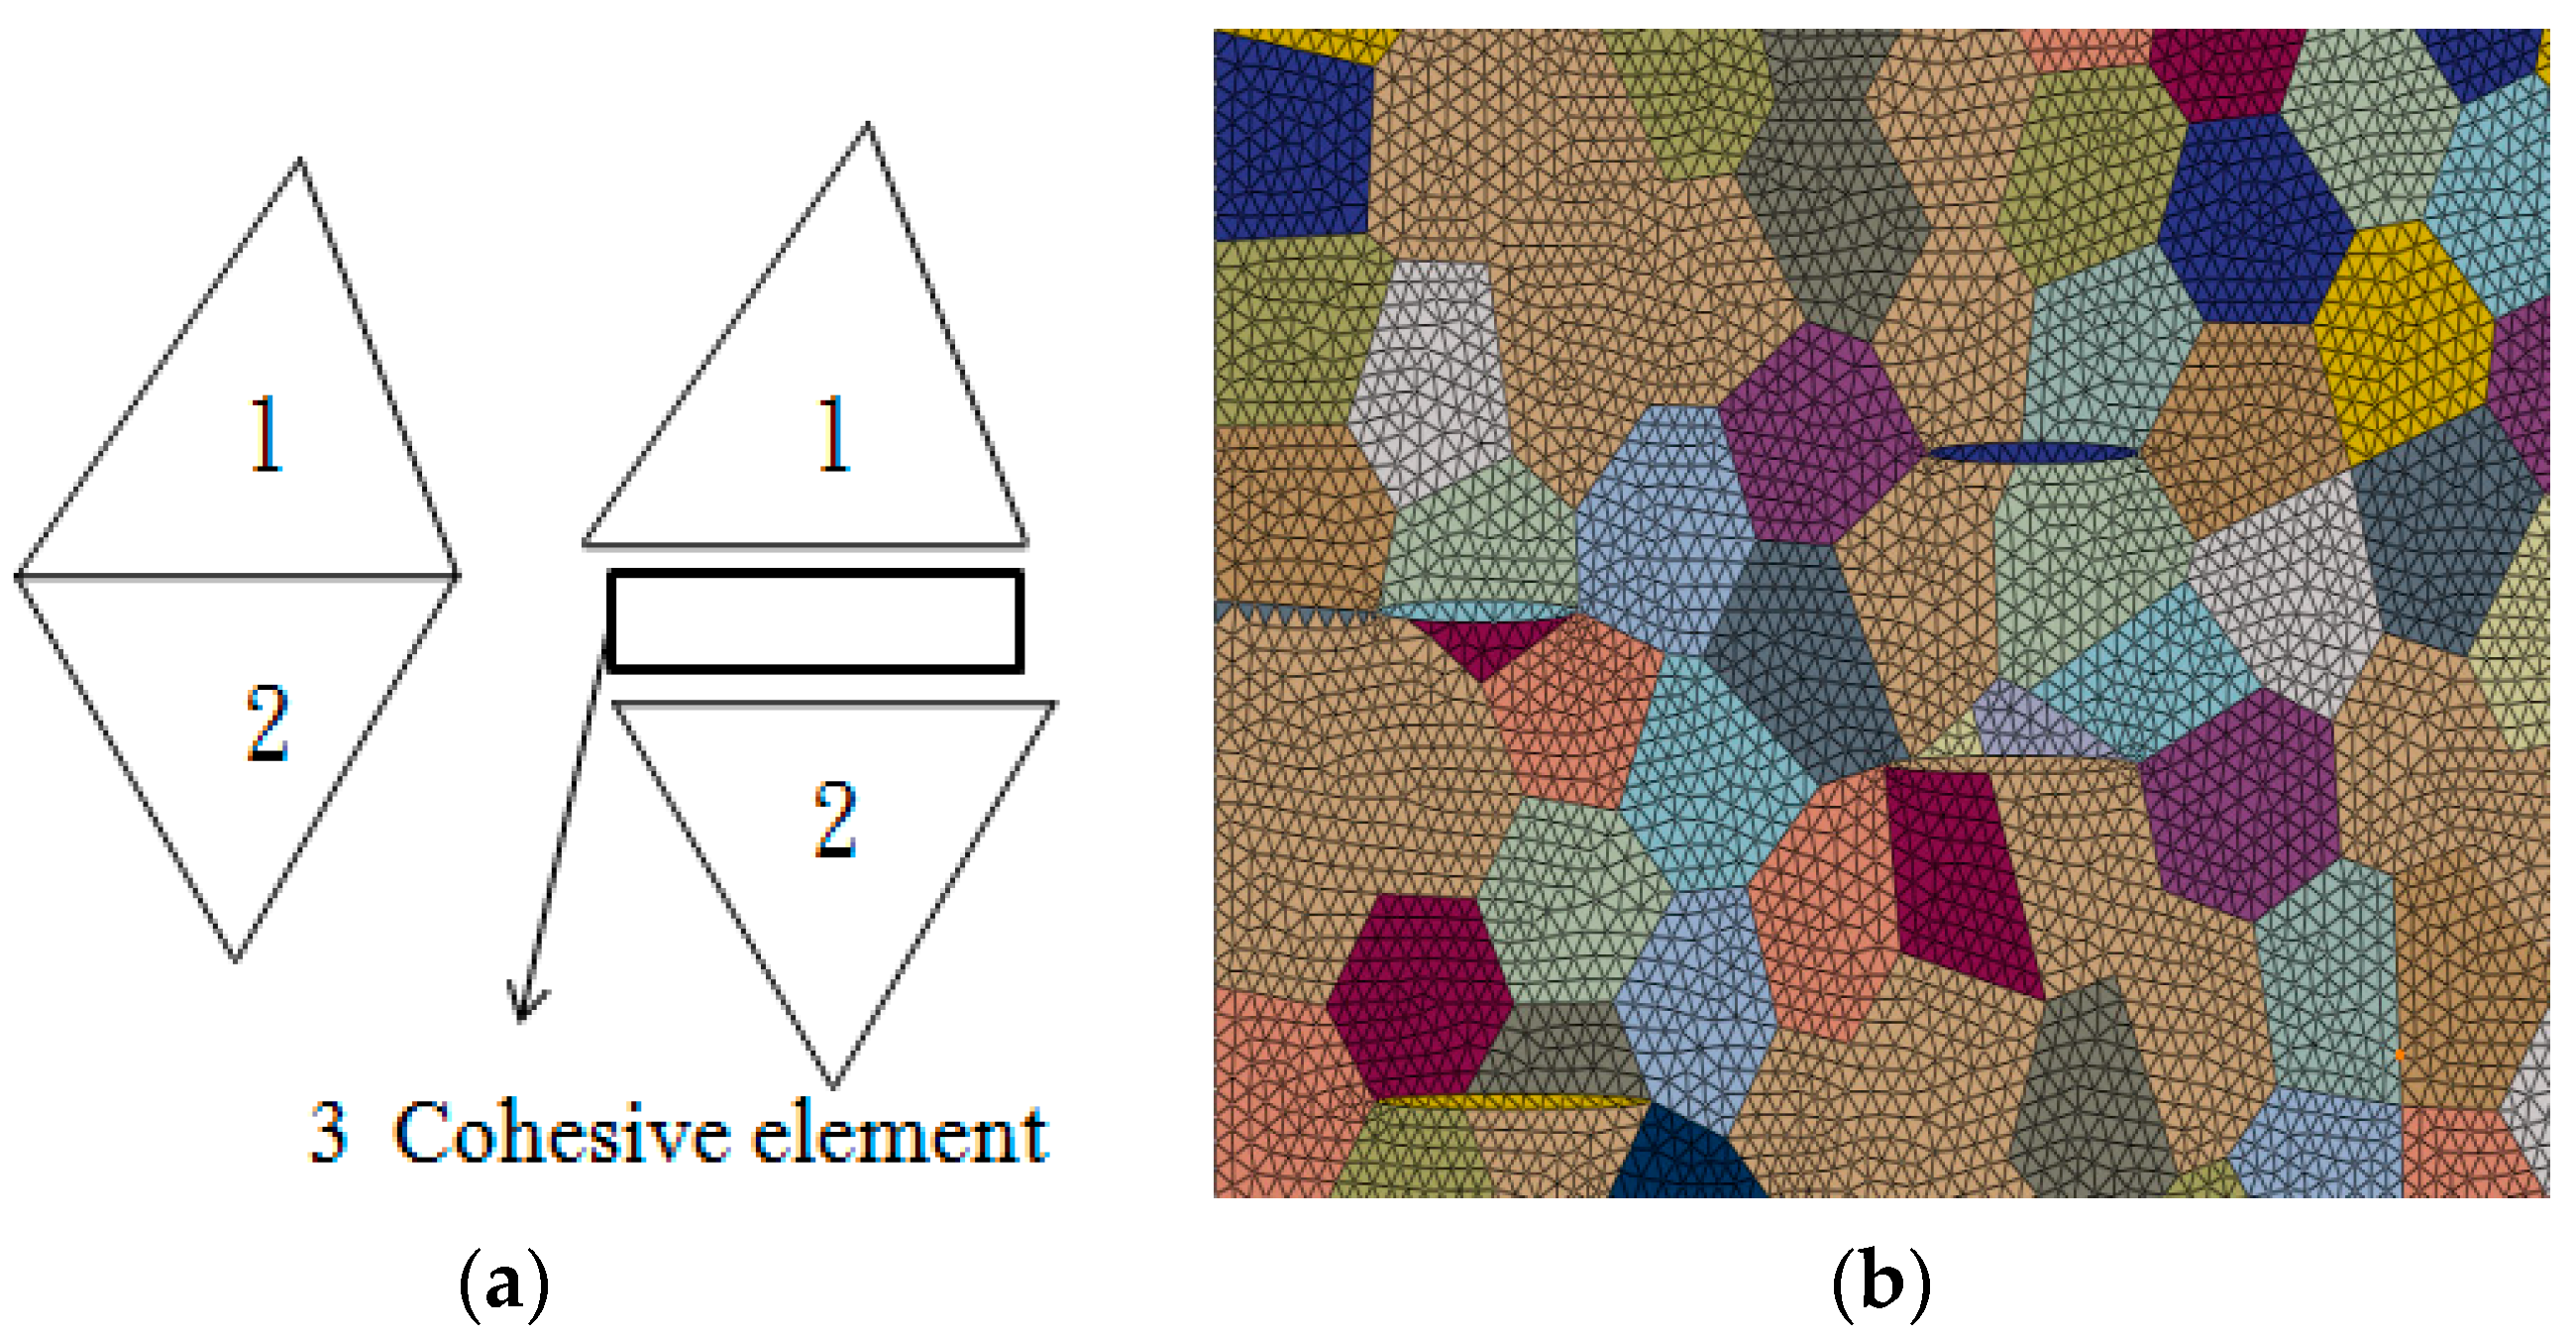
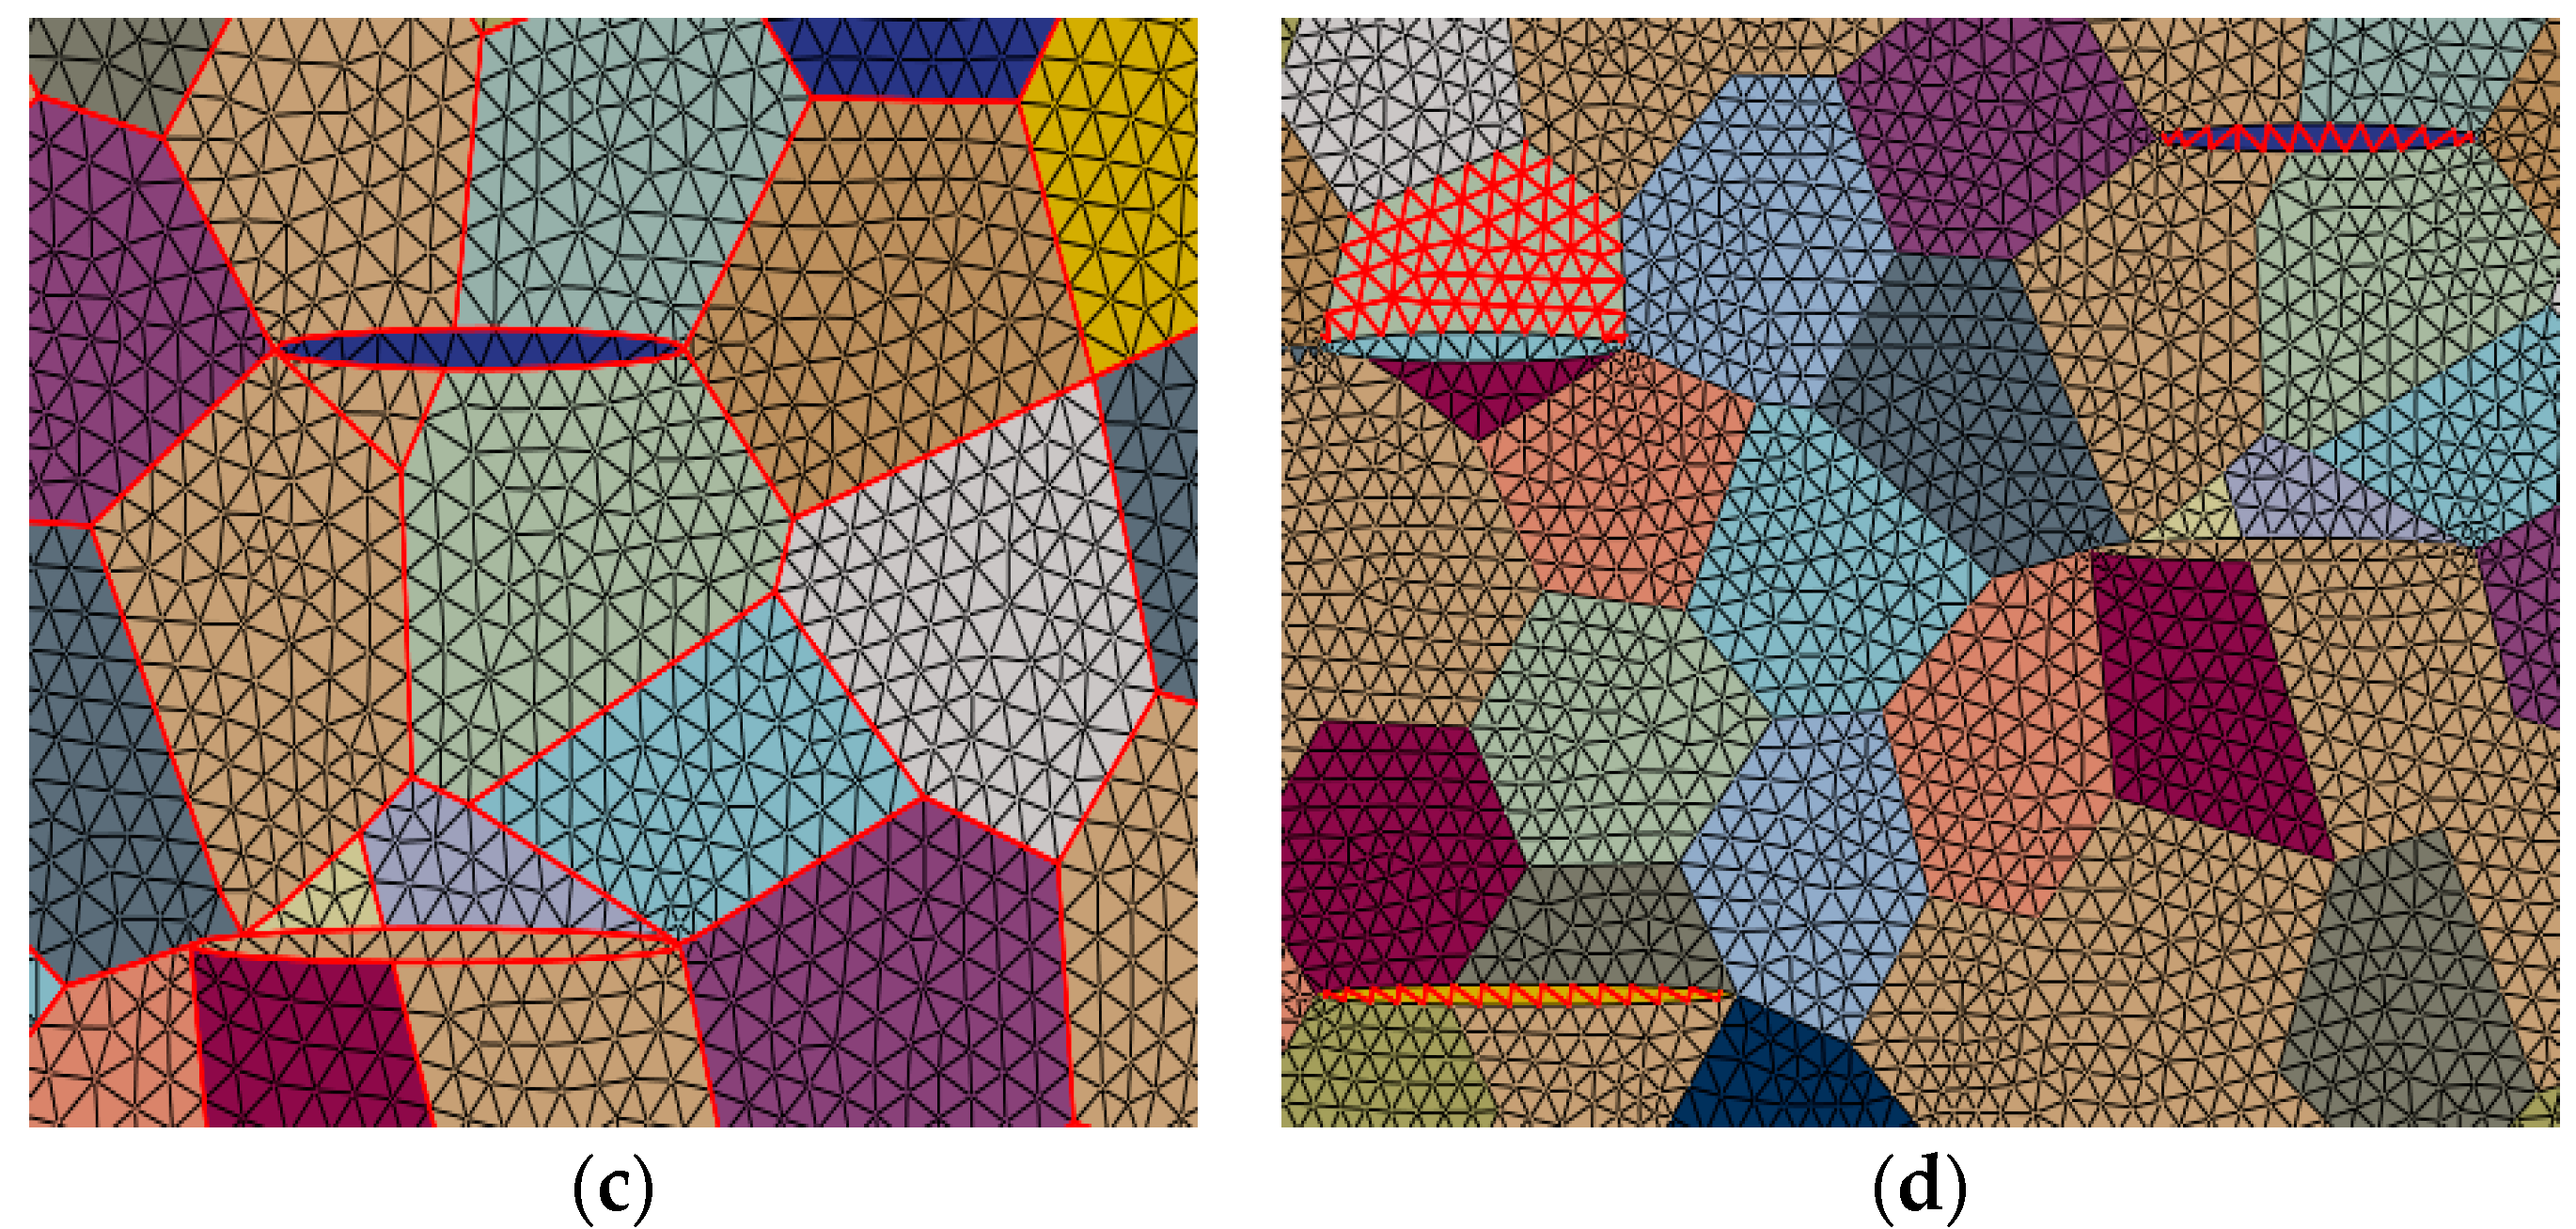
2.2. Cohesive Element Model

According to Figure 2, the cohesive zone represents the front region of the crack tip to be expanded. In actual materials, there will be many tiny cracks at the crack tip. Under the external loading, the stress field near the crack tip tends to increase. The crack tip is continuously connected with microcracks to form a new main crack. Cyclic reciprocating crack propagation continues until the material finally fails. The process can be simplified as the cohesive element model [17].
The evolution process of the crack tip region is denoted by the stress–displacement relationship of the cohesive element, which is utilized to simulate the deformation and final cracking of the crack tip region. Moreover, the traction separation method can designate the association between viscous traction and crack displacement, that is, the traction–separation law. Figure 3 depicts that the prevailing traction–separation laws are exponential, bilinear, polynomial, and trapezoidal types. Tvergaard and Hutchinson [18,19] concluded that the shape of the traction–separation law has a certain influence on the calculation results.
The fracture mode of ceramic tool material is brittle fracture, and there is nearly no plastic deformation before fracture. Therefore, the bilinear traction–separation law (as shown in Figure 4), which is suitable for brittle fracture, was selected to describe the behaviors of cohesive elements.
In Figure 4, T max is the maximum cohesive stress, that is, the maximum stress value at which cohesive element begins to damage. δ represents the open displacement of the element, δ 0 is the critical open displacement when the element starts to form damage, δ f is the final open displacement when the element is absolutely failed, and K is the stiffness of the cohesive element at the first moment (initial stiffness). ϕ 0 is the critical fracture energy, which is the area of the triangle in Figure 4 [12].
The schematic of bilinear traction–separation law is shown in Figure 4. Under the action of external stress, the stress value of the cohesive zone at the crack tip increases linearly with the increase of the initial displacement value. When the interfacial stress reaches T max , the cohesive interface begins to fracture. When T max decays from the maximum to zero, the interface is destroyed (completely fractured) [5]. In ABAQUS, the cohesive constitutive model is regulated by controlling the three parameters of the maximum principal stress, fracture energy, and interface stiffness. Their relationship is shown as below:
φ 0 = T max δ f 2
K = T max δ 0
The interface stiffness K is a penalty parameter. If the value of K is very small, the cohesive element will be stretched constantly with the continuous pulling without the fracture. Because the interface is too soft, damage evolution has not begun. Therefore, the value of K should be large enough to certify that the embedding element does not significantly decrease the inherent stiffness of the model. However, if the value of K is too large, the incremental step of the explicit solution will be too small, which will impact the efficiency of the solution. The appropriate value of K can be selected by setting the value of δ r a t i o ( δ r a t i o = δ f / δ 0 ) [20].
Since it is difficult to determine the cohesive parameters of the interface between Al2O3 and graphene, four different cohesive parameters are assigned to the cohesive parameters at the interface between Al2O3 and graphene, and the interfacial bonding strength will be studied for AG ceramic tool material. The cohesive parameters of the phase interface can be divided into the following four Cases:
Case 1: The 0.2 times of the cohesive parameters at Al2O3 grain boundaries are selected as the bonding parameter of the phase interface.
Case 2: The cohesive parameters at Al2O3 grain boundaries are selected as the cohesive parameters of the phase interface.
Case 3: The cohesive parameters inside Al2O3 grain are selected as the cohesive parameters of the phase interface.
Case 4: The cohesive parameters inside graphene are selected as the parameters of the phase interface.
The relationship of the corresponding phase interface binding strengths is Case l < Case 2 < Case 3 < Case 4. The constitutive parameters of all cohesive elements are shown in Table 1 [5,21,22].

3. Microstructure Model and Simulation Procedure

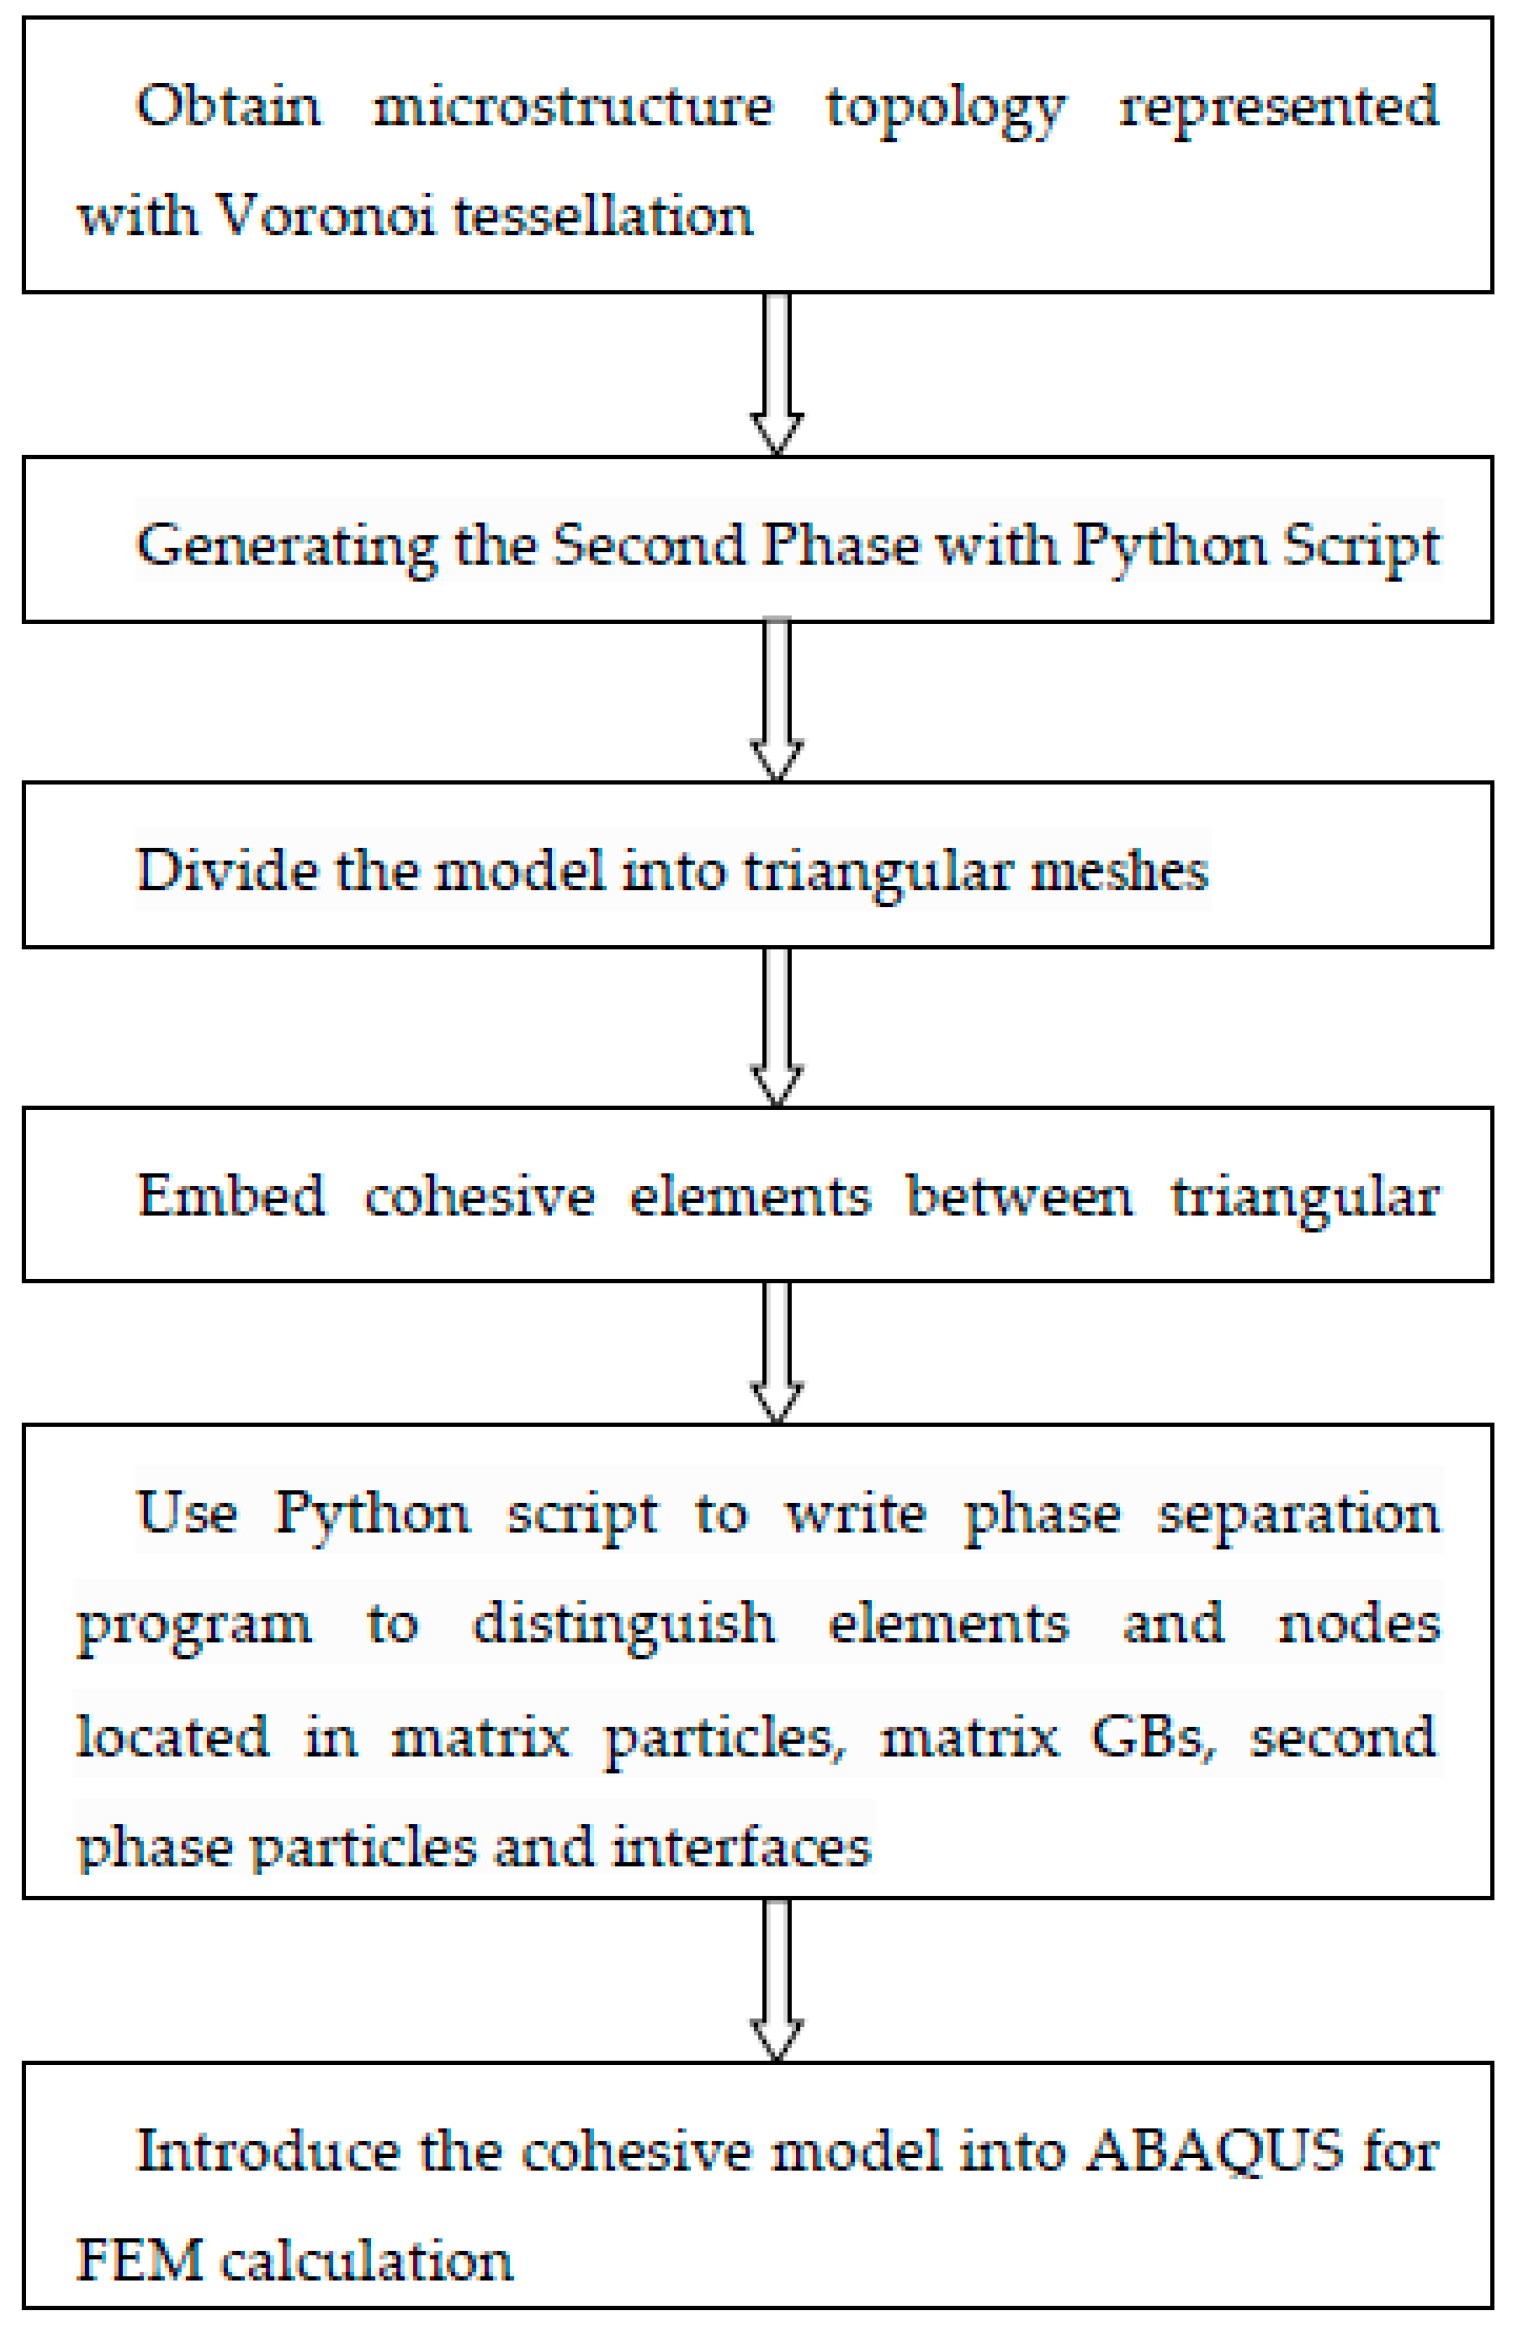
3.1. Simulation Process

Voronoi tessellation was used to characterize the microstructure of single-phase Al2O3 ceramic tool materials. Voronoi tessellation was generated by the open source software Neper. Through Python programming, the graphene second phase was added to the micro model of single-phase Al2O3 ceramic tool material to establish the microstructure model of AG composite ceramic tool. The model was divided into meshes, and cohesive elements were embedded. Subsequently, the finite element calculation is carried out. The process of building a microstructure model is described in Figure 5.
As shown in Figure 6a, the cohesive elements are embedded between adjacent triangular body elements as potential propagation paths of cracks. It can simulate crack propagation in any path and is suitable for solving strong nonlinear problems such as multiple cracks and crack bifurcation. Since the location where cohesive elements are embedded may be at grain boundaries or in grains, four different types of combinations are provided. The combinations of cohesive elements at grain boundaries and grains are shown in Figure 6c,d, respectively.

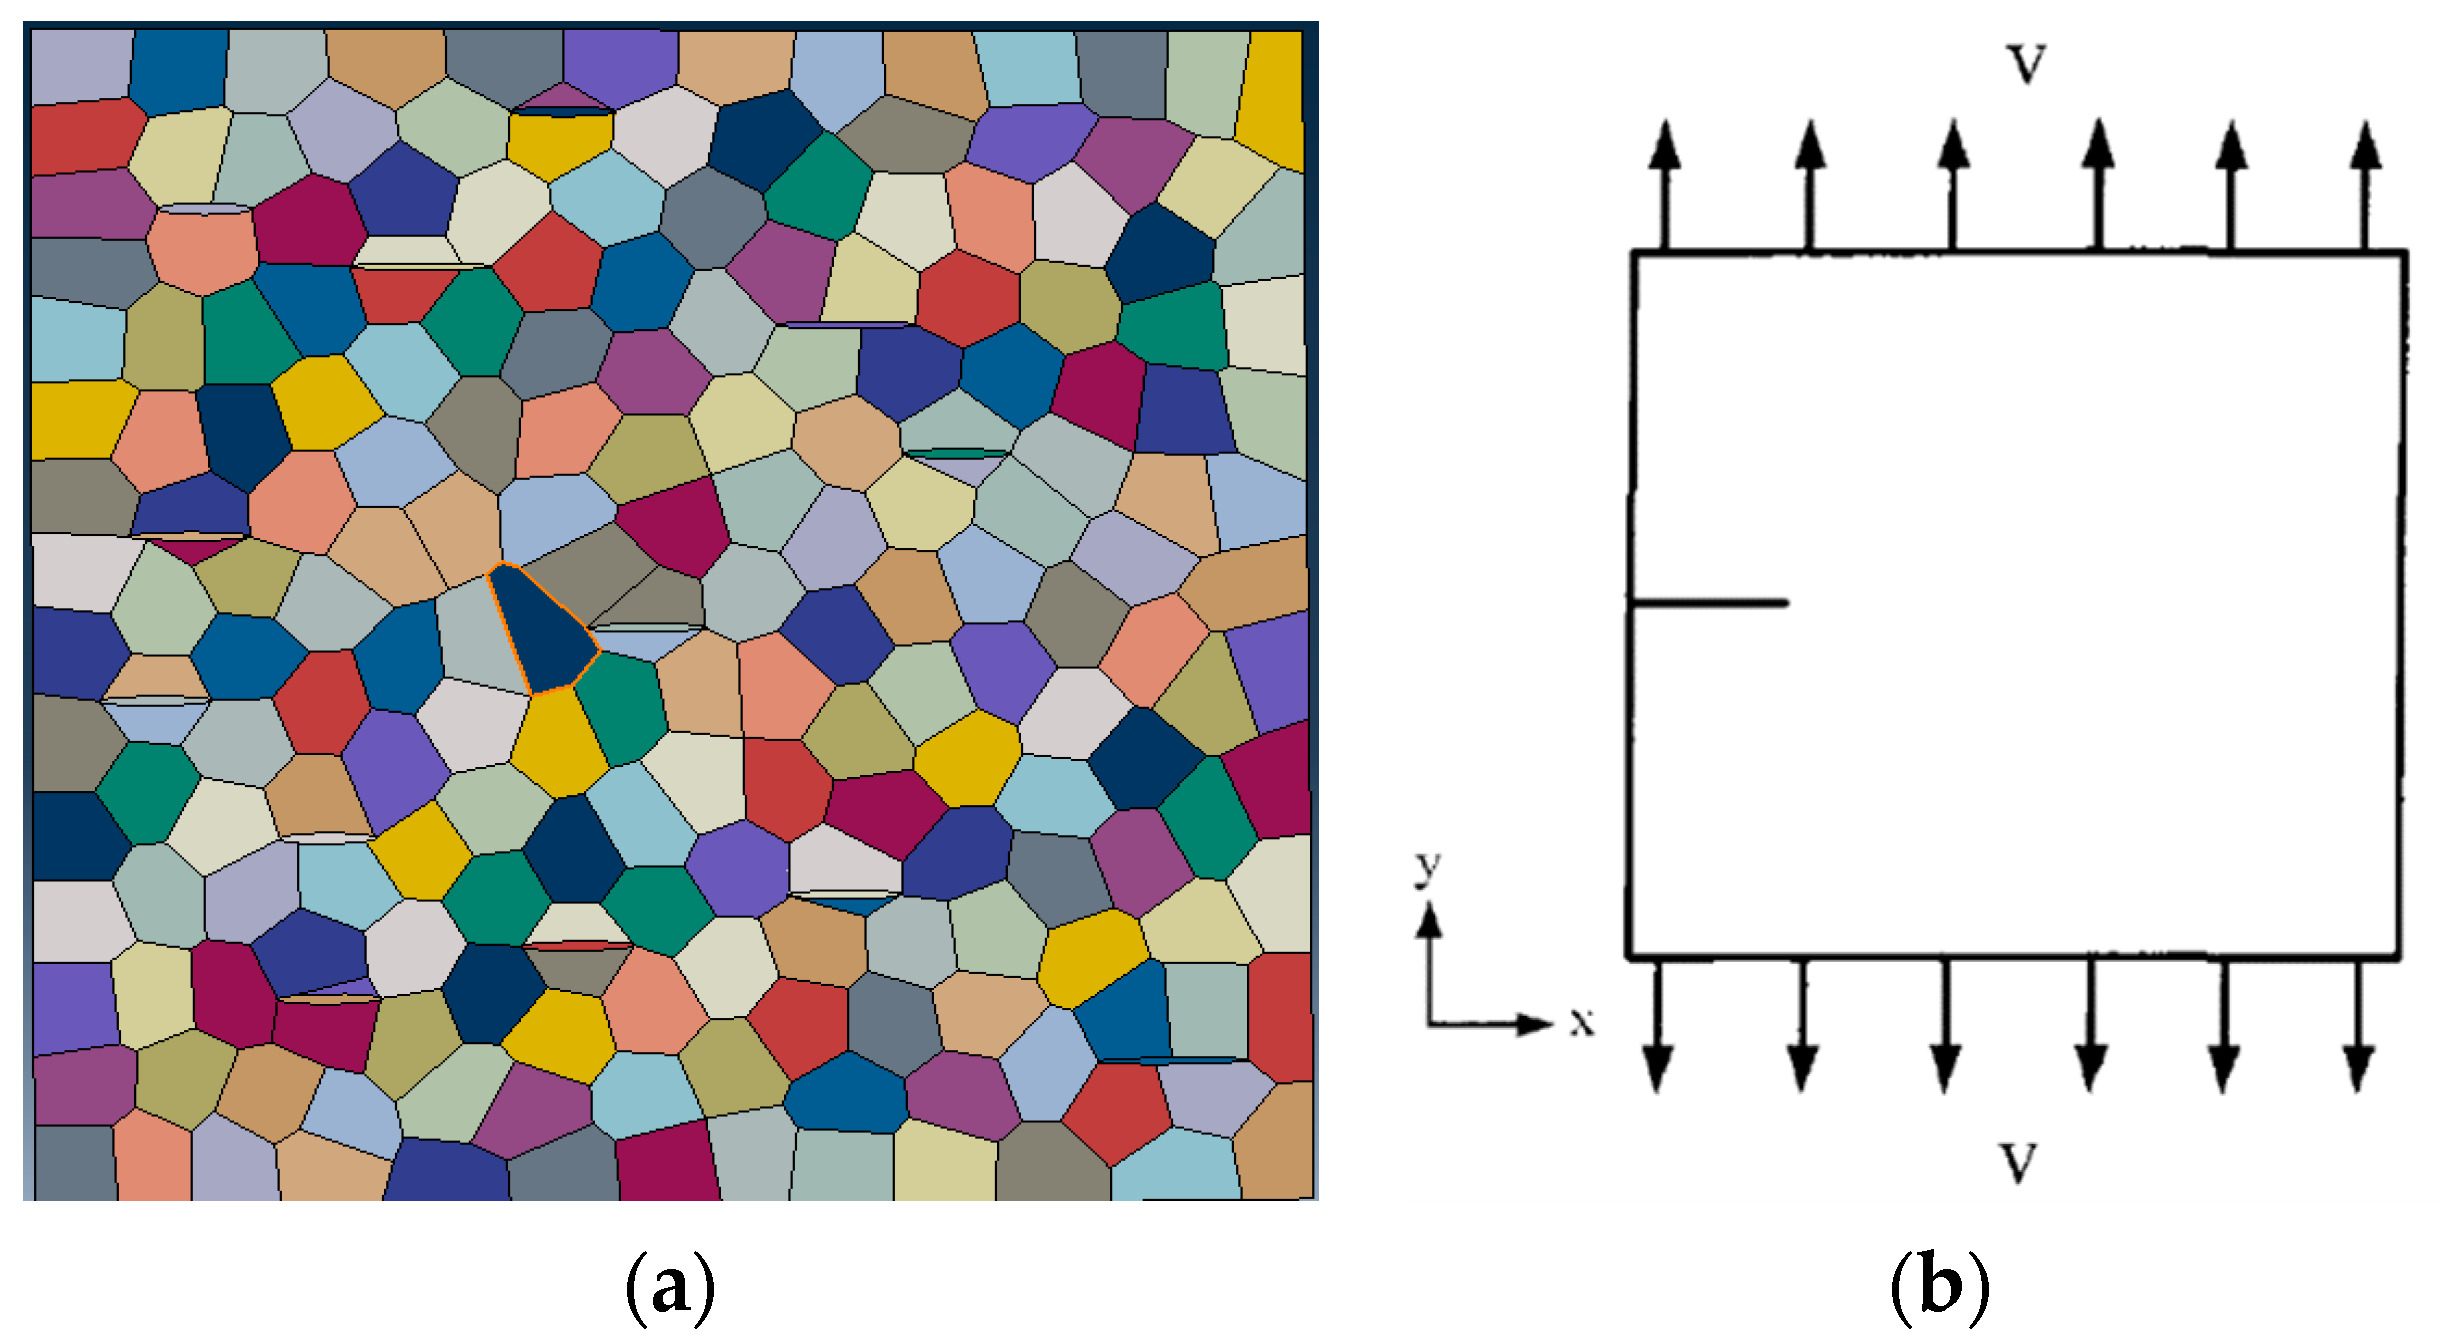
3.2. Boundary Conditions of FEM Calculation

The microconnection structure of AG is shown in Figure 7a with a model size of 10 μm × 10 μm. The average particle diameter of the matrix phase is 0.8 μm. The second phase length is 0.8–1.2 μm. An initial crack is prefabricated in the middle of the left side of the model, as shown in Figure 7b, in order to analyze the influence of the interfacial bonding strength of the microstructure on the crack propagation path. It has been substantiated that if the ratio of the length of the initial crack to the total length of the model is less than 10%, the calculated result is less than 5% compared with the result without the initial crack [5].
Crack propagation is an intensely nonlinear problem. In this study, the numerical simulation is conducted by using the display integration method, where a velocity load is applied. Generally, it is believed that the velocity load of the finite element model of crack propagation will have some effect on the simulation results. The relationship between the velocity load and the model can be expressed by the strain rate ε ( ε = V / H ) [5]. For the double-sided load, H is half of the height of the model. This study adopts the loading method of the uniform acceleration before the uniform speed. The loading speed V is 0.005 m/s, and the corresponding strain rate is 1 × 10³ S−1, which belongs to the dynamic load range [23,24]. The smaller is the velocity load, the longer the model is completely fractured. The total simulation time is 5 μs.

4. Results and Discussion
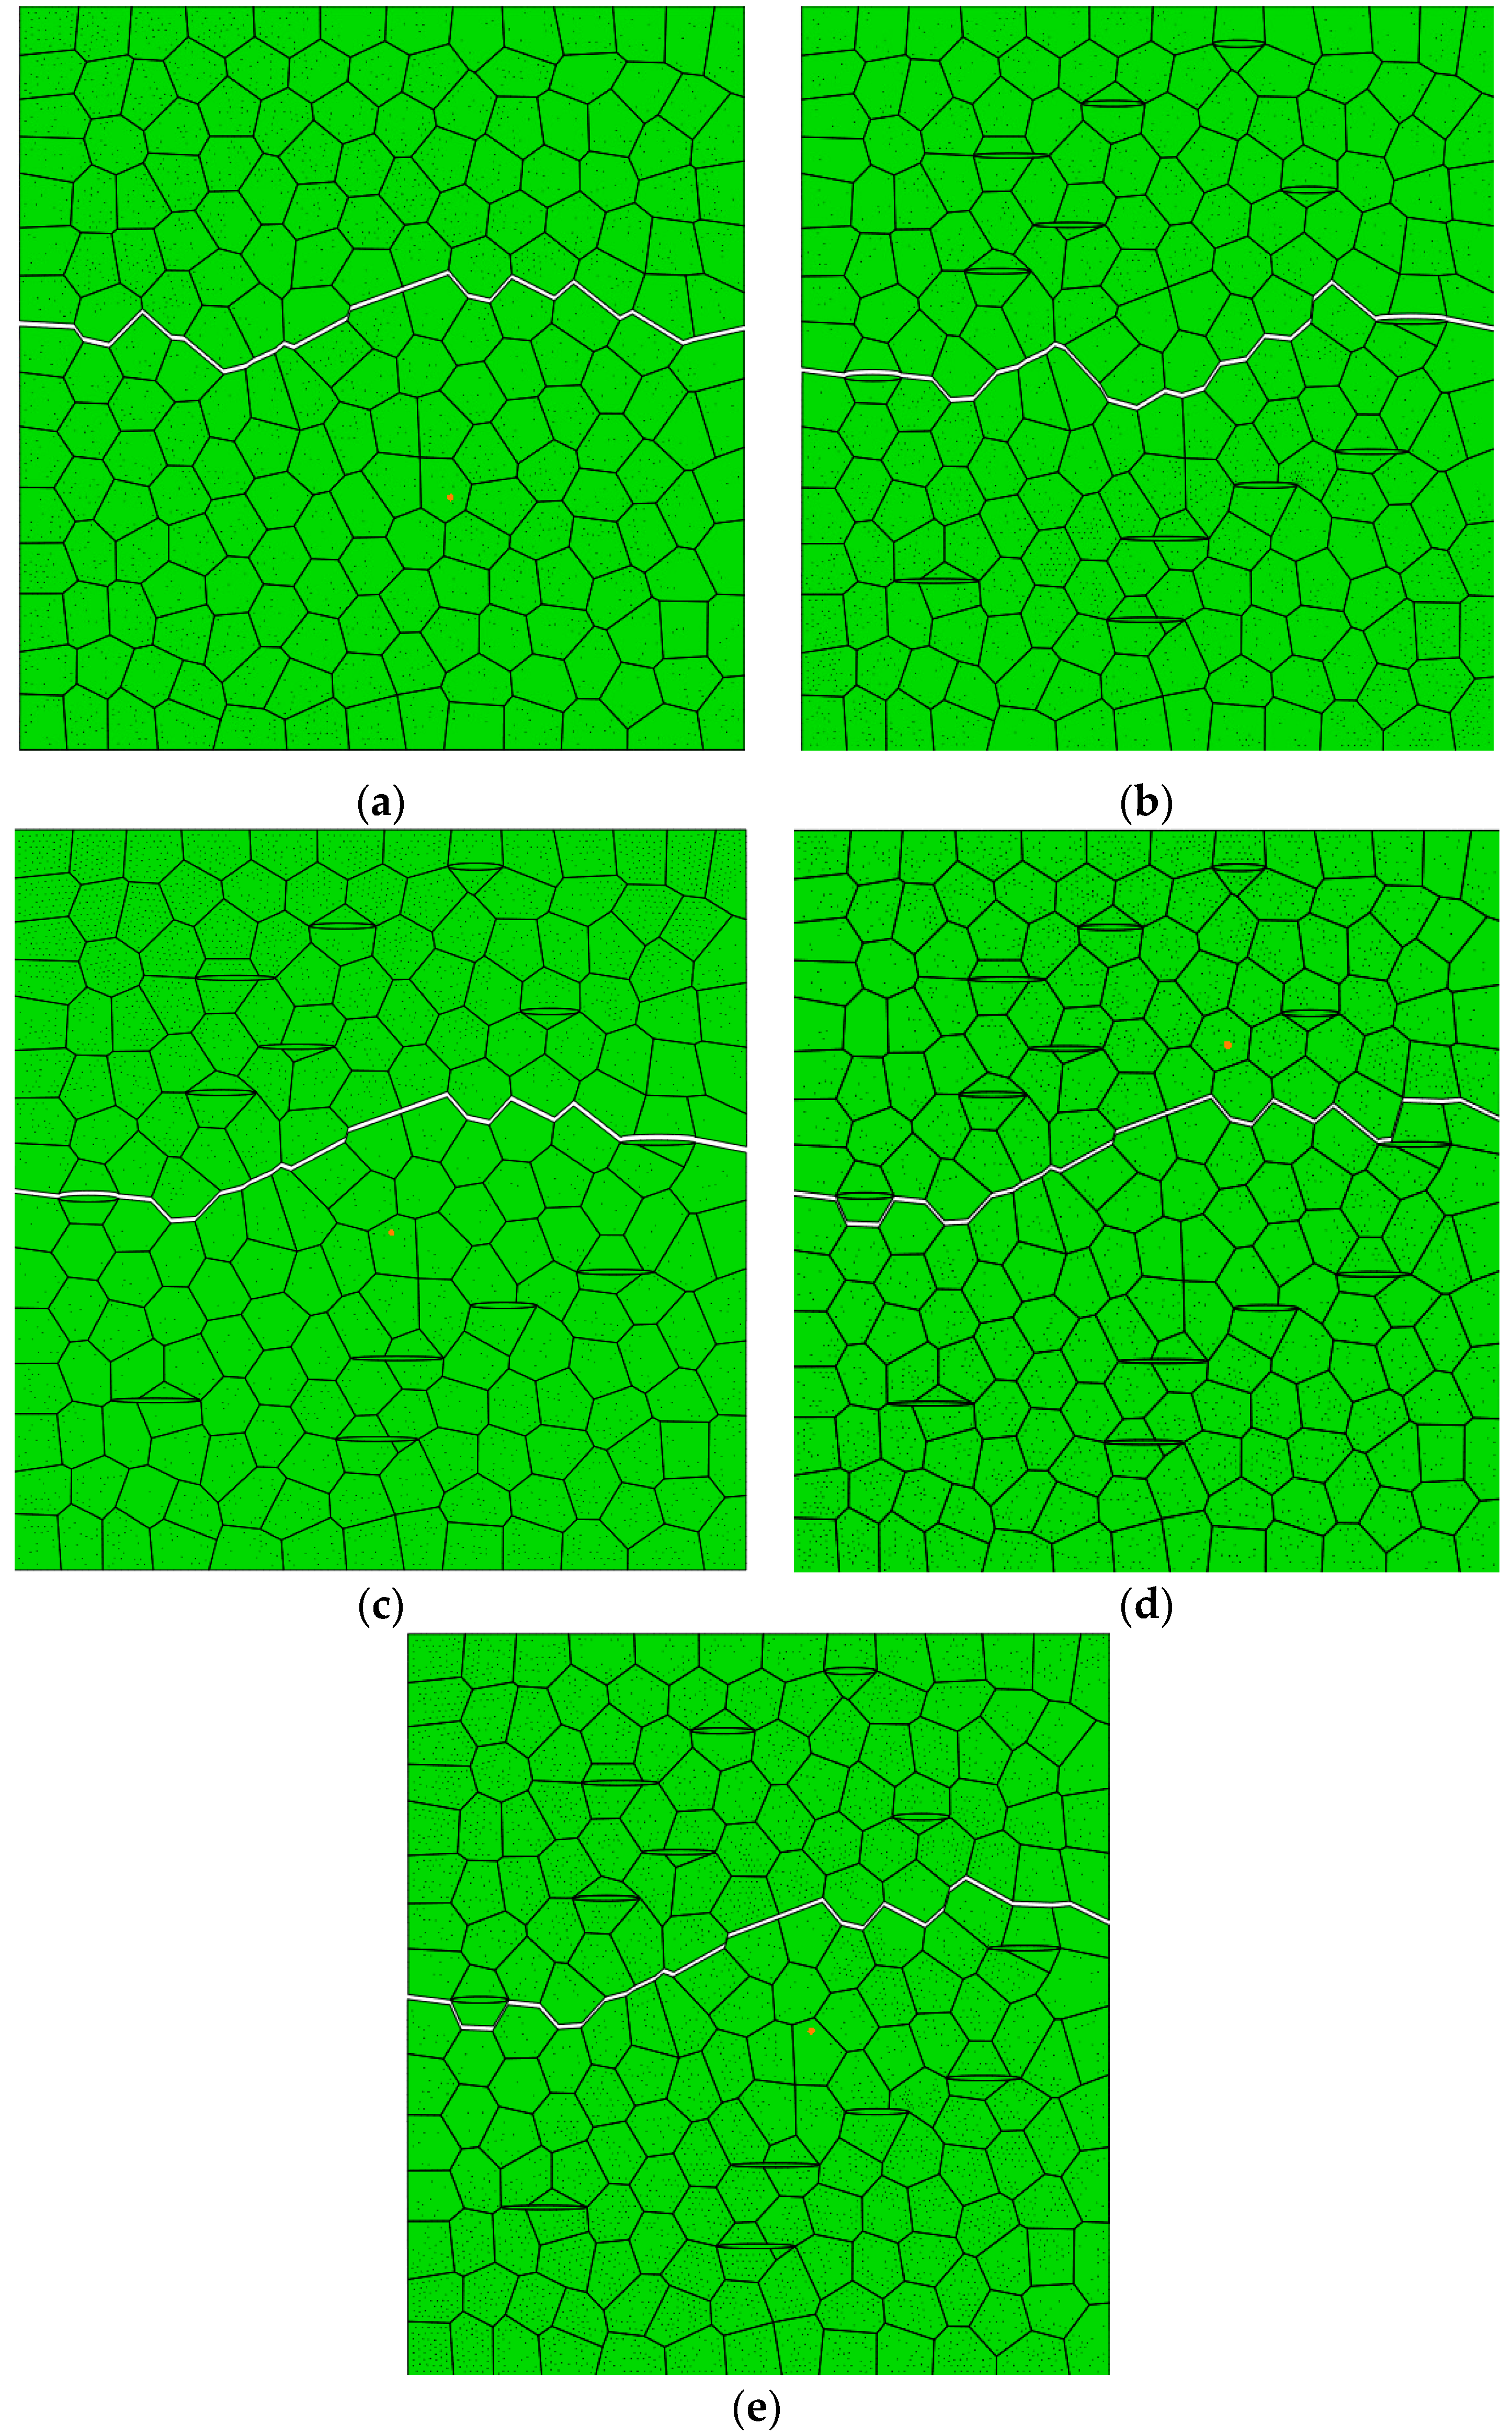
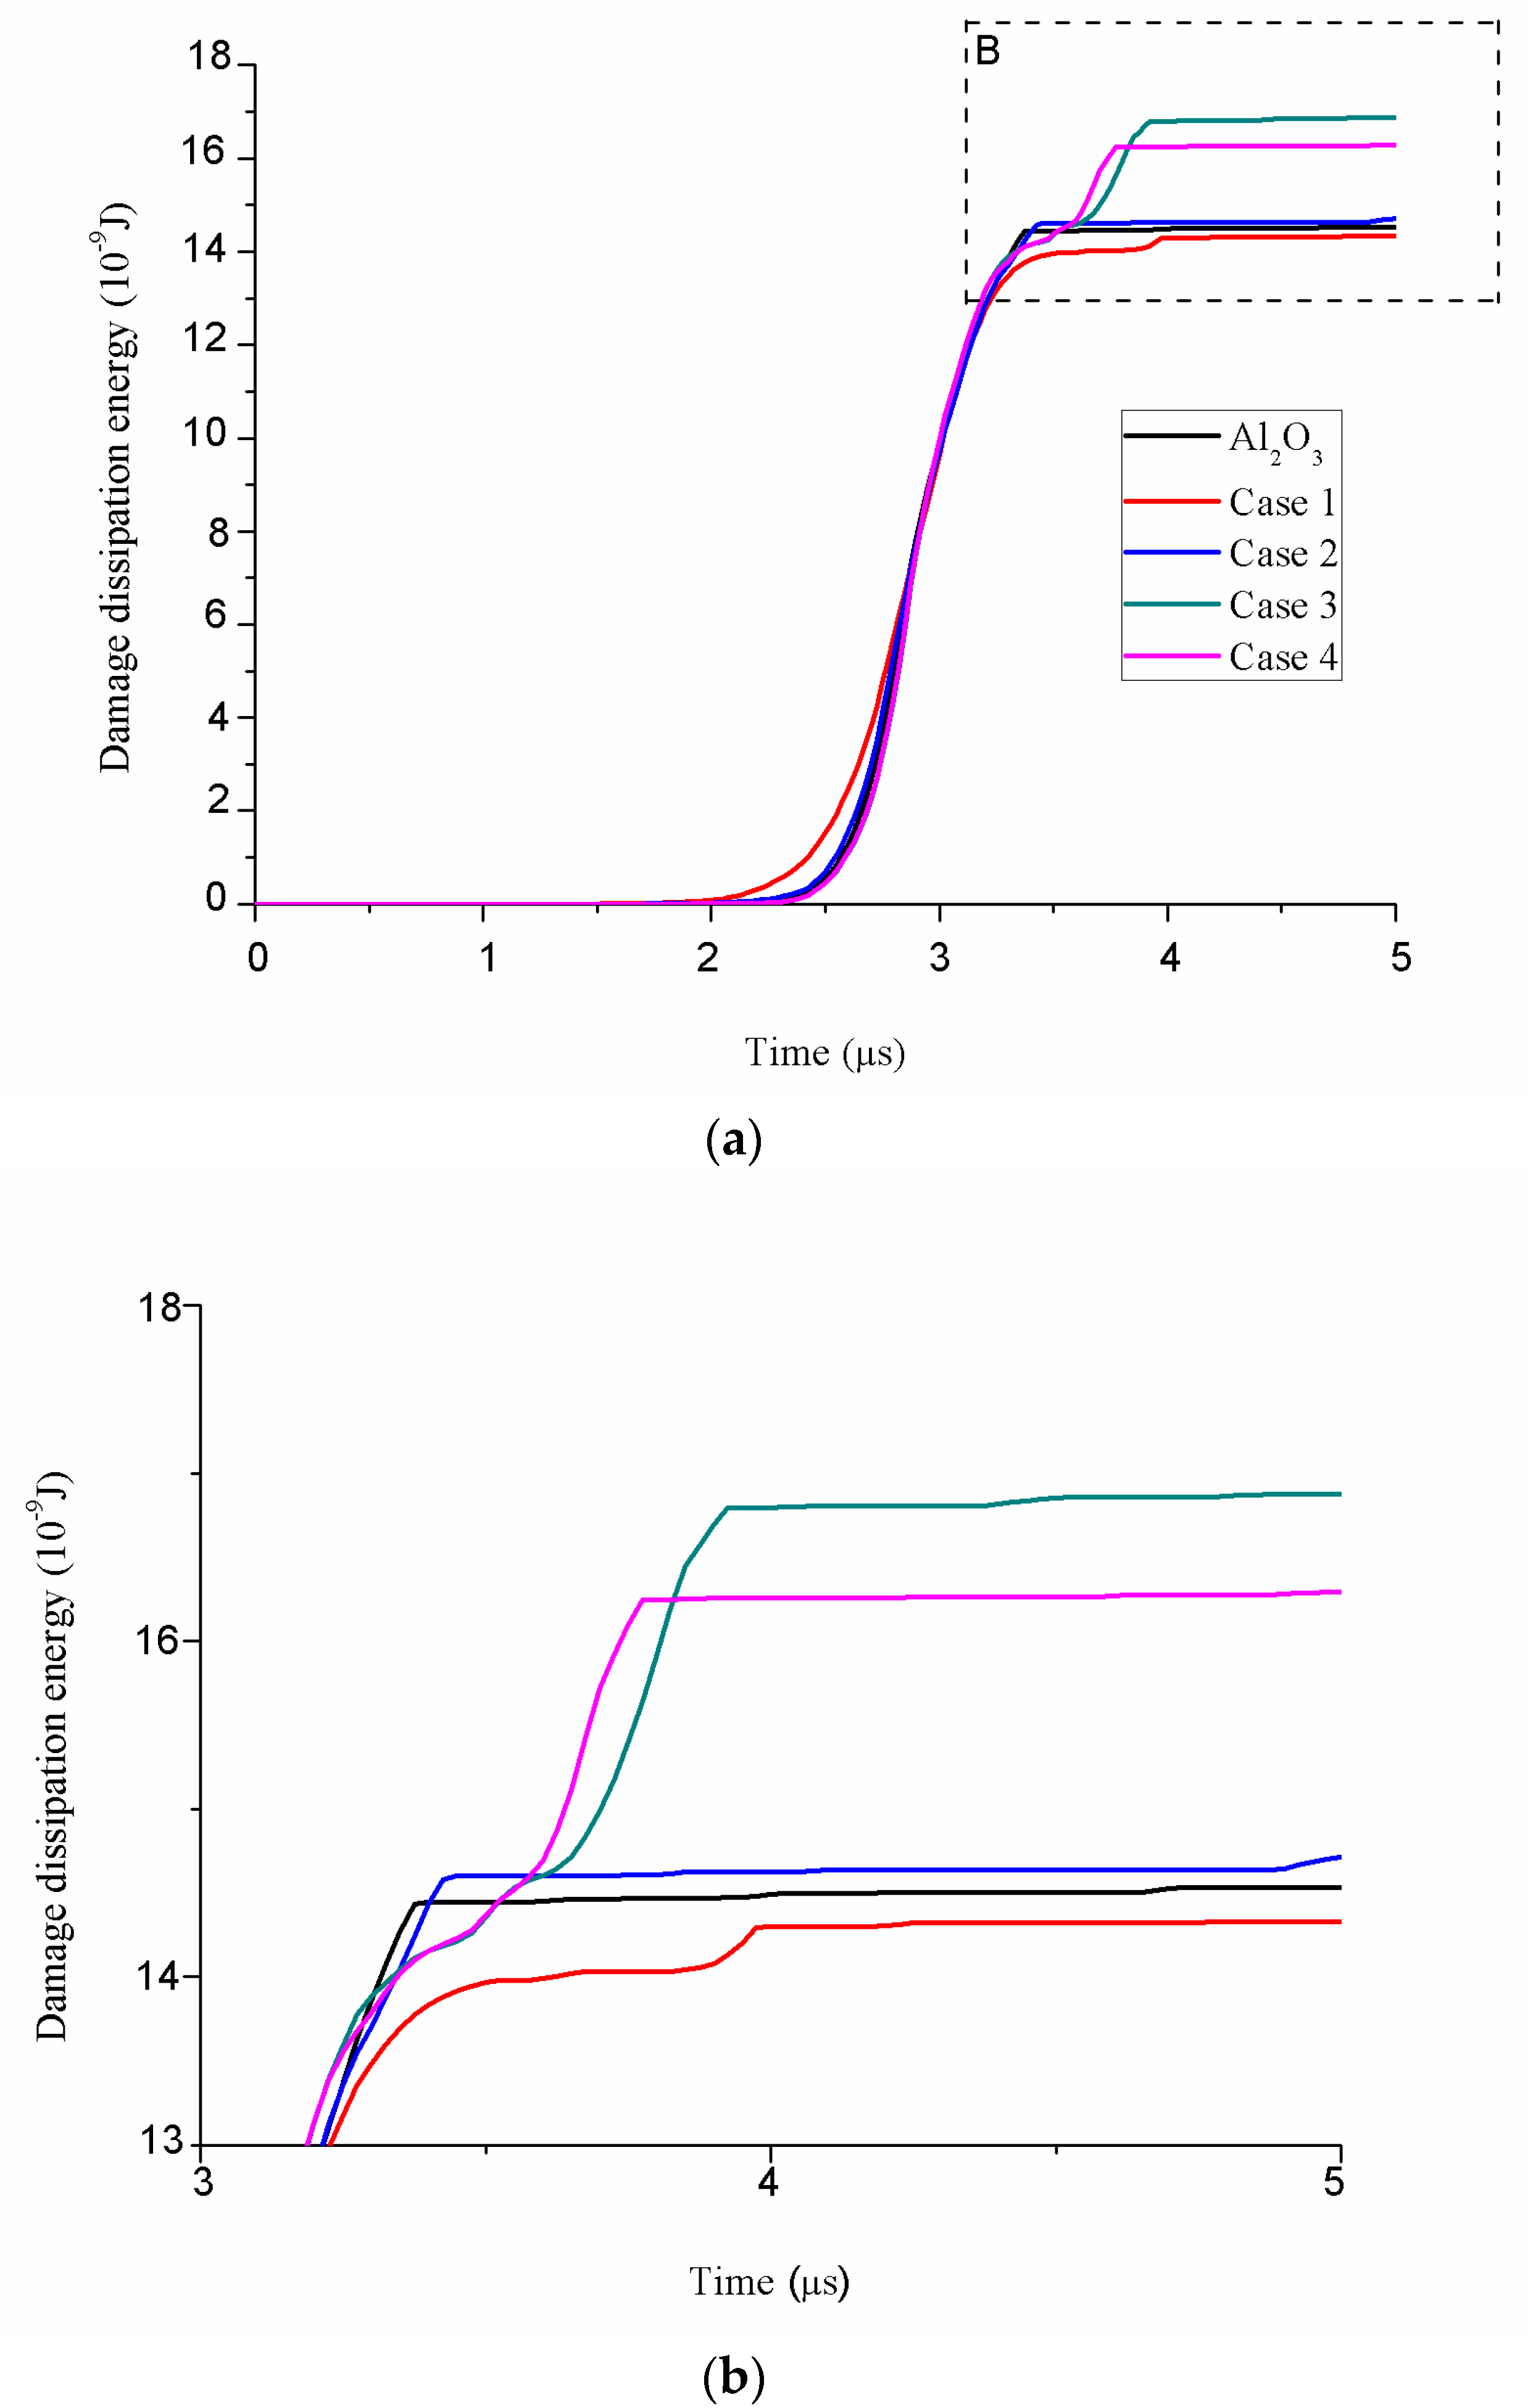
4.1. Results

Figure 8 shows the cracking results of microstructure. The time histories of apparent crack length and damage dissipation energy are plotted in Figure 9 and Figure 10, respectively.
Assuming no plastic deformation happens in the fracture process [25] and according to Griffith’s concept of energy balance, the expression of the total energy U of the system is
U = U M + U S
where U M is the mechanical energy and U S is the energy consumed to form new crack surfaces.
According to the thermodynamical equilibrium conditions [5], the following expression can be obtained:
d U d c = 0
where c is the apparent crack length that forms during the fracture process. Substituting Equation (3) into (4), the following equation can be obtained:
d U S d c = d U M d c = G C
The direct data obtained from the simulation is the fracture energy dissipation US. The average energy release rate G C of the model can be obtained through Equation (5), and G C can be used to characterize the fracture toughness of materials. The apparent crack length and average energy release rate of all the models are listed in Table 2.

4.2. Discussion

(1) The curves of the damage dissipation energy versus time are shown in Figure 10, from which the following can be seen:
The simulation results show that the fracture initiation time is about 2 μs. As the bonding strength between Al2O3 and graphene increases, the fracture initiation time is correspondingly delayed. When the grain boundary strength at the interface between Al2O3 and graphene is small, local damage will occur before reaching the critical stress, and the ability to resisting the crack propagation forward will be weak.
(2) According to the crack mode in the microstructure of Figure 8 and the time history of the total crack length of the crack microstructure of Figure 9, it can be seen that:
The crack propagation mode of single-phase Al2O3 ceramic tool material is intergranular fracture. As the grain boundary fracture strength of the ceramic tool material is less than that of the grain fracture strength, the grain boundary easily fractured under external loads. In Case 4, the interfacial strength between Al2O3 and graphene was very high, which deflected the cracks. The crack propagation path is basically the same as that of single-phase Al2O3. Crack deflection consumed a large amount of fracture energy, but also increased the crack propagation length. As shown in Table 2, the average energy release rate of single-phase Al2O3 and Case 4 was basically the same.
The average energy release rate of Case 1 was the lowest. The crack always tended to propagate along the path with the high driving force and low resistance. The crack propagated outward along the interface between Al2O3 and graphene.
The average energy release rate of Case 2 and Case 3 are higher. Due to the influence of the external load, the crack always tended to propagate along the plane perpendicular to the maximum principal tensile stress. Therefore, in Case 2, the crack propagation was relatively straight and the crack length was correspondingly short. Excessive grain strength of graphene will consume the additional fracture energy. Therefore, the average energy release rate of Case 2 was relatively high. In Case 3, when the grain length of graphene was the same as that of Al2O3, the crack propagation path was the same as that of Case 4. However, when the grain length of graphene was larger than that of Al2O3, the crack will extend along graphene grain for a certain distance and then deflect along the grain boundary of Al2O3. Due to the high interfacial bonding strength between Al2O3 and graphene, the expansion along graphene will consume more fracture energy. Furthermore, as the grain strength of graphene was very high, it will consume additional fracture energy, so Case 3 has the highest energy dissipation.

5. Conclusions

Voronoi tessellation was used to establish the microstructure of ceramic tool materials. The cohesive element method was used to investigate the effect of the different grain boundary strength on crack propagation in the micro model of AG. The following conclusions can be drawn:
(1) In Case 1, the interfacial bonding strength was the lowest and the crack propagation resistance was the worst. With the continuous increase of the interface strength, the resistance to crack propagation was strengthened. When the interface strength reached the maximum as in Case 4, the high-strength interface will consume the additional fracture energy. However, the average energy release rate was basically the same as that of single-phase Al2O3.
(2) In Case 2, the crack propagation deflected around graphene, which made the crack path relatively straight and reduced the crack propagation length. The grain strength of graphene was too high, and crack propagation to graphene will consume more fracture energy. The average energy release rate was relatively high. In Case 3, the excessive grain strength of graphene will consume additional fracture energy. The interfacial strength between Al2O3 and graphene was too high, and cracks propagating along graphene will consume more fracture energy and cause larger deflection.
The average energy release rate of Case 2 and Case 3 was increased by 2.4% and 2%, respectively, compared with the value of single-phase Al2O3 ceramic tool materials. It took more energy to generate cracks of the same length in Case 2 and Case 3. Case 2 and Case 3 have the good resistance to crack propagation. The relationship between the microstructure and mechanical properties of AG composite ceramic tool material was established by simulating its fracture behavior. As preliminary research for preparing AG composite ceramic tool materials, this provides guidance for subsequent preparation and testing of ceramic tool materials. The trial range can be reduced, ideal materials can be obtained through fewer trials, and the efficiency can be improved.

Author Contributions

Y.Z. and G.X. conceived and designed the experiments; Y.Z. Conduct simulation; Y.Z., G.X., C.X., T.Z., M.Y. and Z.C. analyzed the data; Y.Z. and G.X. wrote the paper.

Funding

This work was supported by the National Natural Science Foundation of China (grant number 51575285); The Natural Science Foundation of Shandong Province (grant number ZR2017LEE0140); Key Research Project of Shandong Province (grant numbers2017GGX30136, 2017GGX30118); Project for the Innovation Team of Universities and Institutes in Jinan (grant number 2018GXRC005).

Conflicts of Interest

The authors declare no conflicts of interest.

References

  1. Novoselov, K.S.; Geim, A.K.; Morozov, S.V.; Jiang, D.; Zhang, Y.; Dubonos, S.V.; Firsov, A.A. Electric Field Effect in Atomically Thin Carbon Films. Science 2004, 306, 666–669. [Google Scholar] [CrossRef] [PubMed] [Green Version]
  2. Bolotin, K.I.; Sikes, K.J.; Jiang, Z.; Klima, M.; Fudenberg, G.; Hone, J.; Kim, P.; Stormer, H.L. Ultrahigh Electron Mobility in Suspended Graphene. Solid State Commun. 2008, 146, 351–355. [Google Scholar] [CrossRef] [Green Version]
  3. Yin, Z.; Yuan, J.; Xu, W.; Liu, K.; Yan, S. Graphene nanosheets toughened TiB2-based ceramic tool material by spark plasma sintering. Ceram. Int. 2018, 44, 8977–8982. [Google Scholar] [CrossRef]
  4. Cui, E.; Zhao, J.; Wang, X.; Sun, J.; Huang, X.; Wang, C. Microstructure and toughening mechanisms of Al2O3/(W, Ti)C/Graphene composite ceramic tool material. Ceram. Int. 2018, 44, 13538–13543. [Google Scholar] [CrossRef]
  5. Zhou, T.; Huang, C.; Liu, H.; Wang, J.; Zou, B.; Zhu, H. Crack propagation simulation in microstructure of ceramic tool materials. Comput. Mater. Sci. 2012, 54, 150–156. [Google Scholar] [CrossRef]
  6. Guazzato, M.; Albakry, M.; Ringer, S.P.; Swain, M.V. Strength, fracture toughness and microstructure of a selection of all-ceramic materials. Part I. Pressable and alumina glass-infiltrated ceramics. Dent. Mater. 2004, 20, 441–448. [Google Scholar] [CrossRef]
  7. Guazzato, M.; Albakry, M.; Ringer, S.P.; Swain, M.V. Strength, fracture toughness and microstructure of a selection of all-ceramic materials. Part II. Zirconia-based dental ceramics. Dent. Mater. 2004, 20, 449–456. [Google Scholar] [CrossRef] [PubMed]
  8. Šajgalik, P.; Dusza, J.; Hoffmann, M.J. Relationship between Microstructure, Toughening Mechanisms, and Fracture Toughness of Reinforced Silicon Nitride Ceramics. J. Am. Ceram. Soc. 1995, 78, 2619–2624. [Google Scholar] [CrossRef]
  9. Zhai, J.; Tomar, V.; Zhou, M. Micromechanical Simulation of Dynamic Fracture Using the Cohesive Finite Element Method. J. Eng. Mater. Technol. 2004, 126, 179–191. [Google Scholar] [CrossRef]
  10. Bolander, J.; Saito, S. Fracture analyses using spring networks with random geometry. Eng. Fract. Mech. 1998, 61, 569–591. [Google Scholar] [CrossRef]
  11. Wang, D.; Zhao, J.; Zhou, Y.; Chen, X.; Li, A.; Gong, Z. Extended finite element modeling of crack propagation in ceramic tool materials by considering the microstructural features. Comput. Mater. Sci. 2013, 77, 236–244. [Google Scholar] [CrossRef]
  12. Barenblatt, G.I. The Mathematical Theory of Equilibrium Cracks in Brittle Fracture. Adv. Appl. Mech. Vol. 1962, 7, 55–129. [Google Scholar]
  13. Xu, X.P.; Needleman, A. Numerical simulations of fast crack growth in brittle solids. J. Mech. Phys. Solids 1994, 42, 1397–1434. [Google Scholar] [CrossRef]
  14. Hillerborg, A.; Modéer, M.; Petersson, P.E. Analysis of crack formation and crack growth in concrete by means of fracture mechanics and finite elements. Cem. Concr. Res. 1976, 6, 773–781. [Google Scholar] [CrossRef]
  15. Ghosh, S.; Liu, Y. Voronoi cell finite element model based on micropolar theory of thermoelasticity for heterogeneous materials. Int. J. Numer. Methods Eng. 1995, 38, 1361–1398. [Google Scholar] [CrossRef]
  16. Quey, R.; Dawson, P.R.; Barbe, F. Large-scale 3D random polycrystals for the finite element method: Generation, meshing and remeshing. Comput. Methods Appl. Mech. Eng. 2011, 200, 1729–1745. [Google Scholar] [CrossRef] [Green Version]
  17. Cornec, A.; Scheider, I.; Schwalbe, K.H. On the practical application of the cohesive model. Eng. Fract. Mech. 2003, 70, 1963–1987. [Google Scholar] [CrossRef]
  18. Tvergaard, V.; Hutchinson, J.W. The relation between crack growth resistance and fracture process parameters in elastic-plastic solids. Mech. Phys. Solids 1992, 40, 1377–1397. [Google Scholar] [CrossRef]
  19. Tvergaard, V.; Hutchinson, J.W. Effect of T-stress on mode I crack growth resistance in a ductile solid. Int. J. Solids Struct. 1994, 31, 823–833. [Google Scholar] [CrossRef]
  20. Yu, H.B.; Huang, C.Z.; Liu, H.L.; Zou, B.; Zhu, H.T.; Wang, J. A 3D Cohesive Element Model for Fracture Behavior Analysis of Ceramic Tool Materials Microstructure. Mater. Sci. Forum 2012, 723, 119–123. [Google Scholar] [CrossRef]
  21. Zhang, P.; Ma, L.; Fan, F.; Zeng, Z.; Peng, C.; Loya, P.E.; Liu, Z.; Gong, Y.J.; Zhang, J.N.; Zhang, X.X. Fracture toughness of graphene. Nat. Commun. 2014, 5, 3782. [Google Scholar] [CrossRef] [PubMed] [Green Version]
  22. Li, Z.L.; Zhao, J.; Sun, J.L.; Gong, F.; Ni, X.Y. Reinforcing effect of graphene on the mechanical properties of Al2O3/TiC ceramics. Int. J. Miner. Metall. Mater. 2017, 24, 1403–1411. [Google Scholar] [CrossRef]
  23. Tomar, V.; Zhai, J.; Zhou, M. Bounds for Element Size in a Variable Stiffness Cohesive Finite Element Model. Int. J. Numer. Methodsin Eng. 2004, 61, 1840–1920. [Google Scholar] [CrossRef]
  24. Tomar, V. Analyses of the Role of the Second Phase SiC Particles in Microstructure Dependent Fracture Resistance Variation of SiC-Si3N4Nanocomposites. Model. Simul. Mat. Sci. Eng. 2008, 16, 035001. [Google Scholar] [CrossRef]
  25. Olson, G.B. Computational Design of Hierarchically Structured Materials. Science 1997, 277, 1237–1242. [Google Scholar] [CrossRef]
Figure 1. Voronoi tessellation.
Crystals 09 00669 g001
Figure 2. Cohesive zone at the crack tip.
Crystals 09 00669 g002
Figure 3. Common traction–separation law (a) exponential traction–separation law (b) bilinear traction–separation law (c) polynomial traction–separation law (d) trapezoid traction–separation law.
Crystals 09 00669 g003
Figure 4. The bilinear traction–separation law.
Crystals 09 00669 g004
Figure 5. The process of building a microstructure model.
Crystals 09 00669 g005
Figure 6. Embedding the cohesive element: (a) sketch of embedding cohesive element; (b) partial enlarged drawing of FEM mesh; (c) cohesive element on grain boundary; and (d) cohesive elements inside grains.
Crystals 09 00669 g006aCrystals 09 00669 g006b
Figure 7. Microstructure and boundary conditions: (a) AG microstructure; (b) boundary conditions.
Crystals 09 00669 g007
Figure 8. Cracking patterns in microstructures: (a) Microscopic model of single-phase Al2O3 ceramic tool material; (b) Case 1; (c) Case 2; (d) Case 3; and (e) Case 4.
Crystals 09 00669 g008
Figure 9. Time histories of apparent crack length for microstructures. (a) Apparent crack length for the entire simulation time (b) Partial enlarged drawing of (a).
Crystals 09 00669 g009
Figure 10. Time histories of damage dissipation energy for microstructures. (a) Damage dissipation energy of model (b) Partial enlarged drawing of (a).
Crystals 09 00669 g010
Table 1. Material parameters of the microstructure.
Element TypeTmax (MPa)Γ (J/m2)K (Mpa/mm)
Cohesive elements in Al2O36442.39 × 109
Cohesive elements in Al2O3 grain boundaries18611.73 × 109
Cohesive elements in graphene209015.91.37 × 1010
Case 1 phase interface1290.461.78 × 109
Case 2 phase interface18611.73 × 109
Case 3 phase interface6442.39 × 109
Case 4 phase interface209015.91.37 × 1010
Table 2. Calculation results for microstructures.
MicrostructureApparent Crack Length (μm)Energy Dissipated (10−9 J)GC (10−3 J/m2)
Al2O314.2514.51.018
Case 115.4814.30.924
Case 214.0914.71.042
Case 316.2716.91.039
Case 416.0516.31.016

