Abstract
Transmembrane proteins (TMPs) play vital and diverse roles in many biological processes, such as molecular transportation and immune response. Like other proteins, many major interactions with other molecules happen in TMPs’ surface area, which is important for function annotation and drug discovery. Under the condition that the structure of TMP is hard to derive from experiment and prediction, it is a practical way to predict the TMP residues’ surface area, measured by the relative accessible surface area (rASA), based on computational methods. In this study, we presented a novel deep learning-based predictor TMP-SSurface for both alpha-helical and beta-barrel transmembrane proteins (α-TMP and β-TMP), where convolutional neural network (CNN), inception blocks, and CapsuleNet were combined to construct a network framework, simply accepting one-hot code and position-specific score matrix (PSSM) of protein fragment as inputs. TMP-SSurface was tested against an independent dataset achieving appreciable performance with 0.584 Pearson correlation coefficients (CC) value. As the first TMP’s rASA predictor utilizing the deep neural network, our method provided a referenceable sample for the community, as well as a practical step to discover the interaction sites of TMPs based on their sequence.
1. Introduction
Transmembrane protein (TMP) is one of the most important types of membrane proteins (MPs) that span the entire biological membranes in the whole molecular life cycle as a gateway or receptor. They involve in diverse biological processes, such as cell mechanics regulation [1], signal transduction [2], molecule transport [3], etc. Special interest in TMPs also arises from the fact that they associate with many types of diseases, such as autism [4], dyslipidemia [5], epilepsy [6], and various types of cancers [7,8,9]. Since TMPs play numerous roles in basic physiology and pathophysiology, TMPs are major targets for more than one-third of known drugs on the current therapeutics market [10]. On one side of the membrane, TMPs INTERACT with ligands, including protons, metal ions, enzyme, drug-like compound, etc. On the other side, they interact with proteins, RNAs, or other molecules to trigger a series of molecular reactions and eventually control the cell functions. The interaction interface is always located on the surface areas of TMPs, according to the statistics [11]. The surface accessibility of the residues in the protein can be measured by the relative accessible surface area (rASA), which refers to the relative surface area of the residues exposed to the environment surrounding the protein [12].
As a valuable structural property, predicting rASA based on primary sequence is a rewarding task for TMPs in structure prediction, function annotation, and drug discovery [13]. In recent years, several sequence-based methods have been developed to predict the surface accessibility of residues for TMPs. Thijs B. et al. firstly published a knowledge-based method (ProperTM) to predict and analyzed the burial state (burial or exposure) of transmembrane residues within TMPs [14]. After that, several machine learning-based methods have been developed. Depending on their functionality, these methods can be roughly grouped into two categories: burial state identifier and surface area predictor. Identifying the burial state of residues is a binary classification problem; it predicts whether residues are exposed to the surface or buried inside of the TMP, such as TMX [15], Yao et al. (2011) [16], TMexpoSVC [17]. Predicting the real value of surface area is a regression problem; these tools predict the accessible surface area (ASA) value or the relative accessible surface area (rASA) value of residues, such as ASAP [18], MPRAP [19], Yao et al. (2012) [20], TMexpoSVR [17], and MemBrain-Rasa [21,22]. A summary of these methods is listed in Table 1 in chronological order.

Table 1.
The summaries of existing methods for predicting surface accessibility of transmembrane protein (TMP) residues.
Although considerable achievements have been made in the field of TMP surface accessibility prediction, there are still several issues that deserved to be further improved. First of all, none of the mentioned methods could predict the rASA of the whole sequence of all kinds of TMPs. On the one hand, except for MPRAP and MenBrain-Rasa, most predictors can only be applied within transmembrane regions of TMPs, which focus only on the lipid-accessible surface while ignoring the water-accessible surface. It is worth pointing out that the prediction of rASA on the full sequence is more challenging than those that only apply to transmembrane residues. On the other hand, most methods only focus on α-helical TMPs while ignoring β-barrel TMPs—including the only two full sequence predictors. Although β-barrel TMPs just account for a small proportion of TMPs, it is also essential to be studied and should not be ignored. Up to now, ASAP and Yao et al. (2012) are the only two predictors that can be applied to both α-helical and β-barrel TMPs, but it is a pity that they can only be used to predict transmembrane regions of TMPs. Thus, it is meaningful to design a more powerful full sequence predictor to predict rASA for all kinds of TMPs.
Besides, previous predictors relied heavily on the features derived from third-party tools, such as position-specific score matrix (PSSM) [23], Z-coordinate, secondary structure [24], and so on. Although these features contribute to the improvement of the predictor performance [25,26,27], their weakness cannot be ignored. On the one hand, using these third-party tool-derived features will make the predictor slow and may lead to uncontrollable failure. For example, MemBrain-Rasa uses six types of features, four of whom relied on the third-part tools, and seven out of 50 proteins cannot get a reliable prediction result from MemBrain-Rasa on the independent test. On the other hand, expertise in TMPs is always required to successfully use the previous methods, which may confuse the non-professional users and hinder the exploration of the biological significance of the prediction process. Since most previous predictors can only be applied in the transmembrane regions of TMPs, the topology structure of TMPs must be known before using them. However, it is difficult for non-professional researchers to determine the topology of TMPs. Based on this consideration, we tried to describe the protein fragment with features as concise as possible to make the predictor simpler and more efficient. After a series of experiments, we selected two types of encoding schemes to represent the protein fragment: one-hot code [28,29,30] and a position-specific scoring matrix (PSSM), where the former one encodes the residues arrangement and the latter one reflect the evolutionary profile. However, reducing the number of features will inevitably result in less information that may get by the predictor and cause performance deterioration. As a promising solution, decreasing the dependency on sophisticated features, a deep learning-based method was introduced in this study for its ability to discover the structural features from the sequence. The proposed method was a deep learning network that combines a convolutional neural network (CNN), inception network, and CapsuleNet.
In this study, we proposed a sequence-based rASA predictor (TMP-SSurface) for the full sequence of all types of TMPs, that achieved considerable performance while simplifying the input features as much as possible. Only one-hot code and PSSM were used as the input features of a new proposed deep learning-based regression method, which combined the inception network with CapsuleNet. The experimental result showed that the performance of TMP-SSurface achieved a Pearson correlation coefficient (CC) of 0.581 on the independent validation, which was slightly better than the results of today’s best predictor, but much more simple than it. TMP-SSurface is accessible freely in http://icdtools.nenu.edu.cn/tmp_ssurface. The datasets used in the experiment and project of the predictor could be downloaded from the web-server.
2. Results and Discussion
2.1. Feature Analysis
We tried several features, such as topology structure, physicochemical properties, and Z-coordinate. Although these features contributed to the predictor more or less, they were not as significant as one-hot code and PSSM. Besides, additional features would make the predictor more complex. To make the predictor as simple as possible while ensuring the prediction performance, we decided to use a one-hot code and PSSM as the features to describe the basic information of the protein fragment.
In order to investigate the contribution of different features to the predictor, we trained three models using one-hot code, PSSM, and both of them, respectively. Since the proposed model was parameter sensitive, we carried out the complete process of hyper-parameter tuning for each model to make sure the reliable prediction performance. The performance of predictors by using different features on the validation samples is illustrated in Table 2. It was evident that the predictors using a single feature achieved similar performance and achieved a more considerable performance when they were combined.
Table 2.
The performance of features.
2.2. Effect of Window Size
Because the length of the sliding window determined the information feeding in the proposed predictor, it was an important variable that affected the prediction performance directly. We searched for the values of window size from 13 to 23 by the step of 2. As could be seen in Table 3, the predictor achieved the best prediction performance (CC value) on the validation samples when the window size reached 19.
Table 3.
The CC value of validation samples using different window sizes.
2.3. Hyper-Parameter Tuning
We carried out a series of experiments to identify a better configuration of hyper-parameters for the proposed predictor. The performance of the network was affected by a large number of parameters, among which the inception block’s number and dynamic routing times were two major hyper-parameters that greatly influenced it.
Table 4 illustrates the effect of the inception blocks’ number on the involved parameter’s number, training time, and CC performance. It was obvious that as the number of inception blocks grew, the number of parameters involved in the network increased exponentially. When the number of inception blocks reached three, the best CC value had been achieved. Thus, three inception blocks were suitable.
Table 4.
Effect of the number of inception blocks on involved parameters’ number and CC performance.
Table 5 illustrates the effect of the number of dynamic routings on training time and CC performance. As the number of dynamic routing increased, the time required for training the network increased rapidly. Previous studies had shown that too much dynamic routing times would lead to a decrease in prediction performance [31]. When the number of dynamic routings reached three, the CC value started to fluctuate and decrease slowly. Thus, three dynamic routings were suitable.
Table 5.
Effect of the number of dynamic routings on prediction performance.
2.4. Ablation Study
We proposed a compound network that combined CNN, inception, and CapsuleNet. In order to prove the effectiveness of the proposed model, we carried out an ablation study by removing some parts of the network. Each model in the ablation study was performed using the same data, feature, and hyper-parameters. Table 6 illustrates the performance of different models. We found that CapsuleNet was the most effective component: The CapsuleNet achieved the best performance compared with the other two components, and the performance significantly decreased when removing CapsuleNet. Since the performance of the TMP-SSurface model was considerably better than others, combining three components made sense.
Table 6.
Comparison of the different models in the ablation study.
2.5. Comparison with Previous Predictors
As described previously, several works have been done to predict the rASA of membrane proteins. However, most of the methods predict the rASA of the transmembrane region in the TMPs, instead of the whole sequence. Since MPRAP and MemBrain-Rasa are the only two predictors that can be used to predict the entire sequence of TMPs, we compared TMP-SSurface with them. For the result presented in Table 7, we found that TMP-SSurface significantly outperformed MPRAP and was similar to MemBrain-Rasa. MemBrain-Rasa was the most effective predictor in this field. On the contrary, TMP-SSurface was much more simple: first, MemBrain-Rasa contained a template-based pre-processing before using the traditional machine learning method, while TMP-SSurface used a deep learning method. Second, MemBrain-Rasa used six types of features that were calculated by several third-party tools, such as R4S, Zpred, PSIPRED, etc. These third-party tools might cause the failure: seven out of 50 proteins could not get a reliable prediction result from MemBrain-Rasa. TMP-SSurface used only one-hot code and PSSM as features—it was stable to get reliable prediction results. It is worth to note that the web-server of MPRAP and MemBrain-Rasa accepted only one protein sequence as the input, while TMP-SSurface accepted multiple sequences as input. We tested the time cost of three web-servers: TMP-SSurface was significantly faster than others. The details of the comparison are shown in Table 7.
Table 7.
Comparison of TMP-SSurface with the previous predictors on the independent dataset.
2.6. Short Sequence Test
Both MPRAP and MemBrain-Rasa limited the length of the input sequence: The limitation of MPRAP was 20–10,000, and MemBrain-Rasa was 30–5,000. This limitation might sometimes be frustrating for users. Although we removed the short proteins with residues less than 30 when building the benchmark datasets, the predictor TMP-SSurface and the corresponding web-server had no restriction on the length of the input sequence. Since there are no proteins longer than 5000 in the Protein Data Bank of Transmembrane Proteins (PDBTM, version: 2019-01-04) [32], we could only carry out an additional experiment on short sequences to prove that the predictor performs well on them. A total of 122 short sequences with residues less than 30 were collected from PDBTM. After removing the high homology sequences by using CD-HIT [33] with a 30% sequence identity cut-off, 89 non-redundant sequences were left. The performance of TMP-SSurface on the short sequence dataset was compared with that on the independent test dataset (50 proteins with 30–5000 residues). The data of the short sequences can be found in the Supplementary Materials: Data sets used in the experiments. From the result presented in Table 8, we found that TMP-SSurface performed well on short sequences.
Table 8.
Performance of TMP-SSurface on different lengths of sequences.
2.7. TMP Type Test
Both MPRAP and MemBrain-Rasa only focused on α-helical TMPs while ignoring β-barrel TMPs. Although β-barrel TMPs just account for a small proportion of TMPs, it is also essential to be studied and should not be ignored. The independent testing dataset contained 45 α-helical TMPs and five β-barrel TMPs. Table 9 illustrates the prediction performance of the different types of TMPs on the independent testing dataset. It could be seen that the prediction performance of β-barrel TMPs was a little bit lower than that of α-helical TMPs’, but was also considerable.
Table 9.
Performance of TMP-SSurface on the different types of TMPs.
2.8. Case Study
To further demonstrate the effectiveness of TMP-SSurface, we took 4n6h_A and 1a0s_P as examples of case studies. 4n6h_A is a Escherichia coli α-helical transmembrane protein (subgroup: G protein-coupled receptor), which is the receptor of various ligands, such as heme, sodium ion, and δ-opioid [34]. Opioids represent widely prescribed and abused medications, although their signal transduction mechanisms are not well understood. When visualizing the PDB file of 4n6h_A, we found that the δ-opioid was located on a pit on the surface of the protein. 1a0s_P is a Salmonella typhimurium β-barrel transmembrane protein (subgroup: porin), which is the transporter of calcium ion and sucrose and involves in many signal pathways. When visualizing the pdb file of 1a0s_P, we found that the ligand-binding sites were located on the extracellular solvent surface and the water-filled transmembrane channel (the solvent surface of the pore). Hence, accurately predicting the rASA of these proteins would help to study the characteristics of their functional or structural regions.
Figure 1 is the visualization of the predicted result of 4n6h_A and 1a0s_P. (a) and (c) are illustrations of TMP-SSurface-predicted rASA on the 3D version of 4n6h_A and 1a0s_P, respectively. It could be seen that TMP-SSurface did a good job, especially for residues located on the non-transmembrane regions—surface residues exposed to water in these regions. In the transmembrane regions, the TMP-SSurface-predicted rASA was always lower than DSSP [35] calculated rASA. This might be explained by the amino acid composition of surface residues, located on transmembrane regions, which was significantly different from that of non-transmembrane regions. Since the surface residues located on the transmembrane regions were exposed to lipid, most of them were hydrophobic residues. Still, TMP-SSurface did a good job on TM regions as well. (d) and (b) are comparisons between the TMP-SSurface-predicted rASA and the DSSP-calculated rASA of 4n6h_A and 1a0s_P by line chart. The prediction accuracy of TMP-SSurface on the exposed residues () was better than that on the burial residues (). The surface residues located on the transmembrane regions were exposed to the lipid—the hydrophobic environment, which is similar to the environment inside the protein. TMP-SSurface might confuse the burial residues with surface residues located on the transmembrane regions, resulting in low prediction accuracy of these residues.
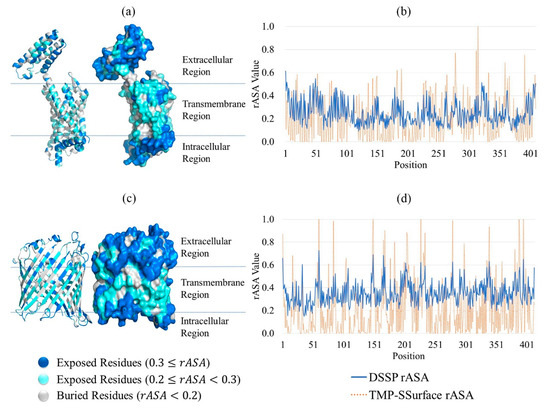
Figure 1.
Case study of TMP-SSurface: take 4n6h_A and 1a0s_P as examples. (a) Visualization of the predicted result of 4n6h_A on the 3D version of the protein (cartoon and surface versions). (b) Comparison of DSSP rASA and TMP-SSurface-predicted rASA of 4n6h_A. (c) Visualization of the predicted result of 1a0s_P on the 3D version of the protein (cartoon and surface versions). (d) Comparison of DSSP rASA and TMP-SSurface-predicted rASA of 1a0s_P. TMP: transmembrane protein, rASA: relative accessible surface area.
3. Materials and Methods
3.1. Benchmark Datasets
As illustrated in Table 1, the number of samples used by previous methods is small. Since the number of TMP structures has increased rapidly in the past few years, a more comprehensive data set is required. Protein Data Bank of Transmembrane Proteins (PDBTM) [32] is the first comprehensive and up-to-date transmembrane protein selection of the Protein Data Bank (PDB) [36]. We downloaded 4007 transmembrane proteins from PDBTM (version: 2019-01-04), which contained 3559 alpha proteins and 426 beta proteins. We first removed the proteins, which contained unknown residues (such as “X”), as well as those less than 30 residues in length. In order to reduce the influence of data redundancy and homology bias, these proteins were clustered by CD-HIT with a 30% sequence identity cut-off, and the representative sequences in each cluster were picked. After that, we had 704 protein chains (618 alpha protein chains and 86 beta protein chains) left. After that, these proteins were divided randomly into a training set with 604 proteins, a validation set with 50 proteins, and a test set with 50 proteins. The data can be found in the Supplementary Materials: Data sets used in the experiments.
3.2. Calculation of rASA
Accessible surface area (ASA) refers to the surface accessibility of a residue when it exposes to the water or lipid. It can be calculated from its structural information by several tools, such as DSSP [35], PSAIA [37], and Naccess [38]. In this work, the ASA of each residue was calculated by DSSP, with a probe of the radius of 1.4 Å. A residue’s relative accessible surface area (rASA) is calculated by dividing its ASA by the maximum accessible surface area (MaxASA), which is the rASA of the extended tri-peptides (Gly-X-Gly) [39]. Several MaxASA scales have been published [40,41], and we used the empirical values for MaxASA defined by Tien et al. in 2013 [39]. rASA can be calculated by the formula:
3.3. Encoding of Protein Fragments
For a given protein sequence, a sliding window scheme was used to slice the protein into fragments. The reason for using the sliding window is that the rASA of the residue is greatly influenced by its sequential neighbors [42]. Here, we set the window size to 19: target residue with 9 residues from upstream and 9 residues from downstream.
To accurately predict a TMP’s rASA, it is crucial to extract useful information from the primary sequence as the input of prediction models. Besides, we tried to describe the protein fragments with features as concise as possible to make the predictor simpler and more efficient. After a series of experiments, we selected two types of encoding schemes to represent the protein fragment: one-hot code and PSSM.
One-hot code is a 20-dimension vector whose elements represent the type of residues. For a given residue, the position of the corresponding residue is 1, and all the others are 0. It is simple to design and have been proved to be a powerful feature for protein function prediction associated problems [43,44,45]. To improve the prediction performance of the residues located on the ends of the protein sequence, we added one dimension after the one-hot code vector to encode the sequence’s terminal flag. As shown in Figure 2, if the “residue” was beyond the range of the protein sequence, we encoded the flag bit as 1 with all one-hot code bits as 0. In contrast, we encoded the flag bit as 0 while the one-hot code was legal. For the given residue in the protein sequence, the one-hot code features of the corresponding fragment were encoded by a matrix. For a protein with L residues, we obtained L matrices.
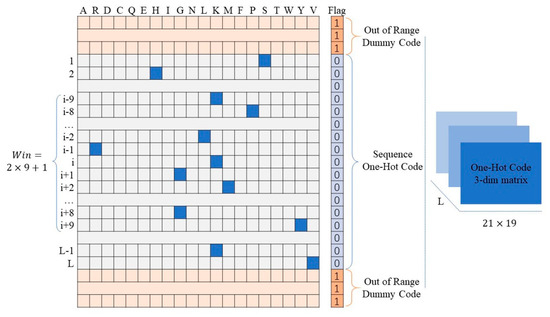
Figure 2.
Schematic of one-hot code and terminal flag code.
The position-specific scoring matrix (PSSM) represents the evolutionary profile of the protein sequence. It has been proved that highly conserved regions are always correlated within the functional regions [46,47,48]. PSSM has been widely used in many bioinformatics problems, such as membrane-ligand binding sites prediction [11] and protein secondary structure prediction [49]. The PSSM of TMPs was obtained by using the PSI-BLAST [50] tool to search the uniref50 (version: 2019-01-16) database through 3 iterations with a 0.01 E-value cutoff. For the given residue in the protein sequence, the PSSM feature of the corresponding fragment was encoded by a matrix.
In conclusion, we described the given residue by a matrix, which contained a one-hot code and PSSM.
3.4. Model Design
We presented a deep learning network called TMP-SSurface, whose design is shown in Figure 3a. For a given residue in the TMP, the input features were one-hot code ( array) and PSSM ( array). First of all, one CNN layer (256 kernels and a stride of 1) was applied to generate the convolved features to extract local low-level features. After that, the abstracted features were fed into the inception layers: Three Inception blocks were applied side by side to extract low-to-intermediate features. Inception V1 was used as one inception block (See Figure 3b for details). A capsule layer was placed after the inception layers to extract high-level features or explore the spatial relationship among the local features that were extracted in the layers mentioned above. The primary capsule layer was a convolutional capsule layer, as described in the work of Sabour’s team [51]. It contained 32 channels of convolutional 8D capsules, with a kernel and a stride of 2. The final layer (regression capsule) had one 16D capsule to represent the probability of residues being exposed to the surface. The weights between primary capsules and regression capsules were determined by the iterative dynamic routing algorithm. The squashing activation function was applied in the computation between the primary capsule layer and the regression capsule layer.
where is the vector output of capsule , and is the total output.
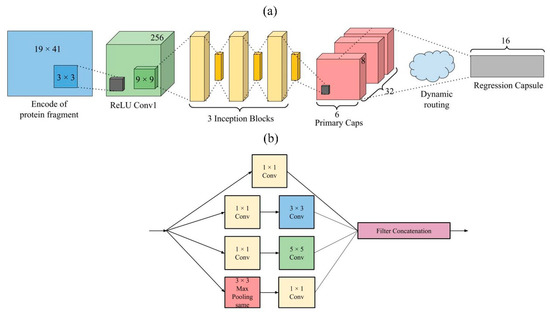
Figure 3.
(a). TMP-SSurface design. (b). An inception block in TMP-SSurface.
3.5. From Capsule Length to rASA
According to Sabour et al., the length of the output vector of a capsule indicates the probability that the current input belongs to the entity represented by the capsule [51]. The length of the capsule can be used to assess the prediction confidence: The longer the capsule, the more confident the predicted result will be [31]. In this study, the length of the vector of the positive capsule in the last layer could be used to describe the probability of the input residue exposed to the environment. According to the statistics, we found that the rASA was correlated with but could not be expressed directly by the capsule length. An exponential function was used to fit the capsule length and rASA:
where is the predicted rASA of the current input residue, and represents the corresponding capsule length. The value of the exponent was obtained by experiments.
3.6. Performance Evaluation
To quantitatively evaluate the proposed predictor TMP-SSurface, two measurements that are widely used for the rASA prediction method were adopted in this study: mean absolute error (MAE) and Pearson correlation coefficients (CC). MAE was used to measure the average deviation between the predicted and observed rASA values of all residues. MAE value ranged in [0, 1], the smaller the MAE value, the better the prediction performance. CC was used to measure the linear correlation between predicted and observed rASA value. CC value ranged in [−1, 1], where –1 represents a totally negative correlation, 1 totally positive correlation, and 0 totally no correlation. MAE and CC could be calculated by formulas:
where represents the number of residues. and represent the observed and predicted rASA value of the ith residue, and and represent the corresponding mean value.
4. Conclusions
In this study, we proposed a sequence-based rASA predictor for the full sequence of all type of TMPs, called TMP-SSurface. To make the predictor as simple as possible while ensuring the prediction performance, only one-hot code and PSSM were used as the input features of a deep learning-based predictor. The experimental result proved the usefulness of these features, suggesting that sequence encode and evolution information could illuminate the characteristics of a surface structure. Besides, a deep learning-based method had verified the ability to mining the information of protein structure from the most simple and basic sequence information. TMP-SSurface did not have any restriction: it could predict the whole sequence of any kind of TMP with any length. The predicted rASA could be used for further researches of TMPs, such as structure analysis, TMP-ligand binding prediction, and TMP function identification.
Supplementary Materials
The following are available online at https://www.mdpi.com/2073-4352/9/12/640/s1, Data sets used in the experiments.
Author Contributions
C.L. and Z.L. conceived the idea of this research, collected the data, implemented the predictor, developed the webserver, and wrote the manuscript. B.K. and Y.G. tuned the model and tested the predictor. Z.M. and H.W. supervised the research and reviewed the manuscript.
Funding
This work is supported by the National Natural Science Funds of China (No. 81671328, 61802057), the Jilin Scientific and Technological Development Program (No. 20180414006GH, 20180520028JH, 20170520058JH), and The Science and Technology Research Project of the Education Department of Jilin Province (No. JJKH20190290KJ, JJKH20191309KJ), and the Fundamental Research Funds for the Central Universities.
Conflicts of Interest
The authors declare no conflict of interest.
References
- Puder, S.; Fischer, T.; Mierke, C.T. The transmembrane protein fibrocystin/polyductin regulates cell mechanics and cell motility. Phys. Biol. 2019, 16, 066006. [Google Scholar] [CrossRef] [PubMed]
- He, L.; Cohen, E.B.; Edwards, A.P.B.; Xavier-Ferrucio, J.; Bugge, K.; Federman, R.S.; Absher, D.; Myers, R.M.; Kragelund, B.B.; Krause, D.S.; et al. Transmembrane Protein Aptamer Induces Cooperative Signaling by the EPO Receptor and the Cytokine Receptor beta-Common Subunit. Iscience 2019, 17, 167–181. [Google Scholar] [CrossRef] [PubMed]
- Oguro, A.; Imaoka, S. Thioredoxin-related transmembrane protein 2 (TMX2) regulates the Ran protein gradient and importin-beta-dependent nuclear cargo transport. Sci. Rep. 2019, 9, 15296. [Google Scholar] [CrossRef] [PubMed]
- Rafi, S.K.; Fernandez-Jaen, A.; Alvarez, S.; Nadeau, O.W.; Butler, M.G. High Functioning Autism with Missense Mutations in Synaptotagmin-Like Protein 4 (SYTL4) and Transmembrane Protein 187 (TMEM187) Genes: SYTL4- Protein Modeling, Protein-Protein Interaction, Expression Profiling and MicroRNA Studies. Int. J. Mol. Sci. 2019, 20, 3358. [Google Scholar] [CrossRef] [PubMed]
- Weihong, C.; Bin, C.; Jianfeng, Y. Transmembrane protein 126B protects against high fat diet (HFD)-induced renal injury by suppressing dyslipidemia via inhibition of ROS. Biochem. Biophys. Res. Commun. 2019, 509, 40–47. [Google Scholar] [CrossRef]
- Tanabe, Y.; Taira, T.; Shimotake, A.; Inoue, T.; Awaya, T.; Kato, T.; Kuzuya, A.; Ikeda, A.; Takahashi, R. An adult female with proline-rich transmembrane protein 2 related paroxysmal disorders manifesting paroxysmal kinesigenic choreoathetosis and epileptic seizures. Rinsho Shinkeigaku 2019, 59, 144–148. [Google Scholar] [CrossRef][Green Version]
- Moon, Y.H.; Lim, W.; Jeong, B.C. Transmembrane protein 64 modulates prostate tumor progression by regulating Wnt3a secretion. Oncol. Lett. 2019, 18, 283–290. [Google Scholar] [CrossRef]
- Tao, D.; Liang, J.; Pan, Y.; Zhou, Y.; Feng, Y.; Zhang, L.; Xu, J.; Wang, H.; He, P.; Yao, J.; et al. In Vitro and In Vivo Study on the Effect of Lysosome-associated Protein Transmembrane 4 Beta on the Progression of Breast Cancer. J. Breast Cancer. 2019, 22, 375–386. [Google Scholar] [CrossRef]
- Yan, J.; Jiang, Y.; Lu, J.; Wu, J.; Zhang, M. Inhibiting of Proliferation, Migration, and Invasion in Lung Cancer Induced by Silencing Interferon-Induced Transmembrane Protein 1 (IFITM1). Biomed. Res. Int. 2019, 2019, 9085435. [Google Scholar] [CrossRef]
- Rosenbaum, D.M.; Rasmussen, S.G.; Kobilka, B.K. The structure and function of G-protein-coupled receptors. Nature 2009, 459, 356–363. [Google Scholar] [CrossRef]
- Lu, C.; Liu, Z.; Zhang, E.; He, F.; Ma, Z.; Wang, H. MPLs-Pred: Predicting Membrane Protein-Ligand Binding Sites Using Hybrid Sequence-Based Features and Ligand-Specific Models. Int. J. Mol. Sci. 2019, 20, 3120. [Google Scholar] [CrossRef] [PubMed]
- Tarafder, S.; Toukir Ahmed, M.; Iqbal, S.; Tamjidul Hoque, M.; Sohel Rahman, M. RBSURFpred: Modeling protein accessible surface area in real and binary space using regularized and optimized regression. J. Biol. 2018, 441, 44–57. [Google Scholar] [CrossRef] [PubMed]
- Zhang, J.; Chai, H. Recent In Silico Research in High-Throughput Drug Discovery and Molecular Biochemistry. Curr. Top. Med. Chem. 2019, 19, 103–104. [Google Scholar] [CrossRef] [PubMed]
- Beuming, T.; Weinstein, H. A knowledge-based scale for the analysis and prediction of buried and exposed faces of transmembrane domain proteins. Bioinformatics 2004, 20, 1822–1835. [Google Scholar] [CrossRef][Green Version]
- Park, Y.; Hayat, S.; Helms, V. Prediction of the burial status of transmembrane residues of helical membrane proteins. BMC Bioinform. 2007, 8, 302. [Google Scholar] [CrossRef]
- Wang, C.; Li, S.; Xi, L.; Liu, H.; Yao, X. Accurate prediction of the burial status of transmembrane residues of alpha-helix membrane protein by incorporating the structural and physicochemical features. Amino Acids 2011, 40, 991–1002. [Google Scholar] [CrossRef]
- Lai, J.S.; Cheng, C.W.; Lo, A.; Sung, T.Y.; Hsu, W.L. Lipid exposure prediction enhances the inference of rotational angles of transmembrane helices. BMC Bioinform. 2013, 14, 304. [Google Scholar] [CrossRef]
- Yuan, Z.; Zhang, F.; Davis, M.J.; Boden, M.; Teasdale, R.D. Predicting the solvent accessibility of transmembrane residues from protein sequence. J. Proteome Res. 2006, 5, 1063–1070. [Google Scholar] [CrossRef]
- Illergard, K.; Callegari, S.; Elofsson, A. MPRAP: An accessibility predictor for a-helical transmembrane proteins that performs well inside and outside the membrane. BMC Bioinform. 2010, 11, 333. [Google Scholar] [CrossRef]
- Wang, C.; Xi, L.; Li, S.; Liu, H.; Yao, X. A sequence-based computational model for the prediction of the solvent accessible surface area for alpha-helix and beta-barrel transmembrane residues. J. Comput. Chem. 2012, 33, 11–17. [Google Scholar] [CrossRef]
- Xiao, F.; Shen, H.B. Prediction Enhancement of Residue Real-Value Relative Accessible Surface Area in Transmembrane Helical Proteins by Solving the Output Preference Problem of Machine Learning-Based Predictors. J. Chem. Inf. Model. 2015, 55, 2464–2474. [Google Scholar] [CrossRef] [PubMed]
- Yin, X.; Yang, J.; Xiao, F.; Yang, Y.; Shen, H.B. MemBrain: An Easy-to-Use Online Webserver for Transmembrane Protein Structure Prediction. Nano Micro Lett. 2018, 10, 2. [Google Scholar] [CrossRef] [PubMed]
- Wei, L.; Tang, J.; Zou, Q. Local-DPP: An improved DNA-binding protein prediction method by exploring local evolutionary information. Inf. Sci. 2017, 384, 135–144. [Google Scholar] [CrossRef]
- Wei, L.; Liao, M.; Gao, X.; Zou, Q. An Improved Protein Structural Classes Prediction Method by Incorporating Both Sequence and Structure Information. IEEE Trans. Nanobiosci. 2015, 14, 339–349. [Google Scholar] [CrossRef] [PubMed]
- Zhu, X.J.; Feng, C.Q.; Lai, H.Y.; Chen, W.; Lin, H. Predicting protein structural classes for low-similarity sequences by evaluating different features. Knowl. Based Syst. 2019, 163, 787–793. [Google Scholar] [CrossRef]
- Yang, W.; Zhu, X.J.; Huang, J.; Ding, H.; Lin, H. A brief survey of machine learning methods in protein sub-Golgi localization. Curr. Bioinform. 2019, 14, 234–240. [Google Scholar] [CrossRef]
- Tan, J.X.; Li, S.H.; Zhang, Z.M.; Chen, C.X.; Chen, W.; Tang, H.; Lin, H. Identification of hormone binding proteins based on machine learning methods. Math. Biosci. Eng. 2019, 16, 2466–2480. [Google Scholar] [CrossRef]
- Zou, Q.; Xing, P.; Wei, L.; Liu, B. Gene2vec: Gene Subsequence Embedding for Prediction of Mammalian N6-Methyladenosine Sites from mRNA. RNA 2019, 25, 205–218. [Google Scholar] [CrossRef]
- Lv, Z.B.; Ao, C.Y.; Zou, Q. Protein Function Prediction: From Traditional Classifier to Deep Learning. Proteomics 2019, 19, 2. [Google Scholar] [CrossRef]
- Peng, L.; Peng, M.M.; Liao, B.; Huang, G.H.; Li, W.B.; Xie, D.F. The Advances and Challenges of Deep Learning Application in Biological Big Data Processing. Curr. Bioinform. 2018, 13, 352–359. [Google Scholar] [CrossRef]
- Fang, C.; Shang, Y.; Xu, D. Improving Protein Gamma-Turn Prediction Using Inception Capsule Networks. Sci. Rep. 2018, 8, 15741. [Google Scholar] [CrossRef] [PubMed]
- Kozma, D.; Simon, I.; Tusnady, G.E. PDBTM: Protein Data Bank of transmembrane proteins after 8 years. Nucleic Acids Res. 2013, 41, D524–D529. [Google Scholar] [CrossRef] [PubMed]
- Huang, Y.; Niu, B.; Gao, Y.; Fu, L.; Li, W. CD-HIT Suite: A web server for clustering and comparing biological sequences. Bioinformatics 2010, 26, 680–682. [Google Scholar] [CrossRef] [PubMed]
- Fenalti, G.; Giguere, P.M.; Katritch, V.; Huang, X.P.; Thompson, A.A.; Cherezov, V.; Roth, B.L.; Stevens, R.C. Molecular control of delta-opioid receptor signalling. Nature 2014, 506, 191–196. [Google Scholar] [CrossRef] [PubMed]
- Kabsch, W.; Sander, C. Dictionary of protein secondary structure: Pattern recognition of hydrogen-bonded and geometrical features. Biopolymers 1983, 22, 2577–2637. [Google Scholar] [CrossRef]
- Berman, H.M.; Westbrook, J.; Feng, Z.; Gilliland, G.; Bhat, T.N.; Weissig, H.; Shindyalov, I.N.; Bourne, P.E. The Protein Data Bank. Nucleic Acids Res. 2000, 28, 235–242. [Google Scholar] [CrossRef]
- Mihel, J.; Sikic, M.; Tomic, S.; Jeren, B.; Vlahovicek, K. PSAIA-protein structure and interaction analyzer. BMC Struct. Biol. 2008, 8, 21. [Google Scholar] [CrossRef]
- Lee, B.; Richards, F.M. The interpretation of protein structures: Estimation of static accessibility. J Mol Biol 1971, 55, 379–400. [Google Scholar] [CrossRef]
- Tien, M.Z.; Meyer, A.G.; Sydykova, D.K.; Spielman, S.J.; Wilke, C.O. Maximum allowed solvent accessibilites of residues in proteins. PLoS ONE 2013, 8, e80635. [Google Scholar] [CrossRef]
- Rose, G.D.; Geselowitz, A.R.; Lesser, G.J.; Lee, R.H.; Zehfus, M.H. Hydrophobicity of amino acid residues in globular proteins. Science 1985, 229, 834–838. [Google Scholar] [CrossRef]
- Miller, S.; Janin, J.; Lesk, A.M.; Chothia, C. Interior and surface of monomeric proteins. J. Mol. Biol. 1987, 196, 641–656. [Google Scholar] [CrossRef]
- Sun, P.; Ju, H.; Liu, Z.; Ning, Q.; Zhang, J.; Zhao, X.; Huang, Y.; Ma, Z.; Li, Y. Bioinformatics resources and tools for conformational B-cell epitope prediction. Comput. Math. Methods Med. 2013, 2013, 943636. [Google Scholar] [CrossRef]
- He, F.; Wang, R.; Li, J.; Bao, L.; Xu, D.; Zhao, X. Large-scale prediction of protein ubiquitination sites using a multimodal deep architecture. BMC Syst. Biol. 2018, 12, 109. [Google Scholar] [CrossRef]
- Ding, H.; Li, D. Identification of mitochondrial proteins of malaria parasite using analysis of variance. Amino Acids 2015, 47, 329–333. [Google Scholar] [CrossRef]
- Ding, H.; Deng, E.Z.; Yuan, L.F.; Liu, L.; Lin, H.; Chen, W.; Chou, K.C. iCTX-type: A sequence-based predictor for identifying the types of conotoxins in targeting ion channels. Biomed. Res. Int. 2014, 2014, 286419. [Google Scholar] [CrossRef]
- Jeong, J.C.; Lin, X.; Chen, X.W. On position-specific scoring matrix for protein function prediction. IEEE ACM Trans. Comput. Biol. Bioinform. 2011, 8, 308–315. [Google Scholar] [CrossRef]
- Zeng, B.; Honigschmid, P.; Frishman, D. Residue co-evolution helps predict interaction sites in alpha-helical membrane proteins. J. Struct. Biol. 2019, 206, 156–169. [Google Scholar] [CrossRef]
- Zhang, J.; Zhang, Y.; Ma, Z. In silico Prediction of Human Secretory Proteins in Plasma Based on Discrete Firefly Optimization and Application to Cancer Biomarkers Identification. Front. Genet. 2019, 10, 542. [Google Scholar] [CrossRef]
- Zangooei, M.H.; Jalili, S. Protein secondary structure prediction using DWKF based on SVR-NSGAII. Neurocomputing 2012, 94, 87–101. [Google Scholar] [CrossRef]
- Altschul, S.F.; Madden, T.L.; Schaffer, A.A.; Zhang, J.; Zhang, Z.; Miller, W.; Lipman, D.J. Gapped BLAST and PSI-BLAST: A new generation of protein database search programs. Nucleic Acids Res. 1997, 25, 3389–3402. [Google Scholar] [CrossRef]
- Sabour, S.; Frosst, N.; Hinton, G.E. Dynamic Routing Between Capsules. Adv. Neural Inf. Process. Syst. 2017, 30, 3856–3866. [Google Scholar]


© 2019 by the authors. Licensee MDPI, Basel, Switzerland. This article is an open access article distributed under the terms and conditions of the Creative Commons Attribution (CC BY) license (http://creativecommons.org/licenses/by/4.0/).