Article

Multi-Step Concanavalin A Phase Separation and Early-Stage Nucleation Monitored Via Dynamic and Depolarized Light Scattering

by
Hévila Brognaro
1,*,
Sven Falke
2,3,
Celestin Nzanzu Mudogo
2 and
Christian Betzel
2,3
1
Center for Free-Electron Laser Science (CFEL), Deutsches Elektronen-Synchrotron (DESY), 22607 Hamburg, Germany
2
Institute of Biochemistry and Molecular Biology, Laboratory for Structural Biology of Infection and Inflammation, University of Hamburg, c/o DESY. Build. 22a, Notkestrasse 85, 22607 Hamburg, Germany
3
The Hamburg Centre for Ultrafast Imaging, 22607 Hamburg, Germany
*
Author to whom correspondence should be addressed.
Crystals 2019, 9(12), 620; https://doi.org/10.3390/cryst9120620
Submission received: 5 September 2019 / Revised: 20 November 2019 / Accepted: 22 November 2019 / Published: 26 November 2019

Abstract

:
Protein phase separation and protein liquid cluster formation have been observed and analysed in protein crystallization experiments and, in recent years, have been reported more frequently, especially in studies related to membraneless organelles and protein cluster formation in cells. A detailed understanding about the phase separation process preceding liquid dense cluster formation will elucidate what has, so far, been poorly understood—despite intracellular crowding and phase separation being very common processes—and will also provide more insights into the early events of in vitro protein crystallization. In this context, the phase separation and crystallization kinetics of concanavalin A were analysed in detail, which applies simultaneous dynamic light scattering and depolarized dynamic light scattering to obtain insights into metastable intermediate states between the soluble phase and the crystalline form. A multi-step mechanism was identified for ConA phase separation, according to the resultant ACF decay, acquired after an increase in the concentration of the crowding agent until a metastable ConA gel intermediate between the soluble and final crystalline phases was observed. The obtained results also revealed that ConA is trapped in a macromolecular network due to short-range intermolecular protein interactions and is unable to transform back into a non-ergodic solution.

Graphical Abstract

1. Introduction

Phase separation/liquid–liquid phase separation (LLPS) phenomena have been widely discussed in recent years [1,2,3], particularly due to the advances in microscopy technologies. The phenomenon has been observed and is considered in a number of chemical and biological processes, such as biochemical transport, biomineralization [4], in the context of several human diseases [5,6], in industrial food production [7], pharmaceutical processes [8], structural genomics [9], and protein crystallization [10,11]. Thus, the understanding of colloidal/biological molecule aggregation can also support the identification of chemico-physical key determinants in LLPS prior to the crystal nucleation process.
In an early stage of protein crystal nucleation, a liquid dense phase is formed in a supersaturated environment. The phase transition results in metastable or stable equilibrated dense liquid clusters consisting of locally concentrated particles enriched in protein and able to separate into protein gel, liquid–liquid phase, or crystals, depending on whether the energy barrier between the supersaturated solution and the final stage can be overcome by the strength of intermolecular interactions within the protein clusters [2,12,13].
The kinetics of phase separation is determined by the location in the phase diagram where the phase boundary state will define the order of the transition and, thereby, the physical transport mechanism will induce the occurrence and the specific rates of growth, nucleation, and/or coarsening processes [14]. One of the central concepts used to classify and understand phase separation kinetics is the dynamic scaling law, which presupposes that domain kinetics are controlled by a single emergent length scale R within a given dynamic scaling regime [15,16]. Thus, the morphology with a size R at time t1 is statistically equivalent to the morphology within a region of size R (t2/t1)n at time t2, where n is the dynamic scaling exponent. Thereby, the evolution of the droplet size distribution over time (R = ktn) predicates a power law dependence on time (n) and a prefactor (k), both of which are valuable coefficients that support the identification of specific growth/coarsening mechanisms involved in the cluster formation [14]. A well-known example supporting the theory is the dynamics of Ostwald ripening, which is a first-order phase transition. Within Oswald ripening, small clusters of a suspension become less stable, dissolve, and release their mass and molecules to the solution, which will be taken up by the larger clusters with a power law exponent of around 0.333 for diffusion-limited and 0.667 for surface-controlled mechanisms [17]. Thermodynamics and kinetics of cluster formation have been studied for different proteins at different growth conditions by applying complementary biophysical techniques [2,13,18,19,20,21,22].
Dynamic light scattering (DLS) is a common technique applied to investigate protein solutions, as well as their dynamic behavior after modifications in the protein–solvent system [23]. DLS measurements allow for determining particle homogeneity and particle dimensions in a suspension by recording and evaluating the translational diffusion coefficient Dt. Furthermore, it is possible to detect and identify the presence of a depolarized component in the scattered light of a particle suspension by recording and evaluating the rotational diffusion coefficient Dr, by applying depolarized dynamic light scattering (DDLS). A combination of DLS and DDLS allows, beyond hydrodynamic radius calculation by determining the translational diffusion constant, to identify the presence of periodically ordered nanoparticles with birefringent properties and provides the ability to change the polarization plane of light, as well as to determine the shape of particles in the solution [24,25].
The solution-gel transitions of polymers and proteins has been studied by DLS. The technique shows a critical behavior in dynamics able to characterize the sol-gel phase transition by an appearance of non-exponential decay in the correlation functions, the presence of a power law for the time intensity correlation, and an abrupt increase in the scattered intensity [26,27,28,29]. The power behavior of molecules undergoing gelation is dependent on the gel network [30], where the same molecule can show different power law coefficients, according to the gelation reaction, where lower power behavior coefficient indicates weak tied networks while a higher power behavior coefficient indicates the presence of fractal aggregates [27].
A particular designed DLS and DDLS instrument was applied to investigate phase separation, liquid dense clusters (LDC) formation, and crystal nucleation of concanavalin A from Canavalia ensiformis (ConA). ConA is a lectin able to specifically bind to carbohydrates with internal and non-reducing terminal α-D-mannosyl and α-D-glucosyl moieties. In the context of the sugar binding specificity, ConA is a useful probe to investigate cell surfaces and cell division. Furthermore, ConA is able to selectively detect a diversity of viruses and pathogens [31,32]. The dynamics of the ConA aggregation process were assessed over time by monitoring the optical properties of ConA after adding polyethylene glycol 8000 (PEG8K) as a precipitating agent. The design of experiments (DOE) allied to the response surface methodology (RSM) are able to model and identify the individual and interactive effects of several processing conditions in a reduced number of experiments. The modelling enables the prediction of crucial parameters and supports the optimization of experimental conditions to achieve the desired optimal point in a multi-variable process assay [33]. This powerful statistical tool that is used to investigate the causes of process variation consists of: (i) identification of the independent variable and their levels, (ii) the selection of the experimental array and running of the experiments as designed, and (iii) the prediction, verification of the model, graphical representation, and determination of optimal process conditions, according to the desired optimal point [33,34]. The statistical technique has been applied as a strategy to investigate diverse operational [34,35,36], chemical [37,38,39], and biochemical processes [40,41].
Therefore, DLS and DDLS data obtained as a function of time from ConA experiments were combined with the response surface methodology (RSM) and allowed for the identification and scoring of the initial nucleation in the metastable liquid–liquid phase up to subsequent stages of ordering and formation of the crystalline material over time. The observed multi-stage clustering process is determined by the concentration of the crowding agent applied, since the range and the strength of attraction can be tuned by the molecular weight and concentrations of the agent [42]. PEG8k at 12% first guided the protein solution to an amorphous ConA dense liquid state up to a threshold time point, after which a supposed gelation was observed, according to the autocorrelation function (ACF) decay acquired and the power law behavior (n = 0.8) obtained from the growth of the hydrodynamic radius over time. Additionally, we could observe internal ordering in the clusters. Within internally ordered droplets, anisotropy was detected, which was most likely connected to an increase of periodic organization and interaction strength. Applying higher concentrations of the crowding agent resulted in a faster and more organized agglomeration, which can be explained by the excluded volume promoted by the crowding agent. Thus, in response to the reduced solution volume of ConA, the tertiary structure and, potentially, the secondary structure content of ConA changed and a crystal lattice was formed in the cluster cage.

2. Materials and Methods

For the entire series of complex experiments, a stable temperature of 20 °C was selected for preparation and processing of protein material and solvents. Furthermore, the DLS and DDLS instrument were stabilized at 20 °C. The circular dichroism (CD) experiments were also performed at 20 °C.

2.1. Response Surface Methodology (RSM) Using Central Composite and Full Factorial Designs

To assess the phase behavior of ConA, crystallization screening experiments were performed by applying micro-batch plates covered with Al oil (Hampton Research, Aliso Viejo, CA, USA). The first screening was performed with distinct protein concentrations and several different polyethylene glycols (PEG) as a crowding agent (CA). A Leica M205C microscope was utilized to visualize and monitor the phase separation. To analyse the ConA phase transition, PEG8K was identified as ideal CA within a concentration range of 6.4% to 17.6%, using a protein concentration of 5 mg∙mL−1 to follow the clustering process up to 12 min. Two complementary light scattering instruments (XtalConcepts, Hamburg, Germany) were used to identify variables that are essentially characterizing the ConA cluster formation. This included a conventional DLS system to monitor the particle dimensions and a particular designed DDLS instrument, which allows monitoring of the transition from disordered to ordered particles. Thereby, polyethylene glycol (PEG) concentration and time (independent variables) were strategically selected as the most significant variables inducing changes of the particle size distribution (hydrodynamic radius (nm)) of ConA and increasing the scattering signal intensities of DLS and DDLS (kHz), which were both assessed as the experimental responses (dependent variables).
A central composite design (CCD) was set up with a total of 11 experiments, among which eight assays assessed time and %PEG8K at high and low levels (coded +1, −1) and three central points (coded 0). A full factorial design was set up, which performed nine experiments, among which eight assessed the combination between high and low levels and one assessed the central point. All experimental conditions are described in Table 1, following design and nomenclature according to Denis Baş [33], and were performed in triplicate. ConA (Merck, 64293 Darmstadt, Germany) was solubilized in 10 mM sodium acetate pH 4.6 at 40 mg∙mL−1 and centrifuged for 1 h at 20,000× g. The designed experiments were analysed utilising the software Statistica, Inc. (55455 Minneapolis, MN, USA).
Statistical models for both responses/dependent variables including a hydrodynamic radius (nm) and DDLS scattering signal intensity (kHz), i.e., a measure of the number of scattered photons, were generated and judged by ANOVA (Analysis of variance) involving Fischer’s test (F test). The probability (p) and regression coefficient determined the models’ goodness of fit. The effects of the experimental duration and concentration of PEG8K on the size distribution and on the potential DDLS signal intensity presented during protein nucleation were analyzed by Pareto, a 3D response surface, and contour plots, which depicted the interactions graphically. The graphs’ coordinates show the coded values instead of actual values of %PEG and time.

2.2. Dynamic Light Scattering (DLS) and Depolarized Dynamic Light Scattering (DDLS)

All assays were performed applying a spectroscopy quartz glass cuvette (path length: 3 mm, Hellma Analytics, Germany) with a 40-µL final volume. For measurements taken over long durations, the cuvette was sealed with silicone and a glass cover slide. Prior to the experiments, the cuvette was washed with filtered water (0.1 µm filter) and dried before use. The DLS/DDLS instrument (XtalConcepts GmbH, 22525 Hamburg, Germany) was described previously by Schubert et al. in 2015 [43]. The autocorrelation functions (ACF) obtained for all assays were analyzed by applying the CONTIN algorithm [44] and the decay time constants of the DLS (translation diffusion, Dt) and DDLS data (rotational diffusion, Dr) were calculated independently via the Stokes−Einstein and Stokes−Einstein−Debye equations [43], respectively. The viscosity was considered and adjusted according to the percentage of CA solutions in all assays (Table 1) and the actual hydrodynamic radius was calculated accordingly. For the viscosity adjustment, DLS was measured with 100 nm polystyrene standard particles (Thermo Fisher Scientific, 28803 North Carolina, CA, USA) in water, in 10 mM sodium acetate at a pH of 4.6 and in each individual CA concentration prepared in buffer, to verify and consider changes resulting from different crowding agent solution viscosities.

2.3. Circular Dichroism

The secondary protein structure content was investigated comparatively by following the near-UV CD-spectra of ConA in buffer and then mixed with PEG8k for up to 10 min. Sample solutions were prepared in advance and immediately transferred to a 1-mm path length glass cuvette positioned inside a Jasco J-815 spectrometer (Jasco, 21601 Maryland, USA). For each sample, 10 spectra of the buffer and of the PEG solutions were recorded and averaged. The temperature for all measurements was adjusted to 20 °C using a Peltier element (Jasco, 21601 Maryland USA). Experiments were performed with a data point increment of 0.1 nm and a scanning speed of 100 nm × min-1.

3. Results

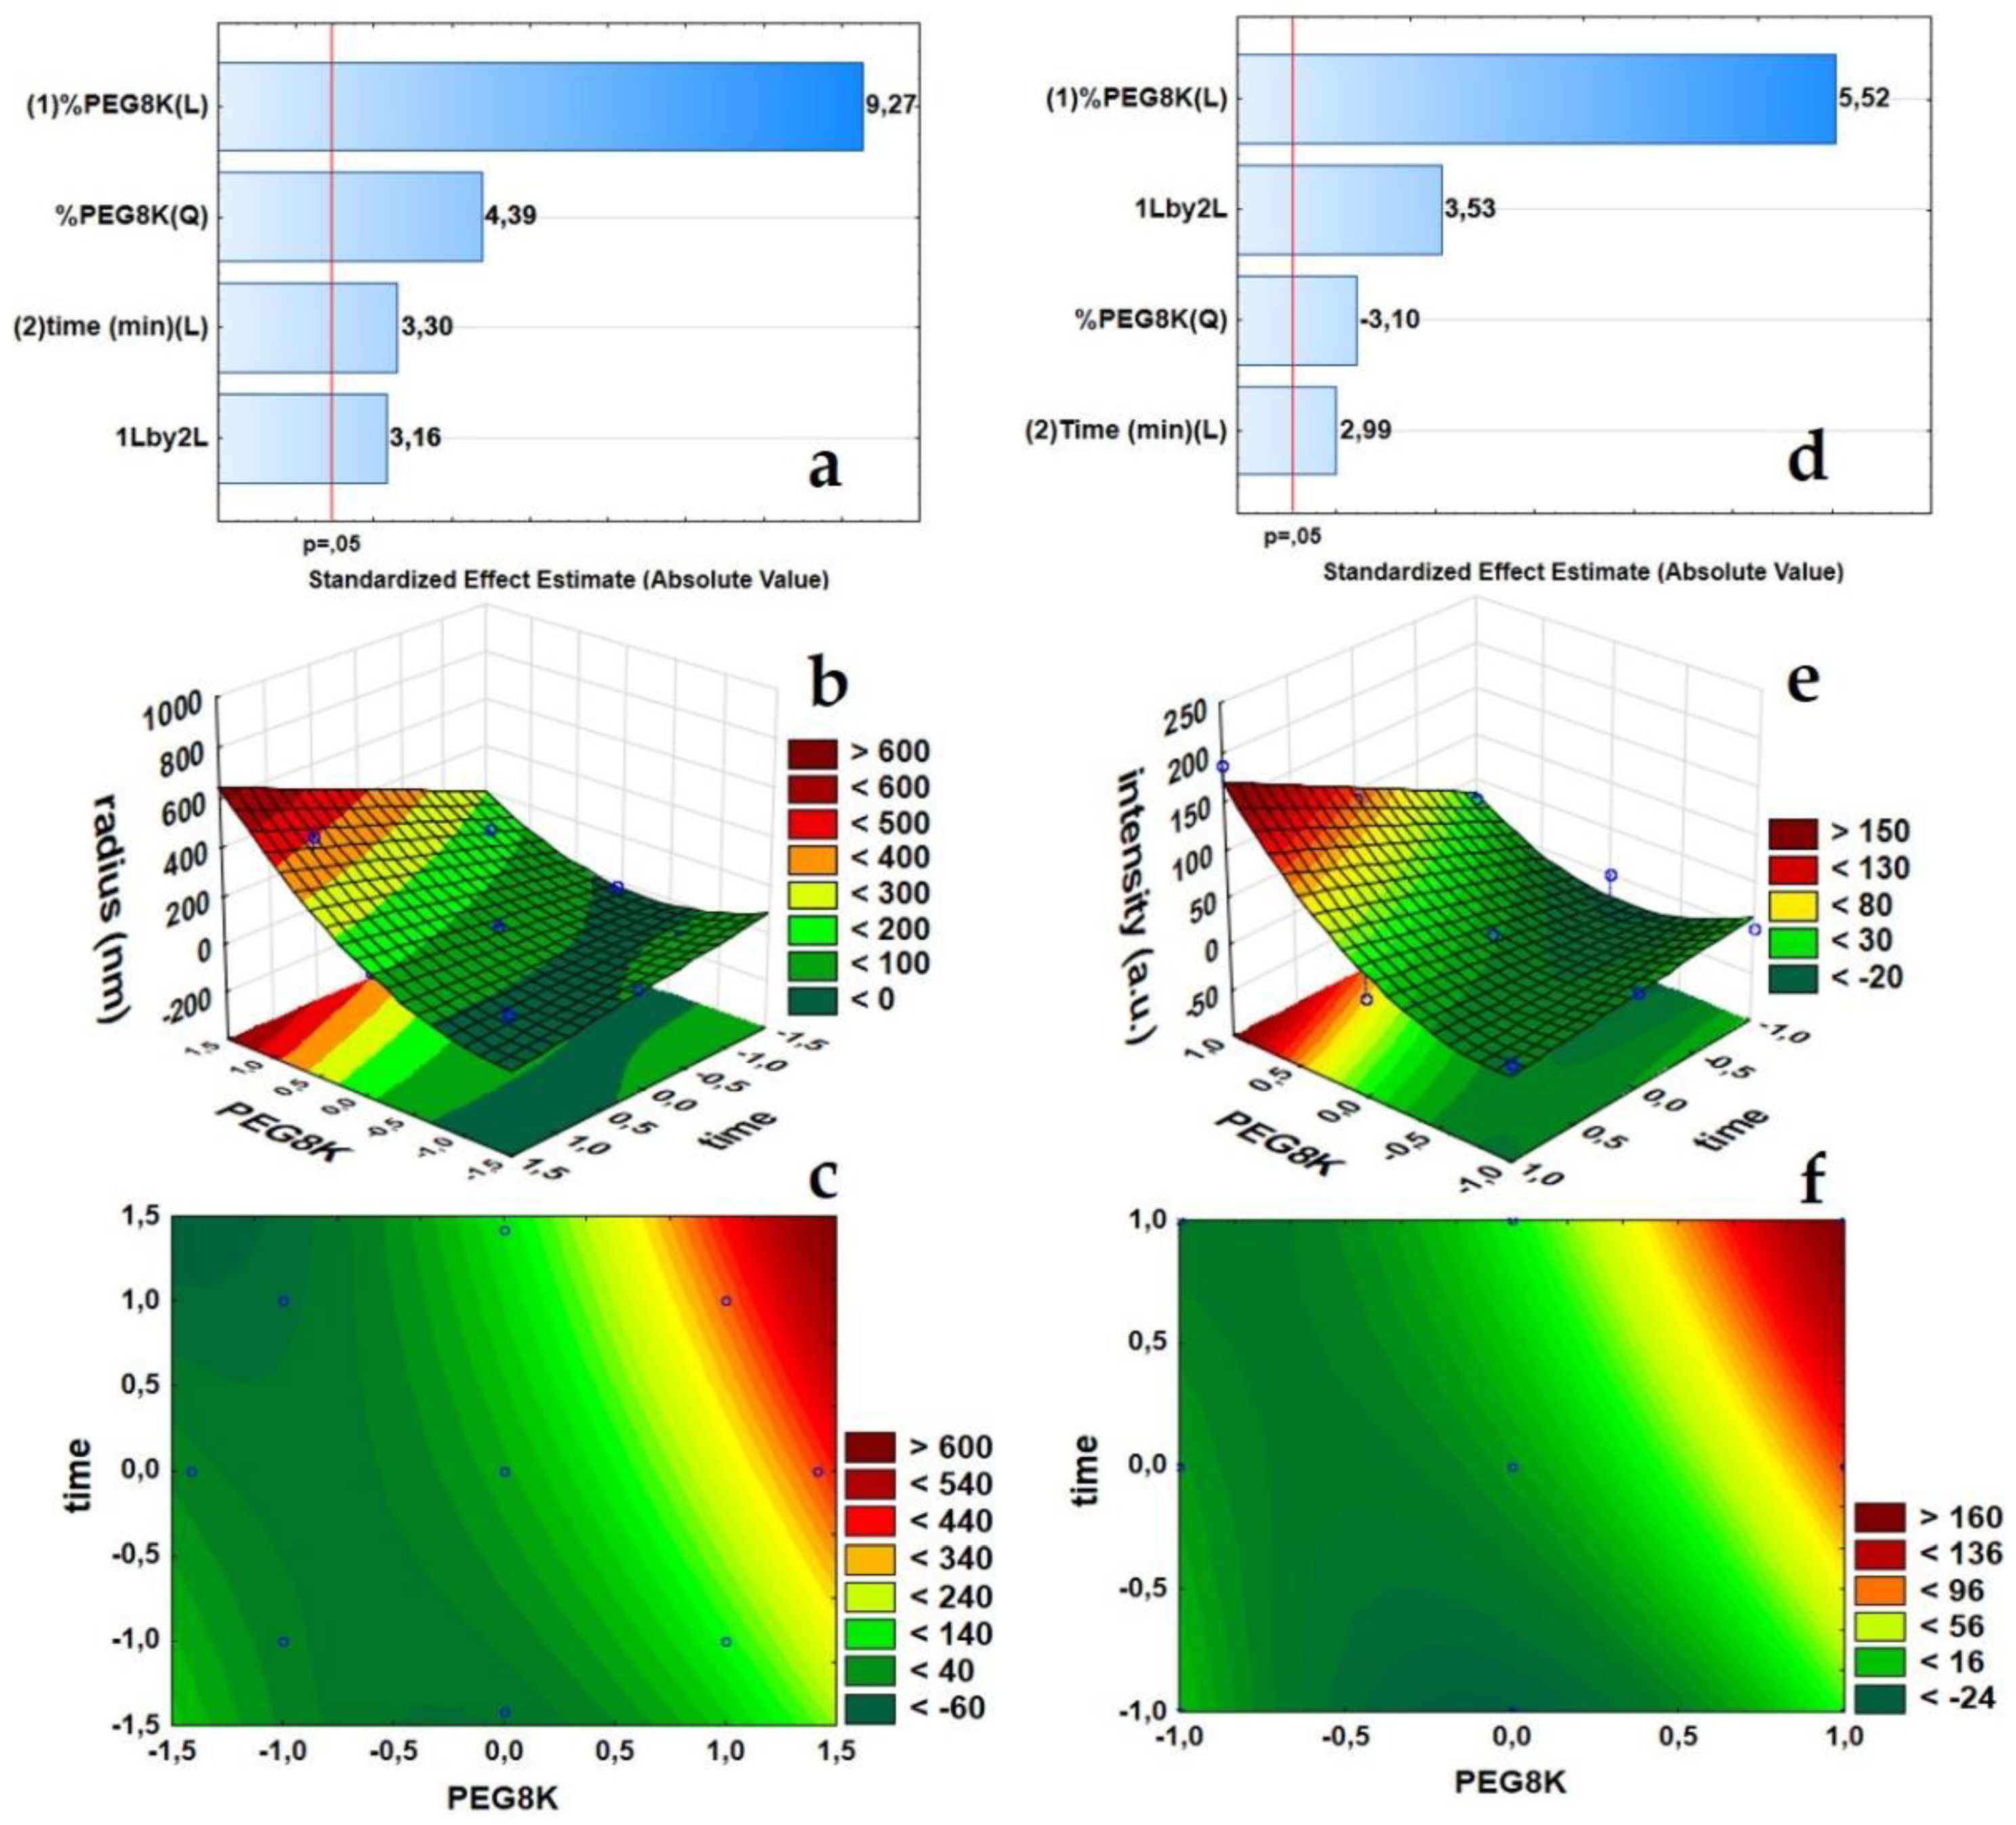
3.1. Optimization of ConA Cluster Formation

Screening experiments with PEGs indicated the potential of ConA and PEG8k to serve as a model system, which allows systematic investigations of protein cluster formation and follows crystal nucleation. In Figure 1a, a dense de-mixed phase is visualized, and obtained only after the addition of PEG8k with a final concentration of 12% (top). Optical microscopy allowed for the observation of µm-sized particles (lower panel).
To assess the cluster formation of ConA, two statistical experimental designs allowed for the decipher of the protein clustering process in one batch assay with 95% confidence. Pareto plots highlight the most important variables and their combined response, i.e., hydrodynamic radius and DDLS scattering intensity (Figure 2a,d, respectively). The bars and the respective positive effect number (9.27 and 5.52) indicate that the PEG8k concentration is the most influential factor on the ConA hydrodynamic radius distribution (Figure 2a), as it also induces the downstream molecular orientation and crystal nucleation of the protein molecules (Figure 2d).
The single variable “time” showed only a minor effect on the growth of ConA clusters and in the potential molecular ordering of ConA (respective effect numbers 3.30 and 2.99). However, the interaction of variables PEG8k(1) and time(2) (1Lby2L. showed in Pareto Plot), positively affected the DDLS scattering intensity (Figure 2d), which means that, with an increase of the PEG8k concentration, the structural orientation of the protein molecules within a shorter period of time is favoured, or simply, a higher PEG concentration allows for the clustering process to be induced in less time. A p value of less than 0.05 (p < 0.05) (ANOVA tables, Appendix A) showed a high significance of the variables and a good model fit to the hydrodynamic radius and DDLS scattering intensity responses with R2 values of 0.955 and 0.939, respectively. The coefficients indicate only 4.55% and 6.11% of the total variations are not explained by the models.
3D response surface plots (Figure 2b,e) and contour plots (Figure 2c,f) were prepared to determine an optimal combination of %PEG8k and reaction time to follow the protein clustering process without subsequent ripening of the clusters toward a solid crystalline phase. In other words, the models indicate the optimum crowding agent concentration and the appropriate reaction time to maintain the ConA clusters arrested in the metastable intermediate liquid phase, between the initial supersaturated solution and the final crystallization stage. For the 3D response surface plots, elliptical contour tie lines show the combinatory effect of PEG8k and time in a second-order model fit, which was also strongly indicated by Pareto plots (Figure 2a,d, (%PEG8K(Q) or quadratic order).

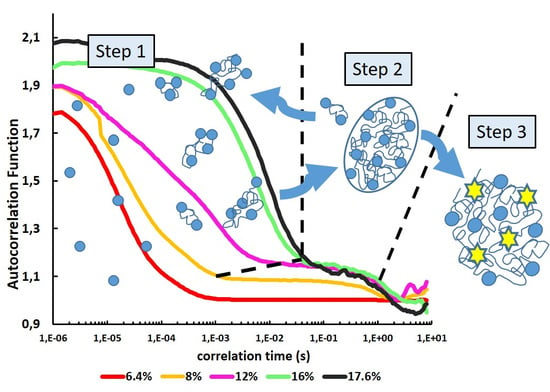
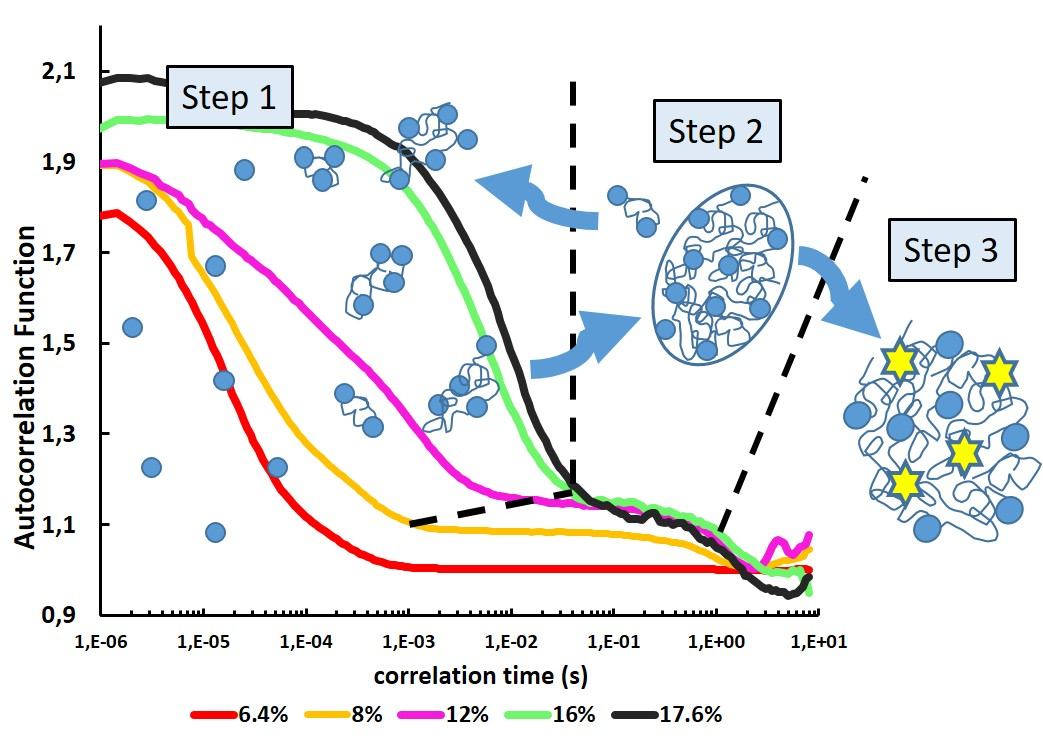
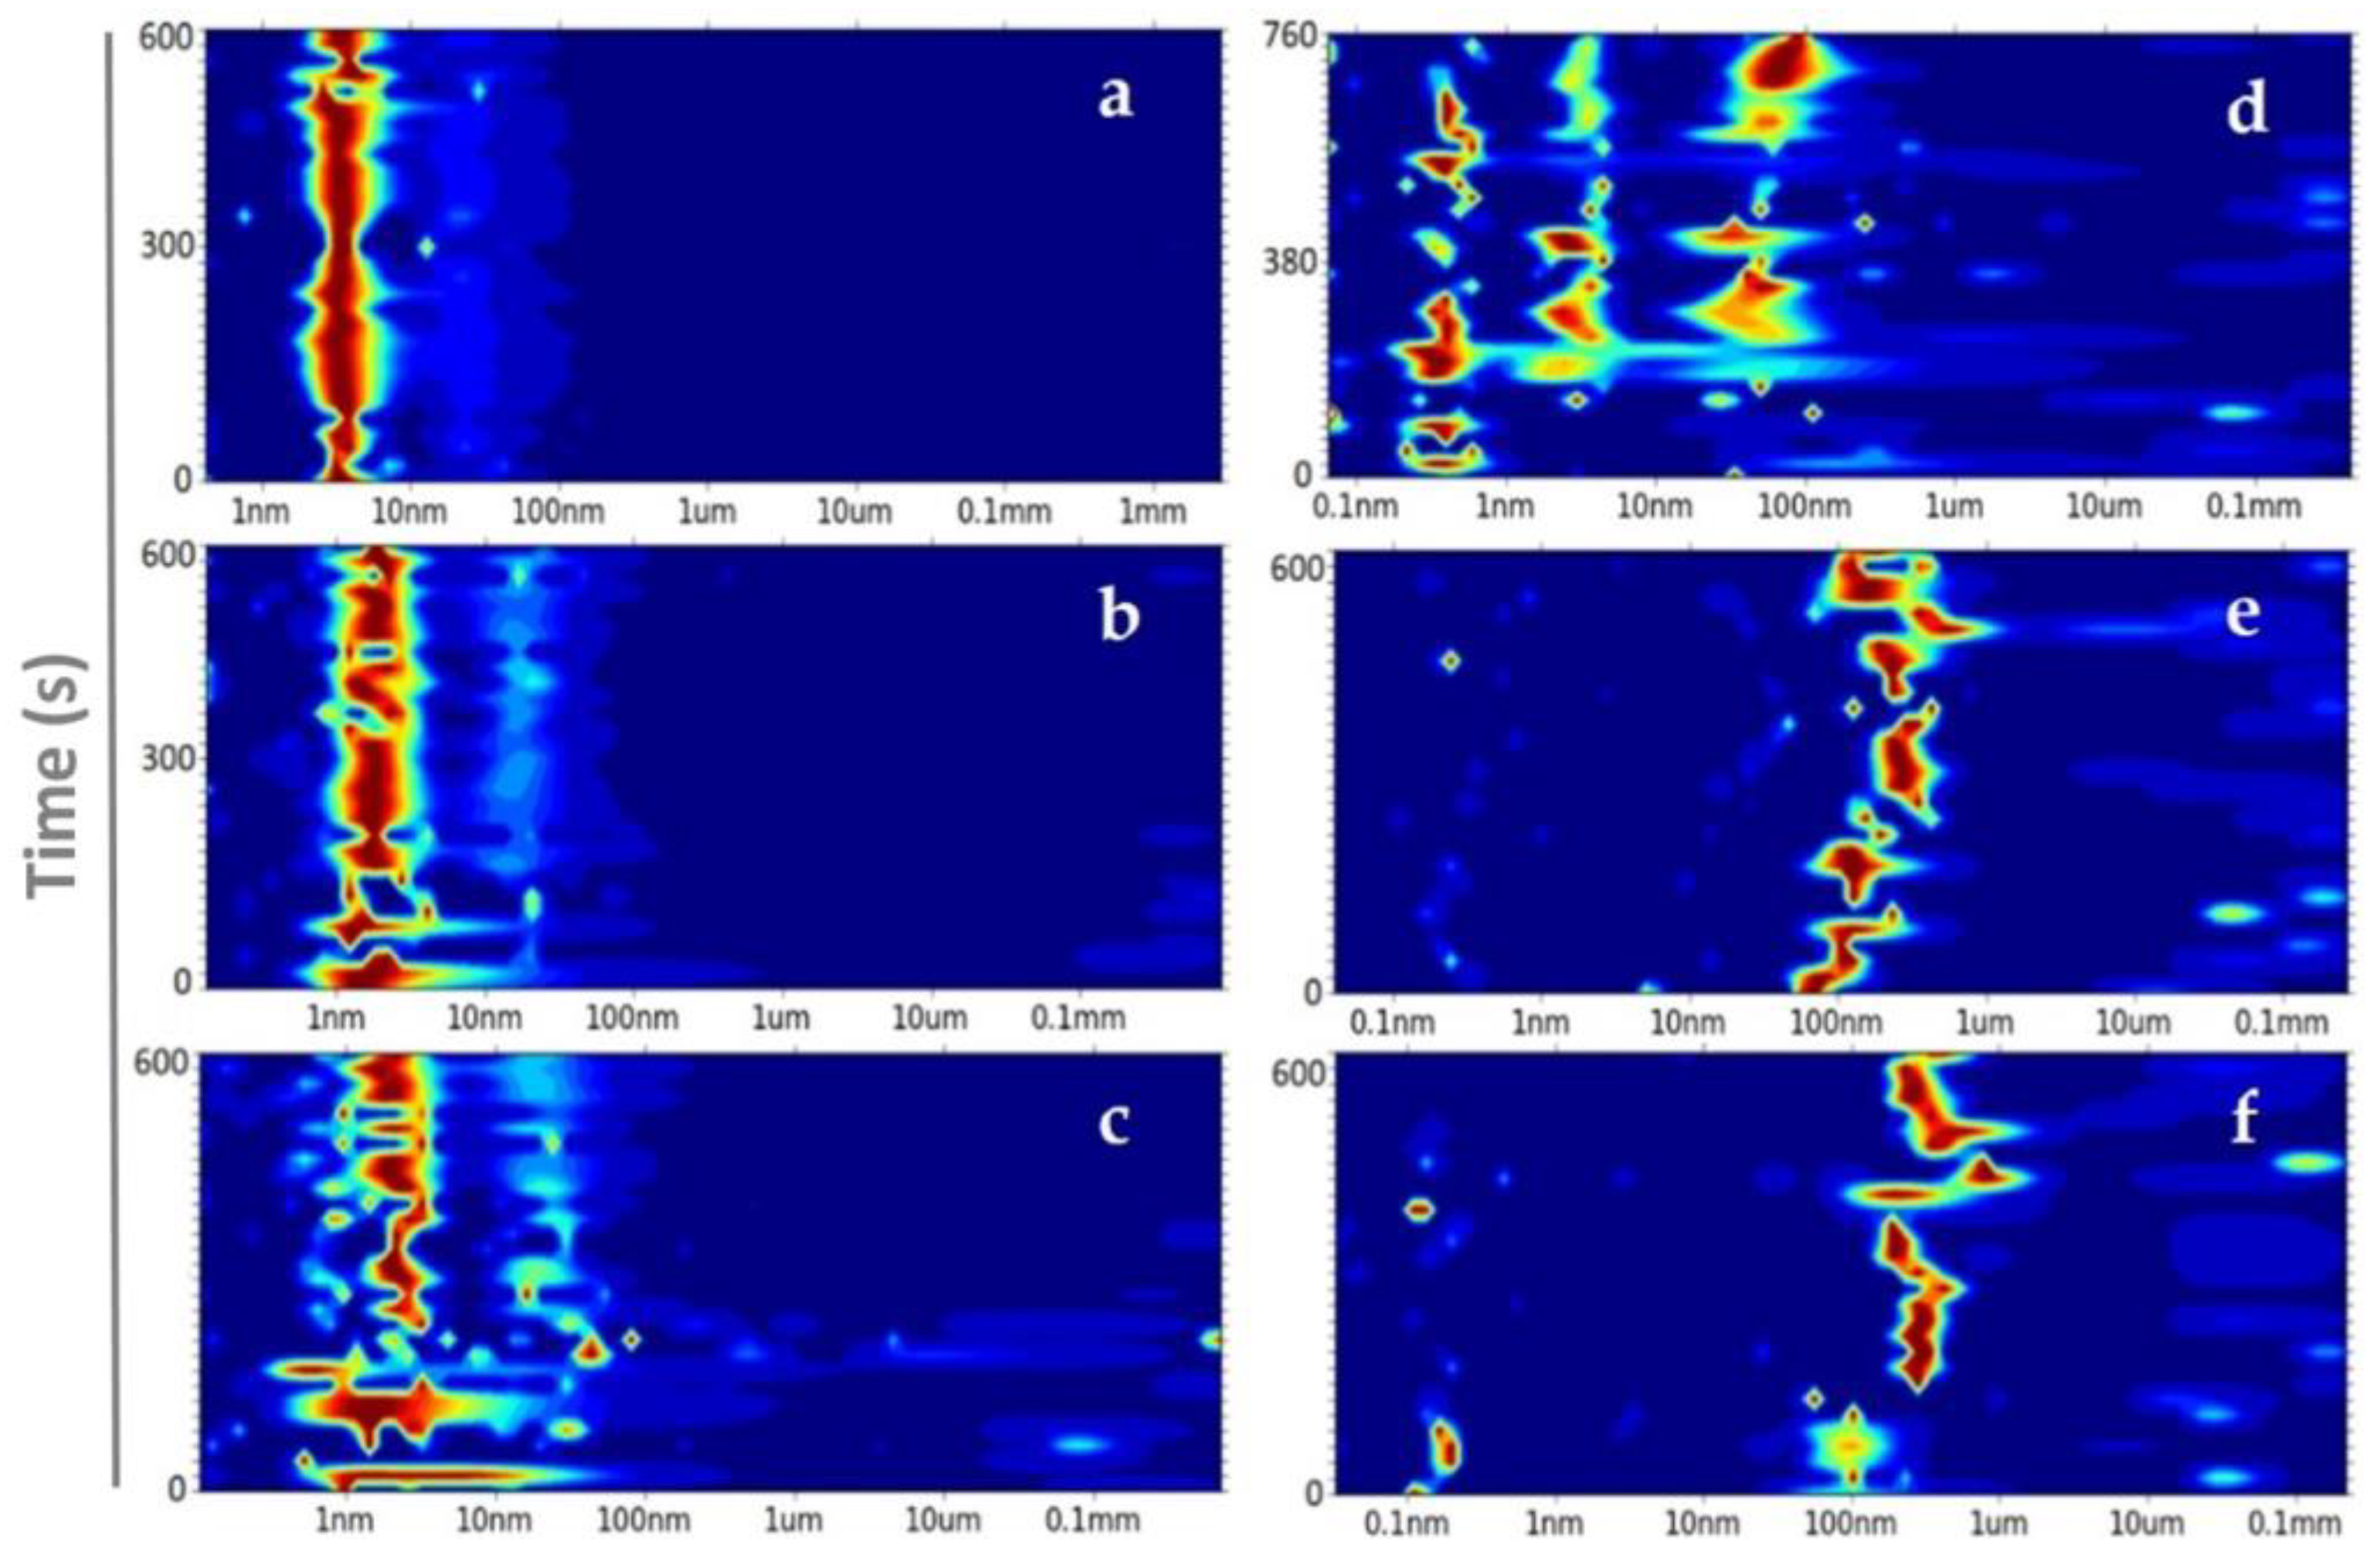
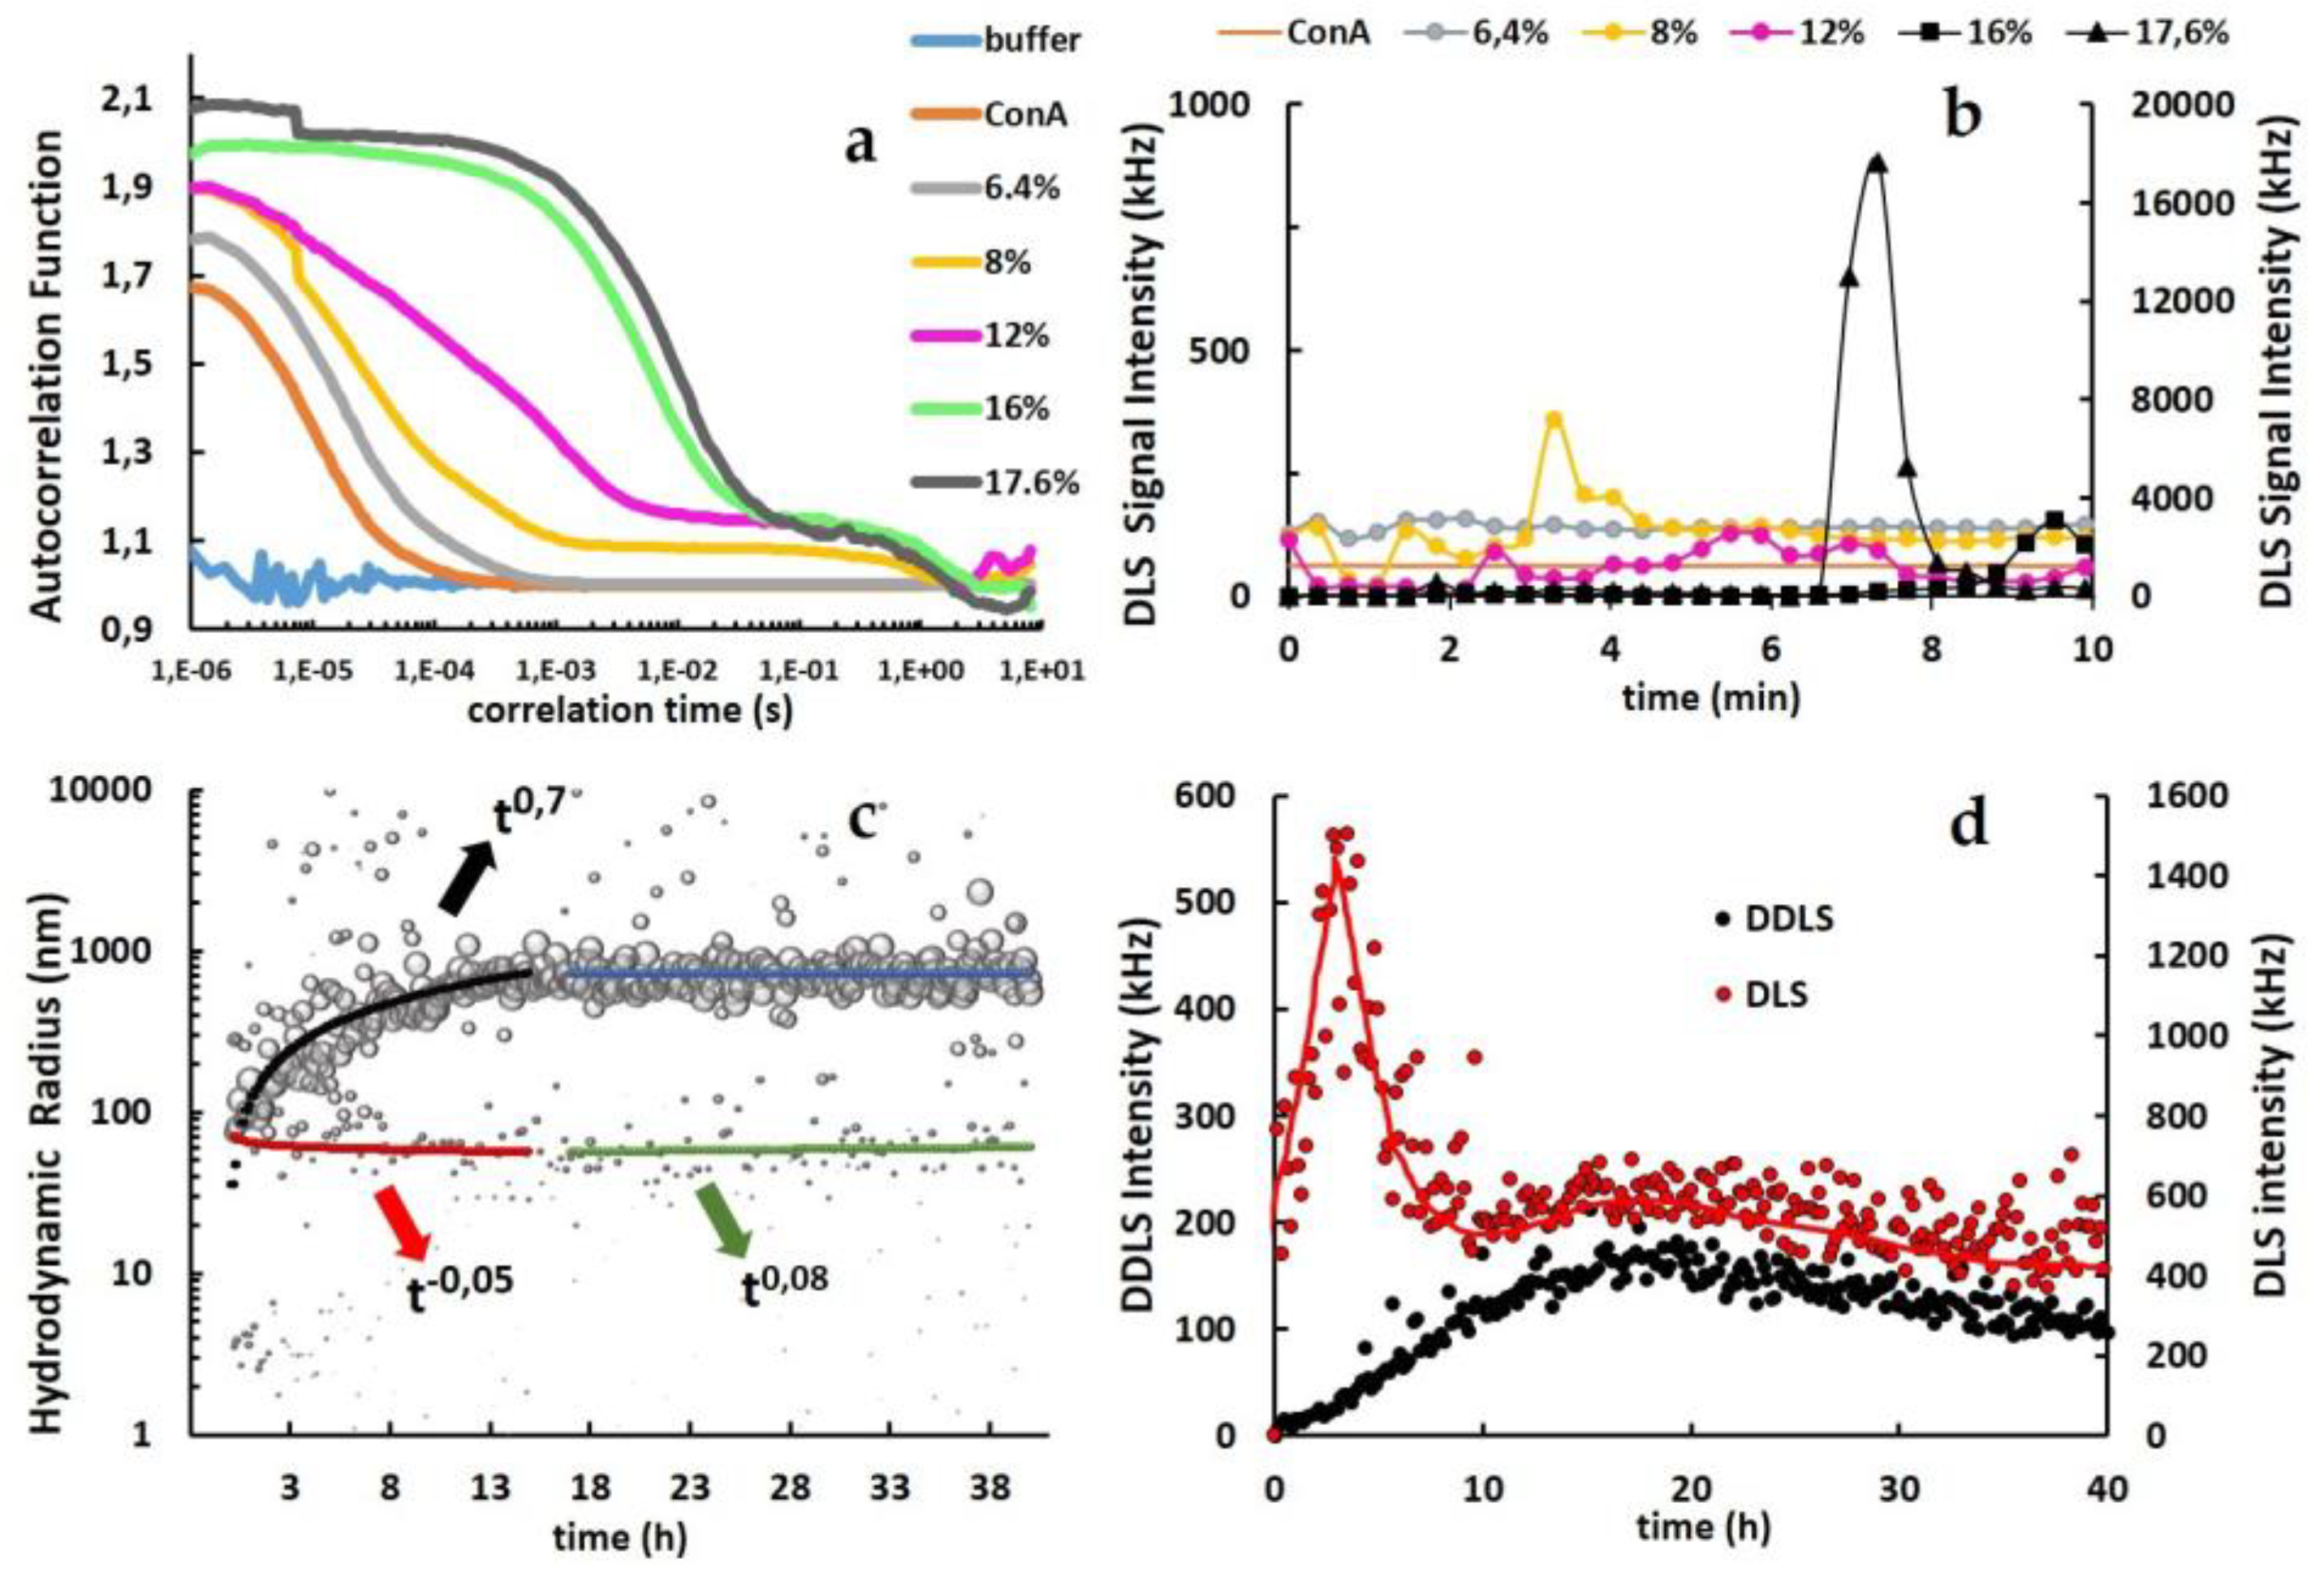
3.2. From Soluble Protein Toward Enriched Clusters and a Crystalline Phase

The normalized autocorrelation functions of DLS experiments applying pure ConA and ConA solutions with different concentrations of PEG8k, illustrated in Figure 4a, correspond to the evolution of soluble ConA toward a metastable intermediate state and a crystalline phase, depending on the %PEG8k concentration. Initially, ConA in buffer at a pH of 4.5 is characterized by one main hydrodynamic radius peak at 3.61 ± 0.35 nm (≅63 kDa) (Figure 3a), most likely corresponding to a ConA dimer [31]. DLS autocorrelation functions in the presence of PEG8K above 6.4% showed a multimodal distribution represented by a two-step decay function segmented into three distinct segments: (1) acquisition of a first decay with higher diffusion coefficients, (2) a stabilized plateau, and (3) a second decay toward the baseline with a diffusion coefficient of approximately 1 s. The diffusion coefficients were (1) increased according to higher concentrations of PEG8k, while the plateaus (2) were stretched for lower concentrations of PEG8k (Figure 4a).
At 6.4% PEG8k, two hydrodynamic radius peaks were detected. The most abundant one was composed by three radii in close proximity, i.e., 1.62 ± 0.29 nm (≅10 kDa), 1.75 ± 0.34 nm (≅12 kDa), and 2.17± 0.64 nm (≅19.4 kDa), the second and less abundant has a radius of 15.98 ± 2.56 nm (≅2 MDa) (Figure 3b). Solution studies confirmed the coexistence of an intact subunit of ConA and another subunit, which most likely contains two fragments with molecular weights of approximately 11 and 13 kDa, as reported previously by Wang et al. [45].
The increase to 8% PEG8k clearly induced disorder in the system and favoured higher polydispersity and an extended size distribution range. Compared to the most abundant particle sizes that were previously observed at 6.4%, a broader peak between 0.93 and 2.54 nm and a shift in size toward larger aggregates, which were low in abundance from 16.22 ± 3.70 nm to 27.92 ± 7.71 nm, was observed for the 8% PEG8k (Figure 3c). At 12% PEG8k, three abundant and distinct peaks were seen after approximately 12 minutes. Figure 1c and Figure 3d show, respectively, the optical view and the accelerated nucleation rate mediated by 12% PEG8k, which indicates that the nucleation free-energy barrier decreased to below the thermal energy and the rate of nucleation was solely limited by the kinetics of the phase separation determined by the phase boundary between mixed and de-mixed states [14,46]. As mentioned before, longer decay times at 16% and 17.6% PEG8k were observed. The parameters for these two conditions completely favour the self-affinity mechanism of ConA, since the diffusive evolution over time is promoted by the transition of liquid-phase domains toward nano-cluster growth. After a 10-minute reaction time, 16% and 17.6% PEG8k demixed droplets of ConA in radii dimensions of 150–326 nm and 285–317 nm, respectively. Thereby, the highest concentration of PEG8k provides the most controlled physical transport of protein molecules, which leads to a narrow size distribution (Figure 3e–f).
Overall, PEG8k, as a crowding agent, leads ConA to a metastable liquid phase separation/demixing zone, which promotes conditions for an accelerated nucleation. It can be concluded that the thermodynamic involvement of PEG8k at concentrations higher than 10% reduces the intermolecular space between ConA molecules, decreases randomness of the particle distribution, and promotes the ConA aggregation toward a less dispersed and more ordered state.
Higher scattering intensities correspond to either a higher concentration of molecules or to larger particles undergoing Brownian motion, which may also contribute to a false-positive depolarization and to an overestimation of the detected DDLS signal, due to multiple scattering of photons in the solution. In this context, Schubert et al. in 2015 [43] defined a scattering intensity threshold by applying the same DDLS device, considering that intensities >5000 kHz are indicative of a contribution of artificial multiple photon scattering. The DLS signals acquired over 10 minutes for the ConA clustering process were lower than the discussed threshold when applying 16% PEG8k and exceeded the threshold limit for 17.6% PEG8k at approximately 7 minutes due to the faster growth rate with a higher concentration of nanoparticles, as depicted in Figure 4b.
The kinetic evolution of the hydrodynamic particles was assayed when applying 12% PEG8k for up to 40 hours, which shows a clear power law coefficient (t0.7). The information and data were used to evaluate the steady-state growth to further characterize the clustering mechanism (Figure 4c). In this assay, PEG8k immediately rearranged the ConA dimers (~3.6 nm) to approximately 70 nm radius particles at the beginning of the clustering and reached an average size of approximately 700 nm after 15 h, maintaining the size distribution in the same range for up to 40 h of reaction. Since much less abundant size distribution with approximately 70 nm (t−0.05 and t0.08) and remaining ConA dimers was also detected. The DLS/DDLS intensity data from 12% PEG8k collected for 40 h also supported the investigation of the ConA phase separation (Figure 4d). The DLS scattering signal intensity sharply increased as a function of time up to 3.5 h after the clustering process was triggered and then decreased with a similar rate to low signal fluctuation values after 8 h of aggregation. A relatively low increase rate was observed for the DDLS scattering signal intensity up to 8 h. However, the value of intensity observed up to 170 kHz after 15 h indicates anisotropic interactions in the solution.

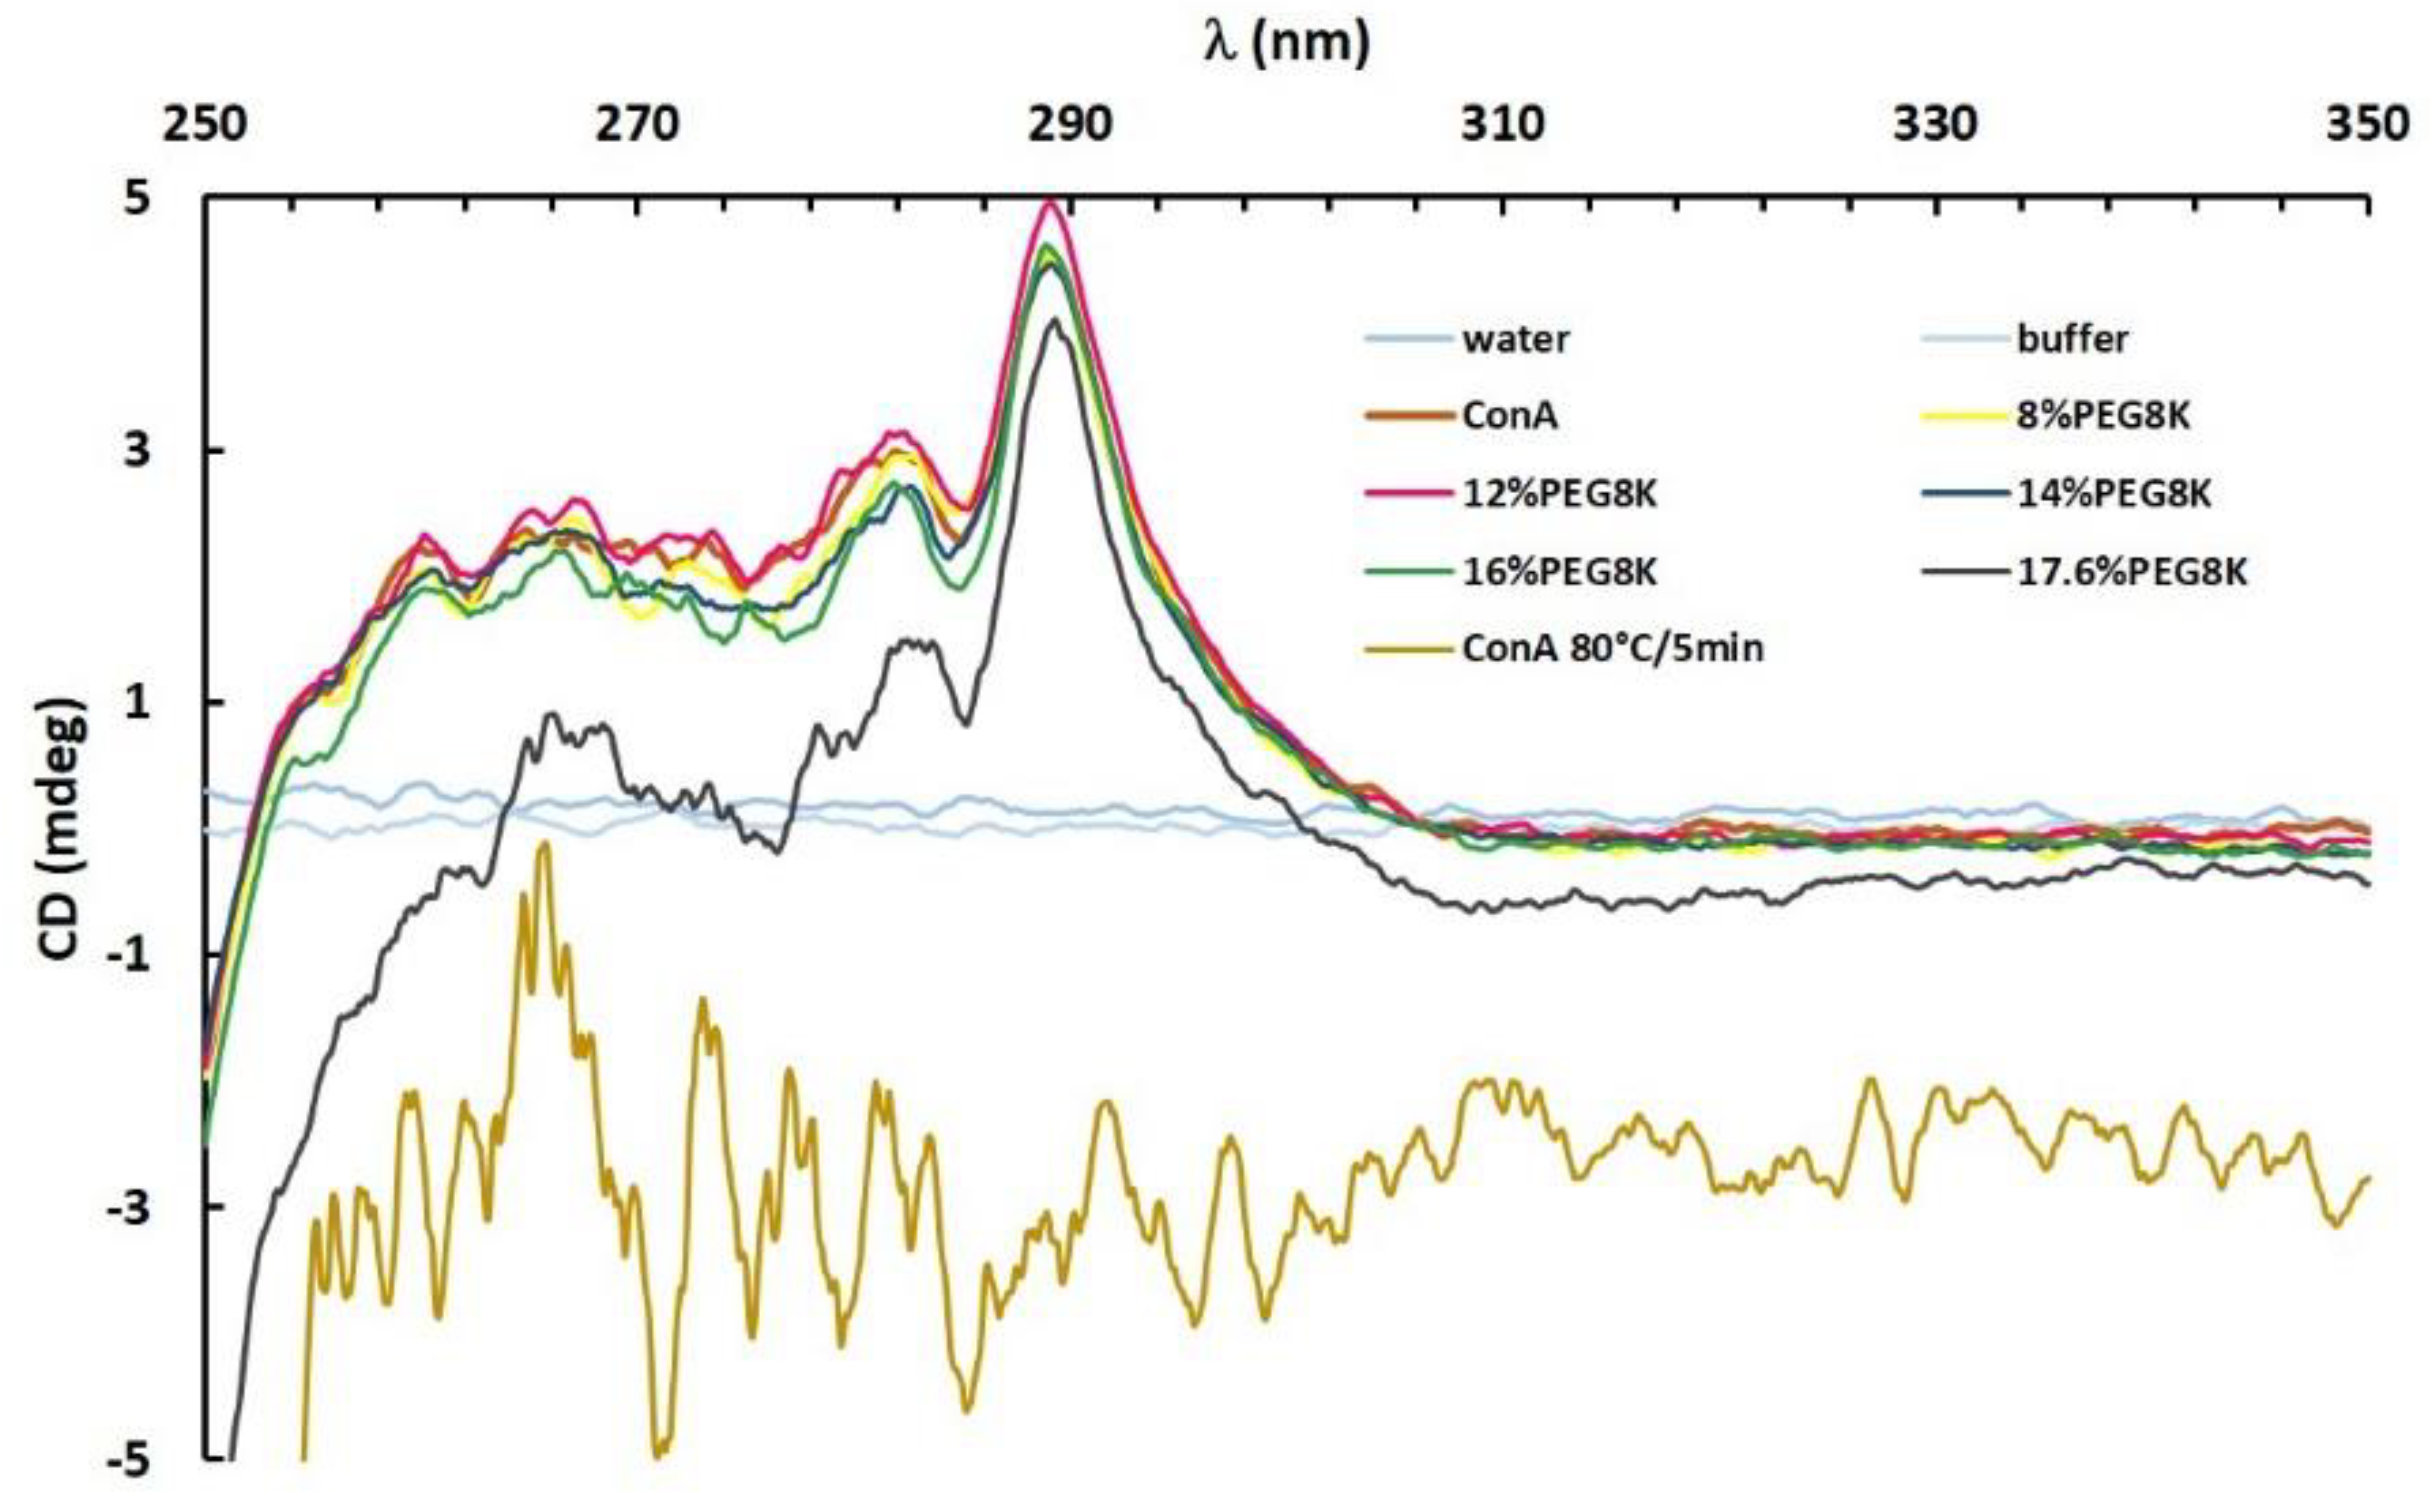
3.3. Tertiary Structure Conformation by Near-UV Circular Dichroism (CD) Spectroscopy

Comparative spectroscopic data analysing the conformation of ConA in the absence and presence of the different PEG8k concentrations (see Table 1 and, additionally, 14%PEG8k) was performed to monitor the relative position of chromophores over the clustering process and nucleation. No significant changes of the tertiary structure were observed in the near-UV spectra of ConA in buffer or in PEG8k at 8% and 12% concentrations, which were known to trigger the growth of ConA clusters at a radius close to 100 nm (Figure 3d) within 10 min of the reaction. Therefore, for the PEG8k concentrations investigated (8–12%), either the tertiary protein structure does not change during a clustering process of up to 10 min or the remaining soluble protein is still predominantly contributing to the spectra, which could hinder the detection of minor tertiary structure rearrangements.
The increase in the PEG8k concentration to 14% and 16% of PEG8k did not change the overall shape of the experimental spectra but promoted minor changes of the ellipticity between 254 and 286 nm, with a distinct peak pattern observed between 268 and 278 nm. The ellipticity in this range is attributed to the optical transitions of the tyrosine phenolic groups and their individual structural environment when absorbing polarized light [47]. However, for 17.6% PEG8k, a condition already known for crystal nucleation, ConA showed a significant change in its secondary and tertiary structural content. Substantially lower ellipticities were detected in parts of the spectra and indicate major structural repositioning of amino acids, most likely in folded regions of ConA that were not compactly folded.

4. Discussion

The experiments described previously, which simultaneously applied DLS and DDLS, and combined to RSM allowed for the understanding of the transition phase behaviour in the presence of PEG8k up to a periodic and organized morphology. The methodology allowed for the identification of the PEG8k conditions and period of reaction time that drove the protein system to short-range attractions [48] and resulted in liquid–liquid and liquid–crystalline transitions. The increase of the volume fraction at higher concentrations of PEG8k, at a constant temperature and protein concentration, allowed for the acceleration of the nucleation of nanoparticles toward a dense phase of ConA (Figure 3a–f). A supersaturation applying 16% of PEG8k substantially increased the intermolecular attraction of ConA. This observation was verified by a DLS signal intensity peak of approximately 4000 photons per second (kHz) within nine minutes after initiating the reaction (Figure 4b). Furthermore, the 3D response surface model for DDLS signals showed an intensity higher than 150 kHz at 16% of PEG8k 9 minutes after initiation of the reaction, which characterizes the presence of a periodic structure in the ConA clusters (Figure 2e). Previous studies describing real-time monitoring of lysozyme, thioredoxin, and thaumatin crystal nucleation, applying simultaneous DLS/DDLS measurements, also describe changes in the polarization plane of the scattered light (DDLS signals up to 150 kHz) and confirmed—after verification by powder diffraction and scanning electron microscopy—the presence of crystalline lattices [43]. Thus, the volume fraction conferred by 16% PEG8k corresponds to the boundary line located between ConA clusters and the crystalline phase. The Supplemental Figure S1 shows the phase evolution from clusters toward nanocrystals and microcrystals applying 16% PEG8k. The same clustering process was recorded for 1 h (Supplemental Video S1) and shows crystalline structures growing from a nanoscopic dense phase. Figure S2 depicts the dimensions of the crystals obtained after 1 h of the clustering process.
The multimodal distribution of the ACFs obtained from DLS measurements depicted polydispersity in all PEG conditions assayed (Figure 3b–f). An intriguing two-step decay (Figure 4a) related to the mobility of local oscillatory particles was verified for all PEG concentrations analysed (unless 6.4%), even in less polydisperse environments, as shown in Figure 3e,f. Similar two-step kinetics were observed by Kulkarni et al. [49], who described, for lysozyme, an usual single exponential decay at short delay times followed by a deviation of the correlation decay in two distinct steps to a plateau at delay times of 1 s. This was also described by Harden et al. [48] for silica nanocolloids and Shibayama et al. [30,50].
The two-step profile can be explained by the slow dynamics of structural relaxation over the period of phase separation and is predicted by the mode-coupling theory [51]. In the beginning, high diffusivity is maintained by the self-propulsion velocity of molecules since only thermal concentration fluctuations exist. Upon a critical volume fraction of CA, the system experiences an intermediate range and strength of driving forces that are able to constrain the protein molecules on a particle’s motion due to increasing intermolecular interactions [52,53]. At some point, the interaction strength is strong enough to trap the particles in dynamic “cluster cages.” Thus, upon particle diffusion, the cages can be disrupted by a trap/untrap mechanism, dependent on the cooperative rearrangement of the particles. However, at higher CA concentrations, higher attraction forces will guide a re-arrangement of the particles to a frozen orientation within these cages due to the anisotropic nature of their interactions. These orientated motion constraints cause the additional plateau [49,50] (Figure 4a). The plateau between the decays was longer at lower concentrations of CA and shorter at higher concentrations, which can be explained by the weak interactions that facilitate the untrapping of particles from the surface of the cluster. On the other hand, higher CA provides anisotropic interactions and limits the untrapping mechanism due to the increased rigidity of the particle network. Thereby, the ACF pattern deviation reflects the relationship between the constraints to a collective localized motion in the dynamic arrest and the special correlations of the colloids after the transition from an ergodic to a non-ergodic solution.
Therefore, the diffusion of ConA at higher concentrations of PEG8k (16 and 17.6% PEG8k) was restrained rapidly due to substantially strong intermolecular interactions, until the metastable intermediate phase became restricted and specifically ordered, which was verified by the depolarized light scattering component (Figure 4b). The restraining mechanism that slows down the diffusion speed clearly promoted tertiary structure and conformational changes of the ConA structure since the ellipticity values became negative. This was due to rearrangements of aromatic side chains upon application of high concentrations of the crowding agent (Figure 5).
The real-time observation of the size distribution (Figure 4c) and monitoring of the light scattering intensities for up to 40 h at 12% PEG8k (Figure 4d) depicted the cluster gelation process and the rearrangement of the cluster structure. ConA kinetics revealed that the clusters’ size increases following a power law exponent (0.7), which configures the behaviour of several reported dynamic gelation processes [27,29,30,52]. The power law exponent depends on the gelling system architecture and increases according to the increasing degree of branching clusters [50]. Moreover, according to Matsunaga and Norisuye [28,29], the DLS intensity peak at 3.5 h represents the gelation threshold, which indicates the beginning of protein agglomeration toward the formation of large clusters, up to a transition point, after which dense gels are formed. Thus, the scattering behaviour represents the solution–gel transition with an average hydrodynamic radius distribution close to 200 nm. Due to gelation, the observed gel-cluster solution dynamics slowed down and the DLS intensity decayed. However, the cluster size increased up to approximately 15 h. At this time, a fractal aggregated structure was achieved. At the same time, when the dense gel phase did not grow further (~15 h), higher DDLS intensities were detected, which represent the internal structural rearrangement of the nano-sized gel-clusters followed by formation of a 3D crystalline lattice. This clearly indicated that gels were formed first and, then, nanocrystals were nucleated. The Supplemental Video (Video S1) shows the phase transition from a cluster to crystals.

5. Conclusions

Investigating the ConA clustering process by performing simultaneous DLS/DDLS experiments and applying a statistical data evaluation of the experiments allowed for elucidation of the clustering phenomenon and provided insights into ConA LLPS and the early stage of crystal nucleation. A dispersed solution of ConA in the presence of a specific concentration of the crowding agent PEG8k showed a transition from a soluble and monodisperse state to a demixed state, going from a gel phase to a crystalline structure. Our results clearly showed that ConA dimers form aggregates based on short-range interactions at lower crowding agent concentrations, which further proceed to a gel state within a specific time period. At higher concentrations of the crowding agent, we observed a substantially faster transition of soluble ConA to compact clusters with an internal order, which was followed by their nucleation and toward the formation of microcrystals.

Supplementary Materials

The following are available online at https://www.mdpi.com/2073-4352/9/12/620/s1, Figure S1: Phase transition of ConA at 16% PEG8k for 30 min, Figure S2: Crystals size after growth for 1 h at 16% PEG8k, Video S1: Phase transition of ConA at 16% PEG8k for 1 h.

Author Contributions

Conceptualization of the research was performed by H.B. H.B. and S.F. are responsible for the methodology and data collection. H.B. processed all data. H.B., C.N.M., S.F., and C.B. performed data verification and validation. H.B. prepared the manuscript, which was further finalized with all authors.

Funding

The authors acknowledge financial support from the Cluster of Excellence ‘Advanced Imaging of Matter’ of the German research Foundation (DFG)-EXC 2056-project ID 390715994, by the Helmholtz Excellence Network ‘Structure, Dynamics and Control on the Atomic Scale’, the DFG project BE1443/29-1, by the German Aerospace Center (DLR) via project 50WB1422, by BMBF via project 05K16GUA and by the Joachim-Herz-Foundation Hamburg via the project Infecto-Physics.

Conflicts of Interest

The authors declare no conflict of interest.

Appendix A

The ANOVA results for both responses hydrodynamic radius (nm) and DDLS scattering signal intensity (kHz) are given in Table A1 and Table A2, respectively. The calculated p values determine the statistical significance of each independent variable and their interaction strength. Values smaller than 0.05 (p < 0.05) indicate high significance of the variable to the ConA clustering process and are shown in red.
Table A1. Analysis of variance (ANOVA) of the response toward the hydrodynamic radius (nm).
FactorR2 = 0.95454 R2adj = 0.92423 MSresidual = 1719.379
SSdfMSFp
(1)%PEG8k(Linear)147,606.91147,606.985.848990.000089
%PEG8K (Quadratic)33,066.3133,066.319.231550.004641
(2)Time (min)(Linear)18,768.7118,768.710.915950.016328
(1)Linear by (2)Linear17,157.1117,157.19.978640.019592
Error10,316.361719.4
Total SS226,915.310
SS—sum of squares, MS—mean squares, df—degree of freedom, F Fischer’s function, p—level of significance.
Table A2. Analysis of variance (ANOVA) for response of DDLS signal intensity (kHz).
FactorR2 = 0.93889 R2adj = 0.8777 MSresidual = 509.1356
SSdfMSFp
(1)%PEG8k(Linear)15,486.89115,486.8930.418000.005275
%PEG8K (Quadratic)4890.9314890.939.606350.036242
(2)Time (min)(Linear)4571.1114571.118.978180.040086
(1)Linear by (2)Linear6338.5516338.5512.449630.024265
Error2036.544509.14
Total SS33,324.038
SS—sum of squares, MS—mean squares, df—degree of freedom, F—Fischer’s function, p—level of significance.

References

  1. Boeynaems, S.; Alberti, S.; Fawzi, N.L.; Mittag, T.; Polymenidou, M.; Rousseau, F.; Schymkowitz, J.; Shorter, J.; Wolozin, B.; Van Den Bosch, L.; et al. Protein Phase Separation: A New Phase in Cell Biology. Trends Cell Biol. 2018, 28, 420–435. [Google Scholar] [CrossRef] [PubMed]
  2. Alberti, S.; Gladfelter, A.; Mittag, T. Considerations and Challenges in Studying Liquid-Liquid Phase Separation and Biomolecular Condensates. Cell 2019, 176, 419–434. [Google Scholar] [CrossRef] [PubMed]
  3. Nakashima, K.K.; Vibhute, M.A.; Spruijt, E. Biomolecular Chemistry in Liquid Phase Separated Compartments. Front. Mol. Biosci. 2019, 6, 21. [Google Scholar] [CrossRef] [PubMed]
  4. Bahn, S.Y.; Jo, B.H.; Choi, Y.S.; Cha, H.J. Control of nacre biomineralization by Pif80 in pearl oyster. Sci. Adv. 2017, 3, e1700765. [Google Scholar] [CrossRef] [PubMed]
  5. Alberti, S.; Dormann, D. Liquid–Liquid Phase Separation in Disease. Annu. Rev. Genet. 2019, 53. [Google Scholar] [CrossRef] [PubMed]
  6. Shin, Y.; Brangwynne, C.P. Liquid phase condensation in cell physiology and disease. Science 2017, 357, eaaf4382. [Google Scholar] [CrossRef] [PubMed]
  7. Tanaka, H. Viscoelastic phase separation in soft matter and foods. Faraday Discuss. 2012, 158, 371–406. [Google Scholar] [CrossRef]
  8. Luebbert, C.; Wessner, M.; Sadowski, G. Mutual Impact of Phase Separation/Crystallization and Water Sorption in Amorphous Solid Dispersions. Mol. Pharm. 2018, 15, 669–678. [Google Scholar] [CrossRef]
  9. Gibson, B.A.; Doolittle, L.K.; Jensen, L.E.; Gamarra, N.; Redding, S.; Rosen, M.K. Organization and Regulation of Chromatin by Liquid-Liquid Phase Separation. BioRxiv 2019. [Google Scholar] [CrossRef]
  10. Schubert, R.; Meyer, A.; Baitan, D.; Dierks, K.; Perbandt, M.; Betzel, C. Real-Time Observation of Protein Dense Liquid Cluster Evolution during Nucleation in Protein Crystallization. Cryst. Growth Des. 2017, 17, 954–958. [Google Scholar] [CrossRef]
  11. Dumetz, A.C.; Chockla, A.M.; Kaler, E.W.; Lenhoff, A.M. Protein phase behavior in aqueous solutions: Crystallization, liquid-liquid phase separation, gels, and aggregates. Biophys. J. 2008, 94, 570–583. [Google Scholar] [CrossRef] [PubMed]
  12. Zhang, F. Nonclassical nucleation pathways in protein crystallization. J. Phys. Condens. Matter 2017, 29, 443002. [Google Scholar] [CrossRef] [PubMed]
  13. Le Ferrand, H.; Duchamp, M.; Gabryelczyk, B.; Cai, H.; Miserez, A. Time-Resolved Observations of Liquid–Liquid Phase Separation at the Nanoscale Using in Situ Liquid Transmission Electron Microscopy. J. Am. Chem. Soc. 2019, 141, 7202–7210. [Google Scholar] [CrossRef] [PubMed]
  14. Berry, J.; Brangwynne, C.P.; Haataja, M. Physical principles of intracellular organization via active and passive phase transitions. Rep. Prog. Phys. 2018, 81, 46601. [Google Scholar] [CrossRef]
  15. Bray, A.J. Theory of phase-ordering kinetics. Adv. Phys. 2002, 51, 481–587. [Google Scholar] [CrossRef]
  16. Furukawa, H. A dynamic scaling assumption for phase separation. Adv. Phys. 1985, 34, 703–750. [Google Scholar] [CrossRef]
  17. Madras, G.; McCoy, B.J. Ostwald ripening with size-dependent rates: Similarity and power-law solutions. J. Chem. Phys. 2002, 117, 8042–8049. [Google Scholar] [CrossRef]
  18. Da Vela, S.; Braun, M.K.; Dörr, A.; Greco, A.; Möller, J.; Fu, Z.; Zhang, F.; Schreiber, F. Kinetics of liquid-liquid phase separation in protein solutions exhibiting LCST phase behavior studied by time-resolved USAXS and VSANS. Soft Matter 2016, 12, 9334–9341. [Google Scholar] [CrossRef]
  19. Vorontsova, M.A.; Chan, H.Y.; Lubchenko, V.; Vekilov, P.G. Lack of Dependence of the Sizes of the Mesoscopic Protein Clusters on Electrostatics. Biophys. J. 2015, 109, 1959–1968. [Google Scholar] [CrossRef]
  20. Zhang, F.; Roosen-Runge, F.; Sauter, A.; Roth, R.; Skoda, M.W.A.; Jacobs, R.M.J.; Sztucki, M.; Schreiber, F. The role of cluster formation and metastable liquid-liquid phase separation in protein crystallization. Faraday Discuss. 2012, 159, 313–325. [Google Scholar] [CrossRef]
  21. Vivarès, D.; Kaler, E.W.; Lenhoff, A.M. Quantitative imaging by confocal scanning fluorescence microscopy of protein crystallization via liquid-liquid phase separation. Acta Crystallogr. Sect. D Biol. Crystallogr. 2005, 61, 819–825. [Google Scholar] [CrossRef] [PubMed]
  22. Grouazel, S.; Perez, J.; Astier, J.P.; Bonneté, F.; Veesler, S. BPTI liquid-liquid phase separation monitored by light and small angle X-ray scattering. Acta Crystallogr. Sect. D Biol. Crystallogr. 2002, 58, 1560–1563. [Google Scholar] [CrossRef] [PubMed]
  23. Xu, R. Light scattering: A review of particle characterization applications. Particuology 2015, 18, 11–21. [Google Scholar] [CrossRef]
  24. Owen, R.L.; Garman, E. A new method for predetermining the diffraction quality of protein crystals: Using SOAP as a selection tool. Acta Crystallogr. Sect. D 2005, 61, 130–140. [Google Scholar] [CrossRef] [PubMed]
  25. Chayen, N.; Dieckmann, M.; Dierks, K.; Fromme, P. Size and Shape Determination of Proteins in Solution by a Noninvasive Depolarized Dynamic Light Scattering Instrument. Ann. N. Y. Acad. Sci. 2004, 1027, 20–27. [Google Scholar] [CrossRef] [PubMed]
  26. Fang, L.; Brown, W.; Konak, C. Dynamic light scattering study of the sol-gel transition. Macromolecules 1991, 24, 6839–6842. [Google Scholar] [CrossRef]
  27. Takata, S.; Norisuye, T.; Tanaka, N.; Shibayama, M. Heat-Induced Gelation of β-Lactoglobulin. 1. Time-Resolved Dynamic Light Scattering. Macromolecules 2000, 33, 5470–5475. [Google Scholar] [CrossRef]
  28. Norisuye, T.; Shibayama, M.; Nomura, S. Time-resolved light scattering study on the gelation process of poly(N-isopropyl acrylamide. Polymer 1998, 39, 2769–2775. [Google Scholar] [CrossRef]
  29. Matsunaga, T.; Shibayama, M. Gel point determination of gelatin hydrogels by dynamic light scattering and rheological measurements. Phys. Rev. E 2007, 76, 30401. [Google Scholar] [CrossRef]
  30. Shibayama, M.; Okamoto, M. Dynamic light scattering study on gelatin aqueous solutions and gels. J. Chem. Phys. 2001, 115, 4285–4291. [Google Scholar] [CrossRef]
  31. Edelman, G.M.; Cunningham, B.A.; Reeke, G.N., Jr.; Becker, J.W.; Waxdal, M.J.; Wang, J.L. The covalent and three-dimensional structure of concanavalin A. Proc. Natl. Acad. Sci. USA 1972, 69, 2580–2584. [Google Scholar] [CrossRef] [PubMed] [Green Version]
  32. Park, Y.R.; Kim, D.S.; Lee, D.-H.; Kang, H.G.; Park, J.H.; Lee, S.J. Cadmium-substituted concanavalin A and its trimeric complexation. J. Microbiol. Biotechnol. 2018, 28, 2106–2112. [Google Scholar] [CrossRef] [PubMed]
  33. Baş, D.; Boyacı, İ.H. Modeling and optimization I: Usability of response surface methodology. J. Food Eng. 2007, 78, 836–845. [Google Scholar] [CrossRef]
  34. Konda, R.; Rajurkar, K.P.; Bishu, R.R.; Guha, A.; Person, M. Design of experiments to study and optimize process performance. Int. J. Qual. Reliab. Manag. 1999, 16, 56–71. [Google Scholar] [CrossRef]
  35. Ganesamoorthi, B.; Kalaivanan, S.; Dinesh, R.; Naveen kumar, T.; Anand, K. Optimization Technique using Response Surface Method for USMW process. Procedia Soc. Behav. Sci. 2015, 189, 169–174. [Google Scholar] [CrossRef] [Green Version]
  36. De Benedetto, G.; Di Masi, S.; Pennetta, A.; Malitesta, C. Response Surface Methodology for the Optimisation of Electrochemical Biosensors for Heavy Metals Detection. Biosensors 2019, 9, 26. [Google Scholar] [CrossRef] [Green Version]
  37. Owolabi, R.U.; Usman, M.A.; Kehinde, A.J. Modelling and optimization of process variables for the solution polymerization of styrene using response surface methodology. J. King Saud Univ. Eng. Sci. 2018, 30, 22–30. [Google Scholar] [CrossRef] [Green Version]
  38. Saeidi, M.; Ghaemi, A.; Tahvildari, K.; Derakhshi, P. Exploiting response surface methodology (RSM) as a novel approach for the optimization of carbon dioxide adsorption by dry sodium hydroxide. J. Chin. Chem. Soc. 2018, 65, 1465–1475. [Google Scholar] [CrossRef]
  39. Rekha, H.B.; Srinidhi, M.S.; Murthy, U.N. Textile Wastewater Treatment by Electrochemical Oxidation—Response Surface Methodology. In Waste Water Recycling and Management; Ghosh, S.K., Ed.; Springer: Singapore, 2019; pp. 251–263. [Google Scholar]
  40. Lanka, S.; Naveena, J.; Latha, J.N.L. Response Surface Methodology as a Statistical Tool for Fermentation Media Optimization in Lipase Production by Palm Oil Mill Effluent (POME) Isolate Emericella nidulans NFCCI 3643. Int. J. Innov. Res. Sci. Eng. Technol. 2015, 4, 2535–2545. [Google Scholar]
  41. Ben Mefteh, F.; Frikha, F.; Daoud, A.; Bouket, A.C.; Luptakova, L.; Alenezi, F.; Al-Anzi, B.; Oszako, T.; Gharsallah, N.; Belbahri, L. Response Surface Methodology Optimization of an Acidic Protease Produced by Penicillium bilaiae Isolate TDPEF30, a Newly Recovered Endophytic Fungus from Healthy Roots of Date Palm Trees (Phoenix dactylifera L.). Microorganisms 2019, 7, 74. [Google Scholar] [CrossRef] [Green Version]
  42. Belloni, L. Colloidal interactions. J. Phys. Condens. Matter 2000, 12, R549–R587. [Google Scholar] [CrossRef]
  43. Schubert, R.; Meyer, A.; Dierks, K.; Kapis, S.; Reimer, R.; Einspahr, H.; Perbandt, M.; Betzel, C. Reliably distinguishing protein nanocrystals from amorphous precipitate by means of depolarized dynamic light scattering. J. Appl. Crystallogr. 2015, 48, 1476–1484. [Google Scholar] [CrossRef]
  44. Provencher, S.W. CONTIN: A general purpose constrained regularization program for inverting noisy linear algebraic and integral equations. Comput. Phys. Commun. 1982, 27, 229–242. [Google Scholar] [CrossRef]
  45. Wang, J.L.; Cunningham, B.A.; Edelman, G.M. Unusual fragments in the subunit structure of concanavalin A. Proc. Natl. Acad. Sci. USA 1971, 68, 1130–1134. [Google Scholar] [CrossRef] [PubMed] [Green Version]
  46. Pan, W.; Kolomeisky, A.B.; Vekilov, P.G. Nucleation of ordered solid phases of proteins via a disordered high-density state: Phenomenological approach. J. Chem. Phys. 2005, 122, 174905. [Google Scholar] [CrossRef]
  47. Ranjbar, B.; Gill, P. Circular Dichroism Techniques: Biomolecular and Nanostructural Analyses—A Review. Chem. Biol. Drug Des. 2009, 74, 101–120. [Google Scholar] [CrossRef]
  48. Harden, J.L.; Guo, H.; Bertrand, M.; Shendruk, T.N.; Ramakrishnan, S.; Leheny, R.L. Enhanced gel formation in binary mixtures of nanocolloids with short-range attraction. J. Chem. Phys. 2018, 148, 44902. [Google Scholar] [CrossRef] [Green Version]
  49. Kulkarni, A.M.; Dixit, N.M.; Zukoski, C.F. Ergodic and non-ergodic phase transitions in globular protein suspensions. Faraday Discuss. 2003, 123, 37–50. [Google Scholar] [CrossRef]
  50. Shibayama, M.; Norisuye, T. Gel Formation Analyses by Dynamic Light Scattering. Bull. Chem. Soc. Jpn. 2002, 75, 641–659. [Google Scholar] [CrossRef]
  51. Liluashvili, A.; Ónody, J.; Voigtmann, T. Mode-coupling theory for active Brownian particles. Phys. Rev. E 2017, 96, 62608. [Google Scholar] [CrossRef] [Green Version]
  52. Cardinaux, F.; Gibaud, T.; Stradner, A.; Schurtenberger, P. Interplay between Spinodal Decomposition and Glass Formation in Proteins Exhibiting Short-Range Attractions. Phys. Rev. Lett. 2007, 99, 118301. [Google Scholar] [CrossRef] [PubMed] [Green Version]
  53. Kuznetsova, I.M.; Turoverov, K.K.; Uversky, V.N. What macromolecular crowding can do to a protein. Int. J. Mol. Sci. 2014, 15, 23090–23140. [Google Scholar] [CrossRef] [PubMed] [Green Version]
Figure 1. Upper panel: ConA phase separation in the presence of PEG8k: (a) 6.4%, (b) 8%, (c) 12%, (d) 16%, and (e) 17.6%, observed after 10 minutes. Lower panel: visualization of phase separation by optical microscopy in the same conditions (a–e).
Crystals 09 00620 g001
Figure 2. Plots of the statistical analysis showing the evolution of the hydrodynamic radii (nm) in the context of the DDLS scattering signal intensities (kHz): Pareto plot, 3D response surface plot, and contour plot of the hydrodynamic radius distribution (nm), (a–c), respectively. Pareto plot, a 3D response surface plot, and contour plot of the DDLS signal intensities (kHz), (d–f), respectively.
Crystals 09 00620 g002
Figure 3. Size distribution of ConA (X axis) in the presence of (a) buffer, (b) 6.4%, (c) 8%, (d) 12%, (e) 16%, and (f) 17.6% of PEG8k over time (s) (Y axis). The color intensity from blue to red demonstrates the increase in abundance.
Crystals 09 00620 g003
Figure 4. (a) Autocorrelation functions (ACFs) recorded during DLS measurements. The legend indicates the solution conditions, ConA in buffer, and ConA with PEG8k from 6.4% up to 17.6%. (b) DLS scattering signal intensity (kHz). Left Y-axis: ConA and ConA under aggregation conditions from 6.4% up to 12% PEG8k. Right Y-axis: ConA at 16% and 17.6% PEG8k. All reactions were performed up to 10 min. (c) Kinetic evolution of the hydrodynamic radius (nm) for ConA mixed with 12% PEG8k up to 40 h. (d) Time-resolved DDLS scattering intensity (left Y-axis) and DLS scattering intensity (right Y-axis) at solution conditions with 12% PEG8k for up to 40 h (the red line was introduced to support the interpretation).
Crystals 09 00620 g004
Figure 5. Near-UV spectrum of ConA in the presence of buffer, 8–17.6% PEG8k (legend in the graph) and ConA denatured at 80 °C for 5 min.
Crystals 09 00620 g005
Table 1. Matrix of both experimental designs with the independent variables (%PEG8k and time) in actual and coded values.
Central Composite Design (Hydrodynamic Radius Response)Full Factorial Design (DDLS Signal Intensity Response)
Assay No.Independent VariableCoded Independent VariableAssay No.Independent VariableCoded Independent Variable
%PEG8kTime (min)PEG8kTime%PEG8kTime (min)PEG8kTime
182−1−1182−1−1
2810−11285−10
31621−13810−11
416101141220−1
56.45−1.40512500
617.65+1.406121001
71210−1.471621−1
812120+1.4816510
9125009161011
1012500----------
1112500----------

