Article

Double Layer Conducting Salts: (CNB-EDT-TTF)4X, X = ClO4, ReO4, and SbF6; Electrical Transport and Infrared Properties

1
C2TN, Instituto Superior Técnico, Universidade de Lisboa, Estrada Nacional 10, P-2695-066 Bobadela LRS, Portugal
2
Physikalisches Institut, Universität Stuttgart, Pfaffenwaldring 57, D-70550 Stuttgart, Germany
*
Authors to whom correspondence should be addressed.
Crystals 2019, 9(12), 608; https://doi.org/10.3390/cryst9120608
Submission received: 9 October 2019 / Revised: 15 November 2019 / Accepted: 17 November 2019 / Published: 20 November 2019
(This article belongs to the Section Inorganic Crystalline Materials)

Abstract

:
Two new members of the family of bilayer compounds (CNB-EDT-TTF)4X, (CNB-EDT-TTF = 5-cyanobenzene-ethylenedithio-tetrathiafulvalene) with anions X = ReO4 and SbF6 are reported, their electron transport and optical properties investigated, and then compared to the ClO4 salt that was previously described. These compounds share the same structural type, i.e. bilayers of donors, which are packed in a β″-type pattern and then separated by layers of highly disordered anions. The absolute values of the electrical resistivity measured in single crystals within the layers were found in the range of 5 to 18 (Ωcm)−1, with a significantly sample dependence being ascribed to intrinsic disorder effects. The ClO4 and SbF6 salts exhibit metallic behavior with the resistivity decreasing upon cooling almost linearly with temperature until a broad minimum is reached between 15 and 80 K, depending on crystal quality; this is followed by an upturn of resistivity reaching values at T = 1.5 K that were comparable to those attained at room temperature. The electrical resistivity of the ReO4 salt follows a thermally activated behavior already at T = 300 K, although with a small activation energy in the range 16−18 meV. Thermoelectric power measurements yield large positive values (75–80 µV/K) at ambient temperature with a metallic behavior that is identical for all compounds. Temperature and polarization dependent infrared reflection measurements on single crystals of (CNB-EDT-TTF)4X salts, with X = ClO4, ReO4, and SbF6, have been performed to obtain the optical conductivity and analyze the electronic and vibrational properties. For (CNB-EDT-TTF)4ClO4 the molecular vibrations exhibit a significant variation below T = 23 K, which suggests a charge localization phenomena.

1. Introduction

The dissymmetrical tetrathiafulvalene (TTF) derivative 5-cyanobenzene-ethylenedithio-tetrathiafulvalene (CNB-EDT-TTF) [1] (Figure 1) is a recently described electron donating molecule; when electrocrystallized in the presence of small anions X, such as ClO4, PF6, BF4, or I3, under specific conditions a family of radical cation salts of composition (CNB-EDT-TTF)4X can be obtained. The compounds of this family are characterized by a unique structure of the donors assembled in paired layers (bilayer) [2]. This bilayer arrangement is promoted by an effective network of hydrogen bond dimeric C–N···H–C interactions involving hydrogen atoms on carbons in position alpha to the CN groups. These interactions can be described as a combination in a two-dimensional network of R22(10) and R24(10) synthons, in Etters’s notation, [3,4,5].
These (CNB-EDT-TTF)4X compounds crystallize in several polymorphic phases that are associated with different donor packing patterns (β″-type and κ-type) or anion ordering schemes [6,7,8]; for the κ -type packing pattern some of these two-dimensional (2D) metals have shown superconductivity at low temperatures [6]. The most common donor packing pattern is the β″-type, which occurs in salts with different anions of linear (I3), tetrahedral (ClO4, BF4), and octahedral (PF6) geometry. The anions are found to be severely disordered; and, with tetrahedral anions either monoclinic or triclinic polymorphs have been described [7,8].
We tested anions of variable size and geometry in order to explore possible new members of this family of bilayer compounds and, in the present work, we report new salts of this family with the larger anions ReO4, and SbF6. Besides their electrical transport properties, the first studies on the optical properties of these compounds as well as of the previously described ClO4 salt, with infrared investigations, are also reported.

2. Experimental Section

2.1. Synthesis

5-cyanobenzene-ethylenedithio-tetrathiafulvalene (CNB-EDT-TTF) (Figure 1) was prepared following the previously described procedures [1,7]. n-Bu4NClO4, n-Bu4NReO4, and n-Bu4NSbF6 (Sigma Aldrich, Darmstadt, Germany) were purified by recrystallization from appropriate solvents. Dichloromethane used for the electrocrystallizations were freshly distilled and dried through an alumina column immediately before use.
(CNB-EDT-TTF)4ClO4, (CNB-EDT-TTF)4ReO4, and (CNB-EDT-TTF)4SbF6 charge transfer salts were prepared as small single crystals following the previously described procedures to prepare other compounds in this family [2]. A dichloromethane solution of the donor CNB-EDT-TTF and the corresponding anion salt n-Bu4NClO4, n-Bu4NReO4, or n-Bu4NSbF6, respectively, was added to an H-shaped two-compartment cells that were separated by frit glass with Pt electrodes and sealed under nitrogen. In a first stage, a current density of approximately 0.5 μA/cm2 was applied (during the first five days) until the first crystals become clearly visible growing on the anode. Subsequently, the current was raised to ~1 μA/cm2 for another two weeks. The black elongated plate shaped crystals that grew on the electrode were collected and washed with dichloromethane.

2.2. X-ray Structure

Selected single crystals of (CNB-EDT-TTF)4ReO4 and (CNB-EDT-TTF)4SbF6 were mounted on a loop with protective oil and X-ray data were collected on a Bruker APEX II CCD detector diffractometer while using graphite monochromated MoKα radiation (λ = 0.71073 Å) and operating in a φ and ω scans mode. A semi empirical absorption correction was carried out using SADABS; [9] data collection and cell refinement and data reduction were undertaken with the SMART and SAINT programs [10]. The structures were solved by direct methods while using SIR97 [11] and refined by full-matrix least-squares methods utilizing the program SHELXL97 [12] using the winGX software package [13]. The non-hydrogen atoms were refined with anisotropic thermal parameters, whereas the H-atoms were placed in idealized positions and allowed to refine riding on the parent C atom. Molecular graphics were prepared using Mercury program package [14]. The CCDC numbers of charge transfer salts (CNB-EDT-TTF)4ReO4 and (CNB-EDT-TTF)4SbF6 are 1,921,072, 1,921,071, respectively. These data can be obtained free of charge from The Cambridge Crystallographic Data Centre via www.ccdc.cam.ac.uk/data_request/cif. Table 1 lists crystal data for (CNB-EDT-TTF)4ReO4 and (CNB-EDT-TTF)4SbF6.

2.3. Electrical Transport Properties

The electrical resistivity of (CNB-EDT-TTF)4ClO4, (CNB-EDT-TTF)4ReO4, and (CNB-EDT-TTF)4SbF6 was measured along the long needle axis of the elongated plate shaped crystals (typically have 2–5 × 0.1–0.2 × 0.02 mm3) while using a four-in-line contacts configuration. The temperature range of 1.7 to 300 K was covered by a helium cryostat with an 18 T superconducting magnet (Oxford Instruments). Selected crystals in the shape of elongated platelets were attached to 10 μm diameter Au wires with graphite paint over evaporated gold contacts that were placed on the sample along the long axis of the crystals that correspond to the donor stacking axis a. The almost-dc (77 Hz) current was kept in the range of 1−10 μA, and the voltage drop across the sample was measured by a lock-in amplifier (Stanford Research Systems model SR830).
Thermoelectric power measurements were also performed along the long axis of the crystals in the temperature range of 20−300 K while using the slow alternating current (∼10−2 Hz) technique [15] by attaching two 25 μm diameter 99.99% pure Au wires (Goodfellow metals) thermally anchored to two quartz reservoirs with Pt paint (Demetron 308A) to the extremities of an elongated sample, in a previously described apparatus that was attached to the cold stage of a closed-cycle helium refrigerator, [16] which is controlled by a computer [17]. The oscillating thermal gradient, as measured with a differential Au (0.05 atom % Fe) versus the chromel thermocouple attached to the quartz reservoirs, was kept below 1 K. The absolute thermoelectric power of the sample was obtained after correction for the absolute thermoelectric power of the Au leads by using the data of Huebner [18].

2.4. Optical Properties

Optical reflection measurements have been performed on (CNB-EDT-TTF)4X crystals while using a Fourier transform infrared spectrometer Bruker Vertex 80v that was connected to an infrared microscope (Bruker Hyperion 1000). The typical crystal size is 1000 × 150 × 50 μm3. There remains some uncertainty as to whether these crystals are in the triclinic or monoclinic phase, or contain a mixture of both. The light was polarized along the longest crystal axis (labelled E ‖ needle), which corresponds to the crystallographic a-axis, along the intermediate direction perpendicular to the needle axis, and in the third direction E ⊥ plane. The specimens were cooled down to T = 10 K by a Cryovac helium-flow cryostat. The acquired data were extrapolated by a constant reflectivity towards low frequencies and up to 105 cm−1 to perform the Kramers–Kronig analysis; for higher frequencies the standard ω−4 extrapolation was chosen.

3. Results and Discussion

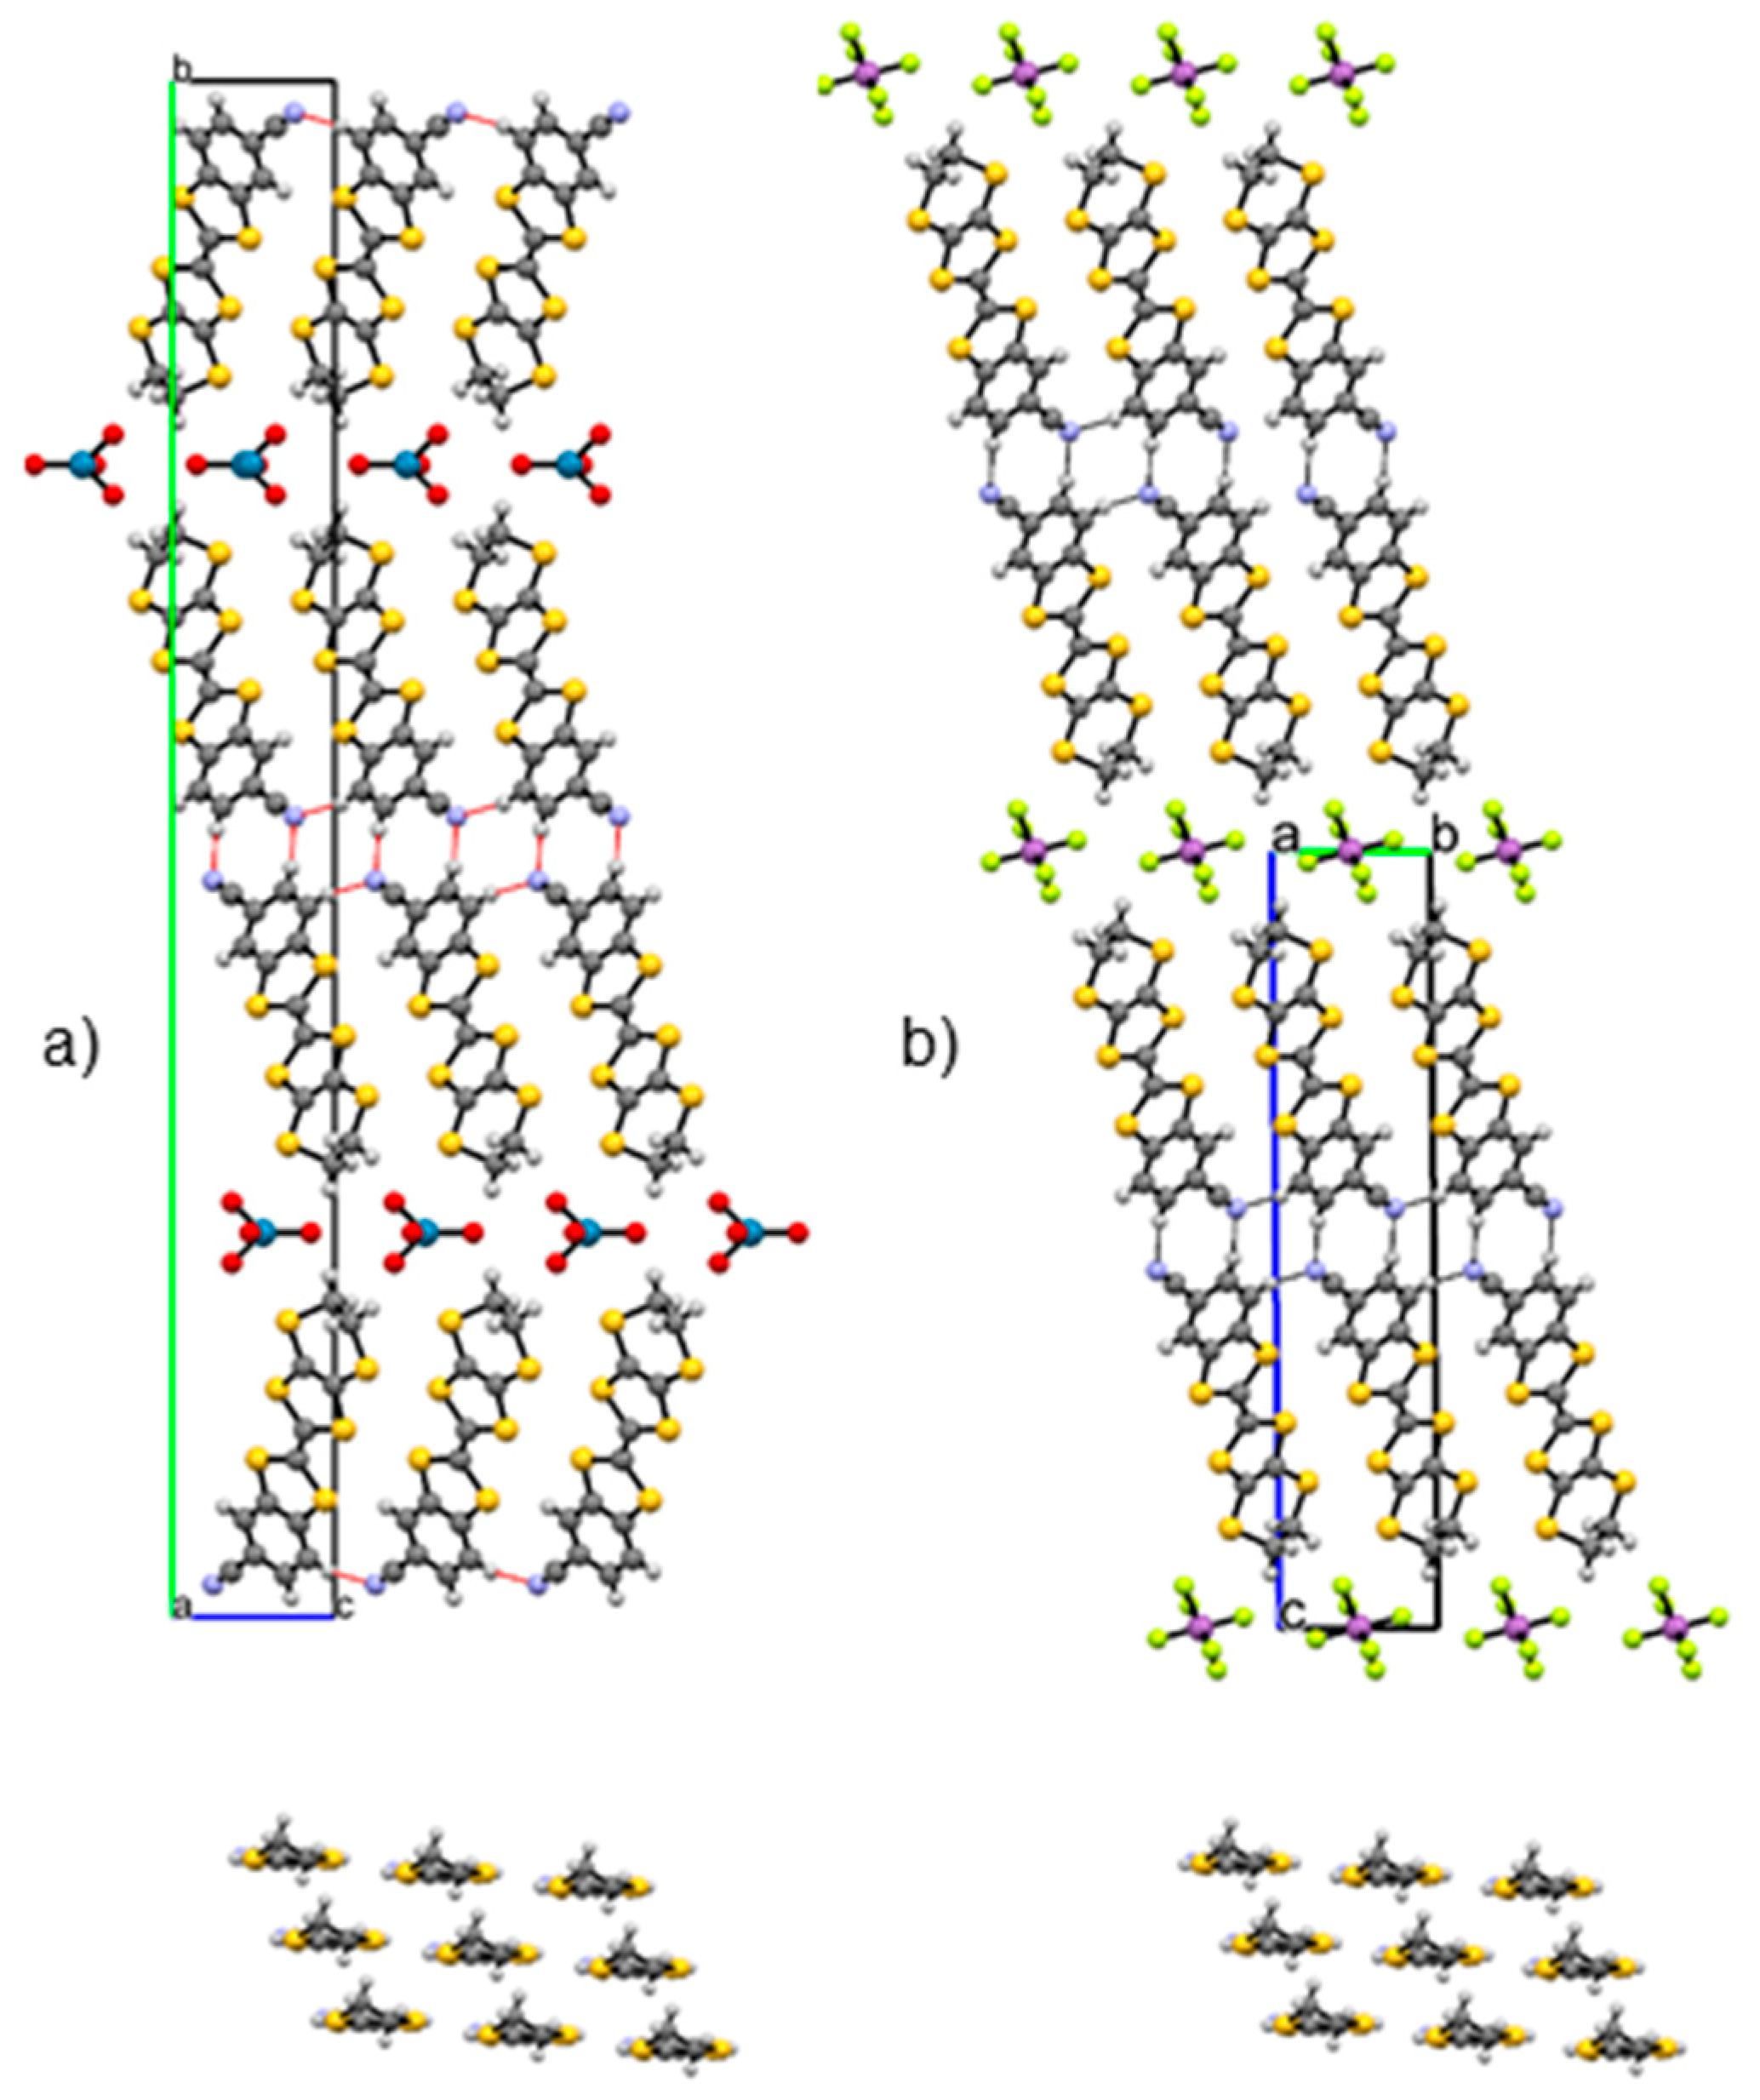
3.1. Crystal Structure

The crystal structures of the ReO4 and SbF6 salts (Figure 2) are isostructural to those previously described for ClO4 and PF6 compounds with monoclinic and triclinic phases, respectively, with almost identical cell parameters (Table 1), and they will therefore not be described in detail here. In the SbF6 salt, the reduced number of reflections results from the intrinsic low intensity of many reflections; in spite of the the poor quality of the structural refinement, it is clear that the compound is isostructural with the PF6 salt previously described [2]. It should be noted that for compounds of this donor with ClO4 anions, monoclinic and triclinic polymorphs were both described, associated with alternating or uniform tilting, respectively, of donor molecules in successive layers, which otherwise present identical β″-type packing pattern of donors, arranged head to head, in bilayers and with intermolecular contacts that are comparable to those previously observed in the compounds of this family [7]. However, in several ReO4 crystals that were measured during the present work, only the monoclinic phase was found, while in crystals of the SbF6 compound only the triclinic phase was found as previously described also for PF6 [2]. A common feature to the crystal structures of these new and the previously described compounds is the disorder of the anions, which were found in partially occupied positions. In addition for the Re compound, the perrhenate anion was found to be disordered over two positions (68 and 32%). This disorder might result from anionic layers having a two-dimensional (2D) ordered arrangement of anions alternating in fully occupied and empty positions, with a doubling of cell parameters along the layers, but lacking correlation between the arrangements of successive anion layers, thus the observed crystal structure being an average.
It should also be noticed that, while the bilayer donor packing is comparable in all of these compounds, the ratio between the anion volume and the free volume between the donors is estimated as 66.9/209.6, 93.1/257.3, and 86.0/208.3 for the ClO4, SbF6, and ReO4 compounds respectively, the last compound with stroguer donor-anion interactions.

3.2. Electronic Transport Properties

The electrical resistivity of (CNB-EDT-TTF)4ClO4, (CNB-EDT-TTF)4ReO4, and (CNB-EDT-TTF)4SbF6 was measured in single crystals along the long plate axis while using the standard four-point method. This is the crystallographic axis a, which corresponded to the donor stacking direction. For all three compounds, the room temperature conductivity was found in the range 5–18 (Ωcm)−1 with temperature dependence being significantly dependent on the individual sample.
The present study extends to lower temperatures measurements in (CNB-EDT-TTF)4ClO4 previously reported only down to approximately 20 K [2]. The electrical conductivity that was measured in different crystals originated from several batches, where crystal both monoclinic and triclinic phases were found, exhibited, at higher temperatures (>30 K), an identical behavior always with a clear metallic regime in agreement with previous reports (Figure 3c) [2,7]. However, at low temperatures, we observed a sample-dependent broad minimum of resistivity at ~23 K, reaching at 1.7 K values that were comparable to those at room temperature.
For (CNB-EDT-TTF)4SbF6, the electrical resistivity shows a comparable behavior with a sample dependent broad minimum at temperatures in the range 20–100 K, followed by an upturn of resistivity, upon cooling. The temperature of the minimum and the low temperature value of resistivity were both significantly sample dependent (Figure 3b). These sample-dependent minima in ρ(T) of ClO4 and SbF6 samples and the upturn of resistivity upon cooling are ascribed to intrinsic anion disorder effects, leading to progressive localization at low temperatures. This role of disorder is further confirmed by the low temperature behavior approaching a variation linear with the logarithm of temperature, as predicted for an impurity or disorder scattering regime [19] (see inset in Figure 3b) and also similar to the behavior that is observed in other anion disordered layered systems based on the donor BEDT-TTF [20]. It should be also mentioned that attempts to find Shubnikov-de Haas oscillations in the magnetoresistance, at 1.5 K, were unsuccessful for fields up to 16 T, probably due to the disorder present in the crystals.
For (CNB-EDT-TTF)4ReO4, in spite of identical room temperature values of the electrical conductivity, all of the samples showed a thermally activated behavior in ρ(T) below room temperature, (Figure 3a) although with an activation energy that is rather small in the range ~16–18 meV, which suggests that it results from a more severe disorder effects in crystals of this compound. The larger disorder effects seen in this ReO4 salt are certainly a consequence of the larger anion size that approches the limit of the void space available in the donor´s structure and imposes stronger interactions with donors.
In contrast to the electrical resistivity, the thermoelectric power, S, of all compounds shows a comparable behavior, which is identical to that previously described for the other members of this family of compounds (Figure 4) [2,6,8]. It is well known that thermopower, as a zero current measurement, is less sensitive to defects than electrical resistivity, probing the more conducting regions of the sample, thus being less sensitive to disorder effects. The thermoelectric power at room temperature presents large positive values of 75–80 µV/K, which slowly decrease until about 150 K upon cooling, and at lower temperatures displays a faster metal like decrease, approximately proportional to temperature down to 20 K, which denotes that the Fermi level lies in a continuum of states. These results indicate that the activated regime that is observed in the electrical resistivity of (CNB-EDT-TTF)4ReO4 is due to disorder localization of states near the Fermi level and not to the opening of a gap.

3.3. Optical Pproperties

Figure 5 plotsthe obtained optical conductivity for the (CNB-EDT-TTF)4X crystals of the three different salts with X = ClO4 ReO4, and SbF6. The highest conductivity is found for (CNB-EDT-TTF)4ClO4, with a clear absorption edge around 8000 cm−1, present in both polarizations of the crystal plane [panels (a) and (b)]. As the temperature is reduced, σ(ω;T) monotonously increases all the way down to T = 30 K, which indicates a 2D metallic behavior almost isotropic in plane as expected from band structure calculations. It should be mentioned that the small dimensions of the crystals have so far precluded the measurement of the anisotropy of electrical conductivity while using dc or low frequency measurements. Below the minima of ρ(T) at ~23 K, a significant drop is observed, which is in good agreement with the dc transport data displayed in Figure 3. The sibling compounds (CNB-EDT-TTF)4ReO4 and (CNB-EDT-TTF)4SbF6 do not exhibit similar features. Instead, for the latter a strong and broad band appears around 10,000 cm−1 for the polarization parallel to the needle, but also perpendicular to the crystal plane, although less pronounced. In the out of plane polarization, this mode is also seen for the ClO4 compound. We attribute these high-energy features to excitations between the electronic bands. It is interesting to note that these features are strongly suppressed for (CNB-EDT-TTF)4ReO4 and (CNB-EDT-TTF)4SbF6 along the in plane polarization perpendicular to the needle axis [panels (e) and (h)].
The mid-infrared spectrum that was recorded with the electric field perpendicular to the needle axis was dominated by a double structure that became much more enhanced upon cooling. For all three compounds, the maxima in σ(ω) are seen around 1100 cm−1 and 2000 cm−1, essentially independent of temperature. Only weak indications of these features can be observed in the other polarizations for the tetrahedral anion compounds, while, for the SbF6 salt, they are more pronounced. Instead of two separate excitations, this double feature might, in fact, be a broad band with a pronounced antiresonance at 1500 cm−1. There, we expect the strong, electron-molecular vibration (emv)-coupled molecular vibration that involves the C=C double bonds, as discussed below.
As expected from the crystal structure perpendicularly to the crystal plane (donor layers), the optical conductivity is much lower and it only shows minor electronic features up to 10,000 cm−1. For (CNB-EDT-TTF)4ClO4, we see a gradual increase of σ(ω) up to the interband excitation with only weak temperature dependence. For the other two compounds, the perpendicular conductivity is even lower and essentially flat in temperature in the overall behavior, which indicates a strongly insulating response.

3.4. Vibrational Properties

In addition to the electronic contribution to the conductivity, we observe some distinct vibrational features, which range from 600 cm−1 all the way up to 3000 cm−1. In Table 2, the most prominent ones are listed; the table is by far not complete, because all the molecular vibrations are infrared active due to the non-centrosymmetric molecular structure.
Interestingly, the out of plane polarization does not exhibit the largest number of vibrational features, as commonly seen in other one- and two-dimensional charge transfer salts. For all compounds, the ν1 mode around 696 cm−1 is present within the plane and it appears very prominent. The temperature dependence is rather weak, in contrast to the ν3 mode, which exhibits a pronounced blue shift of approximately 4 cm−1 for all compounds. A similar tendency is observed for most of the other vibrational features.
A discussion of the molecular vibrations ν4, ν5, and ν14 can be found in the supplementary material, as well as for the anion vibrations. Here, let us focus on the modes ν12 and ν13 of (CNB-EDT-TTF)4ClO4, as this compound exhibits a pronounced upturn of resistivity upon cooling below about 23 K. In Figure 6, we display these modes on a larger scale in a waterfall plot, in order to illustrate the temperature evolution. The two features at 1538.1 cm−1 and at 1557.3 cm−1 exhibit sidebands as the temperature is reduced from T = 30 K to 10 K. We conclude from this observation that the upturn of electrical resistivity below approximately 23 K is associated with a change in the charge distribution; i.e. the donor molecules become non-equal. However, the effect is much smaller when compared to typical charge-order transitions, as observed in Fabre salts (TMTTF)2X [21,22,23]. We notice indications of these features already at higher temperatures due to charge fluctuations frequently observed in comparable compounds [24].
A smaller effect of charge localization in 4:1 salts as compared with 2:1 salts is not unexpected, since there are more molecules among which the charge can be distributed, and a richer variety of localization patterns can be envisaged. Although the transition is rather smooth, slight structural changes are most likely to occur below 23 K. Figure 6 also shows the temperature evolution of some other modes. Here, we find that the blue shift typically observed for the thermal hardening upon cooling is reversed below 23 K. This might be related to the drop in optical conductivity that can be noticed in Figure 5a,b. It reduces the screening and might affect the vibrational features via the emv-coupling.
For detailed vibrational mode analysis of the three compounds with anions ClO4, ReO4, and SbF6, see supplementary material.

4. Conclusions

Two new members of the family of bilayer compounds β″-(CNB-EDT-TTF)4X, with anions X = ReO4 and SbF6, are reported, sharing with the ClO4 salt previously reported a vitually identical β″-type packing pattern of donors arranged in bilayers, separated by disordered planes of anions. The electron transport properties of these compounds, which behave as 2D metals, are quite sensitive to crystal quality, with the resistivity increasing upon cooling to lower temperatures in a fashion dependent on the samples, an effect that is ascribed to variable disorder leading to electron localization at low temperatures. These localisation effects are stronger in salts of larger anions.
The optical properties (CNB-EDT-TTF)4 ClO4 suggest that this salt below T = 23 K undergoes charge localisation. The vibrational features have been recorded in all three crystallographic directions for the first time in (CNB-EDT-TTF) salts. We do find close similarities among the three compounds, namely the anysotropy of the optical conductivity typical of layered conducting system, but also distinct differences, which may reflect different interactions between the donors and anions.

Supplementary Materials

The following are available online at https://www.mdpi.com/2073-4352/9/12/608/s1, Table S1: Strongest computed molecular vibrational modes of the charged CNB-EDT-TTF cation in the range from 700 to 3000 cm−1; Figure S1: Temperature evolution of the ν4 and ν5 modes in the tetrahedral ClO4, ReO4 and octahedral SbF6 anion salts; Figure S2: The C≡N stretching motion for different temperatures for (CNB-EDT-TTF)4ClO4, (CNB-EDT-TTF)4ReO4 and (CNB-EDT-TTF)4SbF6; Figure S3: Temperature dependence of the vibrational features related to the anion vibrations of ClO4 and ReO4 observed in the optical spectra.

Author Contributions

M.D. and M.A. conceived and designed the experiments; S.O., A.C.G. and V.G. performed the sample preparation and participated in all experiments; I.C.S. and S.R. analyzed the crystallographic data, E.B.L. and G.O. measured the electric transport properties, D.G. and A.R. measured the optical and vibrational properties, M.D., M.A. and S.R. wrote the paper with the contributions from all authors.

Funding

The work in Portugal was supported by FCT through contracts LISBOA-01-0145-FEDER-029666 and UID/Multi/04349/2013 and grants to S.O. (SFRH/BD/72722/2010) and A.C.G (SFRH/PD/BD/127804/2016). The research at the Universität Stuttgart is supported by the Deutsche Forschungsgemeinschaft.

Conflicts of Interest

The authors declare no conflict of interest. The funding sponsors had no role in the design of the study; in the collection, analyses, or interpretation of data; in the writing of the manuscript, and in the decision to publish the results.

References

  1. Oliveira, S.; Belo, D.; Santos, I.C.; Rabaça, S.; Almeida, M. Synthesis and characterization of the cyanobenzene-ethylenedithio-TTF donor. Beilstein J. Org. Chem. 2015, 11, 951–956. [Google Scholar] [CrossRef] [PubMed]
  2. Oliveira, S.; Ministro, J.; Santos, I.C.; Belo, D.; Lopes, E.B.; Rabaça, S.; Canadell, E.; Almeida, M. Bilayer Molecular Metals Based on Dissymmetrical Electron Donors. Inorg. Chem. 2015, 54, 6677–6679. [Google Scholar] [CrossRef] [PubMed]
  3. Etter, M.C.; MacDonald, J.C.; Bernstein, J. Graph-set analysis of hydrogen-bond patterns in organic crystals. Acta Crystallogr. Sect. B Struct. Sci. 1990, 46, 256–262. [Google Scholar] [CrossRef] [PubMed]
  4. Etter, M.C. Encoding and decoding hydrogen-bond patterns of organic compounds. Acc. Chem. Res. 1990, 23, 120–126. [Google Scholar] [CrossRef]
  5. Etter, M.C. Hydrogen bonds as design elements in organic chemistry. J. Phys. Chem. 1991, 95, 4601–4610. [Google Scholar] [CrossRef]
  6. Rabaça, S.; Oliveira, S.; Gama, V.; Santos, I.C.; Belo, D.; Lopes, E.B.; Canadell, E.; Almeida, M. Polymorphism and Superconductivity in Bilayer Molecular Metals (CNB-EDT-TTF)4I3. Inorg. Chem. 2016, 55, 10343–10350. [Google Scholar] [CrossRef] [PubMed]
  7. Rabaça, S.; Oliveira, S.; Gonçalves, A.C.; Gama, V.; Santos, I.C.; Belo, D.; Almeida, M. Cyanobenzene–Ethylenedithio–Tetrathiafulvalene Salts with ClO4: Bilayer Polymorphs and Different Stoichiometries. Cryst. Growth Des. 2017, 17, 2801–2808. [Google Scholar] [CrossRef]
  8. Rabaça, S.; Oliveira, S.; Gama, V.; Santos, I.C.; Oliveira, G.; Lopes, E.B.; Canadell, E.; Almeida, M. β″-(CNB-EDT-TTF)4BF4; Anion Disorder Effects in Bilayer Molecular Metals. Crystals 2018, 8, 142. [Google Scholar] [CrossRef]
  9. Sheldrick, G.M. SADABS; Bruker AXS Inc.: Madison, WI, USA, 2004. [Google Scholar]
  10. Bruker. SMART and SAINT; Bruker AXS Inc.: Madison, WI, USA, 2004. [Google Scholar]
  11. Altomare, A.; Burla, M.C.; Camalli, M.; Cascarano, G.; Giacovazzo, G.; Guagliardi, A.; Moliterni, A.G.G.; Polidori, G.; Spagna, R.J. SIR97: A new tool for crystal structure determination and refinement. Appl. Crystallogr. 1999, 32, 115–119. [Google Scholar] [CrossRef]
  12. Sheldrick, G.M. A short history of SHELX. Acta Cryst. 2008, A64, 112–122. [Google Scholar] [CrossRef] [PubMed]
  13. Farrugia, L.J. WinGX and ORTEP for Windows: An update. J. Appl. Cryst. 2012, 45, 849–854. [Google Scholar] [CrossRef]
  14. Macrae, C.F.; Bruno, I.J.; Chisholm, J.A.; Edgington, P.R.; McCabe, P.; Pidcock, E.; Rodriguez-Monge, L.; Taylor, R.; van de Streek, J.; Wood, P.A.J. New Features for the Visualization and Investigation of Crystal Structures. Appl. Cryst. 2008, 41, 466–470. [Google Scholar] [CrossRef]
  15. Chaikin, P.M.; Kwak, J.F. Apparatus for thermopower measurements on organic conductors. Rev. Sci. Instrum. 1975, 46, 218–220. [Google Scholar] [CrossRef]
  16. Almeida, M.; Alcácer, L.; Oostra, S. Anisotropy of Thermo-power in N-methyl-N-Ethylmorpholinium Bistetracyanoquinodime-thane, MEM(TCNQ)2, in the Region of the High-Temperature Phase Transitions. Phys. Rev. B Condens. Matter Mater. Phys. 1984, 30, 2839–2844. [Google Scholar] [CrossRef]
  17. Lopes, E.B. INETI-Sacavém; Internal Report; INETI Press: Sacavém, Portugal, 1991. [Google Scholar]
  18. Huebener, R.P. Thermoelectric Power of Lattice Vacancies in Gold. Phys. Rev. 1964, 135, A1281. [Google Scholar] [CrossRef]
  19. Altshuler, B.L.; Aronov, A.G. Electron-Electron Interaction in Disordered Conductors. In Electron-Electron Interactions in Disordered Systems; Efros, A.L., Pollak, M., Eds.; Elsevier: Amsterdam, The Netherlands, 1985; Volume 10, pp. 1–690. [Google Scholar]
  20. Prokhorova, T.G.; Yagubskii, E.B.; Zorina, L.V.; Simonov, S.V.; Zverev, V.N.; Shibaeva, R.P.; Buravov, L.I. Specific Structural Disorder in an Anion Layer and Its Influence on Conducting Properties of New Crystals of the (BEDT-TTF)4A+[M3+(ox)3]G Family, Where G Is 2-Halopyridine; M Is Cr, Ga; A+ Is [K0.8(H3O)0.2]+. Crystals 2018, 8, 92. [Google Scholar] [CrossRef]
  21. Dressel, M.; Drichko, N. Optical Properties of Two-Dimensional Organic Conductors: Signatures of Charge Ordering and Correlation Effects. Chem. Rev. 2004, 104, 5689–5716. [Google Scholar] [CrossRef] [PubMed]
  22. Dressel, M.; Dumm, M.; Knoblauch, T.; Masino, M. Comprehensive Optical Investigations of Charge Order in Organic Chain Compounds (TMTTF)2X. Crystals 2012, 2, 528–578. [Google Scholar] [CrossRef]
  23. Rösslhuber, R.; Rose, E.; Ivek, T.; Pustogow, A.; Breier, T.; Geiger, M.; Schrem, K.; Untereiner, G.; Dressel, M. Structural and Electronic Properties of (TMTTF)2X Salts with Tetrahedral Anions. Crystals 2018, 8, 121. [Google Scholar] [CrossRef]
  24. Ivek, T.; Korin-Hamzić, B.; Milat, O.; Tomić, S.; Clauss, C.; Drichko, N.; Schweitzer, D.; Dressel, M. Electrodynamic response of the charge ordering phase: Dielectric and optical studies of α-(BEDT-TTF)2I3. Phys. Rev. B 2011, 83, 165128. [Google Scholar] [CrossRef] [Green Version]
Figure 1. CNB-EDT-TTF (5-cyanobenzene-ethylenedithio-tetrathiafulvalene).
Crystals 09 00608 g001
Figure 2. Crystal structure of monoclinic (CNB-EDT-TTF)4ReO4, (a) and triclinic (CNB-EDT-TTF)4SbF6, (b). Top, views of the crystal structures along the crystallographic axis a, (anion positions depicted have 0.5 occupation factor) the thin lines (pink on (a) and blue in (b)) denote the C-NH interactions. Bottom, partial view of one donor layer along the donor long axis, illustrating the β″-type packing pattern. Atoms color scheme: grey (C); yellow (S); lime (F); medium slate blue (N); dodger blue (Re); red (O); blue violet (Sb); white (H).
Crystals 09 00608 g002
Figure 3. Temperature dependence of the electrical resistivity ρ measured in different crystals along their main crystal axis of (CNB-EDT-TTF)4ReO4 (a), (CNB-EDT-TTF)4SbF6 (b), and (CNB-EDT-TTF)4ClO4 (c). The inset in (b) shows the low temperature data plotted as a function of log T. The diferent colors in (a,b) show the diferent resistivity beahviour specially at low temperatures for for 3 diferent samples.
Crystals 09 00608 g003
Figure 4. Temperature dependence of absolute thermoelectric power S in different crystals of (CNB-EDT-TTF)4ReO4, (CNB-EDT-TTF)4SbF6, and (CNB-EDT-TTF)4ClO4.
Crystals 09 00608 g004
Figure 5. Overall picture of the optical conductivity of (CNB-EDT-TTF)4ClO4 (panels ac), (CNB-EDT-TTF)4ReO4 (panels df), and (CNB-EDT-TTF)4SbF6 (panels gi) for the three directions obtained from reflectivity measurements at different temperatures, as indicated. Note the logarithmic scale in frequency and the different axes of ordinates.
Crystals 09 00608 g005
Figure 6. Temperature evolution of some molecular vibrations observed in (CNB-EDT-TTF)4ClO4: (a) for the modes ν12 and ν13 we observe a splitting, as the temperature drops below 30 K; (bd) for most other modes, we observe a hardening when cooled down from room temperature, but below 30 K the modes exhibit a red shift. Note that the spectra are shifted with respect to each other for clarity.
Crystals 09 00608 g006
Table 1. Crystal data for β″-(CNB-EDT-TTF)4X4 compounds with different anions X.
XReO4SbF6
Empirical formulaC52H28N4O4ReS24C26H14F3N2S12Sb0.5
Formula weight1728.42856.99
Temperature (K)150(2)150(2)
Crystal system, space groupMonoclinic, P21/mTriclinic, P−1
a (Å)4.8817(3)4.8532(4)
b (Å)54.581(3)5.8046(5)
c (Å)5.8117(4)28.368(2)
α (°)90.0089.054(4)
β (°)95.376(4)86.377(4)
γ (°)90.0084.651(4)
V (Å3)1541.70(17)794.03(11)
Z, DCal(mg/m3) 1, 1.8621, 1.792
Absorption coeff. µ (mm−1)2.8341.284
Crystal size (mm)0.50 × 0.05 × 0.020.50 × 0.08 × 0.02
θ range for data collection (°)3.52 to 25.352.158 to 26.451
Index range (h, k, l)−5/5, −64/65, −6/6−6/6, −5/7, −35/35
Reflections collected / unique11339 / 2821 [R(int) = 0.0515]10330 / 2821 [R(int) = 0.0372]
Completeness to θ25.24  99.4%25.242  86.9%
Data / restraints / parameters2821 / 6 / 2042821 / 0 / 208
Goodness-of-fit on F21.0491.197
Final R indices [I > 2σ(I)]R1 = 0.0774, wR2 = 0.2044R1 = 0.0996, wR2 = 0.2268
Largest difference peak and hole (e Å3)3.520 and −1.5760.759 and −1.101
CCDC reference1,921,0721,921,071
Table 2. Vibrational modes frequencies (cm−1) of (CNB-EDT-TTF)4ClO4, (CNB-EDT-TTF)4ReO4, and (CNB-EDT-TTF)4SbF6 extracted from the optical spectra recorded at T = 10 K.
Mode(CNB-EDT-TTF)4ClO4(CNB-EDT-TTF)4ReO4(CNB-EDT-TTF)4SbF6
E ‖ NeedleE⊥ NeedleE ⊥ PlaneE ‖ NeedleE ⊥ NeedleE ⊥ PlaneE ‖ NeedleE ⊥ NeedleE ⊥ Plane
ν1697.2697.2 695.7695.5s 696.2s696.1
ν2777.7 775.7 777.6
ν3835.0s835.0834.7833.1s833.6834.1s835.4s835.5835.6s
ν4862.1862.8 864.0866.6 864.1863.0
ν5877.5876.5 875.5875.6 874.8875.4
ν6897.0 902.7s902.9 899.1894.2
ν71196.9 1196.11196.01198.31195.81196.7 1196.0
ν81286.71285.31286.61288.01285.0 1286.31285.01286.7
ν91388.61387.6 1387.71388.81387.7
ν101463.41464.11460.21463.5 1461.41464.31457.01460.0
ν11 1498.5a 1505.7a1505.7a1522.6a
ν12 1538.1 1537.01538.0 1537.71538.0
ν13 1557.3 1553.01546.1 1553.41556.1
ν142234.72235.72235.52232.22234.02233.62236.2s2234.8s2236.6
ν153017.9 3017.9
ν163076.23085.0 3071.0

