Article

Avalanches in Compressed Sandstone: Crackling Noise under Confinement

1
School of Civil Engineering, Chongqing University, Chongqing 400044, China
2
State Key Laboratory of Coal Mine Disaster Dynamics and Control, Chongqing University, Chongqing 400044, China
3
Departament de Física de la Matèria Condensada, Facultat de Física, Universitat de Barcelona, Martíi Franquès, 1. 08028 Barcelona, Catalonia
4
Department of Earth Sciences, University of Cambridge, Cambridge CB2 3EQ, UK
*
Author to whom correspondence should be addressed.
Crystals 2019, 9(11), 582; https://doi.org/10.3390/cryst9110582
Submission received: 12 October 2019 / Revised: 3 November 2019 / Accepted: 6 November 2019 / Published: 7 November 2019

Abstract

:
The acoustic emission, AE, from avalanches of local cracks and microstructural changes of sandstone under confined compression have been reported. These avalanches soften the underlying minerals and play a key role as indicators for the prediction of geo-engineering disasters, such as mining collapses, rock outbursts caused by high ground stress, and man-made quakes by fracking. Compressed sandstone is a model material for the investigation of avalanches. The avalanche energies, amplitudes, and waiting times show the probability distributions that allow us to distinguish between three compression stages; namely, (I) pre-failure, (II) correlated failure, and (III) post-failure. The energy of stage I and stage II is power-law distributed and scale invariant, while post-failure experiments show power laws with high exponential damping (friction). The scaling behavior is close to the predictions of a mean-field (MF) model (stage II) and a force-integrated mean-field model (stage I). Confinement shifts the value of the energy exponent closer to the MF prediction. Omori’s law and waiting time distributions are independent of stress during the compression; their scaling exponents are very similar to those found in seismological studies.

1. Introduction

Avalanches are manifestations of jerky responses under slowly changing fields spanning a wide parameter space. Typical examples are magnetic materials, which magnetize via jumps of the magnetization known as Barkhausen noise [1]. Other dynamic physical systems with avalanches include sheared granular materials [2,3], plastically deformed crystals [4,5], ferroelectric switching [6], collapse of porous materials [7,8], neuronal networks [9], gravitational wave detection [10], and even stellar evolution [11]. Among these systems, the failure of porous materials has recently received much attention [12]. One motivation to investigate porous crackling noise emerges from practical applications, such as the need to understand: catastrophic events in the mining industry [7,13], buildings [14], crash-absorbers in cars [15], crashing bones [16], and wood [17]. The other motivation stems from the surprisingly high degree of universality for the avalanche processes, of which virtually all exhibit power-law statistical properties, while their mechanisms are widely different. As porous materials have given the strongest avalanche signals so far, they became the model material for wider classes of materials.
Experimentally, avalanches are often studied by the acoustic emission (AE) technique [18,19,20,21,22,23,24,25,26,27]. Compared with data sets from the collapse of porous materials such as sandstone, AE signals from other scenarios are usually weaker. For example, ferroic avalanches and kink movements usually show weak AEs [28]. This makes the collapse of sandstone a key model for other processes which follow the same statistical pathway. Furthermore, the statistical characteristics of porous materials failures share many similarities with earthquakes. A very complete study comparing the AE of Vycor glass under uniaxial compression and an earthquake, was reported in [29]. Seismological observations, including the Gutenberg–Richter law, hold in Vycor spanning nearly seven decades of jerk energies.
It was shown [30] three years ago that crackling noise changes its distribution exponents from a non-critical steady state to an all-important precursor regime before sandstone samples collapse, which means that the prediction of the collapse is possible in principle. This result is consistent with results from computer simulations [31,32]. Experimentally, rock outbursts by high geo-stresses, mining and tunnel collapse under deep in-situ stress, and quakes induced by fracking, show all the hallmarks of avalanche behavior under confining stress [7,8,14,15,16,17,29,30]. The question is then: what are the avalanche characteristics under confined compression? Although the evolution of micro-fractures under multi-axial compression was first studied over fifty years ago [33], a comprehensive understanding of avalanches under confined compression is still missing. In this paper, we derive the avalanche statistics of sandstone under confinement by AE, and compare it with mean-field theory and previous studies to promote the applications of microseismic methods for environmental and ecological risk assessment.

2. Experimental

We used confinement (σ2 = σ3 < σ1) equipment under constant displacement. Confined compressive tests were conducted using the MTS-815 (MTS Systems Corporation, Eden Prairie, MN, USA) material test system. The vertical stress (σ1) is produced by the vertical compression plates, and the confining stresses (σ2 = σ3 = 5 MPa, 10 MPa, and 15 MPa were used in this study) are provided by the confining oil pressure (Figure 1), and for every confining stress level, three sandstone samples were used. The displacement rate du/dt is 0.1 mm/min. The samples were sandstone selected from the Triassic region in southwest of China, Chongqing. Rock samples were prepared according to the International Society of Rock Mechanics’ testing guidelines [34]. The sample shapes were cylindrical with 50 mm diameters and 100 mm lengths. The porosity was 18%, and the bulk density of sandstone was 2.2 g/cm3. Sandstone samples were composed of quartz 65%, feldspar 12%, muscovite 9%, kaolinite 5%, clay minerals 5.5%, and 3.5% other minerals. AE sensors were embedded in the vertical compression plates (Figure 1) to capture the acoustic emission signals during the compression. To remove the background noise before the sandstone experiment, steel cylinders were used in control experiments. A threshold of 45 dB for the AE detection was determined. The thickness of the compression plates between the sandstone sample and AE sensors was 0.5 mm, and the surfaces between samples and plates, and plates and sensors were acoustically coupled by a thin layer of Vaseline. The working frequency range of AE sensors (NANO-30 Physical Acoustics Company, Princeton, NJ, USA) extends from 150 kHz to 400 kHz. The electric signal was pre-amplified (40 dB) and transferred to the AE analysis system (PCI-2 from American Physical Acoustics Company with time resolution of 10 MHz, Princeton, NJ, USA). A hit started with the first crossing of the threshold. The peak definition time (PDT) was 35 μs, the hit definition time (HDT) was 150 μs, and the hit lockout time (HLT) was 300 μs (definitions in Figure 1). A proper setting of the PDT allows the correct identification of the signal peak for rise time and peak amplitude measurements, while HDT ensures that each AE signal is reported as one and only one hit. The AE system requires HLT to be optimized for the next signal detection.

3. Results

We extracted the avalanche energies E, amplitudes A, and waiting times δ from the jerk spectra by following the techniques described by Salje and Dahmen [35]. Absolute energies were obtained by numerical integration of the square voltage of signals E = 1/R t i t j U 2 ( t ) d t , where ti and tj are starting and ending times of the signal, and R = 10 kΩ is a reference resistance. The amplitude dB follows this relation, dB = (20lg(Vsensor/1μV)), where Vsensor is the peak voltage output from the sensor, and the brackets round the value to its nearest integer in dB. Waiting times are the difference between the two starting times of adjacent hits.
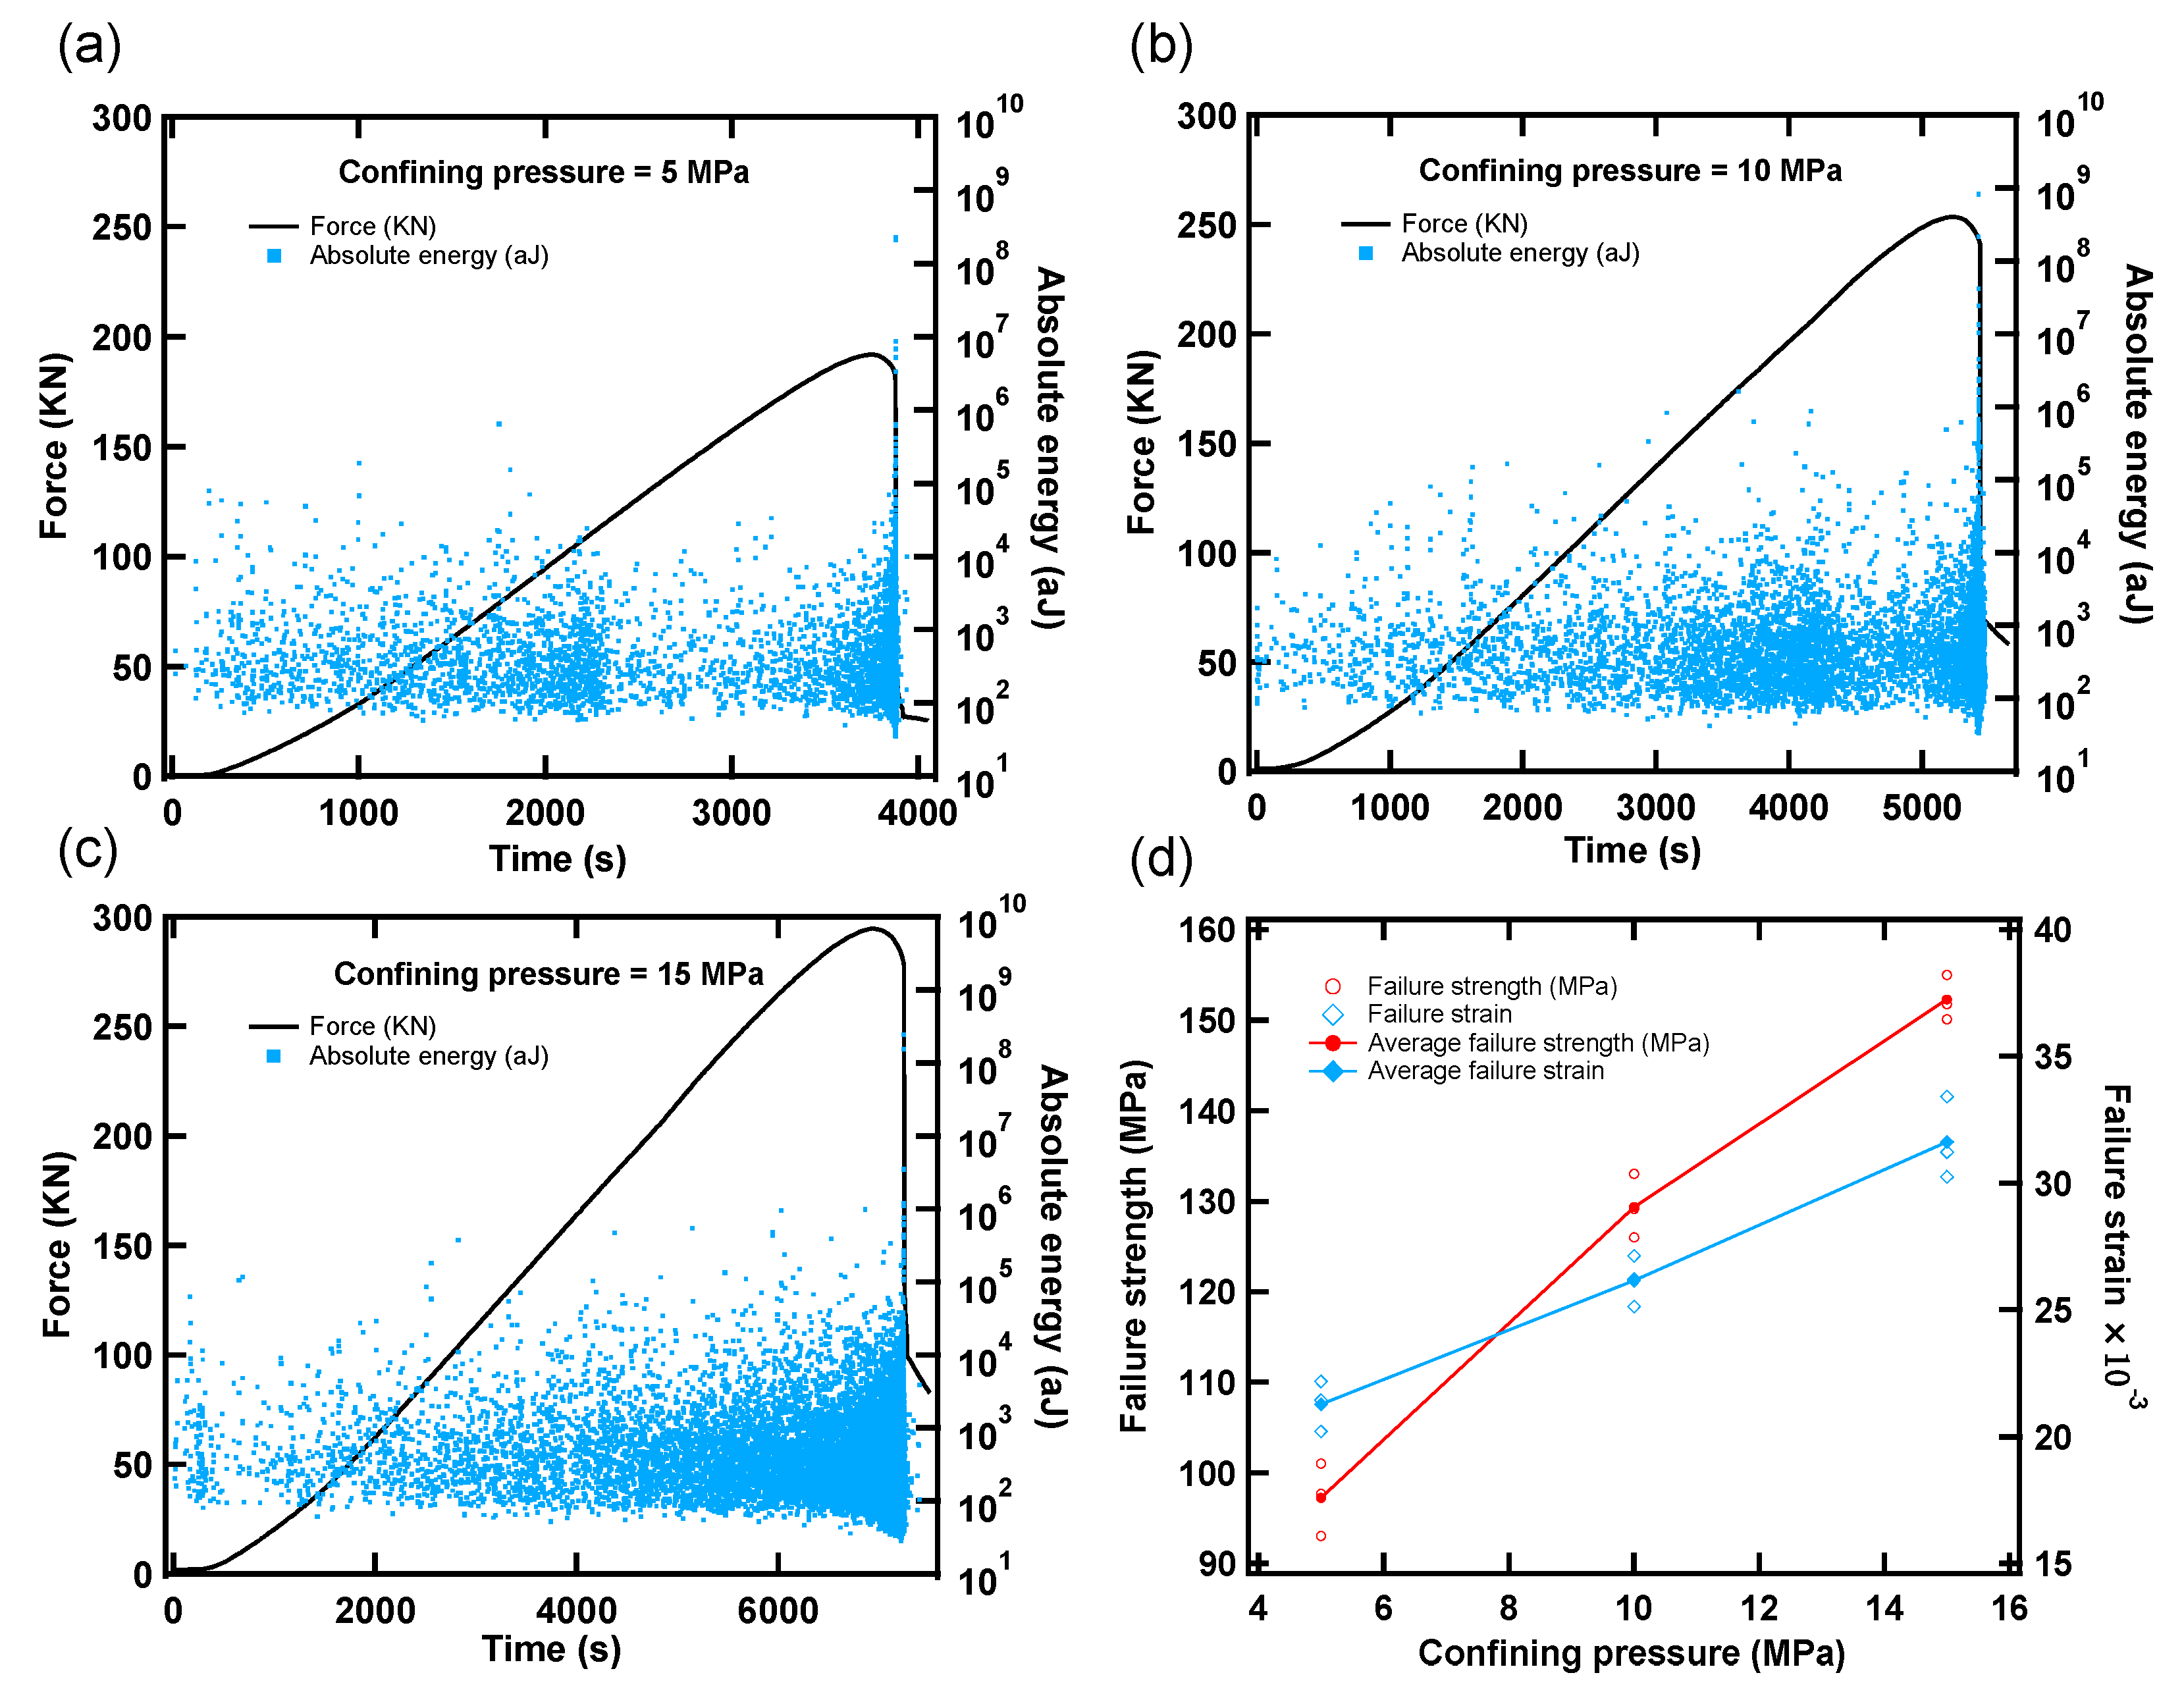
In our study, samples under the same confining stress showed similar statistical characteristics of their mechanical behavior and their acoustic emission. Figure 2a–c show typical stress–strain curves and AE spectra for different confining conditions. The failure strength and failure strain are approximately linear functions of the confining stress (see Figure 2d).
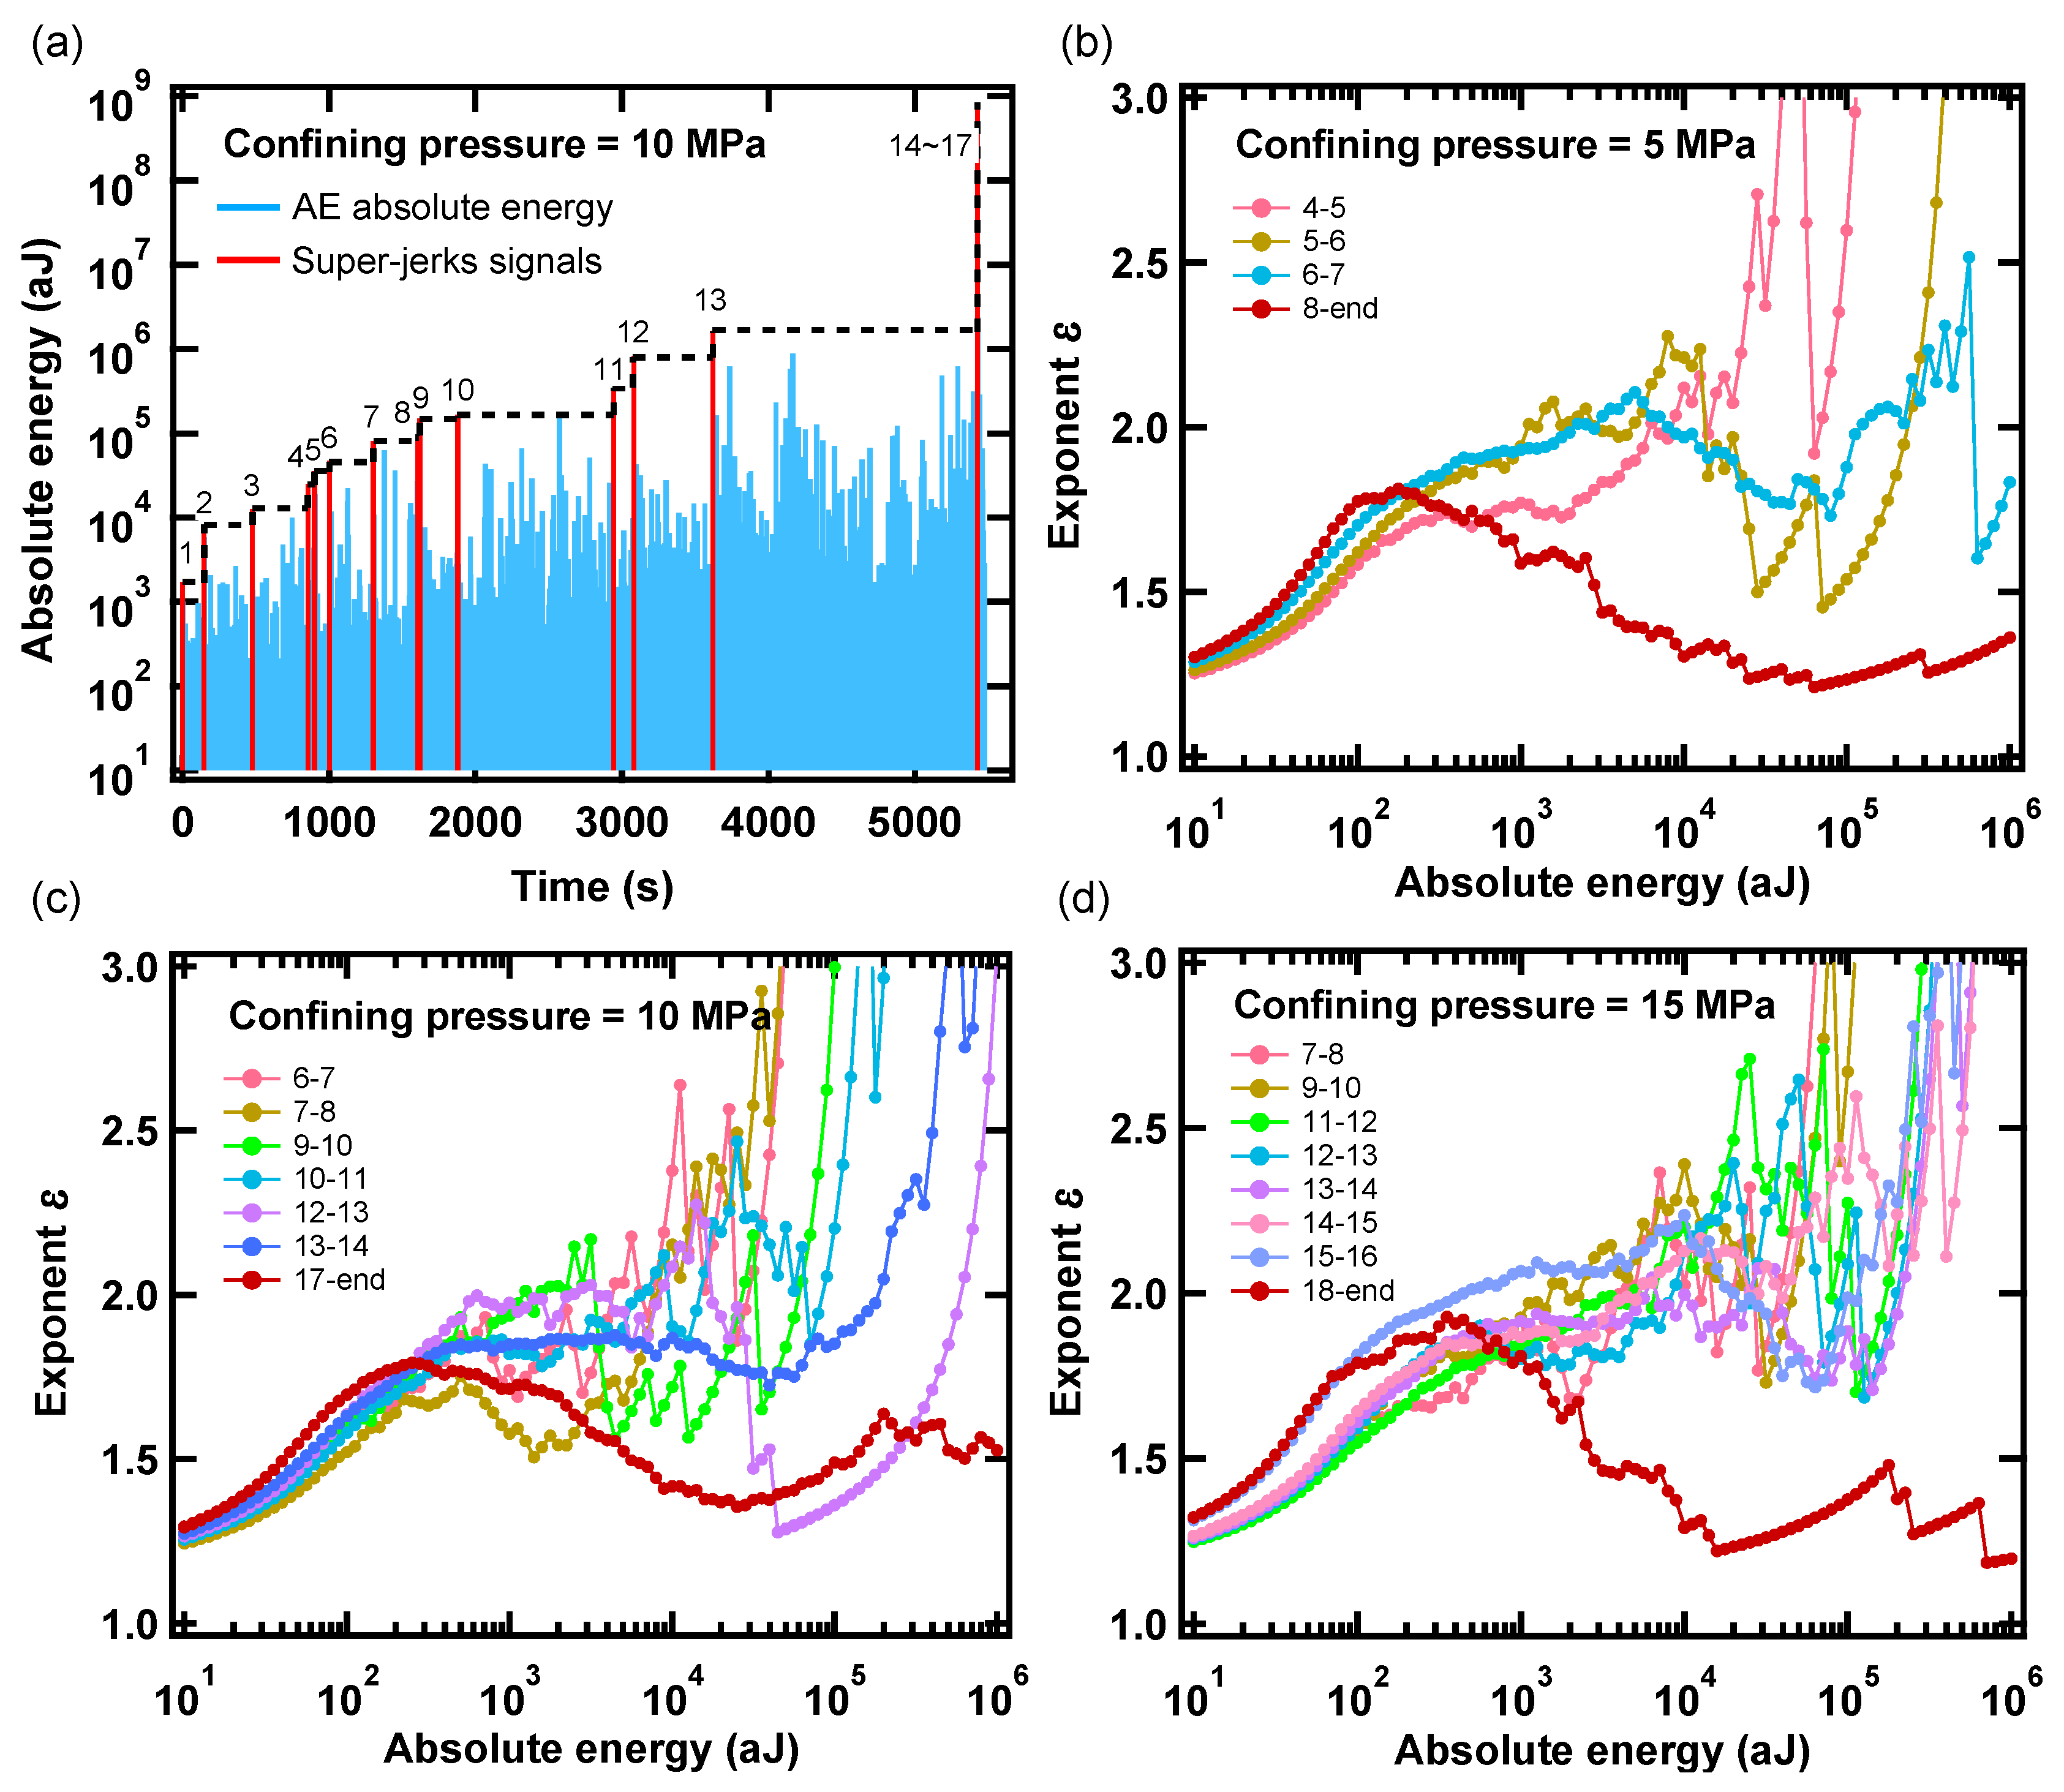
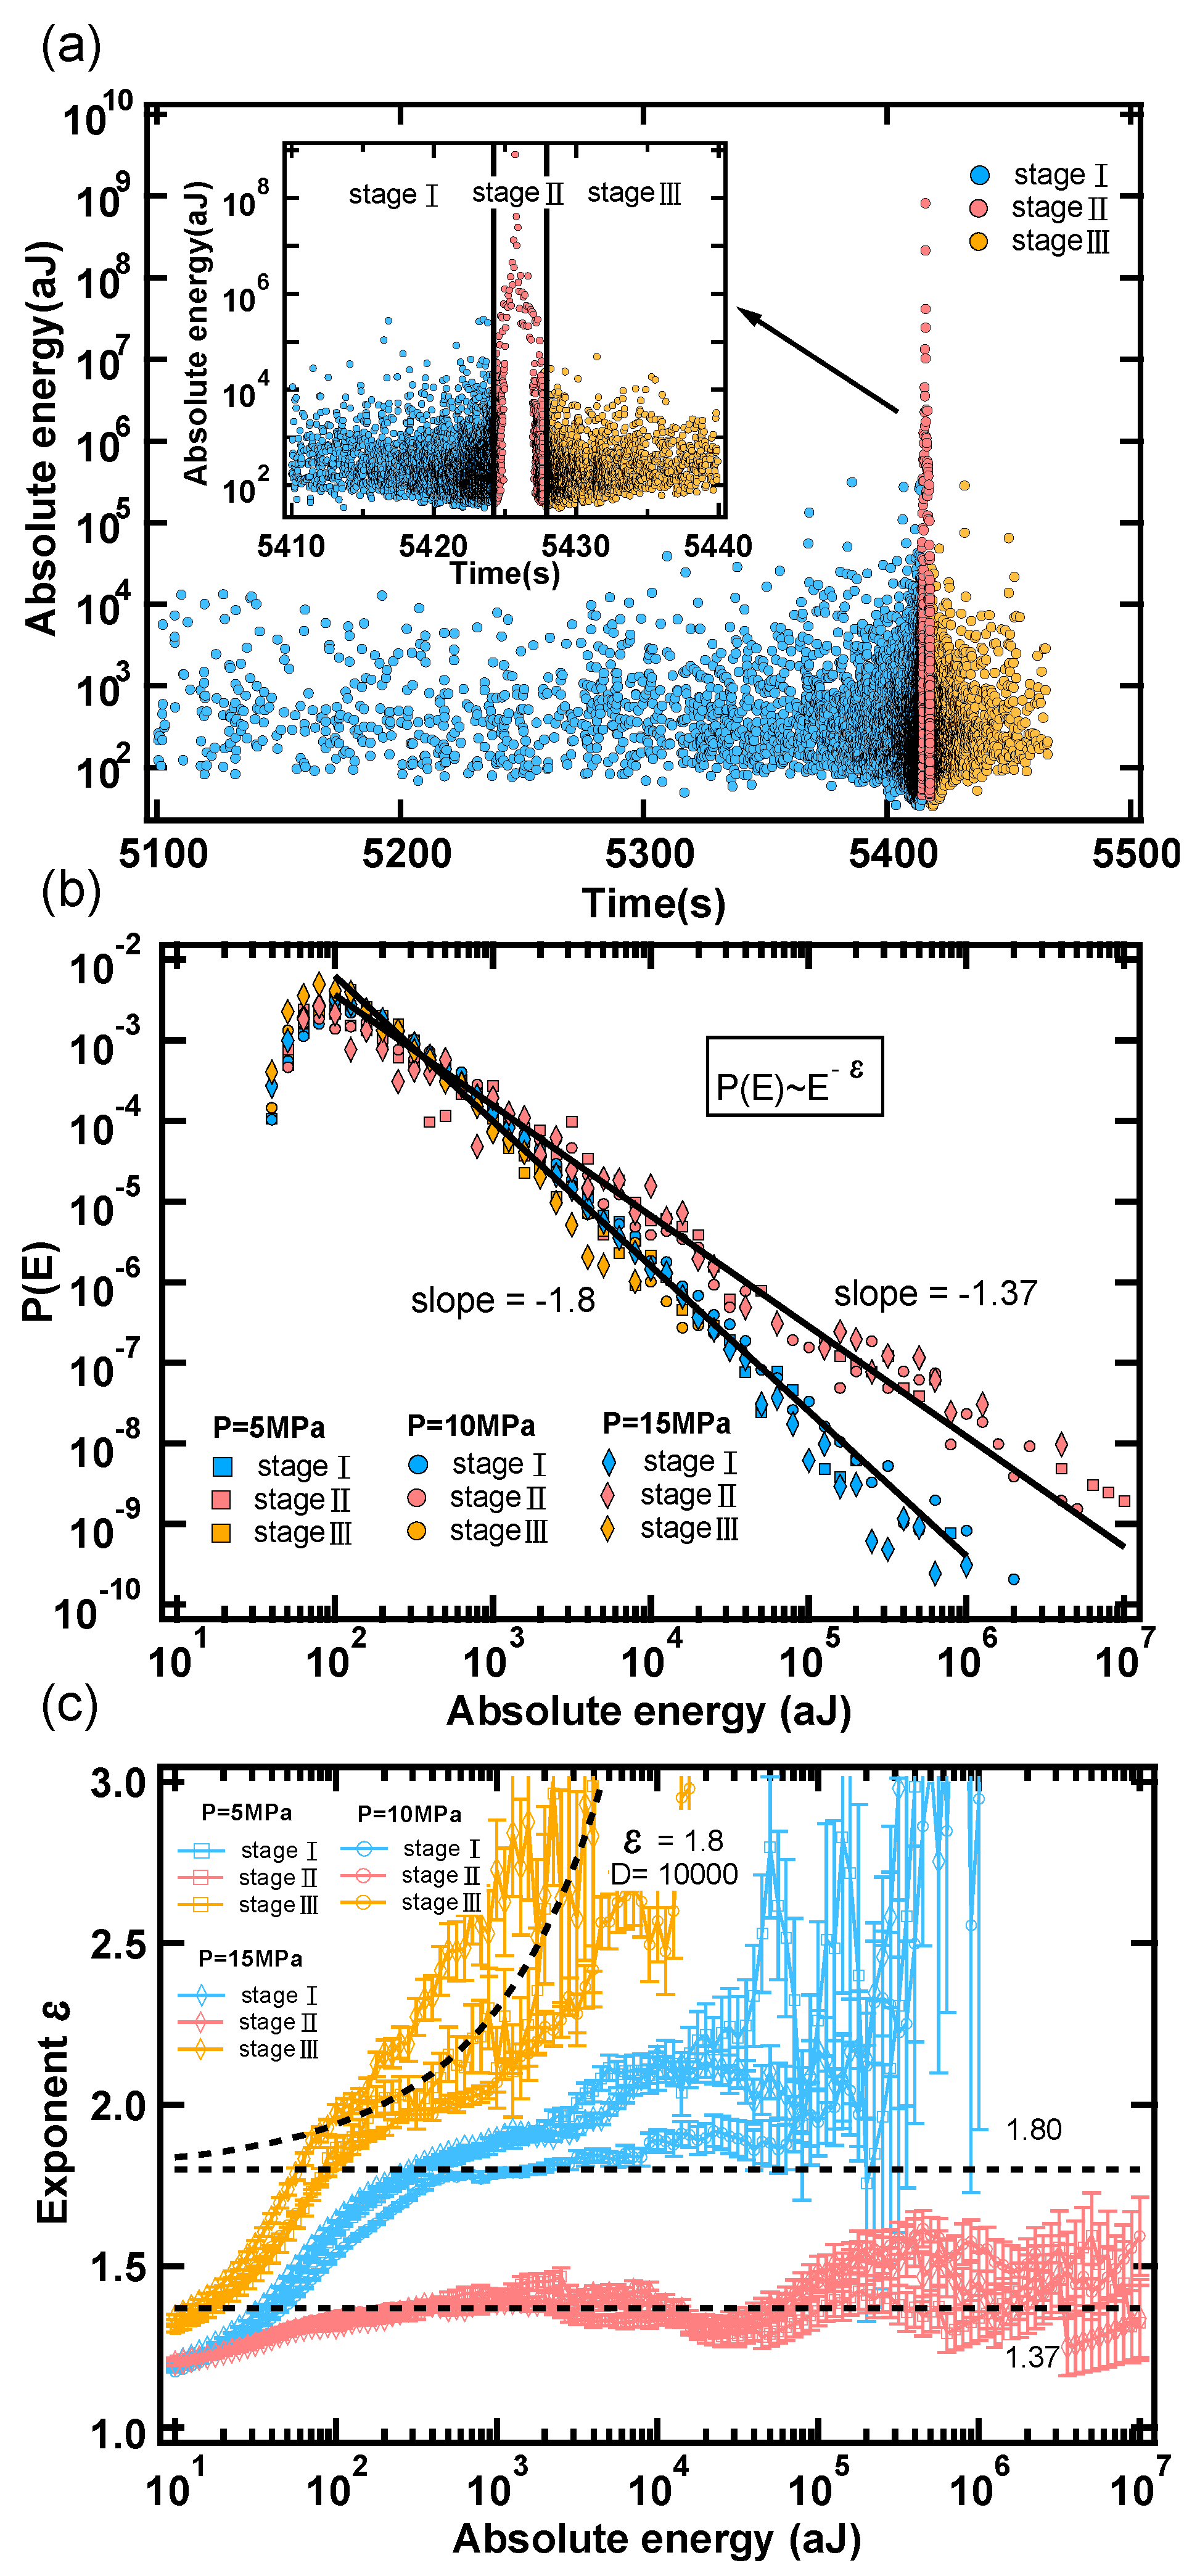
We reduced the AE spectrum from the whole set to subsets of super-jerks [36]. Figure 3a shows the AE spectrum and super-jerks of one sample under a confinement pressure of 10 MPa. A super-jerk is defined as an avalanche signal with energy greater than any previous event of the series (red signals in Figure 3a). They are numbered by their rank k = 1, 2…, and divide the full event series into small subsets. In every subset, we used the ML (maximum likelihood) method [37] to study the energy distribution. ML avoids the choice of bins and construction of histograms. If the data follows a power law, P(E)~ E−ε, according to the ML, the estimated exponent ε is: ε ( E min ) = 1 + n [ i = 1 n l n E i E m i n ] 1 , and the ML curve leads to a plateau for the exponent ε. The ML curves under confining pressures 5 MPa, 10 MPa, and 15 MPa are shown in Figure 3b–d. A recent theoretical study shows [38] that the shape of ML curves reflects whether the captured data correspond to a unique avalanche source, mixing of two avalanche sources, or exponential damping effects. The error of the ML analysis, Δ ε ( E min ) = ( ε 1 ) / n , is big at a large, absolute AE energy stage, and the vertical axis does not show all data points. Figure 3b–d shows a horizontally arranged S shape of the ML curve for the last subset, associated with mixing of two types of avalanches [38]. The last subsets start from the highest AE signal, which is associated with the major failure event of a sample. To investigate the avalanche behaviors in more detail, and identify the mixing effect, we divided the last subset into two stages; one is the correlated failure stage, and the other is the post-failure stage. Adding the early loading process, the whole compression process was, hence, divided into three stages; namely, (I) pre-failure, (II) correlated failure, and (III) a post-failure stage (Figure 4a shows the three stages for confining pressure = 10 MPa).

4. Discussion

The probability distribution function P(E) is shown in Figure 4b. It shows a power law, P(E)~ E−ε over nearly five decades for Stage I and Stage II. The exponent values are ca. εI = 1.8 and εII = 1.37 for Stage I and Stage II, which agree with previous results [14,30]. Stage III also shows power law behavior, but with shorter energy ranges. Figure 4c shows the ML analyses for different confining conditions. The ML curves of Stage I and Stage II show a plateau with similar exponents. The large error bars at high energies reflect the sparseness of the spectra with poor statistics. The ML of Stage III shows a continuously increasing trend typical for exponential damping. The PDF, probability density function, P(E) of Stage III can be modeled as (E)~ E−εexp(−E/D) [38]. The ML result of Stage III is shown in Figure 4c, with exponents, εIII = 1.8 and D = 1 × 10⁴ aJ−1.
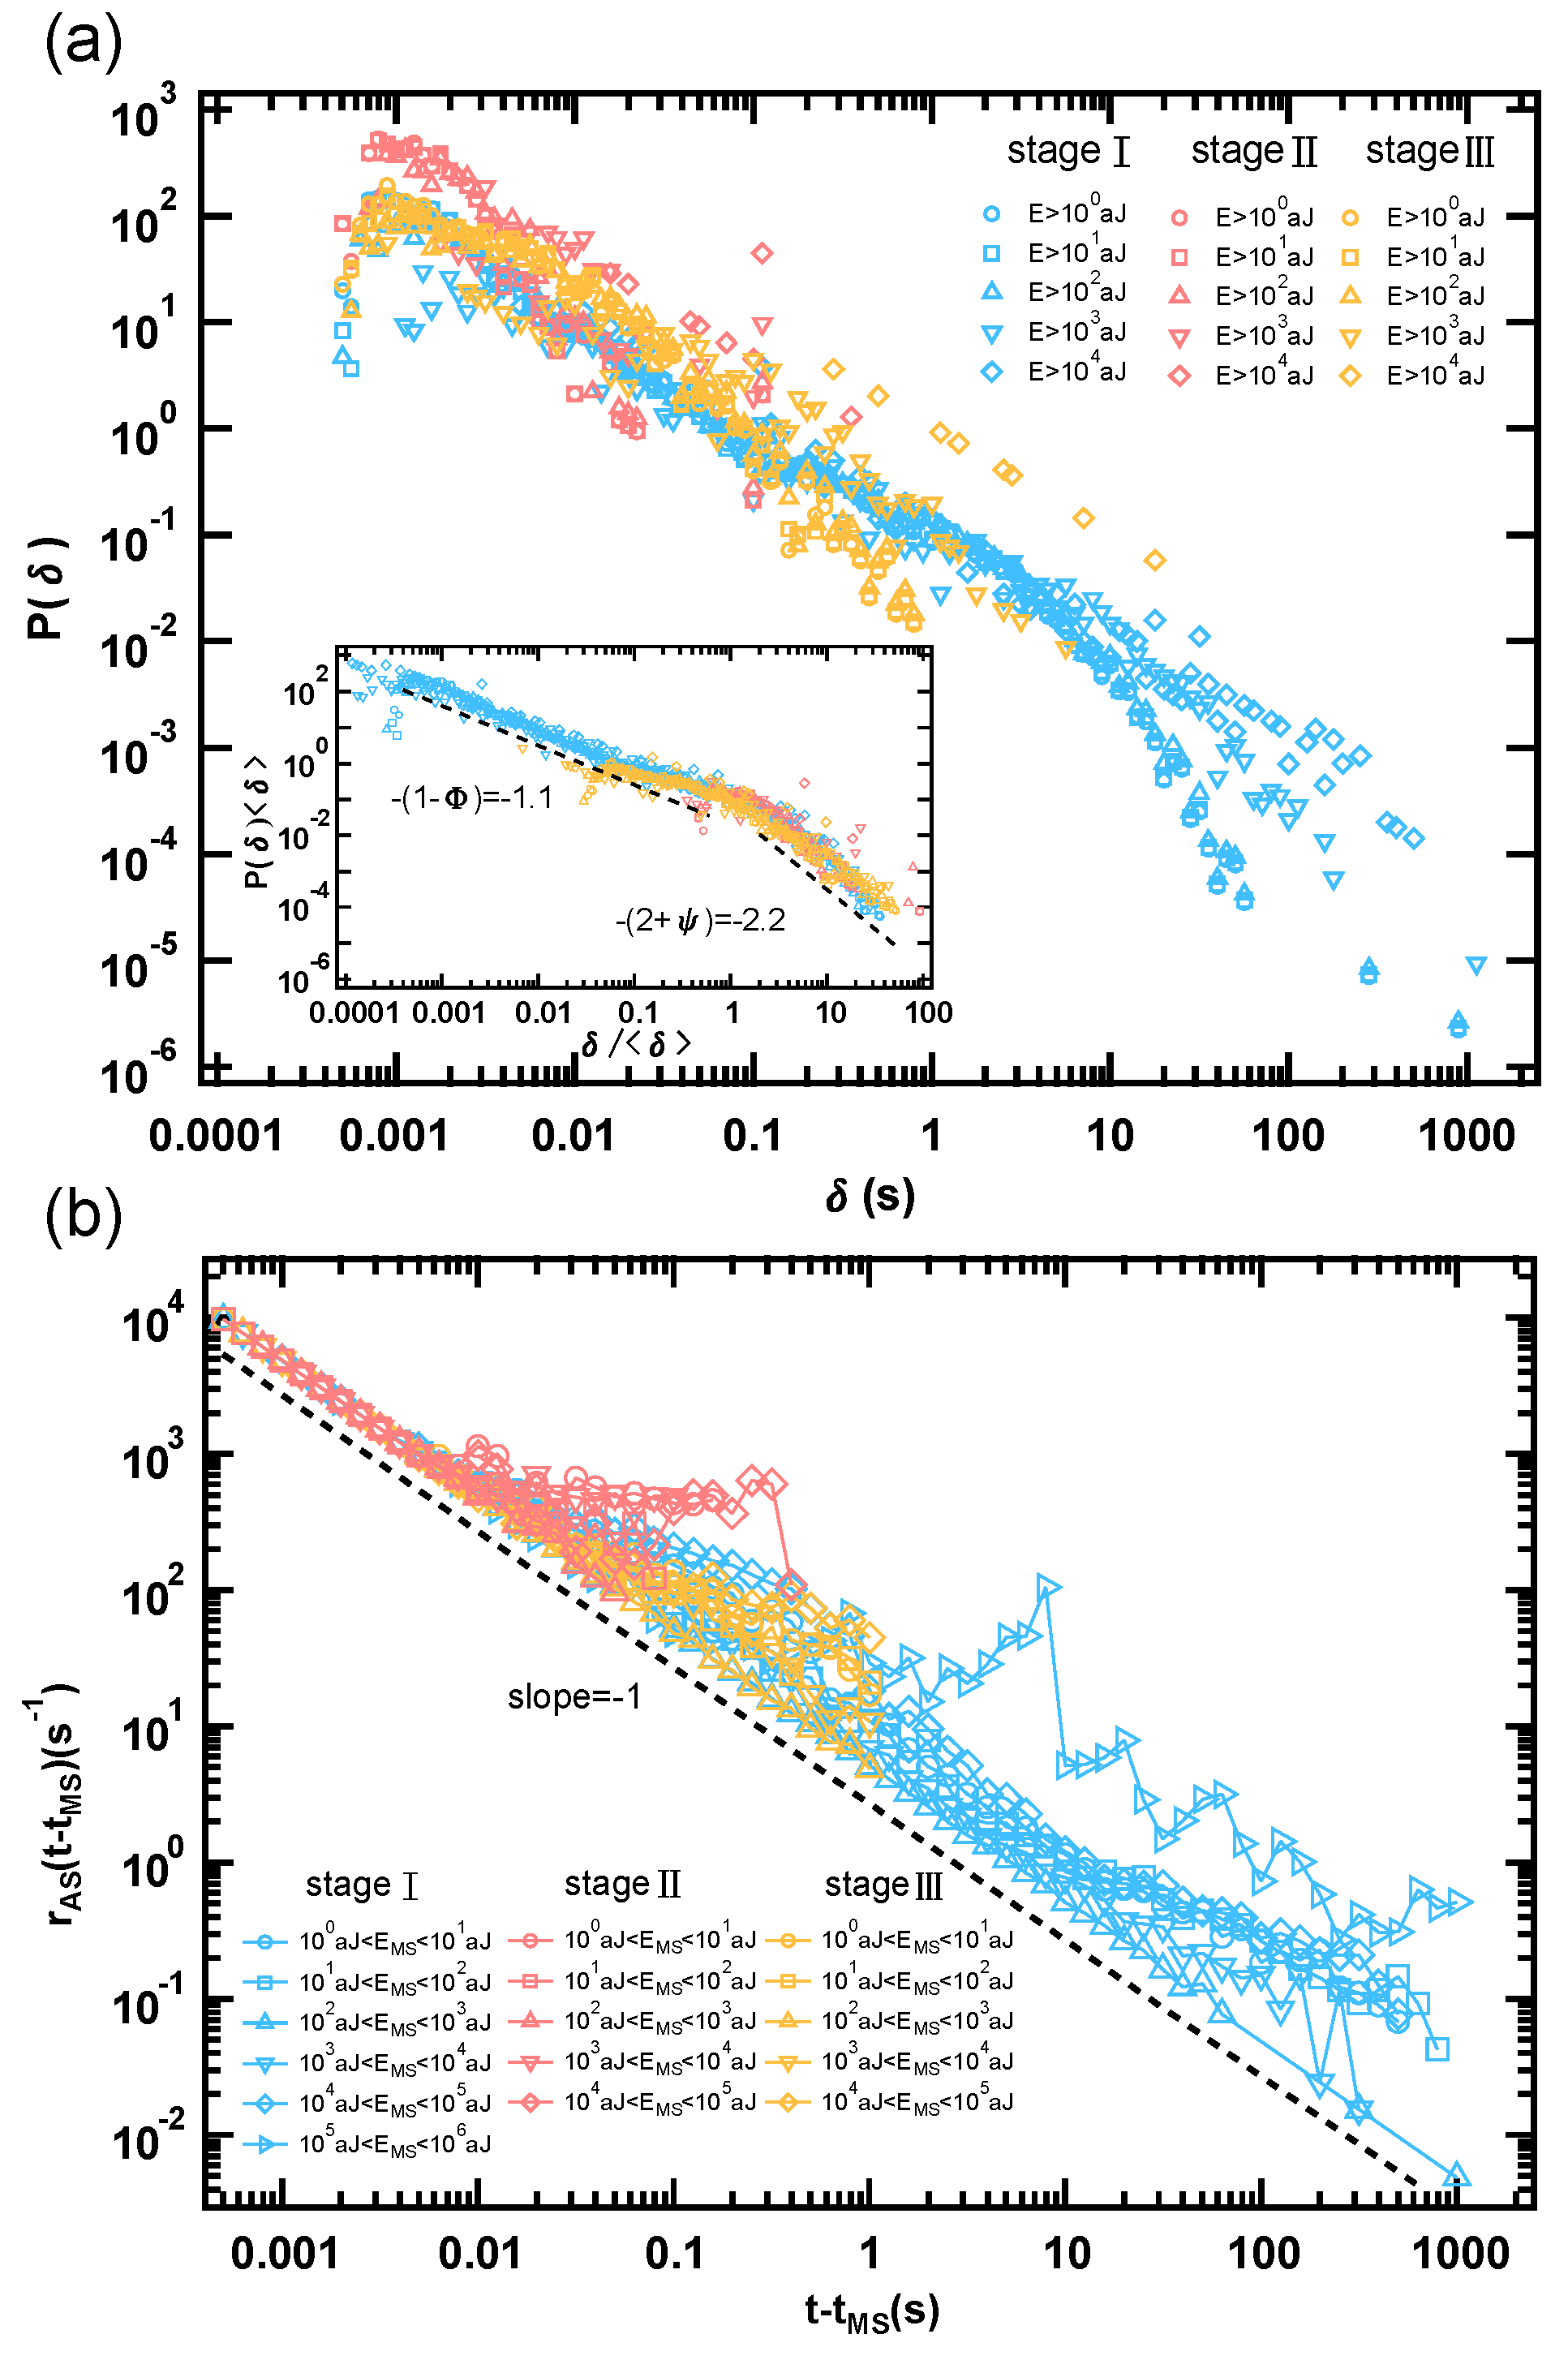
Figure 5a shows the distribution of waiting times δ , which are the time intervals between consecutive events. They are one of the important temporal characteristics of earthquake sequences that they can be described by unique scaling function indicating universality [18]. Waiting time distributions P( δ ) are from worldwide to local scales, and for quite different tectonic environments. This is even true if the seismic rate is not as stationary as during periods of pronounced aftershock sequences [18]. The main goal of the study of the distribution of waiting time is to investigate this unique scaling universality under confining condition. The inserted figure shows the waiting time distribution after normalized by its average δ . After normalization, all waiting time distributions collapse into a single double power law [29,39]. The two exponents for the waiting time distributions are 1.1, (1 − Φ ), for short times, and 2.2, (2 + Ψ ), for long times. They agree with the results of other SiO2-based materials [14]. All results in this study show similar waiting time distributions. This temporal distribution is stable during the whole compression process, which is consistent with results of earthquake distributions [40]. The aftershock distributions follow Omori’s law and are similar to those of natural earthquakes [29]. Omori’s law states that the number of aftershocks decays as a power-law after each mainshock (MS). We define MS as AE signals with energies EMS between 10k and 10k+1 aJ, with k = 1, 2, 3, and 4. The sequence of AS is then continued until another MS is found (the time distance is t-tMS). We calculated the aftershock rates, rAS(t − tMS), as function of the lapse time since the MS. The results of Omori’s law are shown in Figure 5b with different MS energy levels. The Omori exponent was found to be −1.
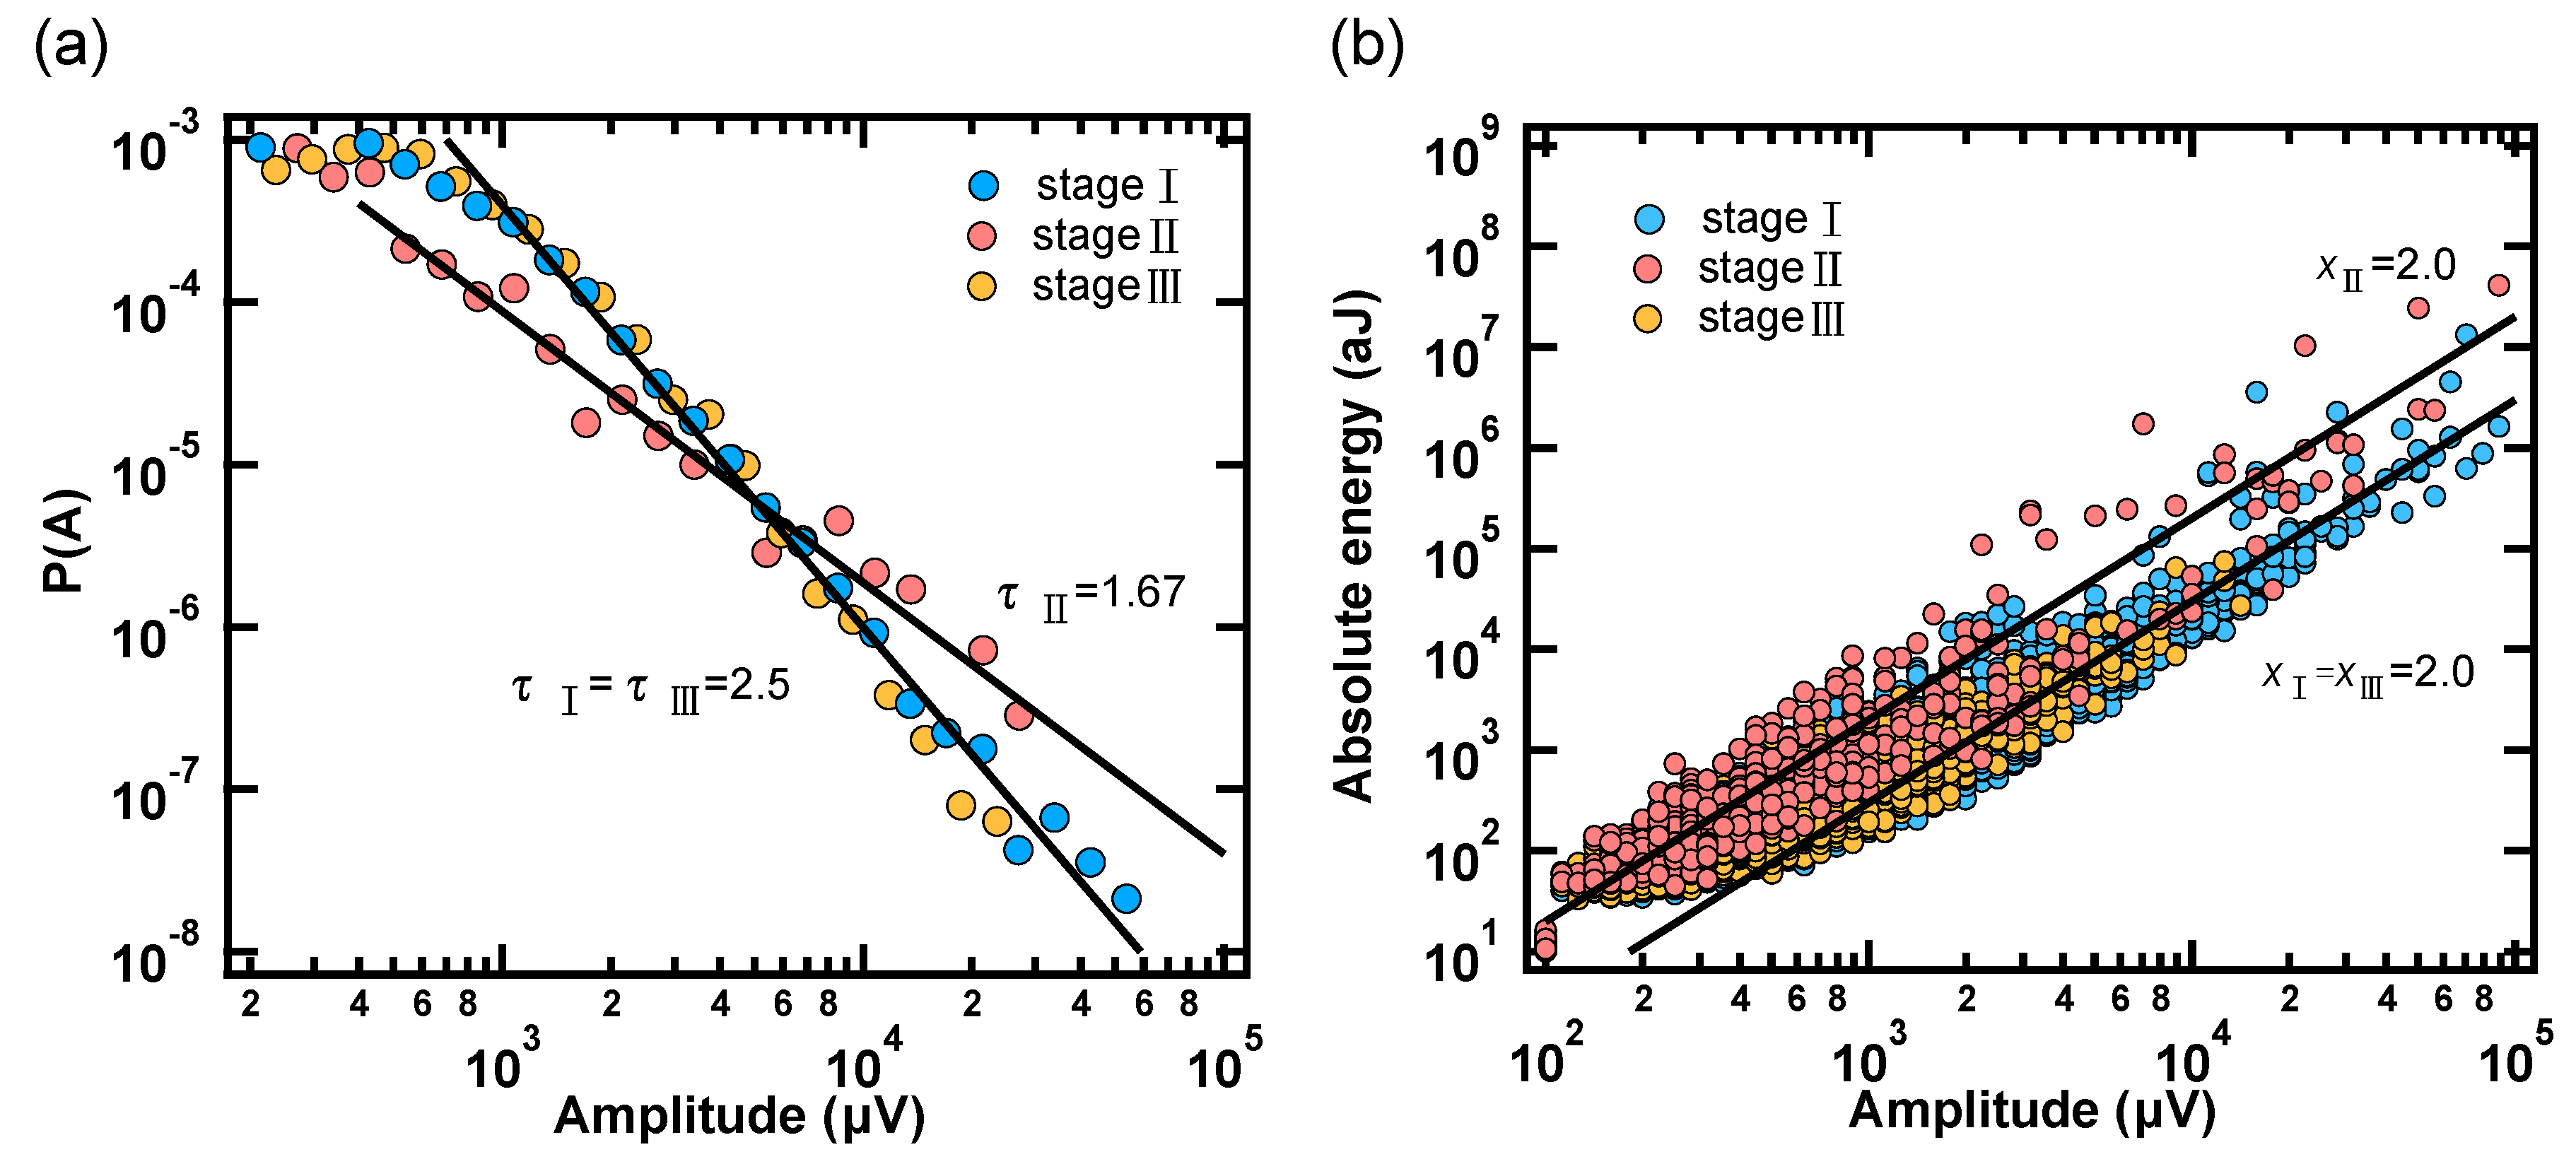
We now discuss the scaling exponents provided by the experiments, and compare them with predictions of mean-field theory. Crackling noise exponents have been widely used in the field of phase transitions, magnetism, ferroelectricity, and superconductivity [41]. The acoustic emission was simulated by slip avalanches with results close to mean-field theory (MFT) [42]. The MFT exponents are not independent of each other. Theoretically, the relationship between the exponents is, for the mean-field model, τ − 1 = x(ε − 1) = 0.66, and τ − 1 = x(ε − 1) = 1.33 for force integrated mean-field models. τ is the exponent for the distribution of amplitude, P(A) ~ A−τ. x is the exponent relating amplitude to energy E ~ Ax. The exponents τ and x under a confining pressure of 10 MPa are shown in Figure 6a,b. We found that the confining pressure used in this study (5–15 MPa) does not change the exponents within experimental resolution; the exponents are similar to each other in this confining stress range. Table 1 shows the predicted exponents in MF, force integrated MF, and the mean exponents’ values in this study. Here we follow the nomenclature in [35]. Interestingly, stage I and stage III fully agree with the force integrated MF, and Stage II agrees with the predictions of MF without force integration. The relation τ − 1 = x(ε − 1) holds, as shown in Table 2.
The variation of ε is now compared with previous results of deformed solids without confinement [30]. These studies show that ε of pre-failure, and correlated failure, are 1.77 and 1.53. Under confinement, ε is near 1.8 and 1.37 for pre-failure and correlated failure. The theoretical ε value associated with fracture in MF is 4/3 = 1.33 which is remarkably close to our result 1.37. Hence, the confining effect does not change the avalanche behavior during the pre-failure stage, but leads to an avalanche distribution exponent ε of correlated failure closer to the MF prediction. The confining effect in rock compression was also studied by micro-CT observations [43]. The results show that uniaxial compression leads to more cracks, while a triaxial compression produces one main crack when the failure mode changes from mixed tension/shear fracture to pure shear fracture. Simultaneously, the energy exponent was found to decrease slightly. The energy exponent of Vycor, a mesoporous silica with pore diameters in the range 2–10 nm, is 1.39 [29]. This value was close to εII in this study. For the fracture, ε is near 1.3 in ethanol-dampened charcoal [44], in close agreement with our results. The physical effect of the confining effect might stem come from reducing pore space in sandstone and promoting a “creep-like” processes. This behavior appears to be very similar to creep relaxation effects in other systems, such as micropillars made out of crystals or amorphous metals [45,46]. In addition, critical exponents are higher than mean-field predictions associated with the behavior of an avalanche oscillator [47], which is used to explain large exponents in the crystal plasticity of small grains in polycrystals or crystalline pillars. Furthermore, excepting power-law scaling, the average avalanche shape behaviors of the confining effect could be investigated in the future [48]. At last, we discuss some implications. AE signals can be used for the continuous monitoring of underground engineering projects. The AE energy distribution exponent can easily be measured using highly-sensitive AE sensors attached to the host rock. The data analysis method can easily be implemented through online evaluation of the AE signals. Our study, hence, advocates the applications of microseismic methods for environmental and ecological risk assessment under confining engineering conditions.

5. Conclusions

In this study, we reported the results of the avalanche statistics of sandstone under confinements and compared them with predictions of mean-field theory and previous non-confinement studies. Our results show confinement effects shift the value of the energy exponent closer to the mean-field value prediction in the failure stage. Temporal avalanches’ characteristics like Omori’s law and waiting time distributions are independent of stress states during the whole compression process, and their scaling exponents are very similar to those found in seismological studies.

Author Contributions

conceptualization, H.L. and X.J.; methodology, Y.Z. and K.X.; investigation, Y.Z., E.S., and X.J.; writing—original draft preparation, E.S. and X.J.; writing—review and editing, E.S. and X.J.

Funding

This research was funded by the National Natural Science Foundation of China, grant number 51908088, and EPSRC, grant number EP/P024904/1.

Acknowledgments

We appreciate the help from Professor Antoni Planes (Universitat de Barcelona, Catalonia), and Ms. Yan Chen (Xi’an Jiaotong University, P.R.China) in the AE statistical analysis section.

Conflicts of Interest

The authors declare no conflict of interest. The funders had no role in the design of the study; in the collection, analyses, or interpretation of data; in the writing of the manuscript, or in the decision to publish the results.

References

  1. Cote, P.J.; Meisel, L.V. Self-organized criticality and the barkhausen effect. Phys. Rev. Lett. 1991, 67, 1334–1337. [Google Scholar] [CrossRef] [PubMed]
  2. Jaeger, H.M.; Nagel, S.R.; Behringer, R.P. Granular solids, liquids, and gases. Rev. Mod. Phys. 1996, 68, 1259–1273. [Google Scholar] [CrossRef]
  3. Dahmen, K.A.; Ben-Zion, Y.; Uhl, J.T. A simple analytic theory for the statistics of avalanches in sheared granular materials. Nat. Phys. 2011, 7, 554–557. [Google Scholar] [CrossRef] [Green Version]
  4. Zaiser, M. Scale invariance in plastic flow of crystalline solids. Adv. Phys. 2006, 55, 185–245. [Google Scholar] [CrossRef]
  5. Dahmen, K.A.; Ben-Zion, Y.; Uhl, J.T. Micromechanical Model for Deformation in Solids with Universal Predictions for Stress-Strain Curves and Slip Avalanches. Phys. Rev. Lett. 2009, 102, 175501. [Google Scholar] [CrossRef] [Green Version]
  6. Salje, E.K.H.; Xue, D.; Ding, X.; Dahmen, K.A.; Scott, J.F. Ferroelectric switching and scale invariant avalanches in BaTiO3. Phys. Rev. Mater. 2019, 3, 014415. [Google Scholar] [CrossRef]
  7. Salje, E.K.H.; Lampronti, G.I.; Soto-Parra, D.E.; Baro, J.; Planes, A.; Vives, E. Noise of collapsing minerals: Predictability of the compressional failure in goethite mines. Am. Miner. 2013, 98, 609–615. [Google Scholar] [CrossRef]
  8. Salje, E.K.H.; Enrique Soto-Parra, D.; Planes, A.; Vives, E.; Reinecker, M.; Schranz, W. Failure mechanism in porous materials under compression: Crackling noise in mesoporous SiO2. Philos. Mag. Lett. 2011, 91, 554–560. [Google Scholar] [CrossRef]
  9. Friedman, N.; Ito, S.; Brinkman, B.A.W.; Shimono, M.; DeVille, R.E.L.; Dahmen, K.A.; Beggs, J.M.; Butler, T.C. Universal Critical Dynamics in High Resolution Neuronal Avalanche Data. Phys. Rev. Lett. 2012, 108, 208102. [Google Scholar] [CrossRef]
  10. Vajente, G. Crackling noise in advanced gravitational wave detectors: A model of the steel cantilevers used in the test mass suspensions. Phys. Rev. D 2017, 96, 022003. [Google Scholar] [CrossRef] [Green Version]
  11. Sheikh, M.A.; Weaver, R.L.; Dahmen, K.A. Avalanche Statistics Identify Intrinsic Stellar Processes near Criticality in KIC 8462852. Phys. Rev. Lett. 2016, 117, 261101. [Google Scholar] [CrossRef] [PubMed]
  12. Salje, E.K.H.; Saxena, A.; Planes, A. Avalanches in Functional Materials and Geophysics; Part of the Understanding Complex Systems Book Series (UCS); Springer: Berlin, Germany, 2017. [Google Scholar]
  13. Bismayer, U. Early warning signs for mining accidents: Detecting crackling noise. Am. Miner. 2017, 102, 3–4. [Google Scholar] [CrossRef]
  14. Nataf, G.F.; Castillo-Villa, P.O.; Baro, J.; Illa, X.; Vives, E.; Planes, A.; Salje, E.K.H. Avalanches in compressed porous SiO2-based materials. Phys. Rev. E 2014, 90, 022405. [Google Scholar] [CrossRef] [PubMed]
  15. Chen, Y.; Ding, X.; Fang, D.; Sun, J.; Salje, E.K.H. Acoustic Emission from Porous Collapse and Moving Dislocations in Granular Mg-Ho Alloys under Compression and Tension. Sci. Rep. 2019, 9, 1330. [Google Scholar] [CrossRef]
  16. Baro, J.; Shyu, P.; Pang, S.; Jasiuk, I.M.; Vives, E.; Salje, E.K.H.; Planes, A. Avalanche criticality during compression of porcine cortical bone of different ages. Phys. Rev. E 2016, 93, 053001. [Google Scholar] [CrossRef] [Green Version]
  17. Makinen, T.; Miksic, A.; Ovaska, M.; Alava, M.J. Avalanches in Wood Compression. Phys. Rev. Lett. 2015, 115, 055501. [Google Scholar] [CrossRef] [Green Version]
  18. Davidsen, J.; Stanchits, S.; Dresen, G. Scaling and universality in rock fracture. Phys. Rev. Lett. 2007, 98, 125502. [Google Scholar] [CrossRef]
  19. Deschanel, S.; Vanel, L.; Godin, N.; Maire, E.; Vigier, G.; Ciliberto, S. Mechanical response and fracture dynamics of polymeric foams. J. Phys. D Appl. Phys. 2009, 42, 214001. [Google Scholar] [CrossRef]
  20. Guarino, A.; Ciliberto, S.; Garcimartin, A.; Zei, M.; Scorretti, R. Failure time and critical behaviour of fracture precursors in heterogeneous materials. Eur. Phys. J. B 2002, 26, 141–151. [Google Scholar] [CrossRef]
  21. Guarino, A.; Garcimartin, A.; Ciliberto, S. An experimental test of the critical behaviour of fracture precursors. Eur. Phys. J. B 1998, 6, 13–24. [Google Scholar] [CrossRef] [Green Version]
  22. Hirata, T. Omoris power law aftershock sequences of micro-fracturing in rock fracture experiment. J. Geophys. Res. Solid Earth 1987, 92, 6215–6221. [Google Scholar] [CrossRef]
  23. Miksic, A.; Koivisto, J.; Alava, M. Statistical properties of low cycle fatigue in paper. J. Stat. Mech. Theory Exp. 2011. [Google Scholar] [CrossRef]
  24. Rosti, J.; Koivisto, J.; Alava, M.J. Statistics of acoustic emission in paper fracture: Precursors and criticality. J. Stat. Mech. Theory Exp. 2010. [Google Scholar] [CrossRef]
  25. Rosti, J.; Koivisto, J.; Traversa, P.; Illa, X.; Grasso, J.-R.; Alava, M.J. Line creep in paper peeling. Int. J. Fract. 2008, 151, 281–297. [Google Scholar] [CrossRef]
  26. Scholz, C.H. Micro-fracturing and inelastic deformation of rock in compression. J. Geophys. Res. 1968, 73, 1417–1432. [Google Scholar] [CrossRef]
  27. Stojanova, M.; Santucci, S.; Vanel, L.; Ramos, O. High Frequency Monitoring Reveals Aftershocks in Subcritical Crack Growth. Phys. Rev. Lett. 2014, 112, 115502. [Google Scholar] [CrossRef]
  28. Salje, E.K.H.; Dul’kin, E.; Roth, M. Acoustic emission during the ferroelectric transition Pm3m to P4mm in BaTiO3 and the ferroelastic transition R3m-C2/c in Pb3(PO4)2. Appl. Phys. Lett. 2015, 106, 152903. [Google Scholar] [CrossRef]
  29. Baro, J.; Corral, A.; Illa, X.; Planes, A.; Salje, E.K.H.; Schranz, W.; Soto-Parra, D.E.; Vives, E. Statistical Similarity between the Compression of a Porous Material and Earthquakes. Phys. Rev. Lett. 2013, 110, 088702. [Google Scholar] [CrossRef]
  30. Jiang, X.; Jiang, D.; Chen, J.; Salje, E.K.H. Collapsing minerals: Crackling noise of sandstone and coal, and the predictability of mining accidents. Am. Miner. 2016, 101, 2751–2758. [Google Scholar] [CrossRef] [Green Version]
  31. Kun, F.; Varga, I.; Lennartz-Sassinek, S.; Main, I.G. Approach to failure in porous granular materials under compression. Phys. Rev. E 2013, 88, 062207. [Google Scholar] [CrossRef] [Green Version]
  32. Kun, F.; Varga, I.; Lennartz-Sassinek, S.; Main, I.G. Rupture Cascades in a Discrete Element Model of a Porous Sedimentary Rock. Phys. Rev. Lett. 2014, 112, 065501. [Google Scholar] [CrossRef] [PubMed] [Green Version]
  33. Scholz, C.H. Frequency-magnetude relation of micro-fracturing in rock and its relation to earthquakes. Bull. Seismol. Soc. Am. 1968, 58, 399–415. [Google Scholar]
  34. Fairhurst, C.E.; Hudson, J.A. Draft ISRM suggested method for the complete stress–strain curve for intact rock in uniaxial compression. Int. J. Rock Mech. Min. Sci. 1999, 36, 281–289. [Google Scholar]
  35. Salje, E.K.H.; Dahmen, K.A. Crackling Noise in Disordered Materials. Annu. Rev. Condens. Matter Phys. 2014, 5, 233–254. [Google Scholar] [CrossRef]
  36. Jiang, X.; Liu, H.; Main, I.G.; Salje, E.K.H. Predicting mining collapse: Superjerks and the appearance of. record-breaking events in coal as collapse precursors. Phys. Rev. E 2017, 96, 023004. [Google Scholar] [CrossRef]
  37. Clauset, A.; Shalizi, C.R.; Newman, M.E.J. Power-Law Distributions in Empirical Data. SIAM Rev. 2009, 51, 661–703. [Google Scholar] [CrossRef] [Green Version]
  38. Salje, E.K.H.; Planes, A.; Vives, E. Analysis of crackling noise using the maximum-likelihood method: Power-law mixing and exponential damping. Phys. Rev. E 2017, 96, 042122. [Google Scholar] [CrossRef]
  39. Corral, A. Local distributions and rate fluctuations in a unified scaling law for earthquakes. Phys. Rev. E 2003, 68, 035102. [Google Scholar] [CrossRef] [Green Version]
  40. Bak, P.; Christensen, K.; Danon, L.; Scanlon, T. Unified scaling law for earthquakes. Phys. Rev. Lett. 2002, 88, 178501. [Google Scholar] [CrossRef]
  41. Sethna, J.P.; Dahmen, K.A.; Myers, C.R. Crackling noise. Nature 2001, 410, 242–250. [Google Scholar] [CrossRef] [Green Version]
  42. Fisher, D.S.; Dahmen, K.; Ramanathan, S.; Ben-Zion, Y. Statistics of earthquakes in simple models of heterogeneous faults. Phys. Rev. Lett. 1997, 78, 4885–4888. [Google Scholar] [CrossRef]
  43. Yang, S.-Q.; Ranjith, P.G.; Gui, Y.-L. Experimental Study of Mechanical Behavior and X-Ray Micro CT Observations of Sandstone under Conventional Triaxial Compression. Geotech. Test. J. 2015, 38, 179–197. [Google Scholar] [CrossRef]
  44. Ribeiro, H.V.; Costa, L.S.; Alves, L.G.A.; Santoro, P.A.; Picoli, S.; Lenzi, E.K.; Mendes, R.S. Analogies Between the Cracking Noise of Ethanol-Dampened Charcoal and Earthquakes. Phys. Rev. Lett. 2015, 115, 025503. [Google Scholar] [CrossRef] [PubMed]
  45. Papanikolaou, S.; Dimiduk, D.M.; Choi, W.; Sethna, J.P.; Uchic, M.D.; Woodward, C.F.; Zapperi, S. Quasi-periodic events in crystal plasticity and the self-organized avalanche oscillator. Nature 2012, 490, 517–522. [Google Scholar] [CrossRef]
  46. Jagla, E.A. Realistic spatial and temporal earthquake distributions in a modified Olami-Feder-Christensen model. Phys. Rev. E 2010, 81, 046117. [Google Scholar] [CrossRef] [Green Version]
  47. Song, H.; Dimiduk, D.; Papanikolaou, S. Universality Class of Nanocrystal Plasticity: Localization and Self-Organization in Discrete Dislocation Dynamics. Phys. Rev. Lett. 2019, 122, 178001. [Google Scholar] [CrossRef] [Green Version]
  48. Papanikolaou, S.; Bohn, F.; Sommer, R.L.; Durin, G.; Zapperi, S.; Sethna, J.P. Universality beyond power laws and the average avalanche shape. Nat. Phys. 2011, 7, 316. [Google Scholar] [CrossRef]
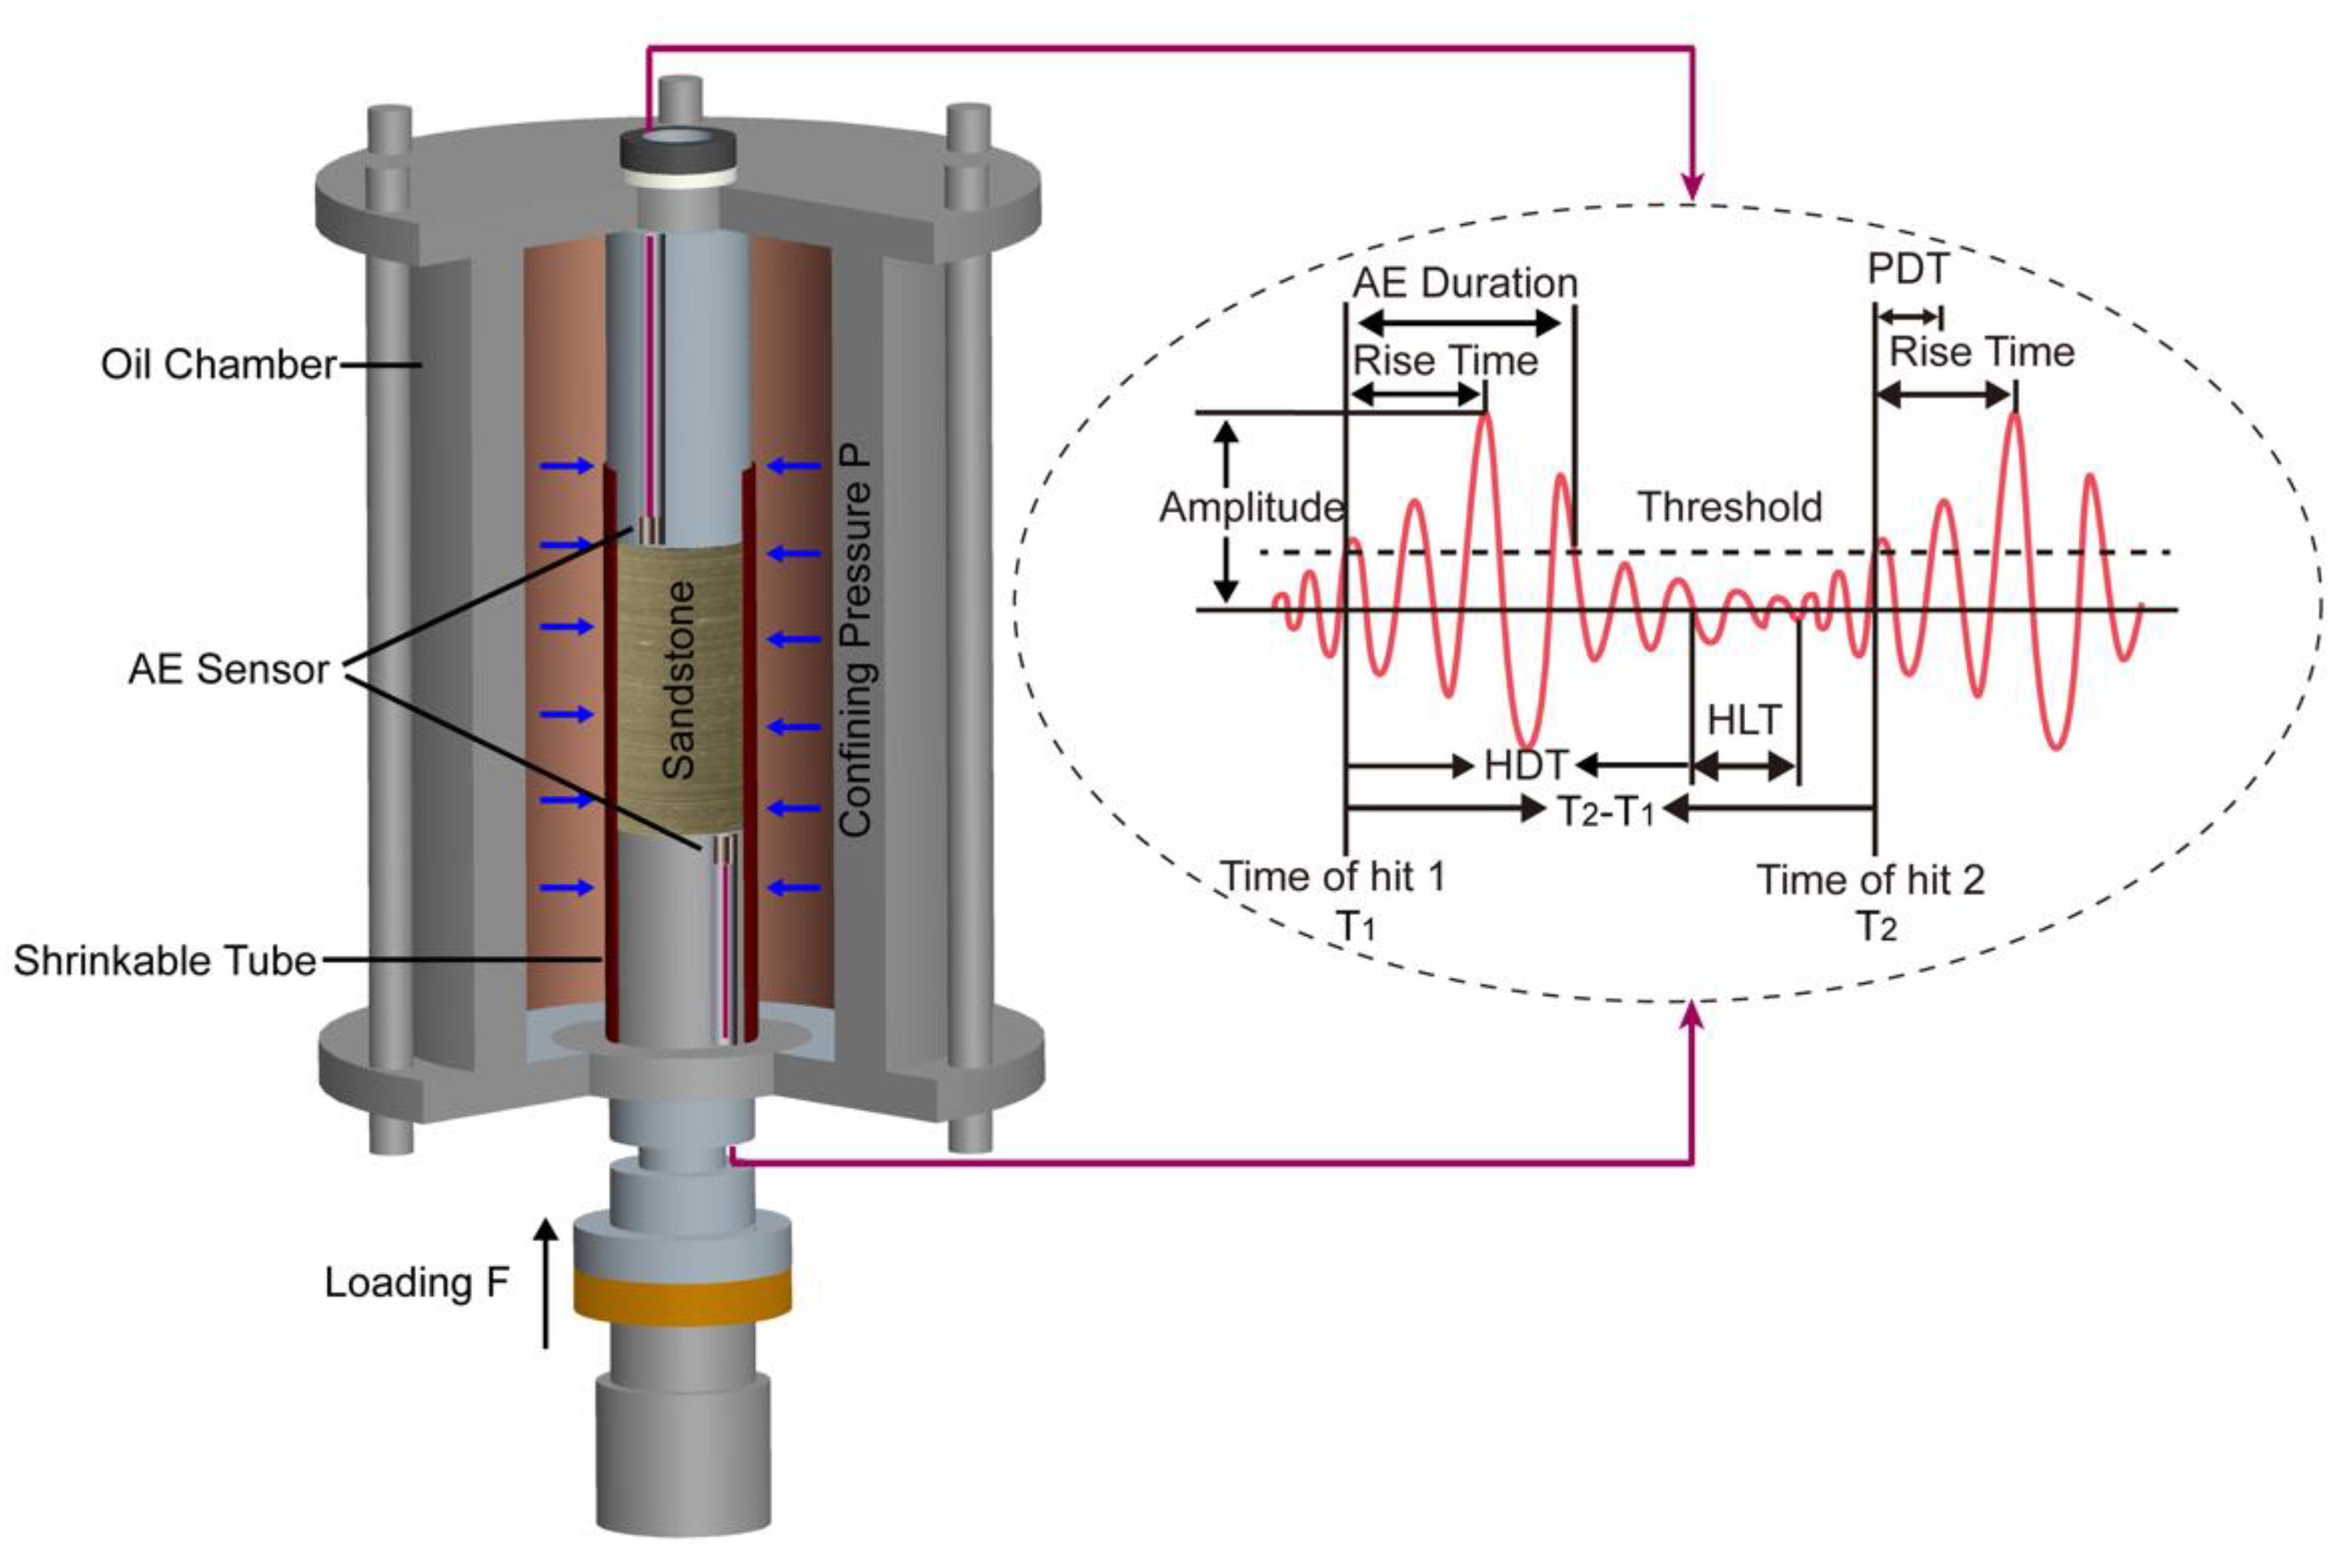
Figure 1. Schematic diagram of the compression arrangement. The confining stresses were provided by the oil pressure. Acoustic emission sensors were embedded in the vertical compression plates. Acoustic emission (AE) hit feature extraction diagram.
Crystals 09 00582 g001
Figure 2. (a–c) The typical, representative stress–strain curves and AE spectra for different confining conditions. (d) Shows the relationships between failure strength, failure strain, and confining stress.
Crystals 09 00582 g002
Figure 3. (a) Time sequence of jerk events under confined stress compression. The blue jerks are the AE energy spectrum, and red jerks are superjerks as record-breaking events. Superjerks are more energetic than any of the previous jerks (1 aJ = 10−18 J). (bd) Energy exponent ε as function of the lower energy cutoff is determined by maximum likelihood (ML) for k intervals under different confinement levels.
Crystals 09 00582 g003
Figure 4. (a) The compression process is divided into three stages: (I) pre-failure, (II) correlated failure, and (III) a post-failure. (b) Distribution of avalanche energies for different stages. These distributions are power-law distributed. (c) The ML fitting exponent ε as a function of the lower threshold energy for different stages.
Crystals 09 00582 g004
Figure 5. (a) Histogram distributions of waiting time for different stages with different energy thresholds. The inset shows the waiting time distribution after normalized by its average. (b) Rate of aftershocks per unit time, r, as a function of the time lapse to the main shock for different stages. The black dashed line indicates the Omori’s behavior with slope = −1.
Crystals 09 00582 g005
Figure 6. The exponents τ and x under confining pressure = 10 MPa. (a) Probability distribution function of amplitude A for different stages. (b) The correlation between the absolute energies and the amplitudes of AE signals is the power law distributed with E ~ Ax.
Crystals 09 00582 g006
Table 1. Mean exponents’ values for power-law distributions for Stage I, Stage II, and Stage Ⅲ.
Confining PressureParameterMF Value/Force IntegratedExperimental
Stage IStage IIStage Ⅲ
5 MPa<ε>1.33/1.671.90 ± 0.071.38 ± 0.061.90 ± 0.12
<τ>1.67/2.332.47 ± 0.071.65 ± 0.092.47 ± 0.10
<x>2.0/2.01.88 ± 0.051.91 ± 0.051.88 ± 0.03
10 MPa<ε>1.33/1.671.80 ± 0.101.37 ± 0.051.80 ± 0.15
<τ>1.67/2.332.50 ± 0.081.67 ± 0.122.50 ± 0.08
<x>2.0/2.02.00 ± 0.022.00 ± 0.052.00 ± 0.02
15 MPa<ε>1.33/1.671.89 ± 0.121.37 ± 0.051.89 ± 0.13
<τ>1.67/2.332.46 ± 0.081.67 ± 0.102.46 ± 0.10
<x>2.0/2.01.94 ± 0.061.95 ± 0.051.94 ± 0.03
Table 2. Exponents’ scaling relationships of power law distributions for energy E, amplitude A, and the correlations with E(A).
Confining PressureCorrelationTheoretical Value
MF/Force Integrated
Experimental
Stage IStage IIStage Ⅲ
5 MPa<τ> −10.66/1.331.47 ± 0.070.65 ± 0.091.47 ± 0.10
<x>(<ε> − 1)1.69 ± 0.120.73 ± 0.111.69 ± 0.15
10 MPa<τ> −11.50 ± 0.080.67 ± 0.121.50 ± 0.08
<x>(<ε> − 1)1.60 ± 0.120.74 ± 0.101.60 ± 0.17
15 MPa<τ> −11.46 ± 0.080.67 ± 0.101.46 ± 0.10
<x>(<ε> − 1)1.73 ± 0.180.72 ± 0.101.73 ± 0.16