Review

Highly-Tunable Crystal Structure and Physical Properties in FeSe-Based Superconductors

1
Beijing National Laboratory for Condensed Matter Physics, Institute of Physics, Chinese Academy of Sciences, Beijing 100190, China
2
University of Chinese Academy of Sciences, Beijing 100049, China
3
Songshan Lake Materials Laboratory, Dongguan, Guangdong 523808, China
*
Author to whom correspondence should be addressed.
Crystals 2019, 9(11), 560; https://doi.org/10.3390/cryst9110560
Submission received: 12 September 2019 / Revised: 21 October 2019 / Accepted: 22 October 2019 / Published: 25 October 2019
(This article belongs to the Special Issue Synthesis and Characterization of New Superconductors Materials)

Abstract

:
Here, crystal structure, electronic structure, chemical substitution, pressure-dependent superconductivity, and thickness-dependent properties in FeSe-based superconductors are systemically reviewed. First, the superconductivity versus chemical substitution is reviewed, where the doping at Fe or Se sites induces different effects on the superconducting critical temperature (Tc). Meanwhile, the application of high pressure is extremely effective in enhancing Tc and simultaneously induces magnetism. Second, the intercalated-FeSe superconductors exhibit higher Tc from 30 to 46 K. Such an enhancement is mainly caused by the charge transfer from the intercalated organic and inorganic layer. Finally, the highest Tc emerging in single-unit-cell FeSe on the SrTiO3 substrate is discussed, where electron-phonon coupling between FeSe and the substrate could enhance Tc to as high as 65 K or 100 K. The step-wise increment of Tc indicates that the synergic effect of carrier doping and electron-phonon coupling plays a critical role in tuning the electronic structure and superconductivity in FeSe-based superconductors.

1. Introduction

After discovering FeAs-based superconductors in 2008 [1,2,3,4], a structurally-simple binary FeSe superconductor with a superconducting critical temperature (Tc) of 8 K was quickly established by Hsu et al. [5] This brought researchers into a fresh new field of iron-based superconductors. The binary compound is composed of a neutral FeSe layer that is composed of a FeSe4 tetrahedra along the c-axis, and thus the interlayer coupling is weak van der Waals forces. It was found, initially, that the chemical substitution of Se by S and Te mildly enhanced the Tc to 10−15 K. However, tiny amounts of doping (3%) in the Fe site by Cu and Co strikingly suppress the Tc. Such features are totally different from those of FeAs-based superconductors, where the Co/Ni doping effectively induces superconductivity (SC) accompanying many properties like linear-T resistivity, a quantum critical point, and magnetic fluctuations [6,7,8]. Furthermore, there is no long-range magnetic order in FeSe, and the interplay between magnetism and SC is lacking, thus its superconducting mechanism seems to be simpler than that of FeAs-based superconductors. On the other hand, it is hard to grow large-sized single crystals of FeSe by the conventional flux-method because superconducting FeSe is a metastable phase that only exists in the temperature range of 673 K−973 K. The intrinsic properties like gap symmetry and the Fermi surface are hence inaccessible. These disadvantages, to some extent, hinder the investigations of FeSe-based superconductors.
Later, a technique of growing high-quality FeSe single crystals was found, and multiple characterizations like magneto-transport, in situ pressure, and inelastic neutron scattering revealed inherent properties for SC. More importantly, in 2010, the intercalation between the FeSe layer by large-sized alkali metals was successfully realized, forming a series of superconductors AxFe2-ySe2 (A = K, Cs, Rb, Tl) with a Tc of 30 K. This discovery opened a broader field in the physics and chemistry community. Subsequent reports of alkali metal, and ammonia co-intercalated FeSe, inorganic molecule intercalation, and monolayer FeSe on a SrTiO3 substrate continuously enhanced the Tc up to 65 K or even 100 K, making the FeSe-based compound one of the most fascinating fields in the search for a high Tc superconductor. Apart from the enhancement of Tc, the angle resolve photoemission spectrum (ARPES) revealed that the Fermi surface in such high Tc superconductors share a common feature (i.e., only two electron pockets surviving at the M point). A unique Fermi surface possibly implies a different pairing mechanism for Cooper pairs rather than the Fermi nesting scenario between electron-hole pockets in the well-documented FeAs-based superconductor [9,10].
In the last 11 years, FeSe-based superconductors have exhibited huge advancements and prosperous developments, and we feel that it is necessary to summarize the significant progress made at each important step. In this paper, we will review the crystal structure, the electronic structure, and the superconducting phase diagram in diverse FeSe-based superconductors. The evolutions of SC in binary FeSe under chemical substitution and physical pressure are discussed in first part. Second, the FeSe-based intercalates through inorganic and organic molecules are summarized, where both the interlayer spacing between FeSe layers and the charge transfer should determine the Tc. Finally, the substrate effect, the doping carrier, and the interfacial coupling of high-Tc SC in thin FeSe film are discussed. We hope that this review can deepen the understanding of structural evolution and superconductivity in FeSe-based superconductors to motivate the exploration of new superconducting materials with higher Tc.

2. Superconductivity in FeSe

2.1. Structure and Stoichiometric of Fe1+xSe

Binary FeSe with Tc = 8 K was discovered in 2008. It is regarded as a less-toxic superconductor when compared with the FeAs-based superconductors. The structure of FeSe is the PbO-type, which is composed of FeSe layers that are formed by edge-shared FeSe4 tetrahedra. The onset of Tc is 8.5 K. Rietveld refinements of powder synchrotron diffraction (BL12B2 beamline in Spring8) yield a = 0.37693(1) nm and c = 0.54861(2) nm for FeSe0.82, and a = 0.37676(2) nm and c = 0. 54847(1) nm for FeSe0.88. By cooling below the phase transition temperature (Ts) of 90 K, the (220) peak of PXRD splits into (200) and (020), indicating a structural transition from tetragonal P4/nmm to triclinic P-1, as shown in Figure 1. After that, Margadonna et al. carefully resolved the low-temperature crystal structures for FeSe0.92 [11]. Both high-resolution synchrotron x-ray diffraction and powder neutron diffraction (NPD) were carried out at different temperatures. They found that it indeed experienced a structural transition below the Ts, but the low-temperature phase showed an orthorhombic phase (space group Cmma), rather than triclinic symmetry, as seen in Figure 2. This transition was later called a nematic transition, which possibly correlates with the SC evidenced by multiple characterizations [12,13].
Pomjakushina et al. used two different methods to synthesize the FeSe1-x powder [14], and found that the superconducting phase existed in a very narrow range of Se content (FeSe0.974±0.005). Williams et al. carefully identified the role of Se-deficiency on tuning the structural transition and SC [15]. They proved experimentally that the correct formula of superconducting samples was FeSe0.99. The Se vacancies may not be necessary for inducing SC. They also determined that the SC was extremely sensitive to the content and disorder of Fe. After introducing 3% excess Fe, the SC was totally suppressed. Additionally, the magnetic order was not observed down to 5 K, in contrast to the antiferromagnetic (AFM) ground state in the FeAs-based superconductors. The Fe1.01Se compound exhibits the superstructure below the Ts in the form of a √2 × √2 × 1 supercell, consistent with the previous report [16]. Moreover, in the compound Fe1.03Se, the structural transition disappears, which means that excess Fe can break the long-range coherence of the structural unit. Recently, more details on the superstructure and SC were revealed in vacancy-ordered Fe1-xSe. Three kinds of superstructures, √2 × √2 × 1, √5 × √5 × 1, and √10 × √10 × 1, were identified in Fe3Se4, Fe4Se5, and superconducting Fe9Se10, respectively [17]. Among them, the Fe4Se5 compound is an AFM insulator with a small effective magnetic moment (0.003 μB). These authors claimed that the Fe vacancies could be effectively tuned, and increasing the content of Fe gradually led to the so-called parent compound Fe4Se5 into a superconducting state. Such behavior is analogous to the superconducting phase diagram in cuprates, where the parent compounds are AFM insulators and excess hole or electron doping can induce SC [18].
Regarding the single crystal of FeSe, Mok et al. could grow it through the high-temperature method using flux KCl [19]. As shown in Figure 3a, single crystals 2–3 mm in width and 0.1–0.3 mm in thickness were obtained. Only small amounts of the hexagonal FeSe impurity phase was detected according to the x-ray diffraction analysis. This work further proved that post-annealing at 673 K was useful to improve the quality of single crystals. Chareev et al. successfully grew high-quality FeSe single crystals by the chemical vapor deposition method. The atomic ratio of Fe:Se = 1:0.96 ± 0.02 and the maximal size was 4 × 4 × 0.1 mm3. The layered feature can clearly be observed in the Figure 3b. The Tc onset of this crystal was 9.4 K [20]. Following the improvement of single crystals, several groups quickly determined the intrinsic SC of FeSe. Lei et al. presented the nearly isotropic upper critical field [Hc2(0)] with magnetic field parallel and perpendicular to (101) face (see Figure 4a,b), and deduced a large Ginzburg-Landau parameter of κ ~72.3(2) [21]. The critical current density (Jc) was determined to be 2.2 × 10⁴ A/cm2 by the Bean model. Furthermore, these authors analyzed the Hall effect of FeSe and confirmed that the dominant carriers were hole-type at high magnetic fields. The electron-type carriers made a larger contribution at low magnetic field and low temperature, as shown in Figure 4c [22]. The symmetry of the superconducting energy gap was investigated by Lin et al. who demonstrated the coexistence of the isotropic s-wave and extended anisotropic s-wave gap with the magnitude of 1.33 meV and 1.13 meV in FeSe [23]. A high electron-boson coupling constant, 1.55, implies that the electron is not only coupled with phonons, but also with other “glues” associated with spin fluctuations. Subsequently, Abdel-Hafiez et al. measured the temperature-dependent London penetration depth, which was fitted by either a two s-wave-like model or a single anisotropic gap [24]. They claimed that the superconducting energy gap is nodeless. The fitting curves of a two-gap model with anisotropic s-wave and d-wave models are shown in Figure 4d.
Density functional calculations demonstrated that the electronic structure of FeSe was very similar to those of the FeAs-based superconductors [25]. In the first Brillouin zone, there are heavy hole-cylinders and lighter electron-pockets near the zone center (Г-point) and corner (M-point), respectively, implying typical spin-density wave instability due to Fermi surface nesting. In 2014, Shimojima et al. investigated the temperature-dependent band dispersion of Fe 3dxz and 3dyz orbitals at the M point from 50 K to 110 K. The results showed that the removal of degeneracy in the 3dxz/3dyz bands occurred at temperatures close to the Ts, which may be the orbital origin of structural transition [26]. Later, Zhang et al. traced the temperature dependence of band dispersion at the M point and the Г point. They surprisingly found that the band splitting at the Г point was not closely related to the structural transition, which may be controlled by magnetic frustration [27]. A high-resolution laser-based ARPES on FeSe recently uncovered a highly anisotropic Fermi surface around the Г point. This is possibly related to the low-temperature orthorhombic phase (i.e., nematic state), because the splitting of 3dxz/3dyz bands is possibly due to anisotropic electron hopping. Moreover, the observation of an extremely anisotropic superconducting gap with two-fold symmetry was also associated with nematicity. Fitting the gap scale against momentum suggests a possible combination of extended s-wave and d-wave gap symmetry [28,29]. It can be found that many characterizations, at least, confirmed that the superconducting energy gap of FeSe was of the anisotropic type.

2.2. FeSe under Pressure and Chemical Substitution

The application of high pressure on FeSe exhibits a surprising effect on tuning SC and magnetism. Mizuguchi et al. first enhanced the Tc of polycrystalline FeSe to 13.5 K under 1.48 GPa with a positive pressure-coefficient of 9.1 K/GPa [30]. Linear-extrapolated Hc2(0) was increased from 37 T to 72 T, implying the unconventional feature of SC. Millican et al. applied 0.6 GPa hydrostatic pressure to FeSe, and the structural parameters deduced from the high-resolution NPD pattern suggested that the phase transition was suppressed under pressure. A small bulk modulus, 31 GPa, suggested that FeSe is a soft material that can be effectively pressurized [31]. Garbarino et al. observed a new orthorhombic phase at a higher Tc of 34 K under 22 GPa [32]. Imai et al. performed the 77Se nuclear magnetic resonance (NMR) measurement at 2.2 GPa and ascribed the strongly-enhanced AFM spin fluctuations to be the origin of the enhancement of Tc [33]. This picture was supported by a zero-field muon spin rotation (μSR) measurement, from which the SC and AFM order were simultaneously stabilized in the low pressure range (see Figure 5a) [34]. Meanwhile, a very small magnetic moment, 0.2 μB, was obtained at 2.4 GPa. In an extended pressure range, a clear dome-shaped superconducting phase diagram as a function of pressure was established, where the maximal Tc of 36.7 K showed up at 8.9 GPa. Above 12 GPa, the tetragonal FeSe changed into hexagonal FeSe (NiAs-type), which is a non-superconducting phase (Figure 5b) [35]. The in situ Mössbauer spectrum under pressure revealed that there was no long-range magnetic ordering in the whole pressure range. This observation is in stark contrast to the results of the NMR and μSR experiments.
To clarify this, single crystals of FeSe have been used in in-situ high-pressure experiments. In 2015, Terashima et al. applied the high pressure of 2.72 GPa on FeSe single crystals and measured the resistance and ac magnetic susceptibility [36]. They confirmed that Tc generally increased under pressure, but dropped to a minimum Tc at ~1.2 GPa, which was consistent with the pressure-induced antiferromagnetic phase transition [37]. At pressures above 5 GPa, Sun et al. observed a sudden enhancement of Tc and suppression of TN, indicating competition between SC and magnetic order (see Figure 6). Furthermore, an interesting linear-T resistivity was observed at higher pressure, which can be considered to be a signature of a quantum critical point [38]. Application of higher pressure would destabilize the AFM state and thus enhance the spin fluctuations, to some extent, which is similar to the mechanism enhancing Tc in FeAs-based superconductors. At the optimum Tc, the electrical transport behaviors are dominated by holes, which are enhanced near optimal pressure, implying a Fermi surface reconstruction due to AF ordering [39].
According to the reports by Yeh et al. Te-substitution of Se sites resulted in lattice expansion because of the larger ionic radius of Te, as shown in Figure 7 [40,41]. It also can enhance onset of superconductivity (Tconset ) to 15.2 K and Hc2(0) to 28.8 T as half of the Se was substituted. Later, a high-quality single crystal of Fe1+ySe1-xTex was grown from the melt [42]. It showed that the single-phase can only exist in the Te-rich side. Bulk SC at 14 K in Fe1+ySe0.5Te0.5 was confirmed simultaneously by resistivity, magnetic susceptibility, and heat capacity. Post-annealing on Te-rich samples could improve the filamentary SC into bulk SC [43,44,45,46]. Meanwhile, the excess Fe at the interstitial site not only suppresses SC, but also induces weakly-localized states. From the neutron pair density function analysis, Se and Te do not actually occupy the same crystallographic site, leading to a local symmetry around Fe that is lower than the average crystal symmetry (P4/nmm) in Fe1+ySe1-xTex solid-solutions [47]. A comprehensive phase diagram of the SC and the structure of Fe1+ySe1-xTex were constructed by Liu et al. where bulk SC emerged in the range of 50% to 70% Te doping [48]. The in-plane magnetic wave vector in FeTe for the AFM order is (π, 0); as the content of Se increases, the magnetic fluctuations gradually evolve into the (π, π) type associated with the scenario of Fermi surface nesting. This finding first revealed that both FeSe- and FeAs-based superconductors may share a similar mechanism for SC, assuming that the spin fluctuation picture is applicable.
Regarding S-doped FeSe, the soluble limit of S is smaller than 20%, according to a report from Mizuguchi et al. [49] Additionally, Abdel-Hafiez et al. studied the superconducting properties of high-quality single crystals of FeSe1-xSx (x = 0, 0.04, 0.09, and 0.11). As the S concentration increases, the Tc determined from the onset of the diamagnetic signal increases from ~8.5 K to 10.7 K at x = 0.11. The normalized specific heat jump for FeSe1-xSx was significantly larger than the limit (1.43) of the BCS model, which is a signature of strong-coupling SC [50]. By using ARPES, Watson et al. observed a smaller splitting of the 3dxz and 3dyz bands and a weaker anisotropy of the Fermi surface in the FeSe1-xSx [51]. This means that isovalent S-substitution reduces the orbital ordering, correspondingly suppressing the structural transition temperature from 87 K to 58 K. Matsuura et al. investigated the pressure-dependent phase diagram of FeSe1-xSx, as shown in Figure 8 [52]. As S-content increased, the structural transition was quickly suppressed. Simultaneously, the pressure-induced SDW phase zone was gradually narrowed and the maximal Tc in each composition also decreased. This becomes a single dome-like SC in FeSe0.83S0.17, where the highest Tc was 30 K.

3. Intercalated FeSe-Based Superconductors

In 2010, we discovered the alkali-intercalated FeSe-based superconductor with Tc ~30 K for the first time [53,54]. Through Rietveld refinements against PXRD, an average structure of K0.8Fe2Se2 (i.e., 122-type), was determined, which was iso-structural, to be known BaFe2As2, as seen in Figure 9. From the temperature dependence of resistance and magnetization, the Tc onset was identified as 30.1 K. The dominant carriers were n-type, suggesting an electron-doped superconductor. This was the first report of enhancing Tc in an FeSe-based superconductor up to 30 K without applying high pressure. Following this discovery, several groups quickly identified many 122-type FeSe-based superconductors such as Cs0.8(FeSe0.98)2 (Tc ~27 K) [55,56], Rb0.88Fe1.81Se2 (Tc = 32 K) [57], Tl0.58Rb0.42Fe1.72Se2 (Tc ~32 K) [58], and (Tl, K)FexSe2 (Tc ~31 K) [59]. A new family of materials thereby came into the awareness of the superconducting community.
Transmission electron microscopy (TEM) on K0.8FexSe2 and KFexSe2 (1.7 ≤ x ≤ 1.8) samples revealed that complex phase-separation emerge in such AFe2Se2 superconductors. The superconducting phase is likely to be KxFe2Se2, which was later confirmed by STM results. The Fe-vacancy ordered phase K2Fe4Se5 showed a √5 × √5 × 1 superstructure [60]. The NPD on KxFe2Se2 samples revealed that the superstructure phases A2Fe4Se5 existed in all K, Cs, Rb, (Tl, Rb), and (Tl, K) intercalated FeSe-based superconductors [61]. Li et al. proposed that the existence of Fe vacancies could locally destroy SC [62], and suggested that the K2Fe4Se5 layer may be indispensable to regulate superconductivity in KFe2Se2 by providing charge carriers [63]. More superstructures associated with different Fe-vacancy and alkali-metal-ordering were later revealed later [64,65,66,67].
Phase separation hinders the investigation of the intrinsic property of FeSe-based 122-type superconductors. A low-temperature route, named the liquid-ammonia method, was proposed to synthesize phase-pure superconductors. A series of alkali and ammonia co-intercalated compounds were synthesized such as Li(NH3)yFe2Se2, Na(NH3)yFe2Se2, Ca0.5(NH3)yFe2Se2, Sr0.8(NH3)yFe2Se2, Ba0.8(NH3)yFe2Se2, Eu(NH3)yFe2Se2, and Yb(NH3)yFe2Se2, with a Tc of 30–46 K [68,69,70]. Taking Na(NH3)yFe2Se2 as an example, the crystal structure is composed of edge-sharing FeSe4-tetrahedra layers and Na atoms between the FeSe4 layers, and the Tc onset is 46 K, as shown in Figure 10a,b. In addition, these authors built a discrete superconducting phase diagram against K content, as seen in Figure 10c,d, where the low intercalated content could enhance the Tc to 44 K. After increasing the K content to 0.6, the Tc was lowered to 30 K [71]. This trend is well reproduced by the density function theory and Monte Carlo simulations [72].
Later, the high-resolution NPD technique was adopted to determine the crystal structure of Lix(NH3)yFeSe, where the Li and NH3 are located in between the FeSe layer [73]. Jin et al. also determined the structure of Na0.39(C2N2H8)0.77Fe2Se2 in this way, as shown in Figure 11 [74]. The existence of organic molecules seems not to be related to SC, but can drastically alter the geometry of FeSe, even changing the structural symmetry due to rotations of the long-chain of the C atom [75]. Lu et al. synthesized an intercalated superconductor (Li0.8Fe0.2)OHFeSe by the hydrothermal method. The Tc was ~41 K and the precise structure parameters were determined by x-ray and NPD. the details of which are shown in Figure 12 [76]. The Tc of different FeSe intercalates imply that Tc is proportional to the interlayer spacing below 9.0 Å. Once the spacing is above 9.0 Å, Tc seems to be independent on this spacing [77]. Therefore, the doped electron count is more important for determining Tc. Thus, studies of metal ions and molecular co-intercalated FeSe-based compounds are important to enhance Tc and understand the effect of structural change on SC [78,79]. Additionally, under high pressure, a second superconducting phase with higher Tc was observed in KxFe2Se2, which can be ascribed to the quantum critical phase transition [80,81]. Such pressure-induced SC was also verified in (Li0.8Fe0.2)OHFeSe [82] and in Lix(NH3)yFe2Se2 [83].
Sizeable single-crystals of AxFe2Se2 and (Li0.8Fe0.2)OHFeSe superconductors can be easily grown by the self-flux and hydrothermal method. Thus, the important Fermi surface topology can be detected by ARPES experiments. The most important finding is that the hole-pocket at the Γ point sinks tens of meV below the Fermi level and the unique Fermi surface only contains electronic pockets [84]. In terms of the approximation of a rigid band shift, it is a consequence of electron-doping, which lifts up the Fermi energy. This topology of the Fermi surface has also been observed in (Li0.8Fe0.2)OHFeSe (see Figure 13) [85,86]. Such a Fermi surface challenges the established picture of electron-hole nesting for inducing SC in FeAs-based superconductors [9,10,87]. At the same time, the ARPES measurements confirmed that the superconducting gap was of the isotropic type, with a magnitude of 10.3 meV. This nodeless gap suggests that a conventional s-wave pairing could better describe the origin of SC [88].

4. Superconductivity of FeSe Film

In 2012, Wang et al. reported that a single unit cell (SUC) FeSe film grown on a SrTiO3 (STO) substrate by molecular beam epitaxy (MBE) exhibited a very large superconducting gap (Δ) of 20 meV. Assuming that the superconducting mechanism of both FeSe film and bulk FeSe is the same, the estimated Tc of the SUC FeSe film may be larger than 77 K [89]. The SUC FeSe film had an atomically smooth surface after Se-flux treatment. The temperature-dependent resistance showed a little lower Tconset of 53 K as plotted in Figure 14a. The upper inset in Figure 14a shows that the SC is slowly suppressed by the external magnetic field. The tunneling spectrum in the SUC FeSe film clearly exhibited a ~20 meV superconducting gap, as seen in Figure 14b. However, the double unit cell (DUC) FeSe film did not exhibit SC at all (see Figure 14c). It seems that the interfacial effect offers an effective way to realize high Tc in FeSe. Ge et al. reported a rather high Tc, above 100 K, in FeSe/STO film by using in situ four-point probe electrical transport measurements. This Tc is the highest value in all reported Fe-based superconductors, which is a rather exciting result that deserves further investigation [90]. Subsequently, many FeSe thin films grown on different substrates have been studied in order to understand the mechanism of enhancing SC.
He et al. studied the topology of the Fermi surface of the SUC FeSe film grown on a STO substrate by changing the carrier concentration through a different annealing procedure [91]. Surprisingly, they found that two competitive phases, a non-superconducting phase at low-doping level and another superconducting phase at high-doping level, appeared during the annealing process. The electronic structure and the superconducting gap were tuned in a larger range by adjusting the annealing time and temperature. As depicted in Figure 15a–d, it was found that the magnitude of the superconducting gap increased from ~10 meV to ~19 meV. Meanwhile, the relation between the superconducting gap size and temperature could be well described by the BCS theory, which is displayed as a green line in Figure 15e–h). Meanwhile, Tan et al. also grew a high-quality thin FeSe film on a STO substrate and measured the Fermi surface and band dispersion [92]. They found that a short-range SDW appeared in the thin FeSe film (50 unit-cell). As depicted in Figure 16a, the SC arises while the spin density wave is suppressed. This phase diagram reveals that there is a unified trend in SUC FeSe/STO and other Fe-based superconductors by controlling the doping level and lattice constants. It also implies that a higher Tc will appear in the FeSe film if the lattice constants are expanded and higher electronic doping is introduced. Rebec et al. compared the Tc and the scale of superconducting gap in 60 unit-cell FeSe/STO (001), SUC FeSe/STO (001), and 3 UC FeSe/STO (001) coated by potassium atoms and SUC FeSe/TiO2 (100). By analyzing the ARPES results, they found that electron doping plays an important role in inducing high Tc [93].
There is an interaction between electrons from FeSe and the oxygen optical phonons of the STO substrate, thus enhancing the electron-phonon coupling [94]. Figure 17 suggests that there is a close relationship between interfacial electron–phonon coupling and Tc enhancement. Both experimental and calculation results revealed that interfacial electron–phonon coupling could account for the enhancement of Tc in the SUC FeSe/STO film. To find out the main factor in enhancing SC, Ding et al. grew SUC FeSe films on a TiO2 (001) substrate [95]. As depicted in Figure 18, a TiO2 film with a thickness of 15 nm was grown on a STO substrate. On the TiO2 surface, a 4 × 1 reconstruction of the oxygen vacancies (white spots) can clearly be seen. The density of the oxygen vacancies in the as-grown TiO2 surface was about 4.6 × 10⁻² per nm2, and post-annealing reduced the vacancies of TiO2 to 6.1 × 10⁻³ per nm2, as shown in Figure 18a–c. The SUC FeSe film on TiO2 also exhibited a clear superconducting feature in the dI/dV spectrum, but the double unit cell (DUC) FeSe was not superconducting (see Figure 18d). In the SUC FeSe sample grown on a TiO2 substrate with different oxygen vacancies, there was no change in the superconducting gap (see Figure 18e). Thus, the density of interfacial oxygen vacancies has a limited effect on enhancing the interfacial charge transfer and Tc. Zhou et al. also grew SUC FeSe films on a MgO (001) substrate, and the onset Tc was 18 K, as inferred by transport measurement. [96] The atomic image illustrates that the SUC FeSe film grown on the MgO (001) substrate was along FeSe (001). A 1.3% in-plane tensile strain was induced by the lattice mismatch of the FeSe and the MgO (001) substrate. Scanning transmission electron microscopy (STEM) images of the interfacial structure demonstrated that Mg atoms could be replaced by Fe atoms, and the result of the calculations showed that the MgO film near the interface becomes electron doped, which shows the capability of enhancing the charge-transfer effect.
Miyata et al. observed SC with a Tc of 48 K in a multilayer FeSe film by coating potassium onto its surface [97]. The electronic structure of the SUC FeSe films are shown in Figure 19. The Fermi surface of the SUC FeSe film consists of a large electron pocket at the M point of the Brillouin zone, which is consistent with those of KxFe2Se2 and LiOHFeSe. However, the Fermi surface of the triple unit-cell FeSe film included a hole pocket at the Γ point and a tiny electron pocket near the M point of the Brillouin zone (see Figure 19d–f), which is similar to that of bulk FeSe. After coating more K atoms, a downward shift of hole-like band occurred at the Γ point. The hole-pocket at the Γ point thereby gradually disappeared, as shown in Figure 19g–o. The total doped-electron count was about 0.11e in the triple unit-cell FeSe film, and a superconducting gap of 8 meV opened at Tc = 46 K and closed above 51 K. Obviously, electron doping by coating K atoms is a useful strategy to induce high Tc in multilayer FeSe films.
Interfacial electron–phonon coupling has also been proposed to explain the enhancement of high Tc in SUC FeSe/STO. However, the evidence that can directly connect interfacial electron–phonon coupling intensity (EPI) with high Tc is still not sufficiently clear. Song et al. studied thin films of FeSe by replacing 16O with its isotope 18O [98]. Surprisingly, they found that the energy difference between the electron-type band and its replica band was approximately in proportion to the inverse square root of the mass of oxygen atoms. Therefore, the SC is highly related to interfacial EPI. As depicted in Figure 20, superconducting gaps Δ1 and Δ2 were ~9.5 meV while the ratio η (i.e., the EPI) is close to zero, which is basically equal to the superconducting gap of the K-dosed multilayer FeSe film. Thus, it demonstrated that a synergistic effect between possible spin fluctuations and enhanced EPI results in such high Tc in FeSe/STO. It is worth noting that theorists could qualitatively describe the Fermi surface, hidden magnetic order, replica bands, and the superconductivity isotropic Cooper pairs in heavily electron-doped FeSe by an extended Hubbard model [99,100]. Such explanations could deepen the understanding of the superconducting mechanism and may help us explore more high Tc superconductors.

5. Conclusions

The finding of a series of surprisingly high Tc in FeSe-based materials is a significant breakthrough in the superconducting community and sets up a very interesting superconducting family. However, the microscopic mechanism of the enhancement of Tc through multiple treatments is still elusive. Many kinds of effects have been proposed to explain the enhancement in Tc such as coupling between the electrons and phonons of the substrate, the tensile strain effect introduced by lattice mismatch between FeSe film and the substrate, and the charge transfer, etc. More subtle experiments should be conducted to figure out which effect plays the decisive role. In addition, as FeSe thin films are very thin and are easily oxidized, the transport and magnetic properties are hard to measure. Therefore, new methods and more novel experimental tools should be developed to detect the intrinsic physical properties.

Author Contributions

Investigation, K.Z., J.W.; Y.S. writing—original draft preparation, K.Z.; J.W.; L.G.; J.-g.G.; writing—review and editing, K.Z.; J.W.; J.-g.G.; funding acquisition, J.-g.G.

Funding

This research was funded by the National Natural Science Foundation of China, grant number 51922105 and 51772322, the National Key Research and Development Program of China, grant number 2016YFA0300600 and 2017YFA0304700, and the Chinese Academy of Sciences, grant number QYZDJ-SSW-SLH013.

Conflicts of Interest

The authors declare no conflict of interest.

References

  1. Kamihara, Y.; Watanabe, T.; Hirano, M.; Hosono, H. Iron-Based Layered Superconductor La[O1-xFx]FeAs (x = 0.05-0.12) with Tc = 26 K. J. Am. Chem. Soc. 2008, 130, 3296. [Google Scholar] [CrossRef]
  2. Takahashi, H.; Igawa, K.; Arii, K.; Kamihara, Y.; Hirano, M.; Hosono, H. Superconductivity at 43 K in an iron-based layered compound LaO1-xFxFeAs. Nature 2008, 453, 376–378. [Google Scholar] [CrossRef] [PubMed]
  3. Chen, X.H.; Wu, T.; Wu, G.; Liu, R.H.; Chen, H.; Fang, D.F. Superconductivity at 43 K in SmFeAsO1-xFx. Nature 2008, 453, 761–762. [Google Scholar] [CrossRef] [PubMed]
  4. Ren, Z.A.; Lu, W.; Yang, J.; Yi, W.; Shen, X.L.; Li, Z.C.; Che, G.C.; Dong, X.L.; Sun, L.L.; Zhou, F.; et al. Superconductivity at 55 K in iron-based F-Doped layered quaternary compound Sm[O1−xFx]FeAs. Chin. Phys. Lett. 2008, 25, 2215–2216. [Google Scholar] [CrossRef]
  5. Hsu, F.C.; Luo, J.Y.; Yeh, K.W.; Chen, T.K.; Huang, T.W.; Wu, P.M.; Lee, Y.C.; Huang, Y.L.; Chu, Y.Y.; Yan, D.C.; et al. Superconductivity in the PbO-type structure α-FeSe. Proc. Natl. Acad. Sci. USA. 2008, 105, 14262–14264. [Google Scholar] [CrossRef]
  6. Kasahara, S.; Shibauchi, T.; Hashimoto, K.; Ikada, K.; Tonegawa, S.; Okazaki, R.; Shishido, H.; Ikeda, H.; Takeya, H.; Hirata, K.; et al. Evolution from non-Fermi- to Fermi-liquid transport via isovalent doping in BaFe2(As1−xPx)2 superconductors. Phys. Rev. B 2010, 81, 184519. [Google Scholar] [CrossRef]
  7. Arsenijević, S.; Hodovanets, H.; Gaál, R.; Forró, L.; Bud’ko, S.L.; Canfield, P.C. Signatures of quantum criticality in the thermopower of Ba(Fe1−xCox)2As2. Phys. Rev. B 2013, 87, 224508. [Google Scholar] [CrossRef]
  8. De la Cruz, C.; Huang, Q.; Lynn, J.W.; Li, J.; Ratcliff, W.; Zarestky, J.L.; Mook, H.A.; Chen, G.F.; Luo, J.L.; Wang, N.L.; et al. Magnetic order close to superconductivity in the iron-based layered LaO1-xFxFeAs systems. Nature 2008, 453, 899–902. [Google Scholar] [CrossRef]
  9. Hirschfeld, P.J.; Korshunov, M.M.; Mazin, I.I. Gap symmetry and structure of Fe-based Superconductors. Rep. Prog. Phys. 2011, 74, 124508. [Google Scholar] [CrossRef]
  10. Johnson, P.D.; Xu, G.Y.; Yin, W.G. Iron-Based Superconductivity; Series in Materials Science; Springer: Basel, Switzerland, 2015; pp. 211–255. [Google Scholar]
  11. Margadonna, S.; Takabayashi, Y.; McDonald, M.T.; Kasperkiewicz, K.; Mizuguchi, Y.; Takano, Y.; Fitch, A.N.; Suard, E.; Prassides, K. Crystal structure of the new FeSe1-x superconductor. Chem. Commun. 2008, 5607–5609. [Google Scholar] [CrossRef]
  12. Chu, J.H.; Analytis, J.G.; Greve, K.D.; McMahon, P.L.; Islam, Z.; Yamamoto, Y.; Fisher, I.R. In-plane resistivity anisotropy in an underdoped iron arsenide superconductor. Science 2010, 329, 824. [Google Scholar] [CrossRef] [PubMed]
  13. Wang, Q.; Shen, Y.; Pan, B.; Zhang, X.; Ikeuchi, K.; Iida, K.; Christianson, A.D.; Walker, H.C.; Adroja, D.T.; Abdel-Hafiez, M.; et al. Magnetic ground state of FeSe. Nat. Commun. 2016, 7, 12182. [Google Scholar] [CrossRef] [PubMed] [Green Version]
  14. Pomjakushina, E.; Conder, K.; Pomjakushin, V.; Bendele, M.; Khasanov, R. Synthesis, crystal structure, and chemical stability of the superconductor FeSe1−x. Phys. Rev. B 2009, 80, 024517. [Google Scholar] [CrossRef]
  15. Williams, A.J.; McQueen, T.M.; Cava, R.J. The stoichiometry of FeSe. Solid State Commun. 2009, 149, 1507–1509. [Google Scholar] [CrossRef]
  16. McQueen, T.M.; Williams, A.J.; Stephens, P.W.; Tao, J.; Zhu, Y.; Ksenofontov, V.; Casper, C.; Cava, R.J. Tetragonal-to-orthorhombic structural phase transition at 90 K in the superconductor Fe1.01Se. Phys. Rev. Lett. 2009, 103, 057002. [Google Scholar] [CrossRef]
  17. Chen, T.K.; Chang, C.C.; Chang, H.H.; Fang, A.H.; Wang, C.H.; Chao, W.H.; Tseng, C.M.; Lee, Y.C.; Wu, Y.R.; Wen, M.H.; et al. Fe-vacancy order and superconductivity in tetragonal β-Fe1-xSe. Proc. Natl. Acad. Sci. USA. 2014, 111, 63–68. [Google Scholar] [CrossRef]
  18. Keimer, B.; Kivelson, S.A.; Norman, M.R.; Uchida, S.; Zaanen, J. From quantum matter to high-temperature superconductivity in copper oxides. Nature 2015, 518, 179–186. [Google Scholar] [CrossRef]
  19. Mok, B.H.; Rao, S.M.; Ling, M.C.; Wang, K.J.; Ke, C.T.; Wu, P.M.; Chen, C.L.; Hsu, F.C.; Huang, T.W.; Luo, J.Y.; et al. Growth and investigation of crystals of the new superconductor α-FeSe from KCl Solutions. Cryst. Growth Des. 2009, 9, 3260–3264. [Google Scholar] [CrossRef]
  20. Chareev, D.; Osadchii, E.; Kuzmicheva, T.; Lin, J.Y.; Kuzmichev, S.; Volkova, O.; Vasiliev, A. Single crystal growth and characterization of tetragonal FeSe1−x superconductors. Cryst. Eng. Comm. 2013, 15, 1989–1993. [Google Scholar] [CrossRef]
  21. Lei, H.C.; Hu, R.W.; Petrovic, C. Critical fields, thermally activated transport, and critical current density of β-FeSe single crystals. Phys. Rev. B 2011, 84, 014520. [Google Scholar] [CrossRef]
  22. Lei, H.C.; Graf, D.; Hu, R.W.; Ryu, H.J.; Choi, E.S.; Tozer, S.W.; Petrovic, C. Multiband effects on β-FeSe single crystals. Phys. Rev. B 2012, 85, 094515. [Google Scholar] [CrossRef]
  23. Lin, J.Y.; Hsieh, Y.S.; Chareev, D.A.; Vasiliev, A.N.; Parsons, Y.; Yang, H.D. Coexistence of isotropic and extended s-wave order parameters in FeSe as revealed by low-temperature specific heat. Phys. Rev. B 2011, 84, 220507. [Google Scholar] [CrossRef]
  24. Hafiez, M.A.; Ge, J.; Vasiliev, A.N.; Chareev, D.A.; Vondel, J.V.; Moshchalkov, V.V.; Silhanek, A.V. Temperature dependence of lower critical field Hc1(T) shows nodeless superconductivity in FeSe. Phys. Rev. B 2013, 88, 174512. [Google Scholar] [CrossRef]
  25. Subedi, A.; Zhang, L.; Singh, D.J.; Du, M.H. Density functional study of FeS, FeSe, and FeTe: Electronic structure, magnetism, phonons, and superconductivity. Phys. Rev. B 2008, 78, 134514. [Google Scholar] [CrossRef] [Green Version]
  26. Shimojima, T.; Suzuki, Y.; Sonobe, T.; Nakamura, A.; Sakano, M.; Omachi, J.; Yoshioka, K.; Gonokami, M.K.; Ono, K.; Kumigashira, H.; et al. Lifting of xz/yz orbital degeneracy at the structural transition in detwinned FeSe. Phys. Rev. B 2014, 90, 121111. [Google Scholar] [CrossRef]
  27. Zhang, P.; Qian, T.; Richard, P.; Wang, X.P.; Miao, H.; Lv, B.Q.; Fu, B.B.; Wolf, T.; Meingast, C.; Wu, X.X.; et al. Observation of two distinct dxz/dyz band splittings in FeSe. Phys. Rev. B 2015, 91, 214503. [Google Scholar] [CrossRef]
  28. Song, C.L.; Wang, Y.L.; Cheng, P.; Jiang, Y.P.; Li, W.; Zhang, T.; Li, Z.; He, K.; Wang, L.L.; Jia, J.F.; et al. Direct observation of nodes and twofold symmetry in FeSe Superconductor. Science 2011, 332, 1410–1413. [Google Scholar] [CrossRef]
  29. Liu, D.; Li, C.; Huang, J.; Lei, B.; Wang, L.; Wu, X.; Shen, B.; Gao, Q.; Zhang, Y.; Liu, X.; et al. Orbital origin of extremely anisotropic superconducting gap in nematic phase of FeSe superconductor. Phys. Rev. X 2018, 8, 031033. [Google Scholar] [CrossRef]
  30. Mizuguchi, Y.; Tomioka, F.; Tsuda, S.; Yamaguchi, T.; Takano, Y. Superconductivity at 27 K in tetragonal FeSe under high pressure. Appl. Phys. Lett. 2008, 93, 152505. [Google Scholar] [CrossRef]
  31. Millican, J.N.; Phelan, D.; Thomas, E.L.; Leão, J.B.; Carpenter, E. Pressure-induced effects on the structure of the FeSe superconductor. Solid State Commun. 2009, 149, 707–710. [Google Scholar] [CrossRef] [Green Version]
  32. Garbarino, G.; Sow, A.; Lejay, P.; Sulpice, A.; Toulemonde, P.; Mezouar, M.; Núñez-Regueiro, M. High-temperature superconductivity (Tc onset at 34 K) in the high-pressure orthorhombic phase of FeSe. Europhys. Lett. 2009, 86, 27001. [Google Scholar] [CrossRef]
  33. Imai, T.; Ahilan, K.; Ning, F.L.; McQueen, T.M.; Cava, R.J. Why does undoped FeSe become a high-Tc superconductor under pressure? Phys. Rev. Lett. 2009, 102, 177005. [Google Scholar] [CrossRef] [PubMed]
  34. Bendele, M.; Ichsanow, A.; Pashkevich, Y.; Keller, L.; Strässle, T.; Gusev, A.; Pomjakushina, E.; Conder, K.; Khasanov, R.; Keller, H. Coexistence of superconductivity and magnetism in FeSe1−x under pressure. Phys. Rev. B 2012, 85, 064517. [Google Scholar] [CrossRef]
  35. Medvedev, S.; McQueen, T.M.; Troyan, I.A.; Palasyuk, T.; Eremets, M.I.; Cava, R.J.; Naghavi, S.; Casper, F.; Ksenofontov, V.; Wortmann, G.; et al. Electronic and magnetic phase diagram of β-Fe1.01Se with superconductivity at 36.7 K under pressure. Nat. Mater. 2009, 8, 630–633. [Google Scholar] [CrossRef]
  36. Terashima, T.; Kikugawa, N.; Kasahara, S.; Watashige, T.; Shibauchi, T.; Matsuda, Y.; Wolf, T.; Böhmer, A.E.; Hardy, F.; Meingast, C.; et al. Pressure-Induced antiferromagnetic transition and phase diagram in FeSe. J. Phys. Soc. Jpn. 2015, 84, 063701. [Google Scholar] [CrossRef]
  37. Bendele, M.; Amato, A.; Conder, K.; Elender, M.; Keller, H.; Klauss, H.H.; Luetkens, H.; Pomjakushina, E.; Raselli, A.; Khasanov, R. Pressure induced static magnetic order in superconducting FeSe1-x. Phys. Rev. Lett. 2010, 104, 087003. [Google Scholar] [CrossRef]
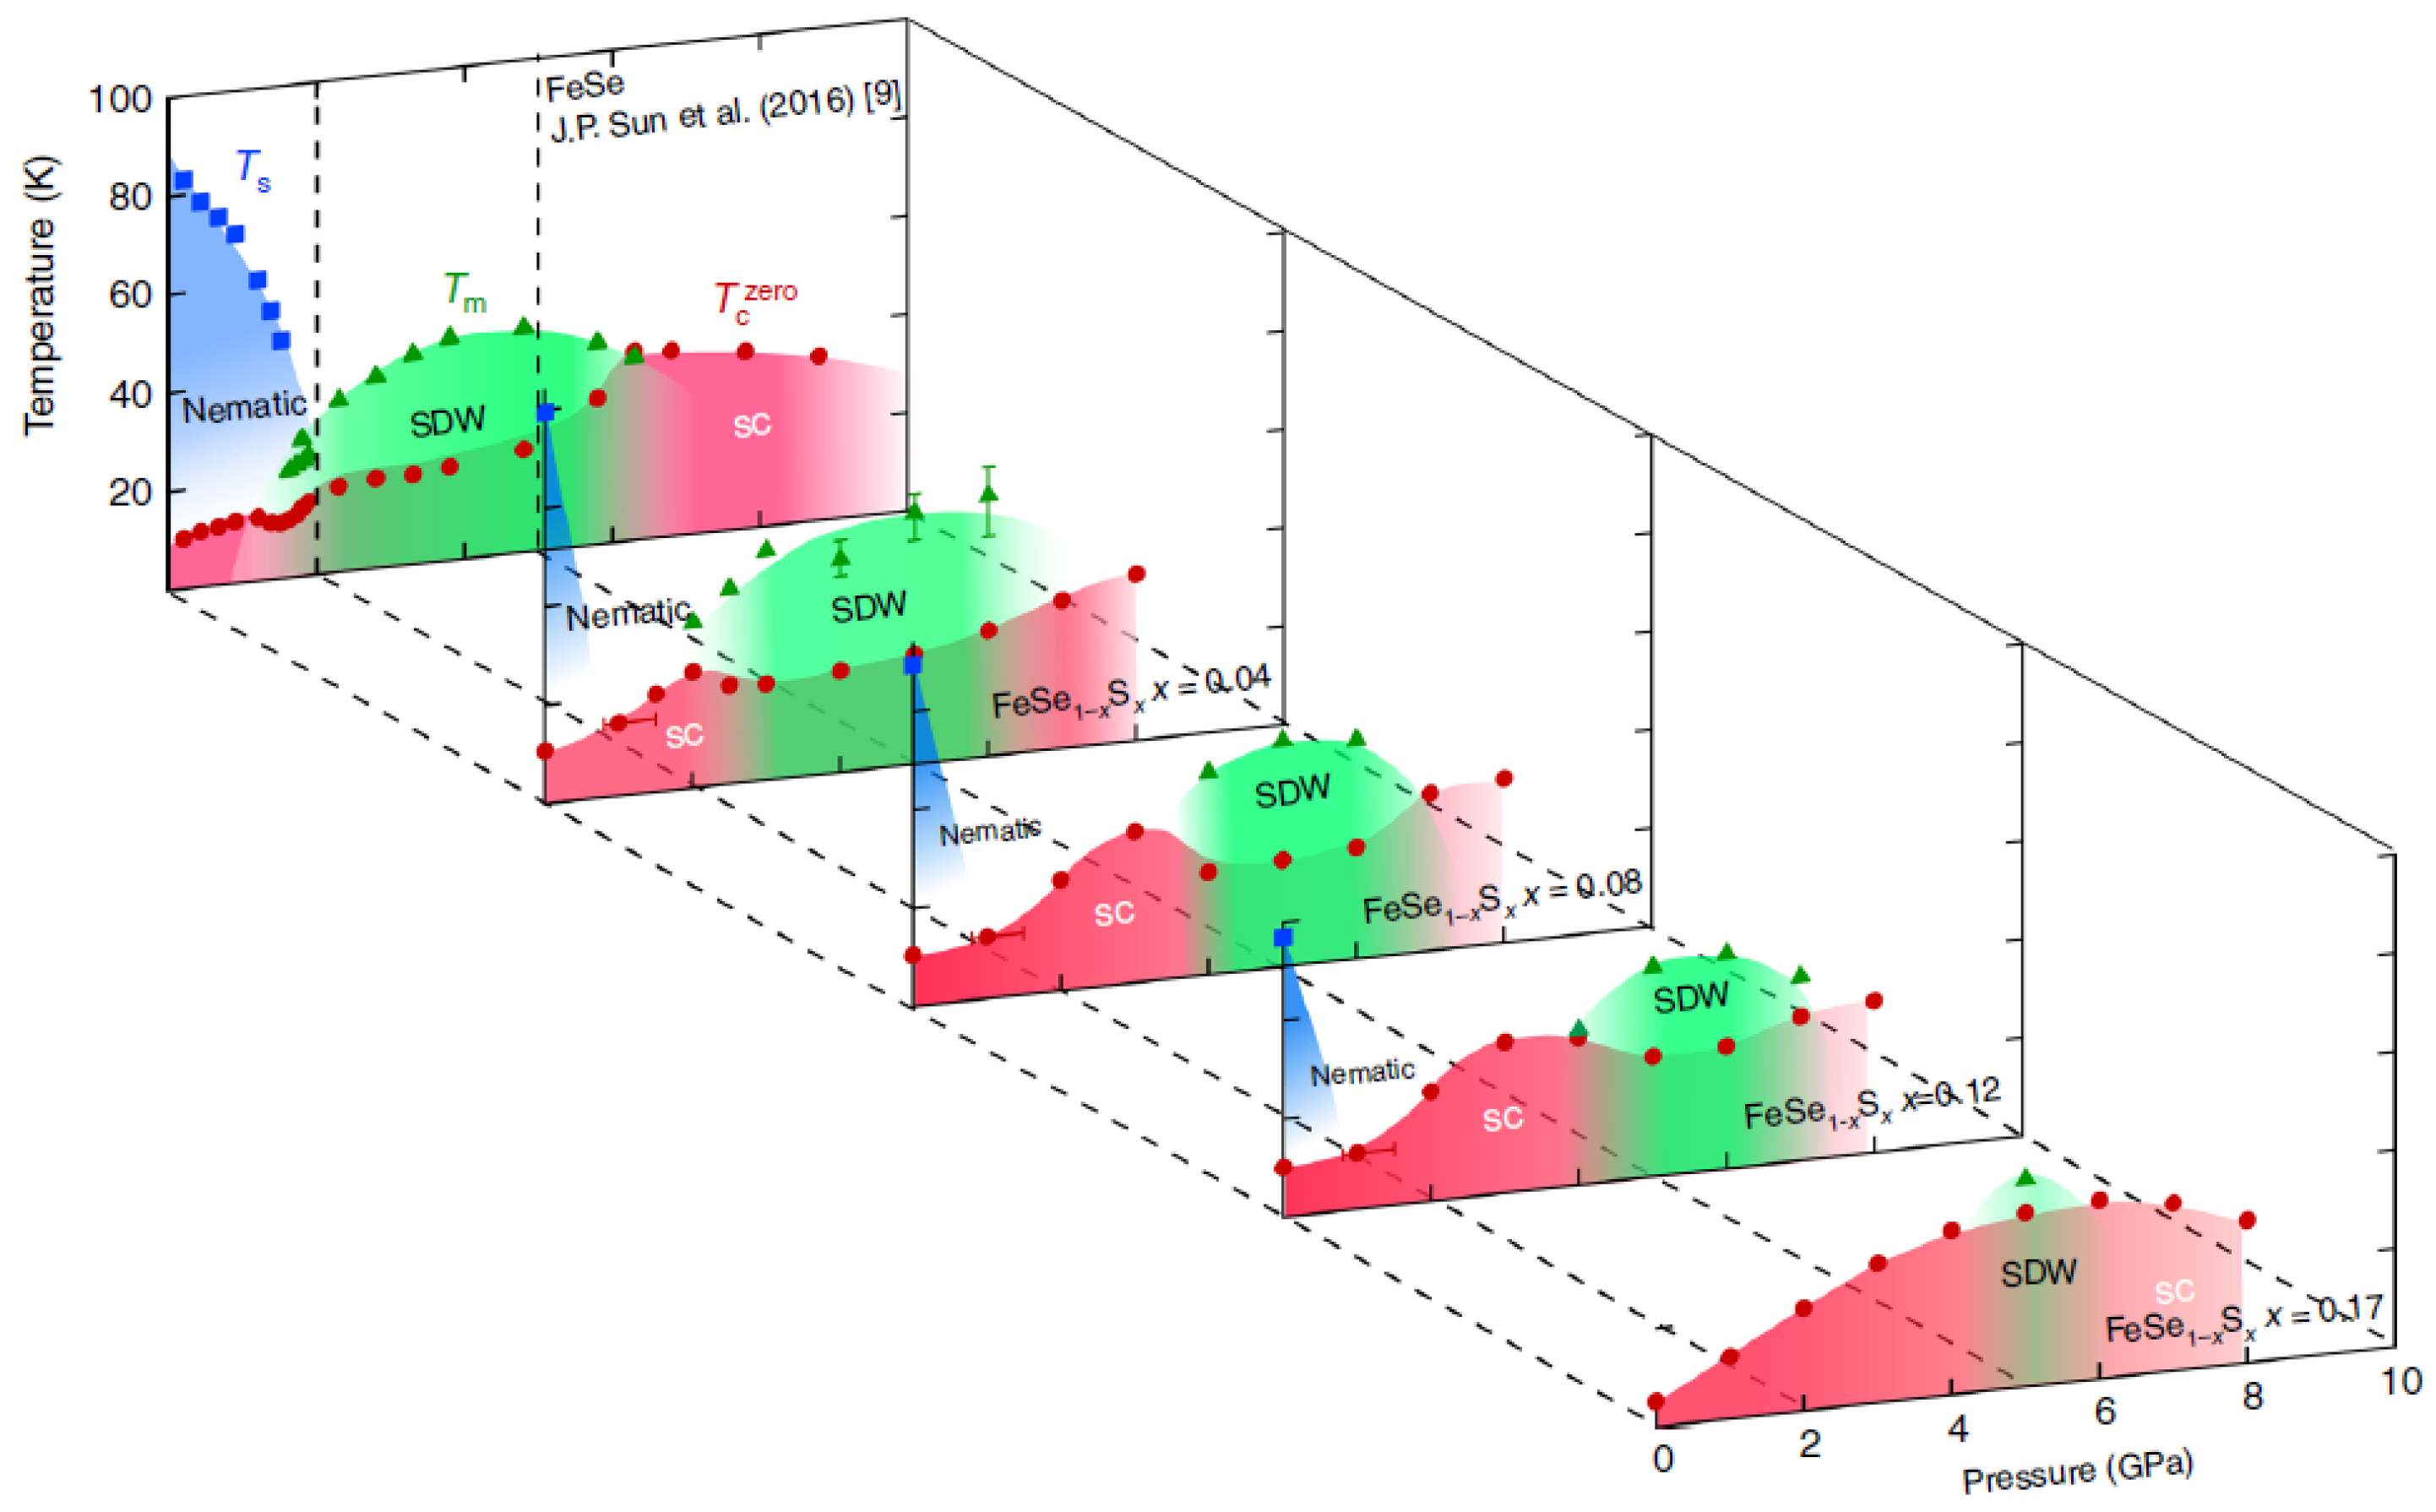
  38. Sun, J.P.; Matsuura, K.; Ye, G.Z.; Mizukami, Y.; Shimozawa, M.; Matsubayashi, K.; Yamashita, M.; Watashige, T.; Kasahara, S.; Matsuda, Y.; et al. Dome-shaped magnetic order competing with high-temperature superconductivity at high pressures in FeSe. Nat. Commun. 2016, 7, 12146. [Google Scholar] [CrossRef] [Green Version]
  39. Sun, J.P.; Ye, G.Z.; Shahi, P.; Yan, J.Q.; Matsuura, K.; Kontani, H.; Zhang, G.M.; Zhou, Q.; Sales, B.C.; Shibauchi, T.; et al. High-Tc superconductivity in FeSe at high pressure: dominant hole carriers and enhanced spin fluctuations. Phys. Rev. Lett. 2017, 118, 147004. [Google Scholar] [CrossRef]
  40. Yeh, K.W.; Hsu, C.H.; Huang, T.W.; Wu, P.M.; Huang, Y.L.; Chen, T.K.; Luo, J.L.; Wu, M.K. Se and Te doping study of the FeSe superconductors. J. Phys. Soc. Jpn. 2008, 77, 19–22. [Google Scholar] [CrossRef]
  41. Yeh, K.W.; Huang, T.W.; Huang, Y.l.; Chen, T.K.; Hsu, F.C.; Wu, P.; Lee, Y.C.; Chu, Y.Y.; Chen, C.L.; Luo, J.Y.; et al. Tellurium substitution effect on superconductivity of the α-phase iron selenide. Europhys. Lett. 2008, 84, 37002. [Google Scholar] [CrossRef]
  42. Liu, T.J.; Ke, X.; Qian, B.; Hu, J.; Fobes, D.; Vehstedt, E.K.; Pham, H.; Yang, J.H.; Fang, M.H.; Spinu, L.; et al. Charge-carrier localization induced by excess Fe in the superconductor Fe1+yTe1−xSex. Phys. Rev. B 2009, 80, 174509. [Google Scholar] [CrossRef]
  43. Yamazaki, T.; Sakurai, T.; Yaguchi, H. Size dependence of oxygen-annealing effects on superconductivity of Fe1+yTe1−xSx. J. Phys. Soc. Jpn. 2016, 85, 114712. [Google Scholar] [CrossRef]
  44. Sun, Y.; Shi, Z.X.; Tamegai, T. Review of annealing effects and superconductivity in Fe1+yTe1−xSex superconductors. Supercond. Sci. Technol. 2019, 32, 103001. [Google Scholar] [CrossRef]
  45. Taen, T.; Tsuchiya, Y.; Nakajima, Y.; Tamegai, T. Superconductivity at Tc∼14 K in single-crystalline FeTe0.61Se0.39. Phys. Rev. B 2009, 80, 092502. [Google Scholar] [CrossRef]
  46. Sun, Y.; Taen, T.; Tsuchiya, Y.; Shi, Z.X.; Tamegai, T. Effects of annealing, acid and alcoholic beverages on Fe1+yTe0.6Se0.4. Supercond. Sci. Technol. 2013, 26, 015015. [Google Scholar] [CrossRef]
  47. Louca, D.; Horigane, K.; Llobet, A.; Arita, R.; Ji, S.; Katayama, N.; Konbu, S.; Nakamura, K.; Koo, T.Y.; Tong, P.; et al. Local atomic structure of superconducting FeSe1−xTex. Phys. Rev. B 2010, 81, 134524. [Google Scholar] [CrossRef]
  48. Liu, T.J.; Hu, J.; Qian, B.; Fobes, D.; Mao, Z.Q.; Bao, W.; Reehuis, M.; Kimber, S.A.; Prokes, K.; Matas, S.; et al. From (π,0) magnetic order to superconductivity with (π, π) magnetic resonance in Fe1.02Te1-xSex. Nat. Mater. 2010, 9, 716–720. [Google Scholar] [CrossRef]
  49. Mizuguchi, Y.; Tomioka, F.; Tsuda, S.; Yamaguchi, T.; Takano, Y. Superconductivity in S-substituted FeTe. Appl. Phys. Lett. 2009, 94, 012503. [Google Scholar] [CrossRef] [Green Version]
  50. Abdel, H.M.; Zhang, Y.Y.; Cao, Z.Y.; Duan, C.G.; Karapetrov, G.; Pudalov, V.M.; Vlasenko, V.A.; Sadakov, A.V.; Knyazev, D.A.; Romanova, T.A.; et al. Superconducting properties of sulfur-doped iron selenide. Phys. Rev. B 2015, 91, 165109. [Google Scholar] [CrossRef] [Green Version]
  51. Watson, M.D.; Kim, T.K.; Haghighirad, A.A.; Blake, S.F.; Davies, N.R.; Hoesch, M.; Wolf, T.; Coldea, A.I. Suppression of orbital ordering by chemical pressure in FeSe1−xSx. Phys. Rev. B 2015, 92, 121108. [Google Scholar] [CrossRef]
  52. Matsuura, K.; Mizukami, Y.; Arai, Y.; Sugimura, Y.; Maejima, N.; Machida, A.; Watanuki, T.; Fukuda, T.; Yajima, T.; Hiroi, Z.; et al. Maximizing Tc by tuning nematicity and magnetism in FeSe1-xSx superconductors. Nat. Commun. 2017, 8, 1143. [Google Scholar] [CrossRef] [PubMed]
  53. Guo, J.G.; Jin, S.; Wang, G.; Wang, S.; Zhu, K.; Zhou, T.; He, M.; Chen, X. Superconductivity in the iron selenide KxFe2Se2 (0≤ x ≤1.0). Phys. Rev. B 2010, 82, 180520. [Google Scholar] [CrossRef]
  54. Guo, J.G.; Chen, X.L.; Wang, G.; Jin, S.F.; Zhou, T.T.; Lai, X.F. Effect of doping on electrical, magnetic, and superconducting properties of KxFe2−yS2. Phys. Rev. B 2012, 85. [Google Scholar] [CrossRef]
  55. Krzton-Maziopa, A.; Shermadini, Z.; Pomjakushina, E.; Pomjakushin, V.; Bendele, M.; Amato, A.; Khasanov, R.; Luetkens, H.; Conder, K. Synthesis and crystal growth of Cs0.8(FeSe0.98)2: a new iron-based superconductor with Tc = 27 K. J. Phys. Condens. Matter. 2011, 23, 052203. [Google Scholar] [CrossRef] [PubMed]
  56. Shermadini, Z.; Krzton-Maziopa, A.; Bendele, M.; Khasanov, R.; Luetkens, H.; Conder, K.; Pomjakushina, E.; Weyeneth, S.; Pomjakushin, V.; Bossen, O.; et al. Coexistence of magnetism and superconductivity in the iron-based compound Cs0.8(FeSe0.98)2. Phys. Rev. Lett. 2011, 106, 117602. [Google Scholar] [CrossRef] [PubMed]
  57. Wang, A.F.; Ying, J.J.; Yan, Y.J.; Liu, R.H.; Luo, X.G.; Li, Z.Y.; Wang, X.F.; Zhang, M.; Ye, G.J.; Cheng, P.; et al. Superconductivity at 32 K in single-crystalline RbxFe2−ySe2. Phys. Rev. B 2011, 83, 060512. [Google Scholar] [CrossRef]
  58. Wang, H.D.; Dong, C.H.; Li, Z.J.; Mao, Q.H.; Zhu, S.S.; Feng, C.M.; Yuan, H.Q.; Fang, M.H. Superconductivity at 32 K and anisotropy in Tl0.58Rb0.42Fe1.72Se2 crystals. Europhys. Lett. Assoc. 2011, 93, 47004. [Google Scholar] [CrossRef]
  59. Fang, M.H.; Wang, H.D.; Dong, C.H.; Li, Z.J.; Feng, C.M.; Chen, J.; Yuan, H.Q. Fe-based superconductivity with Tc=31 K bordering an antiferromagnetic insulator in (Tl,K) FexSe2. Europhys. Lett. Assoc. 2011, 94, 27009. [Google Scholar] [CrossRef]
  60. Wang, Z.; Song, Y.J.; Shi, H.L.; Wang, Z.W.; Chen, Z.; Tian, H.F.; Chen, G.F.; Guo, J.G.; Yang, H.X.; Li, J.Q. Microstructure and ordering of iron vacancies in the superconductor system KyFexSe2 as seen via transmission electron microscopy. Phys. Rev. B 2011, 83, 140505. [Google Scholar] [CrossRef]
  61. Ye, F.; Chi, S.; Bao, W.; Wang, X.F.; Ying, J.J.; Chen, X.H.; Wang, H.D.; Dong, C.H.; Fang, M. Common crystalline and magnetic structure of superconducting A2Fe4Se5 (A=K,Rb,Cs,Tl) single crystals measured using neutron diffraction. Phys. Rev. Lett. 2011, 107, 137003. [Google Scholar] [CrossRef]
  62. Li, W.; Ding, H.; Deng, P.; Chang, K.; Song, C.L.; He, K.; Wang, L.L.; Ma, X.C.; Hu, J.P.; Chen, X.; et al. Phase separation and magnetic order in K-doped iron selenide superconductor. Nat. Phys. 2011, 8, 126–130. [Google Scholar] [CrossRef] [Green Version]
  63. Li, W.; Ding, H.; Li, Z.; Deng, P.; Chang, K.; He, K.; Ji, S.H.; Wang, L.L.; Ma, X.C.; Hu, J.P.; et al. KFe2Se2 is the parent compound of K-doped iron selenide superconductors. Phys. Rev. Lett. 2012, 109, 057003. [Google Scholar] [CrossRef] [PubMed]
  64. Zhao, J.; Cao, H.; Bourret-Courchesne, E.; Lee, D.H.; Birgeneau, R.J. Neutron-diffraction measurements of an antiferromagnetic semiconducting phase in the vicinity of the high-temperature superconducting state of KxFe2-ySe2. Phys. Rev. Lett. 2012, 109, 267003. [Google Scholar] [CrossRef] [PubMed]
  65. Zhao, J.; Shen, Y.; Birgeneau, R.J.; Gao, M.; Lu, Z.Y.; Lee, D.H.; Lu, X.Z.; Xiang, H.J.; Abernathy, D.L.; Zhao, Y. Neutron scattering measurements of spatially anisotropic magnetic exchange interactions in semiconducting K0.85Fe1.54Se2 (TN = 280 K). Phys. Rev. Lett. 2014, 112, 177002. [Google Scholar] [CrossRef] [PubMed]
  66. Li, K.K.; Huang, Q.Z.; Zhang, Q.H.; Xiao, Z.W.; Kayami, T.; Hosono, H.; Yuan, D.D.; Guo, J.G.; Chen, X.L. CsFe4−δSe4: A compound closely related to alkali-intercalated FeSe superconductors. Inorg. Chem. 2018, 57, 4502. [Google Scholar] [CrossRef] [PubMed]
  67. Yuan, D.D.; Liu, N.; Li, K.K.; Jin, S.F.; Guo, J.G.; Chen, X.L. Structure evolution and spin-glass transition of layered compounds ALiFeSe2 (A = Na, K, Rb). Inorg. Chem. 2017, 56, 13187. [Google Scholar] [CrossRef] [PubMed]
  68. Ying, T.P.; Chen, X.L.; Wang, G.; Jin, S.F.; Zhou, T.T.; Lai, X.F.; Zhang, H.; Wang, W.Y. Observation of superconductivity at 30~46 K in AxFe2Se2 (A = Li, Na, Ba, Sr, Ca, Yb, and Eu). Sci. Rep. 2012, 2, 426. [Google Scholar] [CrossRef]
  69. Zheng, L.; Izumi, M.; Sakai, Y.; Eguchi, R.; Goto, H.; Takabayashi, Y.; Kambe, T.; Onji, T.; Araki, S.; Kobayashi, T.C.; et al. Superconductivity in (NH3)yCs0.4FeSe. Phys. Rev. B 2013, 88, 094521. [Google Scholar] [CrossRef]
  70. Guo, J.G.; Lei, H.C.; Hayashi, F.; Hosono, H. Superconductivity and phase instability of NH3-free Na-intercalated FeSe1-zSz. Nat. Commun. 2014, 5, 4756. [Google Scholar] [CrossRef]
  71. Ying, T.P.; Chen, X.; Wang, G.; Jin, S.; Lai, X.; Zhou, T.; Zhang, H.; Shen, S.; Wang, W. Superconducting phases in potassium-intercalated iron selenides. J. Am. Chem. Soc. 2013, 135, 2951–2954. [Google Scholar] [CrossRef]
  72. Liu, Y.; Wang, G.; Ying, T.P.; Lai, X.F.; Jin, S.F.; Liu, N.; Hu, J.P.; Chen, X.L. Understanding doping, vacancy, lattice stability, and superconductivity in KxFe2−ySe2. Adv. Sci. 2016, 160098. [Google Scholar] [CrossRef] [PubMed]
  73. Burrard-Lucas, M.; Free, D.G.; Sedlmaier, S.J.; Wright, J.D.; Cassidy, S.J.; Hara, Y.; Corkett, A.J.; Lancaster, T.; Baker, P.J.; Blundell, S.J.; et al. Enhancement of the superconducting transition temperature of FeSe by intercalation of a molecular spacer layer. Nat. Mater. 2013, 12, 15–19. [Google Scholar] [CrossRef] [PubMed]
  74. Jin, S.F.; Fan, X.; Wu, X.Z.; Sun, R.J.; Wu, H.; Huang, Q.Z.; Shi, C.L.; Xi, X.K.; Li, Z.L.; Chen, X.L. High-Tc superconducting phases in organic molecular intercalated iron selenides: synthesis and crystal structures. Chem. Commun. 2017, 53, 9729–9732. [Google Scholar] [CrossRef] [PubMed]
  75. Fan, X.; Deng, J.; Chen, H.X.; Zhao, L.L.; Sun, R.J.; Jin, S.F.; Chen, X.L. Nematicity and superconductivity in orthorhombic superconductor Na0.35(C3N2H10)0.426Fe2Se2. Phys. Rev. Mater. 2018, 2, 114802. [Google Scholar] [CrossRef]
  76. Lu, X.F.; Wang, N.Z.; Wu, H.; Wu, Y.P.; Zhao, D.; Zeng, X.Z.; Luo, X.G.; Wu, T.; Bao, W.; Zhang, G.H.; et al. Coexistence of superconductivity and antiferromagnetism in (Li0.8Fe0.2)OHFeSe. Nat. Mater. 2015, 14, 325–329. [Google Scholar] [CrossRef]
  77. Hayashi, F.; Lei, H.C.; Guo, J.G.; Hosono, H. Modulation effect of interlayer spacing on the superconductivity of electron-doped FeSe-based intercalates. Inorg. Chem. 2015, 54, 3346–3351. [Google Scholar] [CrossRef]
  78. Hosono, S.; Noji, T.; Hatakeda, T.; Kawamata, T.; Kato, M.; Koike, Y. New intercalation superconductor Lix(C6H16N2)yFe2−zSe2 with a very large interlayer-spacing and Tc = 38 K. J. Phys. Soc. Jpn. 2014, 83, 113704. [Google Scholar] [CrossRef]
  79. Zheng, L.; Sakai, Y.; Miao, X.; Nishiyama, S.; Terao, T.; Eguchi, R.; Goto, H.; Kubozono, Y. Superconductivity in (NH3)yNaxFeSe0.5Te0.5. Phys. Rev. B 2016, 94, 174505. [Google Scholar] [CrossRef]
  80. Sun, L.L.; Chen, X.J.; Guo, J.; Gao, P.W.; Huang, Q.Z.; Wang, H.D.; Fang, M.H.; Chen, X.L.; Chen, G.F.; Wu, Q.; et al. Re-emerging superconductivity at 48 kelvin in iron chalcogenides. Nature 2012, 483, 67. [Google Scholar] [CrossRef]
  81. Guo, J.; Chen, X.J.; Dai, J.H.; Zhang, C.; Guo, J.G.; Chen, X.L.; Wu, Q.; Gu, G.D.; Gao, P.W.; Yang, L.H.; et al. Pressure-driven quantum criticality in iron-selenide superconductors. Phys. Rev. Lett. 2012, 108, 197001. [Google Scholar] [CrossRef]
  82. Sun, J.P.; Shahi, P.; Zhou, H.X.; Huang, Y.L.; Chen, K.Y.; Wang, B.S.; Ni, S.L.; Li, N.N.; Zhang, K.; Yang, W.G.; et al. Reemergence of high-Tc superconductivity in the (Li1-xFex)OHFe1-ySe under high pressure. Nat. Commun. 2018, 9, 380. [Google Scholar] [CrossRef]
  83. Shahi, P.; Sun, J.P.; Sun, S.S.; Jiao, Y.Y.; Chen, K.Y.; Wang, S.H.; Lei, H.C.; Uwatoko, Y.; Wang, B.S.; Cheng, J.-G. High-Tc superconductivity up to 55 K under high pressure in the heavily electron doped Lix(NH3)yFe2Se2 single crystal. Phys. Rev. B 2018, 97, 020508. [Google Scholar] [CrossRef]
  84. Qian, T.; Wang, X.P.; Jin, W.C.; Zhang, P.; Richard, P.; Xu, G.; Dai, X.; Fang, Z.; Guo, J.G.; Chen, X.L.; et al. Absence of a holelike fermi surface for the iron-based K0.8F1.7Se2 superconductor revealed by angle-resolved photoemission spectroscopy. Phys. Rev. Lett. 2011, 106, 187001. [Google Scholar] [CrossRef] [PubMed]
  85. Zhao, L.; Liang, A.J.; Yuan, D.N.; Hu, Y.; Liu, D.; Huang, J.W.; He, S.L.; Shen, B.; Xu, Y.; Liu, X.; et al. Common electronic origin of superconductivity in (Li,Fe)OHFeSe bulk superconductor and single-layer FeSe/SrTiO3 films. Nat. Commun. 2016, 7, 10608. [Google Scholar] [CrossRef] [PubMed]
  86. Zhao, L.; Mou, D.X.; Liu, S.Y.; Jia, X.W.; He, J.F.; Peng, Y.Y.; Yu, L.; Liu, X.; Liu, G.D.; He, S.L.; et al. Common Fermi-surface topology and nodeless superconducting gap of K0.68Fe1.79Se2 and (Tl0.45K0.34)Fe1.84Se2 superconductors revealed via angle-resolved photoemission. Phys. Rev. B 2011, 83, 140508. [Google Scholar] [CrossRef]
  87. Mazin, I.I.; Singh, D.J.; Johannes, M.D.; Du, M.H. Unconventional superconductivity with a sign reversal in the order parameter of LaFeAsO1-xFx. Phys. Rev. Lett. 2008, 101, 057003. [Google Scholar] [CrossRef] [PubMed]
  88. Zhang, Y.; Yang, L.X.; Xu, M.; Ye, Z.R.; Chen, F.; He, C.; Xu, H.C.; Jiang, J.; Xie, B.P.; Ying, J.J.; et al. Nodeless superconducting gap in AxFe2Se2 (A=K,Cs) revealed by angle-resolved photoemission spectroscopy. Nat. Mater. 2011, 10, 273–277. [Google Scholar] [CrossRef] [PubMed]
  89. Wang, Q.Y.; Li, Z.; Zhang, W.H.; Zhang, Z.C.; Zhang, J.S.; Li, W.; Ding, H.; Ou, Y.B.; Deng, P.; Chang, K.; et al. Interface-induced high-temperature superconductivity in single unit-cell FeSe films on SrTiO3. Chin. Phys. Lett. 2012, 29, 037402. [Google Scholar] [CrossRef]
  90. Ge, J.F.; Liu, Z.L.; Liu, C.H.; Gao, C.L.; Qian, D.; Xue, Q.K.; Liu, Y.; Jia, J.F. Superconductivity above 100 K in single-layer FeSe films on doped SrTiO3. Nat. Mater. 2015, 14, 285–289. [Google Scholar] [CrossRef]
  91. He, S.L.; He, J.F.; Zhang, W.H.; Zhao, L.; Liu, D.F.; Liu, X.; Mou, D.X.; Ou, Y.B.; Wang, Q.Y.; Li, Z. Phase diagram and electronic indication of high-temperature superconductivity at 65 K in single-layer FeSe films. Nat. Mater. 2013, 12, 605–610. [Google Scholar] [CrossRef]
  92. Tan, S.Y.; Zhang, Y.; Xia, M.; Ye, Z.R.; Chen, F.; Xie, X.; Peng, R.; Xu, D.F.; Fan, Q.; Xu, H.C. Interface-induced superconductivity and strain-dependent spin density waves in FeSe/SrTiO3 thin films. Nat. Mater. 2013, 12, 634–640. [Google Scholar] [CrossRef] [PubMed]
  93. Rebec, S.N.; Jia, T.; Zhang, C.; Hashimoto, M.; Lu, D.H.; Moore, R.G.; Shen, Z.X. Coexistence of replica bands and superconductivity in FeSe monolayer films. Phys. Rev. Lett. 2017, 118, 067002. [Google Scholar] [CrossRef] [PubMed]
  94. Lee, J.J.; Schmitt, F.T.; Moore, R.G.; Johnston, S.; Cui, Y.T.; Li, W.; Yi, M.; Liu, Z.K.; Hashimoto, M.; Zhang, Y. Interfacial mode coupling as the origin of the enhancement of Tc in FeSe films on SrTiO3. Nature 2014, 515, 245–248. [Google Scholar] [CrossRef] [PubMed]
  95. Ding, H.; Lv, Y.F.; Zhao, K.; Wang, W.L.; Wang, L.L.; Song, C.L.; Chen, X.; Ma, X.C.; Xue, Q.K. High-temperature superconductivity in single-unit-cell FeSe films on anatase TiO2(001). Phys. Rev. Lett. 2016, 117. [Google Scholar] [CrossRef]
  96. Zhou, G.Y.; Zhang, Q.H.; Zheng, F.W.; Zhang, D.; Liu, C.; Wang, X.X.; Song, C.L.; He, K.; Ma, X.C.; Gu, L. Interface enhanced superconductivity in monolayer FeSe films on MgO (001): charge transfer with atomic substitution. Sci. Bull. 2019, 63, 747–752. [Google Scholar] [CrossRef]
  97. Miyata, Y.; Nakayama, K.; Sugawara, K.; Sato, T.; Takahashi, T. High-temperature superconductivity in potassium-coated multilayer FeSe thin films. Nat. Mater. 2015, 14, 775–779. [Google Scholar] [CrossRef]
  98. Song, Q.; Yu, T.L.; Lou, X.; Xie, B.P.; Xu, H.C.; Wen, C.H.P.; Yao, Q.; Zhang, S.Y.; Zhu, X.T.; Guo, J.D.; et al. Evidence of cooperative effect on the enhanced superconducting transition temperature at the FeSe/SrTiO3 interface. Nat. Commun. 2019, 10, 758. [Google Scholar] [CrossRef]
  99. Rodriguez, J.P. Isotropic Cooper pairs with emergent sign changes in a single-layer iron superconductor. Phys. Rev. B 2017, 95, 134511. [Google Scholar] [CrossRef] [Green Version]
  100. Rodriguez, J.P.; Melendrez, R. Fermi surface pockets in electron-doped iron superconductor by Lifshitz transition. J. Phys. Commun. 2018, 2, 105011. [Google Scholar] [CrossRef] [Green Version]
Figure 1. (a,b) Crystal structure of FeSe. (c) Observed (open black circle) and calculated (red solid line) powder diffraction intensities of FeSe0.88 at 300 K using space group P4/nmm. (d) The temperature dependence of the γ-angle fitted with P-1 symmetry. The single peak of the (2, 2, 0), (2, 0, 3), (2, 2, 1) reflection is seen in (c), splitting of the diffraction peaks into two peaks was observed (Figure reprinted from Hsu, F.C. et al. Proc. Natl. Acad. Sci. U. S. A. 2008, 105, 14262–14264. Copyright 2008 by the National Academy of Sciences of the USA).
Crystals 09 00560 g001
Figure 2. (a) Schematic diagram of the low-temperature orthorhombic structure of FeSe0.92. (b,c) Geometry of the FeSe4 tetrahedra and the SeFe4 pyramids with three distinct Se–Fe–Se and Fe–Se–Fe bond angles, respectively. (d) Temperature dependent lattice constants of FeSe. (Figure reprinted from Margadonna, S. et al. Chem. Commun. (Cambridge, U. K.). 2008, 5607–5609. Copyright 2008 by the Royal Society of Chemistry).
Crystals 09 00560 g002
Figure 3. (a) Scanning electron micrographs of the as-grown FeSe0.9 single crystal 2–3 mm in width and 50–60 μm in thickness by the high temperature flux-method. (b) The FeSe0.96S0.04 single crystal was obtained by chemical vapor deposition (Figure 3a reprinted from Vedeneev S.I. et al. Phys. Rev. B 2013, 87, 134512. Copyright 2013 by American Physical Society. Figure 3b reprinted from Chareev, D. et al. Cryst. Eng. Comm. 2013, 15, 1989–1993. Copyright 2013 by the Royal Society of Chemistry).
Crystals 09 00560 g003
Figure 4. (a) Determination of the upper critical field Hc2(0) from the temperature dependence of the resistivity ρ(T) of β-FeSe single crystals for H//(101) and H⊥(101) directions. (b) Temperature-dependence of Hc1 for both H//(101) and H⊥(101) directions. The solid blue line was the fitting curve using Hc1(T) = Hc1(0)[1 − (T/Tc)2] for H//(101). (c) Temperature dependence of carrier density n (nh − ne) of the β-FeSe crystal. (d) Fitted curve of two-gap model with anisotropic s-wave and d-wave models (Figure 4a,b reprinted from Lei H.C. et al. Phys. Rev. B 2011, 84, 014520. Copyright 2011 by American Physical Society. Figure 4c reprinted from Lei H.C. et al. Phys. Rev. B 2012, 85, 094515. Copyright 2012 by American Physical Society. Figure 4d reprinted from Hafiez, M.A. et al. Phys. Rev. B 2013, 88, 174512. Copyright 2013 by American Physical Society].
Crystals 09 00560 g004
Figure 5. Electronic phase diagram of FeSe1−x under pressure. (a) Pressure dependence of the Tc, TN, and the superconducting and magnetic volume fractions of FeSe1−x. (b) Electronic phase diagram of Fe1.01Se under a pressure range from 0 to 40 GPa. The maximum Tc observed was 36.7 K at 8.9 GPa (Figure 5a reprinted from Bendele M. et al. Phys. Rev. B 2012, 85, 064517. Copyright 2012 by American Physical Society. Figure 5b reprinted from Medvedev S. et al. Nat. Mater. 2009, 8, 630–633. Copyright 2009 by Macmillan Publishers Limited).
Crystals 09 00560 g005
Figure 6. Superconducting phase diagram of bulk FeSe under pressure (Figure reprinted from Sun, J.P. et al. Nat. Commun. 2016, 7, 12146. Copyright 2016 by Macmillan Publishers Limited).
Crystals 09 00560 g006
Figure 7. (a) Te-doping dependence of structural evolution and Tc of FeSe1−xTex. (b) Temperature dependence of FeSe1−xTex resistance under zero magnetism (Figure reprinted from Yeh, K.W. et al. J. Phys. Soc. Jpn. 2008, 77, 19–22. Copyright 2008 by JPS).
Crystals 09 00560 g007
Figure 8. Temperature-pressure phase diagrams of FeSe1−xSx (Figure reprinted from Matsuura, K. et al. Nat. Commun. 2017, 8, 1143. Copyright 2017 by Macmillan Publishers Limited).
Crystals 09 00560 g008
Figure 9. (a) PXRD pattern and Rietveld refinements profile of K0.8Fe2Se2. Crystal structure is shown as inset. (b) Temperature dependence of magnetization of the K0.8Fe2Se2 single crystal (Figure reprinted from Guo J.G. et al. Phys. Rev. B 2010, 82, 180520. Copyright 2010 by American Physical Society).
Crystals 09 00560 g009
Figure 10. (a) PXRD pattern and Rietveld refinements profile of NaFe2Se2 at ambient temperature. Inset shows the crystal structure of NaFe2Se2. (b) Temperature dependence of magnetization of NaFe2Se2 polycrystalline sample. (Left) inset shows superconducting loops of NaFe2Se2 at 10 K and 60 K, respectively. (Right) inset shows temperature dependence of the electrical resistance of cold-pressed NaFe2Se2. (c) Enlargement of (002) peak of PXRD patterns for KxFe2Se2(NH3)y (x = 0.25, 0.4, 0.5, and 0.65) samples measured at 297 K. (d) Tcs of KxFe2Se2(NH3)y as a function of nominal potassium content (Figure 10a,b reprinted from Ying, T.P. et al. Sci. Rep. 2012, 2, 426. Copyright 2012 by Macmillan Publishers Limited. Figure 10c,d reprinted from Ying, T. P. et al. J. Am. Chem. Soc. 2013, 135, 2951–2954. Copyright 2013 by American Chemical Society).
Crystals 09 00560 g010
Figure 11. (a–b) Crystal structure of Na0.39(C2N2H8)0.77Fe2Se2. (c) Rietveld refinements of NPD pattern. Inset is the atomic geometry of FeSe4 tetrahedra. (d) Rietveld refinements of PXRD pattern. Inset shows the expanded range of 20°–90°. [Figure reprinted from Jin S.F. et al. Chem. Commun. (Cambridge, U. K.) 2017, 53, 9729-9732. Copyright 2017 by The Royal Society of Chemistry.].
Crystals 09 00560 g011
Figure 12. (a,b) Crystal structure of (Li0.8Fe0.2)OHFeSe. (c) Rietveld refinements of PND pattern of (Li0.8Fe0.2)OHFeSe (Figure reprinted from Lu X.F. et al. Nat. Mater. 2015, 14, 325–329. Copyright 2015 by Macmillan Publishers Limited).
Crystals 09 00560 g012
Figure 13. (a) Electronic band structure of K0.8Fe1.7Se2 and possible (π, π) scattering vector. (b) Fermi surface of (Li0.84Fe0.16)OHFe0.98Se measured at 20 K (Figure reprinted from Qian T. et al. Phys. Rev. Lett. 2011, 106, 187001. Copyright 2011 by American Physical Society. Reprinted from Zhao L. et al. Nat. Commun. 2016, 7, 10608. Copyright 2016 by Macmillan Publishers Limited).
Crystals 09 00560 g013
Figure 14. (a) Temperature dependence of square resistivity of a 5-UC-thick FeSe film on insulating STO (001). (b) Tunneling spectrum measurement of the 1-UC-thick FeSe film on STO (001) at 4.2 K. (c) dI/dV spectrum of the 2-UC-thick FeSe film on insulating STO (001) at 4.2 K. (Figure reprinted from Wang, Q.Y. et al. Chin. Phys. Lett. 2012, 29, 037402. Copyright 2012 by Chinese Physical Society and IOP Publishing Ltd.).
Crystals 09 00560 g014
Figure 15. (ad) Symmetrized energy distribution curves (EDCs) of the Fermi surface near the M point in the Brillouin zone with various annealing process. (eh) Temperature dependence of the superconducting gap. Green lines are fitting curves based on the BCS model (Figure reprinted from He, S.L. et al. Nat. Mater. 2013, 12, 605–610. Copyright 2013 by Macmillan Publishers Limited.).
Crystals 09 00560 g015
Figure 16. (a) The proposed phase diagram of various FeSe film and bulk FeSe. (b) Tc and superconducting gap of bulk FeSe, FeSe grown on the SiC (0001) substrate, K-doped thin FeSe film, K-doped FeSe film grown on the STO (001) substrate, single unit cell (SUC) FeSe/STO (001), and FeSe/STO (110). (Figure 16a reprinted from Tan, S.Y. et al. Nat. Mater. 2013, 12, 634–640. Copyright 2013 by Macmillan Publishers Limited. Figure 16b reprinted from Rebec, S.N. et al. Phys. Rev. Lett. 2017, 118, 067002. Copyright 2017 by American Physical Society).
Crystals 09 00560 g016
Figure 17. Electron-phonon coupling effect and measurement of Tc enhancement. (a) High-statistics scan at the M point of the first Brillouin zone measured at 10 K. (b) The EDC after background subtraction and the calculated counterpart. (c) Theoretical calculation involving hole and electron bands coupled to a dispersion phonon mode via model spectral functions, and the dashed line is the symmetrized energy distribution curves. (d) Tc enhancement as a function of electron–phonon coupling strength (Veff/J). (Figure 17 reprinted from Lee, J.J. et al. Nature 2014, 515, 245–248. Copyright 2014 by Macmillan Publishers Limited).
Crystals 09 00560 g017
Figure 18. (a) STM topography of TiO2 with lower density of oxygen vacancies after annealing (bright spots). (b) STM topography in a TiO2 island supported by the STO substrate. (c) Enlarged STM topography acquired on a TiO2 island with oxygen vacancies (without annealing). (d) Low energy dI/dV spectra taken on the SUC and DUC FeSe films. (e) A series of dI/dV spectra acquired from the FeSe surface along one direction (Figure 18 reprinted from Ding, H. et al. Phys. Rev. Lett. 2016, 117. Copyright 2016 by American Physical Society).
Crystals 09 00560 g018
Figure 19. (a,d,g,j,m) Schematic diagram of the FeSe films with different thicknesses and content grown on the STO substrate. (b,e,h,k,n) Fermi surfaces mapped out by ARPES. Green and blue lines are momentum cuts around the Γ and M points. (c,f,i,l,o) ARPES intensity image near the Fermi energy (EF) as a function of binding energy and wav-vector along the cuts close to Γ and Μ. (Figure 19 reprinted from Miyata, Y. et al. Nat. Mater. 2015, 14, 775–779. Copyright 2015 by Macmillan Publishers Limited).
Crystals 09 00560 g019
Figure 20. (a,b) Relationship between the superconducting gap Δ1, Δ2 and the intensity ratio (η) between the side band and the main band. The insets show the connection between the superconducting gap sizes and doping for corresponding samples. (Figure 20 reprinted from Song, Q. et al. Nat. Commun. 2019, 10, 758. Copyright 2019 by Macmillan Publishers Limited).
Crystals 09 00560 g020

