Next Article in Journal
Thermoluminescence Characteristics of Terbium Doped Zinc Borates
Next Article in Special Issue
Preface of the Special Issue “Pharmaceutical Crystals”
Previous Article in Journal
Crystal Structures and Spectroscopic Characterization of Four Synthetic Cathinones: 1-(4-Chlorophenyl)-2-(Dimethylamino)Propan-1-One (N-Methyl-Clephedrone, 4-CDC), 1-(1,3-Benzodioxol-5-yl)-2-(Tert-Butylamino)Propan-1-One (tBuONE, Tertylone, MDPT), 1-(4-Fluorophenyl)-2-(Pyrrolidin-1-yl)Hexan-1-One (4F-PHP) and 2-(Ethylamino)-1-(3-Methylphenyl)Propan-1-One (3-Methyl-Ethylcathinone, 3-MEC)
Article

Impact of Crystal Habit on Solubility of Ticagrelor

Department of Chemistry, Zhejiang University, Hangzhou 310028, China
*
Authors to whom correspondence should be addressed.
Crystals 2019, 9(11), 556; https://doi.org/10.3390/cryst9110556
Submission received: 17 September 2019 / Revised: 19 October 2019 / Accepted: 23 October 2019 / Published: 24 October 2019
(This article belongs to the Special Issue Pharmaceutical Crystals)

Abstract

:
Drugs with poor biopharmaceutical performance are the main obstacle to the development and design of medicinal preparations. The anisotropic surface chemistry of different surfaces on the crystal influences its physical and chemical properties, such as solubility, tableting, etc. In this study, the antisolvent crystallization and rapid-cooling crystallization were carried out to tune the crystal habits of ticagrelor (TICA) form II. Different crystal habits of ticagrelor (TICA) form II (TICA-A, TICA-B, TICA-C, TICA-D, and TICA-E) were prepared and evaluated for solubility. The single-crystal diffraction (SXRD) indicated that TICA form II belongs to the triclinic P1 space group with four TICA molecules in the asymmetric unit. The TICA molecules are generated through intermolecular hydrogen bonds along the (010) direction, forming an infinite molecular chain, which are further stacked by hydrogen bonds between hydroxyethoxy side chains, forming molecular circles composed of six TICA molecules along bc directions. Thus, in the case of TICA form II, hydrogen bonds drive growth along one axis (b-axis), which results in the formation of mostly needle-shape crystals. Morphology and face indexation reveals that (001), (010) and (01-1) are the main crystal planes. Powder diffractions showed that five habits have the same crystal structure and different relative intensity of diffraction peak. The solubility of the obtained crystals showed the crystal habits affect their solubility. This work is helpful for studying the mechanism of crystal habit modification and its effect on solubility.

Graphical Abstract

1. Introduction

Ticagrelor (TICA) is an oral antiplatelet drug that can be used in combination with a small amount of aspirin to reduce the danger of stroke and myocardial infarction in patients with acute coronary syndrome [1,2,3]. Similar to thiophene pyridine, ticagrelor inhibits the pro-thrombotic effect of ADP by blocking the platelet P2Y12 receptor. Unlike the thieno pyridines, ticagrelor reversibly binds to the P2Y12 receptor, showing rapid onset and offset of effect and does not require metabolic activation [4]. TICA has been used in clinical trials to reduce the incidence of recurrent myocardial infarction and stent thrombosis and was approved for use in the USA in 2011 [5,6,7,8,9,10]. According to the patent, TICA presents four polymorphisms (I, II, III and IV) and several pseudopolymorphs, such as monohydrate and DMSO solvate. However, only two crystal structures of them (form I and DMSO solvate) have been reported [11,12,13]. Different crystal forms have different stability, solubility, fluidity, etc., among which the TICA form II has the best stability, so it is widely used in clinical and has great commercial value. Unfortunately, ticagrelor belongs to biopharmaceutics classification system(BCS) class IV drug, with limited bioavailability (30–42%) [14].
Improving the dissolution rate is the key to obtaining a therapeutic effect and the rate-limiting step for bioavailability. The solubility and bioavailability are generally improved by crystal characteristics such as crystal habit, polymorphism and reduction of the particle size [15,16,17,18,19,20]. There have been many studies demonstrating the effect of polymorphism on oral bioavailability and/or dissolution rate [21]. However, the dissolution rate not only differs for different polymorphisms, but also, for different crystal habits [22], which has received scant attention. Meanwhile, crystal habits also influence stability, flowability, suspension, packing, density, compaction, etc. [23,24,25,26,27]. Thus, optimizing crystal properties by modification of the crystal habit of a drug seems to offer an alternative approach to changing the bioavailability of drugs. The relative growth rate of each surface determines the overall shape of the crystal. The growth rate of the crystal surface will be controlled by a combination of structure-related factors, such as dislocations and intermolecular bonds, and by exterior factors such as solvents, rate of agitation, additives, temperature, etc. [28,29,30,31,32,33,34,35].
This study aims to systematically investigate how crystal behavior affects the ticagrelor’s solubility. TICA form II (TICA-II) with different crystal habits were prepared by controlling the crystallization process. To systematically investigate the relationship between crystal habit and orientation of the molecules of TICA form II in the crystal lattice, single crystals were obtained, and the crystal structure is studied and reported here for first time. Morphology prediction based on BFDH (Bravais-Friedel-Donnay-Harker) theory [36,37] and face indexation [38], together with Optical Microscopy, were performed to correlate experimental and simulated crystal habits. Using X-ray powder diffraction analysis, polymorphic form conformity for different crystal habits were confirmed and preferred orientations of crystals were obtained, which were associated with the dominant crystal faces. X-Ray Photoelectron Spectroscopy (XPS) values and specific surface area were used to establish the surface chemistry. The results showed that the difference of solubility is associated with the surface anisotropy of the TICA crystal.

2. Experimental Section

2.1. Materials

Ticagrelor (TICA) form II was received from Zhejiang Ausun Pharmaceutical (Zhejiang, China). Figure 1 presents a chemical schematic of TICA. The chemical reagents used were of analytical grade.

2.2. Crystallization Experiments

Ticagrelor form II with different crystal habits (designated as TICA-A, TICA-B, TICA-C, TICA-D, and TICA-E) were prepared by recrystallization methods (Table S1).
TICA-A and TICA-D were crystallized from acetonitrile and butyl acetate, respectively, through rapid cooling and the mass ration of solute/solvent were 1:8 and 1:10, respectively. The solution of TICA was heated to 60 °C to ensure that no crystals remained in the solution and then underwent rapid cooling to 37 °C with stirring for 1 h. After that, the crystals were filtered and dried at 60 ℃ under vacuum.
TICA-B, TICA-C, and TICA-E were prepared by antisolvent methods and N-heptane used as antisolvent. The main differences are initial saturation, i.e., the mass ratio of solute and solvent (ethyl acetate). TICA was dissolved in ethyl acetate, the mass ratio (m/v) was 1:15, 1:20 and 1:10, respectively, and heated to 60 °C to dissolve completely. Stopping heating was applied and the antisolvent (n-heptane) was added to the above solutions at a 1 mL∙min−1 dropping rate under constant stirring. The antisolvent to solvent ratios for TICA-B, TICA-C and TICA-E were 1:1,1:1 and 1:1.5, respectively. The solution was then left to cool down to 25~35 °C with stirring. The obtained crystals were filtered off and dried at 60 °C under vacuum.
The single crystals of TICA form II were prepared by dissolving TICA (100 mg) in acetonitrile (18 mL) and allowing the solution to evaporate slowly. Suitable single crystals had grown after 7 days.

2.3. Solubility Studies

To investigate the solubility of five samples, Ultraviolet-Visible (UV) spectrophotometry was used (Thermo Scientific Evolution 300, Thermo Scientific, Waltham, MA, USA). The concentrations of TICA crystal habits were calculated by the standard curve method (λmax = 257 nm).
A beaker containing 150 mL of pH = 1.2 HCl was equilibrated at 37 °C, then approximately 150 mg of samples that had been passed through a 300 mesh sieve beforehand were added to the beaker, which was stirred at 150 rpm on a magnetic stirrer. Slurry was filtered with 0.22 μm nylon filters after 2, 4, 6, 8, 10, 15, 20, 25, 30, 40, 50, 60, 90, 120, 150, 180, 210, and 240 min. Each filtered aliquot was assayed by UV analysis at 257 nm. To ensure the accuracy of experimental data, all experiments were repeated three times.
The solubility of TICA-A, TICA-B, TICA-C, TICA-D, and TICA-E in pH = 1.2 HCl at 37 °C were measured by adding excess drug (about 150 mg) in 20 mL of pH = 1.2 HCl in a 25 mL glass bottle with screw cap. Then bottles were shaken in the magnetic stirring water bath (ALBOTE, Henan, China) at 100 rpm and kept at 37 °C (± 0.2 °C). The samples were withdrawn after 72 h, then filtered with 0.22 μm nylon filters and measured by an UV spectrometer.

2.4. X-Ray Powder Diffraction (PXRD)

All samples used in the PXRD experiments were sieved through 300 mesh beforehand and PXRD patterns were recorded at room temperature on a D/Max-2550PC diffractometer (Rigaku, Japan). The diffractometer was operated with monochromator Cu Kα radiation (λ = 1.5418 Å) at 40 kV and 250 mA. The data were recorded over a scanning range of 3~40° (2θ), with an increasing step size of 0.02° (2θ), and scanning speed of 3°/min.

2.5. Single-Crystal X-Ray Diffraction

Using a Bruker APEX-II CCD diffractometer (Bruker, Germany) with Mo Kα(λ = 0.7107 Å) radiation to collect SXRD data at −100 °C. The SAINT V8.38A [38] was used on data reduction. The absorption correction was applied with the use of semi-empirical methods of the SADABS program [39]. The crystal structure was solved by direct methods using the SHELX-S program and refined by full-matrix least-squares methods with anisotropic thermal parameters for all non-hydrogen atoms on F2 using SHELX-L [40,41]. Hydrogen atoms were placed in the position of calculation and were refined isotropically using a riding model [42]. Mercury [43] and Diamond [44] were used to draw figures.

2.6. Optical Microscopy

TICA crystal habits were observed for their shape and aspect ratio using a Leica DMLP polarized light microscope (Shanghai Optical Instrument Factory, China).

2.7. X-Ray Photoelectron Spectroscopy (XPS)

XPS were measured using a KRATOS AXIS ULTRA (DLD) (Shimadzu, Japan). The binding energy range was from 0 to 1100 eV for regions of C 1s, N 1s, O 1s, F 1s, and S 2p, with an average peak binding energy of 284.2, 397.4, 530.3, 684.8, and 160.9 eV, respectively.

2.8. Specific Surface Area

All samples were sieved through 300 mesh beforehand. The specific surface area was measured by the nitrogen adsorption method (Tristar II 3020 Surface Area analyzer, Micromeritics, Shanghai, China). About 100 mg samples were degassed for an hour in a vacuum environment at 80 °C to remove moisture, and then the specific surface area of the samples were calculated by the Brunauer Emmett Teller (BET) method within 0.05 to 0.2 of the relative pressure (P/P0).

2.9. Molecular Modeling

BIOVIA Materials Studio Morphology [45] was used to predict the crystal facets of TICA from Ⅱ. The TICA crystal face was first built using its CIF file. The molecular structure of acetonitrile was built using the sketching tool and geometry optimization was performed by the Forcit module using COMPASS II force field. Finally, the growth morphology of TICA crystal is given for major faces.

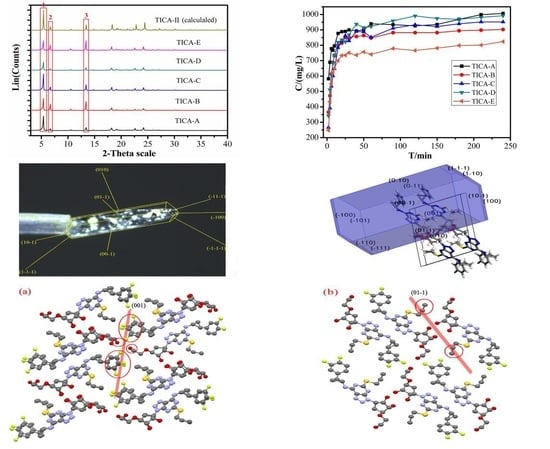
2.10. Face Indexation

The single crystal of TICA was placed onto the tip of a 0.1 mm diameter glass capillary and mounted on the Bruker APEX-II CCD diffractometer (Bruker, Germany) with CCD area detector for determining unit cell parameters and orientation matrices at −100 °C. The T-tool—the face-indexing plug-in of APEX Ⅲ—was used to identify Miller indices of different faces of this crystal [38].

3. Results

3.1. Single-Crystal X-Ray Diffraction

The crystal structure of ticagrelor was studied at −100 °C and the related crystallographic data are listed in Table 1. This compound crystallizes in the P1 space group, with the asymmetric unit consisting of four ticagrelor molecules, which is similar to that of TICA form I [13]. The conformations of each TICA molecule in the asymmetric unit differ slightly and the overlay diagrams comparing different conformers of these four molecules is shown in Figure 2. It is shown that the main orientation differences are cyclopropyl-3,4 difluorophenyl, thiopropyl and hydroxyethoxy side chains, and the conformation of central groups (cyclopentane-1,2-diol-triazolopyrimidine) are almost the same. The molecular conformations in the asymmetric unit differ slightly from that of TICA form I and DMSO solvate, mainly in orientation differences of cyclopropyl-3,4 difluorophenyl and thiopropyl. Displacement ellipsoid plots showing the atomic numbering are presented in Figure 3.
Obviously, the ticagrelor molecular structure contains many hydrogen-bond donors and acceptors, which justifies the existence of a wide variety of intramolecular and intermolecular hydrogen bonds. Dimeric R 2 2 ( 10 ) and R 2 2 ( 9 ) motifs between TICA molecules are generated through N-H…N and O-H…O intermolecular hydrogen bonds along the b-axis, forming infinite molecular chains (Figure 4), which are further stacked by hydrogen bonds between hydroxyethoxy side chains [46,47]. Thus, ring motifs between six TICA molecules are generated to form two-dimensional structures (Figure 5). TICA form I is also present in the dimeric form R 2 2 ( 10 ) and R 2 2 ( 9 ) motifs, which are formed through hydrogen bonds, but the donor and acceptor of H-bonds are different from TICA form II. H-bond data is listed in Table 2. The Hirshfeld surfaces of TICA-Ⅱis in Figure S2.

3.2. Predicted Morphology of the TICA Crystal

The predicted BFDH morphology of the TICA crystal was visualized (Figure 6b). The BFDH method is a rapid method to identify the crystal morphology (hkl) most likely to form crystal habit. According to the BFDH law, the relative growth rate is inversely proportional to the d-spacing between the crystal faces. Thus, the most important morphological faces of the crystal are those with the maximum d value [37,48,49]. For TICA form II, these planes are (001) (d = 16.3 Å), (010) (d = 14.5 Å) and (01–1) (d = 13.2Å), as determined by indexation the single-crystal faces. Therefore, the predicated shape of TICA is a needle-shape. This model is in reasonable agreement with the BFDH model, when compared with the observed morphology of the crystals (Figure 6a).

3.3. Powder X-Ray Diffraction

The PXRD patterns of these five crystal habits (Figure 7) all had characteristic diffraction peaks at 2θ values of 5.4°, 6.7°, 13.4°, 18.3°, 22.8° and 24.8° corresponding to TICA form Ⅱ reported in the literature [11], and these were also identical to those of the calculated PXRD pattern using the single-crystal diffraction results (listed at Section 3.1); however, some intensity differences were observed. The preferred orientation of the crystal results in a difference in the relative peak strength (Table 3). The most important peaks determining the growth direction of the crystal are 5.4° (d = 16.3 Å), 6.0° (d = 14.5 Å) and 6.7° (d = 13.2 Å), which correspond to the (001), (010) and (01-1) crystal faces, respectively. The diffraction peak that associated with the (010) crystal face is poorly resolved due to its low relative intensity. The intensity of the diffraction peaks corresponding to the (001), (01-1) and its relevant (02-2) crystal plane in the pattern of the above five samples were observed to vary greatly as compared with the intensities of the calculated pattern. This result suggests a varied frequency of the (001) and (01-1) planes in the five TICA crystal samples, meaning that they have different crystal habits. The DSC data is in the Figure S2.

3.4. Optical and Polarized Light Microscopy

Every crystal face has its own growth rate and it is the slowest growing face which determines the growth habits of crystals. The predicted BFDH morphology of TICA-Ⅱ (Figure 6b.) showed that (001), (010) and (01-1) are the main crystal planes. The crystal grows rapidly along the (010) direction, so there are few (010) crystal faces exposed. Therefore, face (001) and (01-1) become more dominant in the general shape of the crystal. From Figure 8, the crystal shapes of five samples are different, mainly in terms of their length and width. The aspect ratios of TICA-A, B, C, D, E are about 1:1~2:1, more than 10:1, mostly 5:1~8:1, mostly 1:1~3:1 and more than 10:1, respectively. When the nucleation rate is quicker than that of crystal growth, such as in the conditions of more saturation or rapid cooling (TICA-A and TICA-D), the growth rate of the (0-11) face is enhanced compared to that of face (001), resulting in a plate-like shape. However, when the crystal growth rate is quicker using the antisolvent method, enhanced growth in the (001) direction, as compared to the (0-11) face, produces needle-shaped crystals (TICA-B, C, E). Initial saturation in the crystallization process of sample TICA-C among the above three samples is highest, resulting in needle-shaped crystals with relatively good aspect ratios. The longest crystal growth time (sample TICA-E) leads to slender acicular crystals with an aspect ratio of more than 10:1 (Figure 8f).

3.5. XPS

XPS (Table 4) showed the existence of C, O, N, F, and S on the surface of every sample. Chemical shift and peak shape for these elements were similar between the five samples, which indicate that there are no qualitative differences in TICA samples with different crystal habits. Moreover, there was no significant difference in the relative abundance of surface elements (Table 4). The (O + N + S)/(C + F) stands for surface polarity, was 0.394, 0.372, 0.387, 0.392 and 0.375 for TICA-A, TICA-B, TICA-C, TICA-D, and TICA-E, respectively.

3.6. Solubility Study

The dissolution profiles of five samples in pH 1.2 hydrochloric acid solutions are shown in Figure 9a. The TICA-A dissolves faster than that of other four habits and the dissolution rates (in the first 30 min) are ordered as follows: TICA-A > TICA-D > TICA-B > TICA-C > TICA-E. The amounts dissolved of the above five crystal habits within 24 h are captured in Figure 9b, showing that the solubility of TICA-A and TICA-D samples whining 24 hours were higher than that of TICA-B and TICA-C samples, and the solubility of TICA-E samples was the lowest.

3.7. Specific Surface Area

Furthermore, specific surface areas of these five samples were compared (Table 5). Because of the small specific surface area of the drug particles themselves, there will be inevitable instrument errors in the measurement. According to the test results, there was no significant difference in the specific surface area between these five samples.

4. Discussion

The rate of crystal growth is mainly related to the rate at which units attach and remove themselves from the growing surfaces. Deposition kinetics of solute molecules on different crystal faces determine the crystal habit [22,50]. Investigations on the single-crystal structure of the TICA-II suggest that elongation is driven by the formation of hydrogen-bond networks in the crystal lattice. Thus, hydrogen bonding of TICA form II drives the crystal growth along one axis (axis b), which results in the formation of needle-shaped crystals. The (010) crystal plane demonstrates the fastest growth, and its relevant diffraction peak is almost not observable, as demonstrated in Section 3.3. Therefore, the crystal habits were mainly related to the growth rate of the (0-11) face and (001) face. Therefore, the growth rate can be changed by adjusting crystallization conditions such as solvent, temperature, degree of supersaturation, cooling rate, and stirring rate, etc. When growth rates of (001) and (0-11) were modified by controlling crystallization conditions, needle-shaped crystals with different aspect ratios and plate-like crystals of TICA form Ⅱ were prepared.
The five crystal habits of TICA-II exhibited different dissolution behavior, including equilibrium solubility and dissolution rate, despite the similar powder surface area. The second law of thermodynamics governs the dissolution process. Dissolution results in the destruction of the original forces between solute molecules, forming new interactions and increasing the overall disorder. At the molecular level, dissolution can be expressed by interactions between functional groups of drug particles and solvents. The surface anisotropy of the TICA crystal face due to differential surface exposure of functional groups was known, which lead to different performance in its bioavailability. Moreover, the relative abundance of the major faces of five samples, such as (001) and (01-1), differed significantly. The relative abundance of a hydrophilic face (001) on the surface of TICA-A was higher than TICA-E. This preferred orientation leads to a higher exposure of a relatively more hydrophilic (001) facet on the surface of TICA-A and leads to its higher solubility.
The (001) crystal face has a layer of difluorophenyl and hydroxyls exposed on its surface, which makes this face more hydrophilic (Figure 10a). As for the (01-1) crystal face, the exposure of propyl groups makes it relatively more hydrophobic (Figure 10b). Therefore, it can be predicted that when the (001) crystal facet is dominant, such as in TICA-A and TICA-D, the crystals will be more hydrophilic and have better solubility. In contrast, when the dominant crystal planes are (01-1) and its relevant (02-2), such as in TICA-E, it tends to dissolve more poorly. Solubility differences for five crystal habits with different aspect ratios are possible, relative to the two crystal faces (001) and (01-1) exposed. (Figure S3.)
The number of crystal faces exposed to solvent also determines the solubility of the drug [51]. The bigger the aspect ratio of the sample is, the worse the samples’ solubility is. That is why the solubility of TICA-A is better than that of TICA-E. The surface polarity also affects solubility. In theory, the larger the surface polarity, the better the solubility. The specific surface area of the five crystal habits are not significantly different from each other, so the specific surface area does not affect the solubility.

5. Conclusions

Several crystal habits with different aspect ratios of TICA form Ⅱ were prepared using different crystallization conditions. Although they have the same crystal structures, their dissolution rates are significantly different, which may be due to the difference in the surface anisotropy and abundance of exposed crystals. Modification of the surface morphology of the crystal without changing its polymorphism appears to provide a good method for enhancing the solubility of drugs, especially for BCS class Ⅳ drugs that have poor solubility.

Supplementary Materials

The following are available online at https://www.mdpi.com/2073-4352/9/11/556/s1, Figure S1: The DSC curve of TICA crystal habits. Table S1: Preparation method for TICA crystal habits. Figure S2: The Hirshfeld surfaces of TICA-Ⅱ. Figure S3: Different screenshots of (001) face and (01-1) face using Mercury 2.3 software.

Author Contributions

The main contribution to this study came from Y.R. J.S. helped in the calculation. K.Y. helped in the proofreading. C.U.P. and G.C. helped in guidance. J.L. helped in single-crystal structure. J.F. and X.H. designed and supervised this work.

Funding

This research received no external funding.

Acknowledgments

The authors would like to Zhejiang Aoxiang Pharmaceutical Co., Ltd. (China, Zhejiang) for providing us with ticagrelor, also thank Zhejiang University for providing experimental facilities.

Conflicts of Interest

The authors states that there is no conflict of interest.

References

  1. Marzio, H.D.; Navarro, V.J. Chapter 29–Hepatotoxicity of Cardiovascular and Antidiabetic Drugs. In Drug-Induced Liver Disease; Academic Press: Cambridge, MA, USA, 2013; pp. 519–540. [Google Scholar]
  2. Cave, B.; Rawal, A.; Ardeshna, D.; Ibebuogu, U.N.; Sai-Sudhakar, C.B.; Khouzam, R.N. Targeting ticagrelor: A novel therapy for emergency reversal. Ann. Transl. Med. 2019, 7, 115–119. [Google Scholar] [CrossRef]
  3. Kubisa, M.J.; Jezewski, M.P.; Gasecka, A.; Siller-Matula, J.M.; Postula, M. Ticagrelor—toward more efficient platelet inhibition and beyond. Ther. Clin. Risk Manag. 2018, 14, 129–140. [Google Scholar] [CrossRef] [PubMed]
  4. Van Giezen, J.J.J.; Berntsson, P.; Zachrisson, H.; Bjorkman, J.A. Comparison of ticagrelor and thienopyridine P2Y(12) binding characteristics and antithrombotic and bleeding effects in rat and dog models of thrombosis/hemostasis. Thromb. Res. 2009, 124, 565–571. [Google Scholar] [CrossRef] [PubMed]
  5. Husted, S.; Emanuelsson, H.; Heptinstall, S.; Sandset, P.M.; Wickens, M.; Peters, G. Pharmacodynamics, pharmacokinetics, and safety of the oral reversible P2Y(12) antagonist AZD6140 with aspirin in patients with atherosclerosis: A double-blind comparison to clopidogrel with aspirin. Eur. Heart J. 2006, 27, 1038–1047. [Google Scholar] [CrossRef] [PubMed]
  6. Cannon, C.P.; Husted, S.; Harrington, R.A.; Scirica, B.M.; Emanuelsson, H.; Storey, R.F.; Invest, D. Safety, tolerability, and initial efficacy of AZD6140, the first reversivle oral adenosine diphosphate receptor antagonist, compared with clopidigrel, in patients with non-ST-segment elevation acute coronary syndrome—Primary results of the DISPERSE-2 trial. J. Am. Coll. Cardiol. 2007, 50, 1844–1851. [Google Scholar] [CrossRef]
  7. Chalasani, N.; Fontana, R.J.; Bonkovsky, H.L.; Watkins, P.B.; Davern, T.; Serrano, J.; Yang, H.; Rochon, J.; Drug Induced Liver Injury Network. Causes, clinical features, and outcomes from a prospective study of drug-induced liver injury in the United States. Gastroenterology 2008, 135, 1924–1934. [Google Scholar] [CrossRef]
  8. Wallentin, L.; Becker, R.C.; Budaj, A.; Cannon, C.P.; Emanuelsson, H.; Held, C.; Horrow, J.; Husted, S.; James, S.; Katus, H.; et al. Ticagrelor versus Clopidogrel in Patients with Acute Coronary Syndromes. N. Engl. J. Med. 2009, 361, 1045–1057. [Google Scholar] [CrossRef]
  9. Mohammad, R.A.; Goldberg, T.; Dorsch, M.P.; Cheng, J.W.M. Antiplatelet therapy after placement of a drug-eluting stent: A review of efficacy and safety studies. Clin. Ther. 2010, 32, 2265–2281. [Google Scholar] [CrossRef]
  10. Reuben, A.; Koch, D.G.; Lee, W.M.; Acute Liver Failure Study Group. Drug-induced acute liver failure: Results of a U.S. multicenter, prospective study. Hepatology 2010, 52, 2065–2076. [Google Scholar] [CrossRef] [Green Version]
  11. Martin, B. New Cristalline and Amorphous form of a Triazolo(4,5-D) pyridinine Compound. U.S. Patent WO 01/92262 A1, 6 December 2001. [Google Scholar]
  12. Agarwal, V.K. Crystalline Form of Ticagrelor. U.S. Patent Application No. 16/066,425, 3 January 2017. [Google Scholar]
  13. Bojarska, J.; Remko, M.; Fruzinski, A.; Maniukiewicz, W. The experimental and theoretical landscape of a new antiplatelet drug ticagrelor: Insight into supramolecular architecture directed by C-H … F, π …π and C-H… π interactions. J. Mol. Struct. 2018, 1154, 290–300. [Google Scholar] [CrossRef]
  14. Williams, H.D.; Trevaskis, N.L.; Charman, S.A.; Shanker, R.M.; Charman, W.N.; Pouton, C.W.; Porter, C.J.H. Strategies to address low drug solubility in discovery and development. Pharmacol. Rev. 2013, 65, 315–499. [Google Scholar] [CrossRef] [PubMed]
  15. Gao, L.; Zhang, X.-R.; Yang, S.-P.; Liu, J.-J.; Chen, C.-J. Improved solubility of vortioxetine using C2-C4 straight-chain dicarboxylic acid salt hydrates. Crystals 2018, 8, 352. [Google Scholar] [CrossRef]
  16. Miletic, T.; Kyriakos, K.; Graovac, A.; Ibric, S. Spray-dried voriconazole-cyclodextrin complexes: Solubility, dissolution rate and chemical stability. Carbohydr. Polym. 2013, 98, 122–131. [Google Scholar] [CrossRef] [PubMed]
  17. Lu, Y.; Tang, N.; Lian, R.; Qi, J.; Wu, W. Understanding the relationship between wettability and dissolution of solid dispersion. Int. J. Pharm. 2014, 465, 25–31. [Google Scholar] [CrossRef] [PubMed]
  18. Rasenack, N.; Muller, B.W. Micron-size drug particles: Common and novel micronization techniques. Pharm. Dev. Technol. 2004, 9, 1–13. [Google Scholar] [CrossRef] [PubMed]
  19. Sun, C.; Grant, D.J.W. Influence of crystal shape on the tableting performance of L-lysine monohydrochloride dihydrate. J. Pharm. Sci. 2001, 90, 569–579. [Google Scholar] [CrossRef]
  20. Banga, S.; Chawla, G.; Varandani, D.; Mehta, B.R.; Bansal, A.K. Modification of the crystal habit of celecoxib for improved processability. J. Pharm. Pharmacol. 2007, 59, 29–39. [Google Scholar] [CrossRef]
  21. Singhal, D.; Curatolo, W. Drug polymorphism and dosage form design: A practical perspective. Adv. Drug Deliv. Rev. 2004, 56, 335–347. [Google Scholar] [CrossRef]
  22. Tiwary, A.K. Modification of crystal habit and its role in dosage form performance. Drug Dev. Ind. Pharm. 2001, 27, 699–709. [Google Scholar] [CrossRef]
  23. Mittal, A.; Malhotra, D.; Jain, P.; Kalia, A.; Shunmugaperumal, T. Studies on Aspirin Crystals Generated by a Modified Vapor Diffusion Method. Aaps Pharmscitech 2016, 17, 988–994. [Google Scholar] [CrossRef]
  24. Serrano, D.R.; O’Connell, P.; Paluch, K.J.; Walsh, D.; Healy, A.M. Cocrystal habit engineering to improve drug dissolution and alter derived powder properties. J. Pharm. Pharmacol. 2016, 68, 665–677. [Google Scholar] [CrossRef] [PubMed]
  25. Mishnev, A.; Stepanovs, D. Crystal structure explains crystal habit for the antiviral drug rimantadine hydrochloride. Z. Fur Nat. Sect. B A J. Chem. Sci. 2014, 69, 823–828. [Google Scholar] [CrossRef]
  26. Maghsoodi, M. Role of solvents in improvement of dissolution rate of drugs: Crystal habit and crystal agglomeration. Adv. Pharm. Bull. 2015, 5, 13–18. [Google Scholar] [CrossRef]
  27. Modi, S.R.; Dantuluri, A.K.R.; Puri, V.; Pawar, Y.B.; Nandekar, P.; Sangamwar, A.T.; Perumalla, S.R.; Sun, C.C.; Bansal, A.K. Impact of crystal habit on biopharmaceutical performance of celecoxib. Cryst. Growth Des. 2013, 13, 2824–2832. [Google Scholar] [CrossRef]
  28. Di Martino, P.; Censi, R.; Malaj, L.; Capsoni, D.; Massarotti, V.; Martelli, S. Influence of solvent and crystallization method on the crystal habit of metronidazole. Cryst. Res. Technol. 2007, 42, 800–806. [Google Scholar] [CrossRef]
  29. Nokhodchi, A.; Bolourtchian, N.; Farid, D. Effects of hydrophilic excipients and compression pressure on physical properties and release behavior of aspirin-tableted microcapsules. Drug Dev. Ind. Pharm. 1999, 25, 711–716. [Google Scholar] [CrossRef]
  30. Ishikawa, K.; Eanes, E.D.; Tung, M.S. The effect of supersaturation on apatite crystal formation in aqueous solutions at physiologic pH and temperature. J. Dent. Res. 1994, 73, 1462–1469. [Google Scholar] [CrossRef]
  31. Nokhodchi, A.; Bolourtchian, N.; Dinarvand, R. Crystal modification of phenytoin using different solvents and crystallization conditions. Int. J. Pharm. 2003, 250, 85–97. [Google Scholar] [CrossRef]
  32. Shariare, M.H.; Blagden, N.; de Matas, M.; Leusen, F.J.J.; York, P. Influence of solvent on the morphology and subsequent comminution of ibuprofen crystals by air jet milling. J. Pharm. Sci. 2012, 101, 1108–1119. [Google Scholar] [CrossRef]
  33. Stoica, C.; Verwer, P.; Meekes, H.; van Hoof, P.; Kaspersen, F.M.; Vlieg, E. Understanding the effect of a solvent on the crystal habit. Cryst. Growth Des. 2004, 4, 765–768. [Google Scholar] [CrossRef]
  34. Umprayn, K.; Luengtummuen, A.; Kitiyadisai, C.; Pornpiputsakul, T. Modification of crystal habit of ibuprofen using the phase partition technique: Effect of Aerosil and Tween80 in binding solvent. Drug Dev. Ind. Pharm. 2001, 27, 1047–1056. [Google Scholar] [CrossRef] [PubMed]
  35. Walker, E.M.; Roberts, K.J.; Maginn, S.J. A molecular dynamics study of solvent and impurity interaction on the crystal habit surfaces of epsilon-caprolactam. Langmuir 1998, 14, 5620–5630. [Google Scholar] [CrossRef]
  36. Prywer, J. Explanation of some peculiarities of crystal morphology deduced from the BFDH law. J. Cryst. Growth 2004, 270, 699–710. [Google Scholar] [CrossRef]
  37. Wang, Z.; Jiang, P.; Dang, L. The Morphology Prediction of Lysozyme Crystals Deduced from the BFDH Law and Attachment Energy Model Based on the Intermolecular Interaction. In Proceedings of the 2010 4th International Conference on Bioinformatics and Biomedical Engineering, Chengdu, China, 18–20 June 2010. [Google Scholar]
  38. Bruker AXS announces novel APEX(TM) DUO, the most versatile system for small molecule X-ray crystallography. Anti-Corros. Methods Mater. 2007, 54, 375.
  39. Sheldrick, G.M. SADABS; Version 2.10.; University of Gottingen: Gottingen, Germany, 2003. [Google Scholar]
  40. Sheldrick, G.M. SHELXT—Integrated space-group and crystal-structure determination. Acta Crystallogr. A Found. Adv. 2015, 71, 3–8. [Google Scholar] [CrossRef]
  41. Sheldrick, G.M. A short history of SHELX. Acta Crystallogr. A Found. Adv. 2008, 64, 112–122. [Google Scholar] [CrossRef]
  42. Dolomanov, O.V.; Bourhis, L.J.; Gildea, R.J.; Howard, J.A.K.; Puschmann, H. OLEX2: A complete structure solution, refinement and analysis program. J. Appl. Crystallogr. 2009, 42, 339–341. [Google Scholar] [CrossRef]
  43. Macrae, C.F.; Bruno, I.J.; Chisholm, J.A.; Edgington, P.R.; Mccabe, P.; Pidcock, E.; Rodriguezmonge, L.; Taylor, R.; van de Streek, D.; Wood, P.A. Mercury CSD 2.0—new features for the visualization and investigation of crystal structures. J. Appl. Crystallogr. 2010, 41, 466–470. [Google Scholar] [CrossRef]
  44. Farrugia, L.J. WinGX and ORTEP for Windows: An update. J. Appl. Crystallogr. 2012, 45, 849–854. [Google Scholar] [CrossRef]
  45. Li, W.D.; Zhang, M.; Li, Y.; Liu, G.X.; Li, Z.J. Effect of heat preservation time on the micro morphology and field emission properties of La-doped SiC nanowires. Crystengcomm 2019, 21, 3993–4000. [Google Scholar] [CrossRef]
  46. Abourahma, H.; Cocuzza, D.S.; Melendez, J.; Urban, J.M. Pyrazinamide cocrystals and the search for polymorphs. Crystengcomm 2011, 13, 6442–6450. [Google Scholar] [CrossRef]
  47. Etter, M.C. ChemInform abstract: Encoding and decoding hydrogen-bond patterns of organic compounds. Acc. Chem. Res. 1990, 23, 120–126. [Google Scholar] [CrossRef]
  48. Laville, G. Elementary study on refraction in a prisma which is out of the main section. Bravais law. J. De Phys. Et Le Radium 1921, 2, 62–64. [Google Scholar] [CrossRef]
  49. Donnay, J.D.H.; Harker, D. A new law of crystal morphology extending the law of bravais. Am. Mineral. 1937, 22, 446–467. [Google Scholar]
  50. Hadjittofis, E.; Isbell, M.A.; Karde, V.; Varghese, S.; Ghoroi, C.; Heng, J.Y.Y. Influences of Crystal Anisotropy in Pharmaceutical Process Development. Pharm. Res. 2018, 35, 100. [Google Scholar] [CrossRef]
  51. Bukovec, P.; Benkic, P.; Smrkolj, M.; Vrecer, F. Effect of crystal habit on the dissolution behaviour of simvastatin crystals and its relationship to crystallization solvent properties. Pharmazie 2016, 71, 263–268. [Google Scholar] [CrossRef]
Figure 1. The chemical diagram of TICA.
Crystals 09 00556 g001
Figure 2. Overlay diagram for superposition of independent molecules of TICA-II crystals.
Crystals 09 00556 g002
Figure 3. The molecule structure of TICA-II, showing displacement ellipsoids at the 50% probability level.
Crystals 09 00556 g003
Figure 4. Propagation of (1) mediated by hydrogen bonds aligned along the b-axis presenting fused R 1 1 ( 7 ) , R 2 2 ( 9 ) and R 2 2 ( 10 ) rings.
Crystals 09 00556 g004
Figure 5. Two-dimensional hydrogen-bond networks formed by hydrogen-bond ring motifs.
Crystals 09 00556 g005
Figure 6. (a) Face indexation for TICA form Ⅱ and (b) Morphology predictions for TICA form Ⅱ by means of BFDH calculations.
Crystals 09 00556 g006
Figure 7. Overlay of XRD of TICA crystal habits and calculated XRD pattern of TICA form Ⅱ.
Crystals 09 00556 g007
Figure 8. (ae) Microscope graphs of TICA crystals and (f) Schematic diagram of the crystal growth of TICA crystal habits.
Crystals 09 00556 g008
Figure 9. (a) Solution concentration–time profiles of TICA crystal habits in pH 1.2 hydrochloric acid solutions and (b) Amounts dissolved of TICA crystal habits in pH 1.2 hydrochloric acid solutions within 24 h.
Crystals 09 00556 g009
Figure 10. (a) Packing along (001) face and (b) (01-1) face, showing the surface chemistry.
Crystals 09 00556 g010
Table 1. Relevant crystallographic data details for TICA-Ⅱ.
TICA-Ⅱ
FormulaC23H28F2N6O4S
Mr522.57
Temperature/K170(2)
Crystal systemtriclinic
Space groupP1
a/Å9.8863(5)
b/Å15.7349(7)
c/Å17.6069(9)
α/°105.538(2)
β/°100.841(2)
γ/°103.091(2)
Volume/Å32478.3(2)
Z4
D/g·cm−31.401
μ/mm−10.188
F(000)1096.0
Crystal size/mm30.248 × 0.18 × 0.067
RadiationMoKα (λ = 0.71073)
2θ range for data collection/°4.434 to 53.486
Index ranges−12 ≤ h ≤ 12,
−19 ≤ k ≤ 19,
−22 ≤ l ≤ 22
Reflections collected70727
Independent reflections20802 [Rint = 0.0541, Rsigma = 0.0563]
Data/restraints/parameters20802/6/1319
Goodness-of-fit on F21.068
Final R indexes [I > = 2σ (I)]R1 = 0.0756, wR2 = 0.1948
Final R indexes [all data]R1 = 0.0886, wR2 = 0.2089
Largest diff. peak/hole / e Å−31.58/−0.33
Flack parameter0.06(3)
DiffractometerBruker APEX-II CCD
Absorption correction
CCDC No.
multi-scan
1953772
Table 2. Hydrogen-bond of TICA-II (Å, °).
D-H…AD-HH…AD…AD-H…A
O2-H2…O1B0.841.892.724(5)171.8
O4-H4…O4B0.841.922.734(6)162.1
N1-H1A…N4B0.882.193.057(6)169.9
O2A-H2AA…O1C0.841.902.734(5)170.0
O4A-H4A…O40.842.012.849(6)174.8
N1A-H1AB…N4C0.882.183.045(6)167.4
O1B-H1BA…N3B0.841.862.661(5)158.6
O2B-H2B…O10.842.052.854(5)160.2
O4B-H4B…O3B0.842.522.856(6)105.4
O4B-H4B…O4C0.841.962.743(7)155.5
N1B-H1BB…N40.882.163.019(6)166.3
O1C-H1C…N3C0.841.872.665(6)157.7
O2C-H2C…O1A0.842.042.861(5)164.5
N1C-H1CA…N4A0.882.163.025(6)165.7
O1-H1…O2C0.84(3)2.33(8)3.082(5)150(13)
O1A-H1AA…O2B0.84(3)2.24(5)3.065(5)165(14)
O4C-H4C…O3C0.86(3)2.34(11)2.764(7)111(9)
Table 3. The PXRD of TICA crystal habits and calculated from single-crystal diffraction results.
Number2θ (°)Crystal FaceTICA-ATICA-BTICA-CTICA-DTICA-ETICA-Ⅱ
Relative Intensity (I/I0)/%
15.400110010010010097.1100
26.701-112.353.520.920.949.919.0
313.402-221.276.035.333.110027.0
Table 4. The XPS data of TICA crystal habits.
Elemental Composition (%)(O + N + S)/(C + F)
O 1sN 1sS 2pF 1sC 1s
TICA-A12.1913.742.326.4865.270.394
TICA-B12.3812.632.145.5267.330.372
TICA-C11.0414.482.276.6565.560.387
TICA-D11.4614.362.326.4065.460.392
TICA-E11.2313.852.215.8766.850.375
Table 5. Specific Surface Area of TICA crystal Habits.
Sample NameSpecific Surface Area (m2/g)
TICA-A1.56
TICA-B1.60
TICA-C1.53
TICA-D1.51
TICA-E1.67

