Phase Behaviors of Ionic Liquids Heating from Different Crystal Polymorphs toward the Same Smectic-A Ionic Liquid Crystal by Molecular Dynamics Simulation


Abstract
1. Introduction
2. Methods
2.1. Simulation Setup
2.2. Preparation of Initial Configurations
2.3. Order Parameters
3. Results
4. Discussion
5. Conclusions
Author Contributions
Funding
Acknowledgments
Conflicts of Interest
References
- Binnemans, K. Ionic Liquid Crystals. Chem. Rev. 2005, 105, 4148–4204. [Google Scholar] [CrossRef] [PubMed]
- Goossens, K.; Lava, K.; Bielawski, C.W.; Binnemans, K. Ionic Liquid Crystals: Versatile Materials. Chem. Rev. 2016, 116, 4643–4807. [Google Scholar] [CrossRef] [PubMed]
- Nelyubina, Y.V.; Shaplov, A.S.; Lozinskaya, E.I.; Buzin, M.I.; Vygodskii, Y.S. A New Volume-Based Approach for Predicting Thermophysical Behavior of Ionic Liquids and Ionic Liquid Crystals. J. Am. Chem. Soc. 2016, 138, 10076–10079. [Google Scholar] [CrossRef] [PubMed]
- Gordon, C.M.; Holbrey, J.D.; Kennedy, A.R.; Seddon, K.R. Ionic liquid crystals: Hexafluorophosphate salts. J. Mater. Chem. 1998, 8, 2627–2636. [Google Scholar] [CrossRef]
- Holbrey, J.D.; Seddon, K.R. The phase behaviour of 1-alkyl-3-methylimidazolium tetrafluoroborates; ionic liquids and ionic liquid crystals. J. Chem. Soc. Dalton Trans. 1999, 2133–2140. [Google Scholar] [CrossRef]
- Hardacre, C.; Holbrey, J.D.; McCormac, P.B.; McMath, S.E.J.; Nieuwenhuyzen, M.; Seddon, K.R. Crystal and liquid crystalline polymorphism in 1-alkyl-3-methylimidazolium tetrachloropalladate(ii) salts. J. Mater. Chem. 2001, 11, 346–350. [Google Scholar] [CrossRef]
- Bradley, A.E.; Hardacre, C.; Holbrey, J.D.; Johnston, S.; McMath, S.E.J.; Nieuwenhuyzen, M. Small-Angle X-ray Scattering Studies of Liquid Crystalline 1-Alkyl-3-methylimidazolium Salts. Chem. Mater. 2002, 14, 629–635. [Google Scholar] [CrossRef]
- Masafumi, Y.; Tomohiro, M.; Kiyoshi, K.; Masahiro, Y.; Hiroyuki, O.; Takashi, K. Liquid-Crystalline Assemblies Containing Ionic Liquids: An Approach to Anisotropic Ionic Materials. Chem. Lett. 2002, 31, 320–321. [Google Scholar] [CrossRef]
- De Roche, J.; Gordon, C.M.; Imrie, C.T.; Ingram, M.D.; Kennedy, A.R.; Lo Celso, F.; Triolo, A. Application of complementary experimental techniques to characterization of the phase behavior of [C16mim][PF6] and [C14mim][PF6]. Chem. Mater. 2003, 15, 3089–3097. [Google Scholar] [CrossRef]
- Guillet, E.; Imbert, D.; Scopelliti, R.; Bünzli, J.-C.G. Tuning the Emission Color of Europium-Containing Ionic Liquid-Crystalline Phases. Chem. Mater. 2004, 16, 4063–4070. [Google Scholar] [CrossRef]
- Li, L.; Groenewold, J.; Picken, S.J. Transient Phase-Induced Nucleation in Ionic Liquid Crystals and Size-Frustrated Thickening. Chem. Mater. 2005, 17, 250–257. [Google Scholar] [CrossRef]
- Nozaki, Y.; Yamaguchi, K.; Tomida, K.; Taniguchi, N.; Hara, H.; Takikawa, Y.; Sadakane, K.; Nakamura, K.; Konishi, T.; Fukao, K. Phase Transition and Dynamics in Imidazolium-Based Ionic Liquid Crystals through a Metastable Highly Ordered Smectic Phase. J. Phys. Chem. B 2016, 120, 5291–5300. [Google Scholar] [CrossRef] [PubMed]
- Saielli, G. MD simulation of the mesomorphic behaviour of 1-hexadecyl-3-methylimidazolium nitrate: Assessment of the performance of a coarse-grained force field. Soft Matter 2012, 8, 10279–10287. [Google Scholar] [CrossRef]
- Cao, W.; Wang, Y.; Saielli, G. Metastable State during Melting and Solid–Solid Phase Transition of [CnMim][NO3] (n = 4–12) Ionic Liquids by Molecular Dynamics Simulation. J. Phys. Chem. B 2018, 122, 229–239. [Google Scholar] [CrossRef] [PubMed]
- Quevillon, M.J.; Whitmer, J.K. Charge Transport and Phase Behavior of Imidazolium-Based Ionic Liquid Crystals from Fully Atomistic Simulations. Materials 2018, 11. [Google Scholar] [CrossRef]
- Peng, H.; Kubo, M.; Shiba, H. Molecular dynamics study of mesophase transitions upon annealing of imidazolium-based ionic liquids with long-alkyl chains. Phys. Chem. Chem. Phys. 2018, 20, 9796–9805. [Google Scholar] [CrossRef]
- Saielli, G.; Bagno, A.; Wang, Y. Insights on the Isotropic-to-Smectic A Transition in Ionic Liquid Crystals from Coarse-Grained Molecular Dynamics Simulations: The Role of Microphase Segregation. J. Phys. Chem. B 2015, 119, 3829–3836. [Google Scholar] [CrossRef] [PubMed]
- Jayaraman, S.; Maginn, E.J. Computing the melting point and thermodynamic stability of the orthorhombic and monoclinic crystalline polymorphs of the ionic liquid 1-n-butyl-3-methylimidazolium chloride. J. Chem. Phys. 2007, 127, 214504. [Google Scholar] [CrossRef] [PubMed]
- Reichert, W.M.; Holbrey, J.D.; Swatloski, R.P.; Gutowski, K.E.; Visser, A.E.; Nieuwenhuyzen, M.; Seddon, K.R.; Rogers, R.D. Solid-State Analysis of Low-Melting 1,3-Dialkylimidazolium Hexafluorophosphate Salts (Ionic Liquids) by Combined X-ray Crystallographic and Computational Analyses. Cryst. Growth Des. 2007, 7, 1106–1114. [Google Scholar] [CrossRef]
- Saielli, G.; Voth, G.A.; Wang, Y. Diffusion mechanisms in smectic ionic liquid crystals: Insights from coarse-grained MD simulations. Soft Matter 2013, 9, 5716–5725. [Google Scholar] [CrossRef]
- Saielli, G.; Wang, Y. Role of the Electrostatic Interactions in the Stabilization of Ionic Liquid Crystals: Insights from Coarse-Grained MD Simulations of an Imidazolium Model. J. Phys. Chem. B 2016, 120, 9152–9160. [Google Scholar] [CrossRef] [PubMed]
- Saielli, G. Fully Atomistic Simulations of the Ionic Liquid Crystal [C16mim][NO3]: Orientational Order Parameters and Voids Distribution. J. Phys. Chem. B 2016, 120, 2569–2577. [Google Scholar] [CrossRef] [PubMed]
- Ji, Y.; Shi, R.; Wang, Y.; Saielli, G. Effect of the Chain Length on the Structure of Ionic Liquids: From Spatial Heterogeneity to Ionic Liquid Crystals. J. Phys. Chem. B 2013, 117, 1104–1109. [Google Scholar] [CrossRef] [PubMed]
- Bruce, A.D.; Wilding, N.B.; Ackland, G.J. Free Energy of Crystalline Solids: A Lattice-Switch Monte Carlo Method. Phys. Rev. Lett. 1997, 79, 3002–3005. [Google Scholar] [CrossRef]
- Bruce, A.D.; Jackson, A.N.; Ackland, G.J.; Wilding, N.B. Lattice-switch Monte Carlo method. Phys. Rev. E 2000, 61, 906–919. [Google Scholar] [CrossRef]
- Wilding, N.B.; Bruce, A.D. Freezing by Monte Carlo Phase Switch. Phys. Rev. Lett. 2000, 85, 5138–5141. [Google Scholar] [CrossRef]
- Jackson, A.N.; Bruce, A.D.; Ackland, G.J. Lattice-switch Monte Carlo method: Application to soft potentials. Phys. Rev. E 2002, 65, 036710. [Google Scholar] [CrossRef]
- Downard, A.; Earle, M.J.; Hardacre, C.; McMath, S.E.J.; Nieuwenhuyzen, M.; Teat, S.J. Structural Studies of Crystalline 1-Alkyl-3-Methylimidazolium Chloride Salts. Chem. Mater. 2004, 16, 43–48. [Google Scholar] [CrossRef]
- Greaves, T.L.; Kennedy, D.F.; Mudie, S.T.; Drummond, C.J. Diversity Observed in the Nanostructure of Protic Ionic Liquids. J. Phys. Chem. B 2010, 114, 10022–10031. [Google Scholar] [CrossRef]
- Richard, P.M.; Claire, A.; Tom, W.; Patricia, A.H. The impact of anion electronic structure: Similarities and differences in imidazolium based ionic liquids. J. Phys. Condens. Matter 2014, 26, 284112. [Google Scholar] [CrossRef]
- Wang, Y.; Voth, G.A. Unique Spatial Heterogeneity in Ionic Liquids. J. Am. Chem. Soc. 2005, 127, 12192–12193. [Google Scholar] [CrossRef] [PubMed]
- Wang, Y.; Voth, G.A. Tail Aggregation and Domain Diffusion in Ionic Liquids. J. Phys. Chem. B 2006, 110, 18601–18608. [Google Scholar] [CrossRef] [PubMed]
- Canongia Lopes, J.N.A.; Pádua, A.A.H. Nanostructural Organization in Ionic Liquids. J. Phys. Chem. B 2006, 110, 3330–3335. [Google Scholar] [CrossRef] [PubMed]
- Cornell, W.D.; Cieplak, P.; Bayly, C.I.; Gould, I.R.; Merz, K.M.; Ferguson, D.M.; Spellmeyer, D.C.; Fox, T.; Caldwell, J.W.; Kollman, P.A. A Second Generation Force Field for the Simulation of Proteins, Nucleic Acids, and Organic Molecules. J. Am. Chem. Soc. 1995, 117, 5179–5197. [Google Scholar] [CrossRef]
- Frisch, M.J.; Trucks, G.W.; Schlegel, H.B.; Scuseria, G.E.; Robb, M.A.; Cheeseman, J.R.; Scalmani, G.; Barone, V.; Mennucci, B.; Petersson, G.A.; Revision, E.; et al. Gaussian 09; Revision E.01; Gaussian, Inc.: Wallingford, CT, USA, 2013. [Google Scholar]
- Singh, U.C.; Kollman, P.A. An approach to computing electrostatic charges for molecules. J. Comput. Chem. 1984, 5, 129–145. [Google Scholar] [CrossRef]
- Besler, B.H.; Merz, K.M.; Kollman, P.A. Atomic charges derived from semiempirical methods. J. Comput. Chem. 1990, 11, 431–439. [Google Scholar] [CrossRef]
- Bayly, C.I.; Cieplak, P.; Cornell, W.; Kollman, P.A. A well-behaved electrostatic potential based method using charge restraints for deriving atomic charges: The RESP model. J. Phys. Chem. 1993, 97, 10269–10280. [Google Scholar] [CrossRef]
- Abraham, M.J.; Murtola, T.; Schulz, R.; Páll, S.; Smith, J.C.; Hess, B.; Lindahl, E. GROMACS: High performance molecular simulations through multi-level parallelism from laptops to supercomputers. SoftwareX 2015, 1–2, 19–25. [Google Scholar] [CrossRef]
- Parrinello, M.; Rahman, A. Polymorphic transitions in single crystals: A new molecular dynamics method. J. Appl. Phys. 1981, 52, 7182–7190. [Google Scholar] [CrossRef]
- Nosé, S. A molecular dynamics method for simulations in the canonical ensemble. Mol. Phys. 1984, 52, 255–268. [Google Scholar] [CrossRef]
- Darden, T.; York, D.; Pedersen, L. Particle mesh Ewald: An N⋅log(N) method for Ewald sums in large systems. J. Chem. Phys. 1993, 98, 10089–10092. [Google Scholar] [CrossRef]
- Humphrey, W.; Dalke, A.; Schulten, K. VMD: Visual molecular dynamics. J. Mol. Graph. 1996, 14, 33–38. [Google Scholar] [CrossRef]
- Bates, M.A.; Luckhurst, G.R. Computer simulation studies of anisotropic systems. XXX. The phase behavior and structure of a Gay-Berne mesogen. J. Chem. Phys. 1999, 110, 7087–7108. [Google Scholar] [CrossRef]
- Feng, H.; Zhou, J.; Qian, Y. Atomistic simulations of the solid-liquid transition of 1-ethyl-3-methyl imidazolium bromide ionic liquid. J. Chem. Phys. 2011, 135, 144501. [Google Scholar] [CrossRef]
- Zhang, Y.; Maginn, E.J. A comparison of methods for melting point calculation using molecular dynamics simulations. J. Chem. Phys. 2012, 136, 144116. [Google Scholar] [CrossRef] [PubMed]
- Zhang, Y.; Maginn, E.J. Molecular dynamics study of the effect of alkyl chain length on melting points of [CnMIM][PF6] ionic liquids. Phys. Chem. Chem. Phys. 2014, 16, 13489–13499. [Google Scholar] [CrossRef] [PubMed]
- Ostwald, W. Studien über die Bildung und Umwandlung fester Körper. Z. Phys. Chem. 1897, 22U, 289. [Google Scholar] [CrossRef]


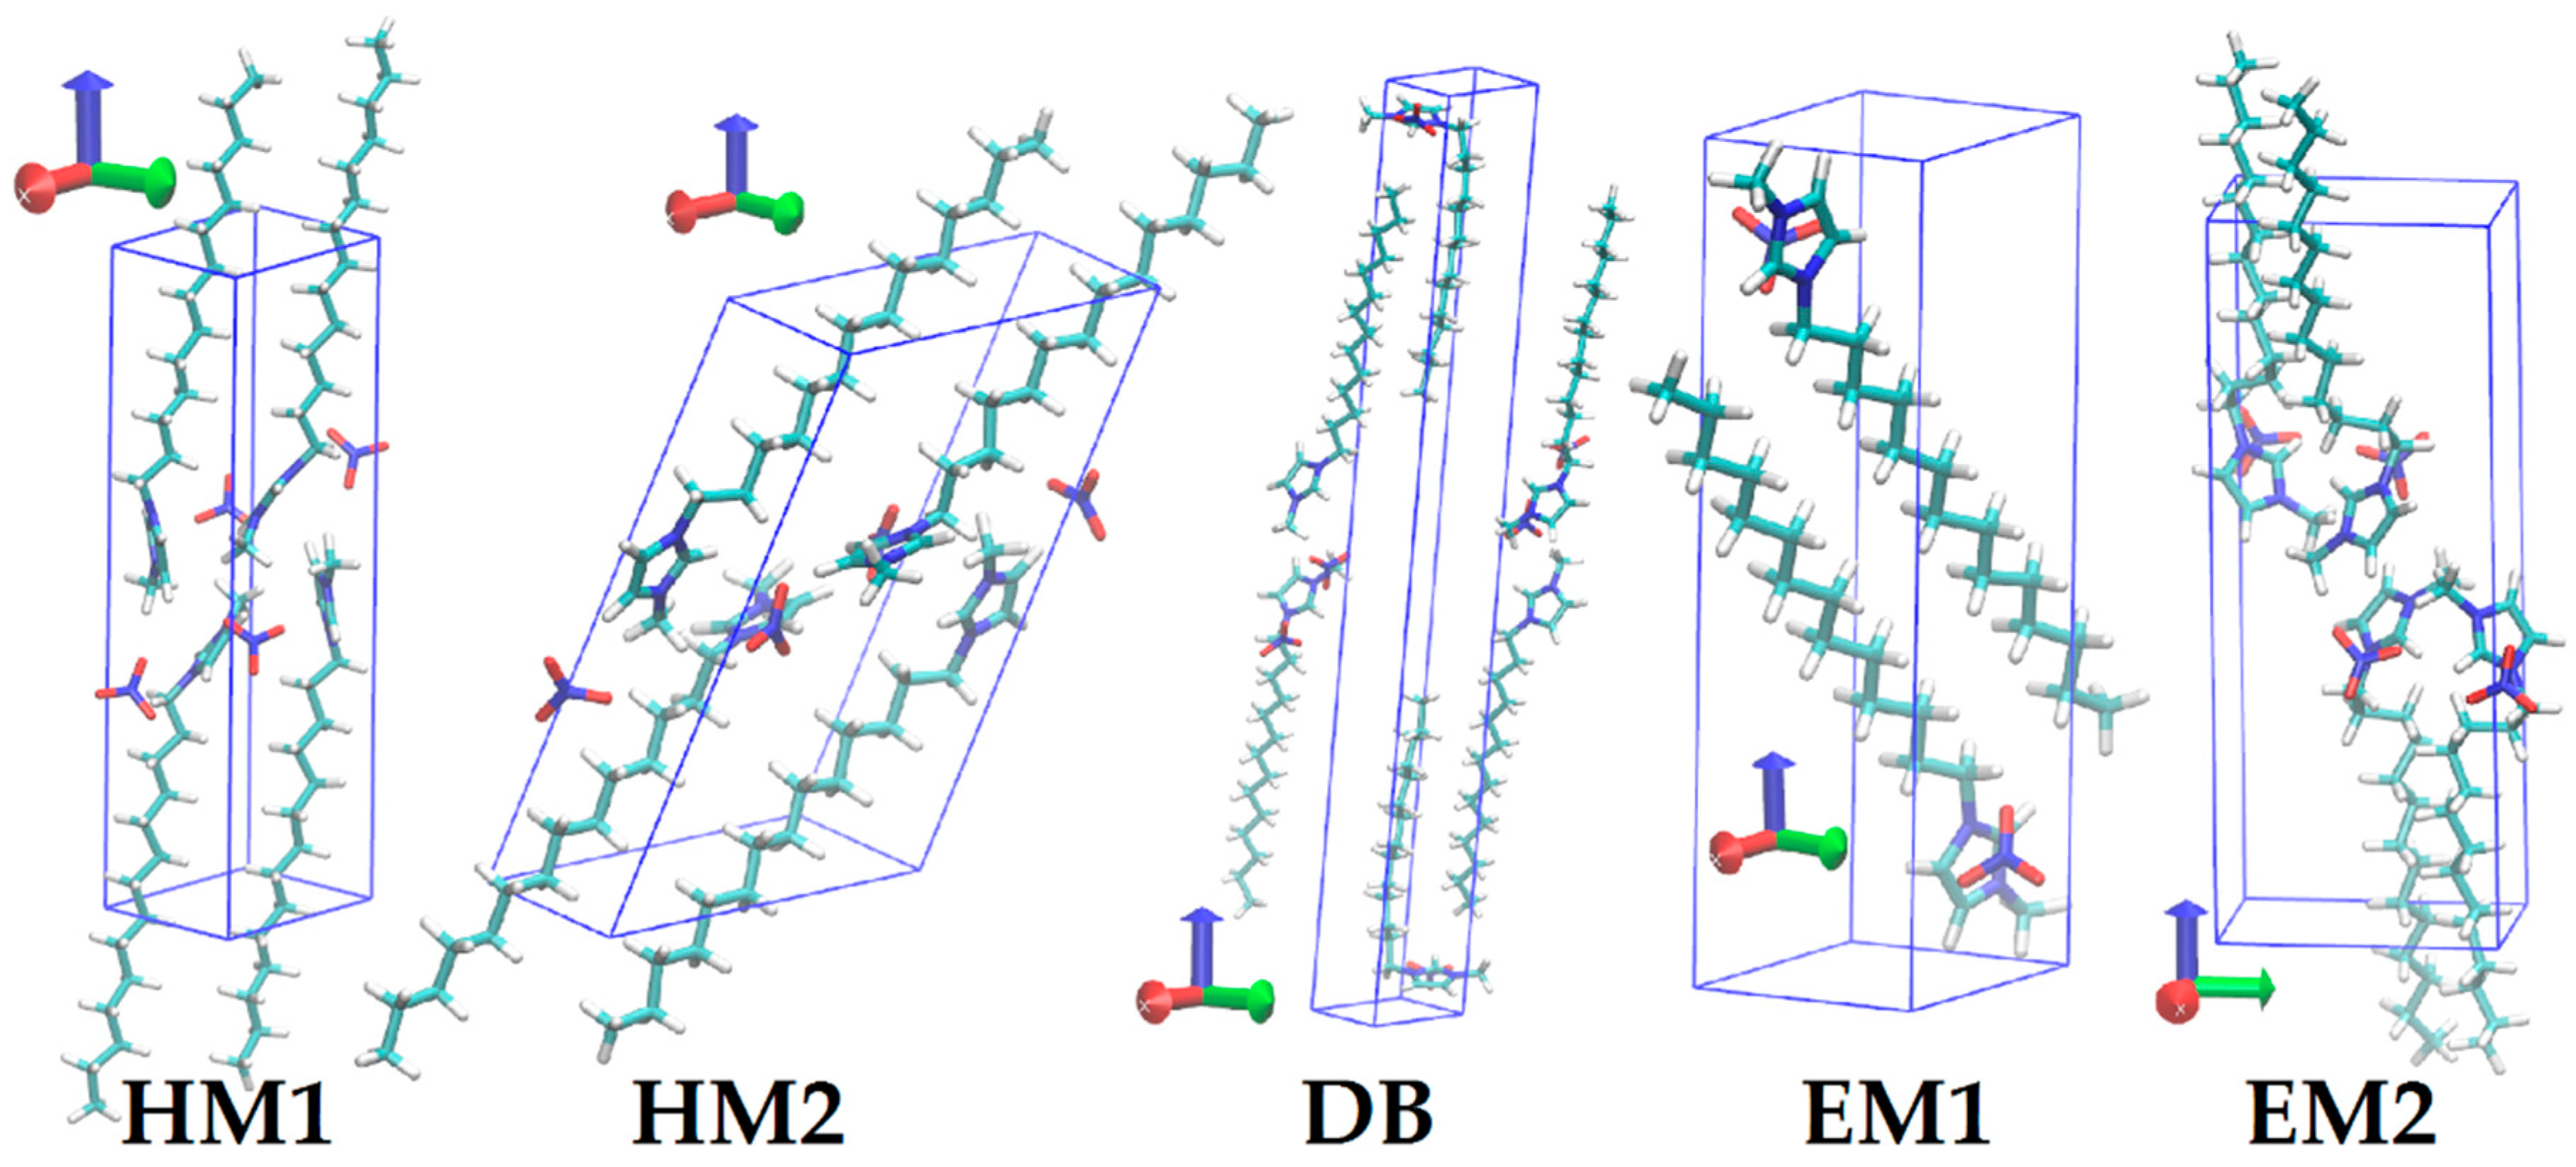
| Crystal Data | HM1 | HM2 | DB | EM1 | EM2 |
|---|---|---|---|---|---|
| a (Å) | 9.27 | 13.22 | 7.79 | 6.50 | 7.75 |
| b (Å) | 8.00 | 8.19 | 8.16 | 6.65 | 9.80 |
| c (Å) | 27.21 | 20.15 | 52.01 | 22.74 | 25.81 |
| α (°) | 84.3 | 78.1 | 84.5 | 91.2 | 90.0 |
| β (°) | 86.1 | 103.5 | 89.3 | 96.1 | 86.7 |
| γ (°) | 74.3 | 73.9 | 63.2 | 100.0 | 90.1 |
| Z | 4 | 4 | 6 | 2 | 4 |
| Crystal system | Triclinic | Triclinic | Triclinic | Triclinic | Monoclinic |
| Space group | |||||
| ρ (g/cm3) | 1.174 | 1.164 | 1.157 | 1.177 | 1.158 |
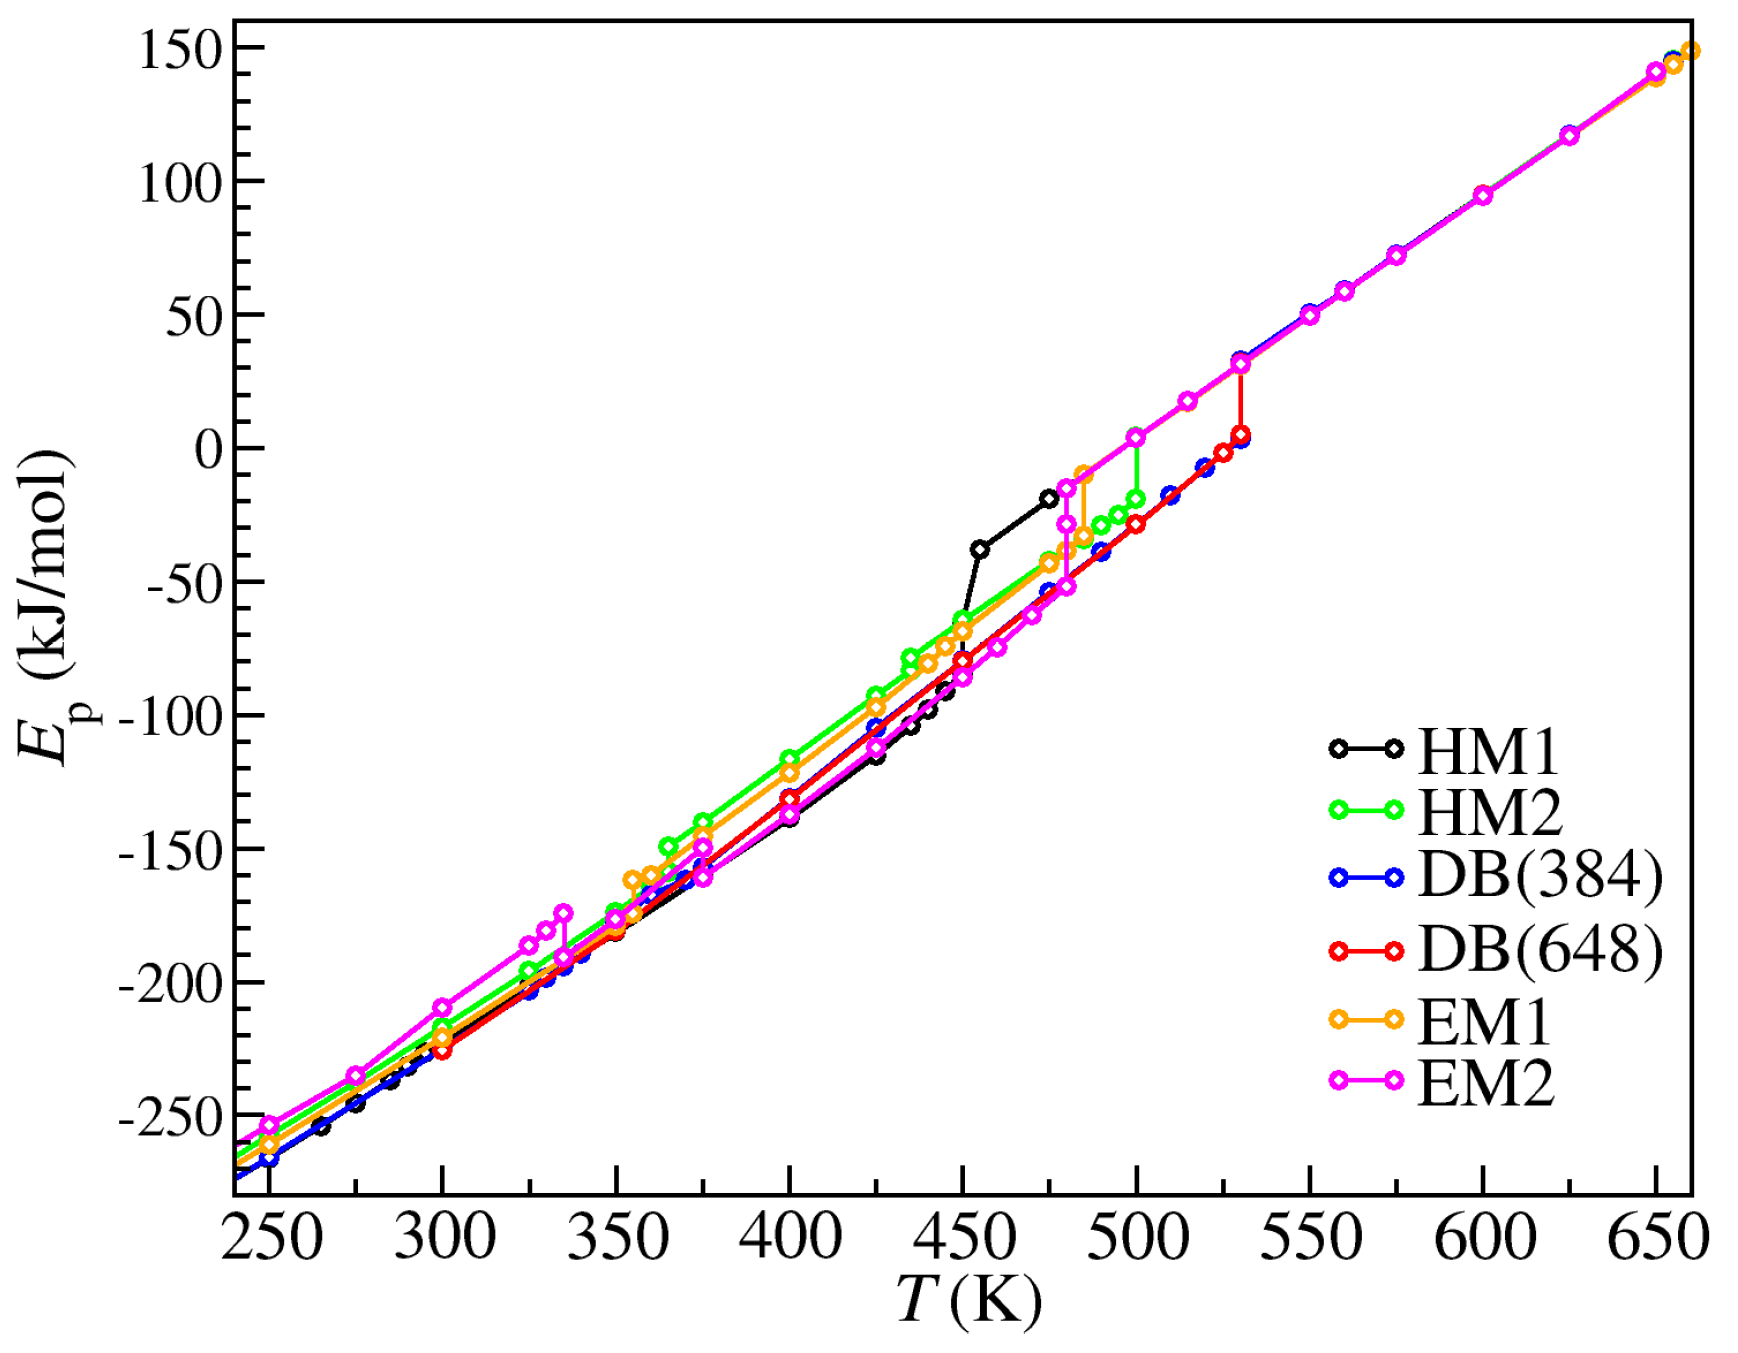
| Initial Crystal Polymorph | Phase Transition | T (K) | |
|---|---|---|---|
| HM1 | Solid-metastable | 450 | 18.92 |
| Metastable-LC | 455 | 22.45 | |
| LC-liquid | 650 | 1.98 | |
| HM2 | Solid-solid | 365 | 9.52 |
| Solid-solid | 435 | 4.71 | |
| Solid-LC | 500 | 23.04 | |
| LC-liquid | 655 | 1.58 | |
| DB | Solid-LC | 530 | 29.52 |
| LC-liquid | 655 | 1.58 | |
| EM1 | Solid-solid | 355 | 12.31 |
| Solid-LC | 485 | 22.85 | |
| LC-liquid | 660 | 0.34 | |
| EM2 | Solid-solid | 335 | −16.29 |
| Solid-solid | 375 | −11.27 | |
| Solid-metastable | 480 | 23.21 | |
| Metastable-LC | 480 | 13.55 | |
| LC-liquid | 650 | 2.07 |
© 2019 by the authors. Licensee MDPI, Basel, Switzerland. This article is an open access article distributed under the terms and conditions of the Creative Commons Attribution (CC BY) license (http://creativecommons.org/licenses/by/4.0/).
Share and Cite
Cao, W.; Wang, Y. Phase Behaviors of Ionic Liquids Heating from Different Crystal Polymorphs toward the Same Smectic-A Ionic Liquid Crystal by Molecular Dynamics Simulation. Crystals 2019, 9, 26. https://doi.org/10.3390/cryst9010026
Cao W, Wang Y. Phase Behaviors of Ionic Liquids Heating from Different Crystal Polymorphs toward the Same Smectic-A Ionic Liquid Crystal by Molecular Dynamics Simulation. Crystals. 2019; 9(1):26. https://doi.org/10.3390/cryst9010026
Chicago/Turabian StyleCao, Wudi, and Yanting Wang. 2019. "Phase Behaviors of Ionic Liquids Heating from Different Crystal Polymorphs toward the Same Smectic-A Ionic Liquid Crystal by Molecular Dynamics Simulation" Crystals 9, no. 1: 26. https://doi.org/10.3390/cryst9010026
APA StyleCao, W., & Wang, Y. (2019). Phase Behaviors of Ionic Liquids Heating from Different Crystal Polymorphs toward the Same Smectic-A Ionic Liquid Crystal by Molecular Dynamics Simulation. Crystals, 9(1), 26. https://doi.org/10.3390/cryst9010026