Article

Atomic Charges and Chemical Bonding in Y-Ga Compounds

1
Max-Planck-Institut für Chemische Physik fester Stoffe, 01187 Dresden, Germany
2
National University of Veterinary Medicine and Biotechnologies, 790010 Lviv, Ukraine
*
Author to whom correspondence should be addressed.
Crystals 2018, 8(2), 99; https://doi.org/10.3390/cryst8020099
Submission received: 25 January 2018 / Revised: 13 February 2018 / Accepted: 14 February 2018 / Published: 16 February 2018
(This article belongs to the Special Issue Experimental and Theoretical Electron Density Analysis of Crystals)

Abstract

:
A negative deviation from Vegard rule for the average atomic volume versus yttrium content was found from experimental crystallographic information about the binary compounds of yttrium with gallium. Analysis of the electron density (DFT calculations) employing the quantum theory of atoms in molecules revealed an increase in the atomic volumes of both Y and Ga with the increase in yttrium content. The non-linear increase is caused by the strengthening of covalent Y-Ga interactions with stronger participation of genuine penultimate shell electrons (4d electrons of yttrium) in the valence region. Summing the calculated individual atomic volumes for a unit cell allows understanding of the experimental trend. With increasing yttrium content, the polarity of the Y-Ga bonding and, thus its ionicity, rises. The covalency of the atomic interactions in Y-Ga compounds is consistent with their delocalization from two-center to multi-center ones.

1. Introduction

The issue of chemical bonding on metals and intermetallic compounds is still a question under discussion and a challenge for theoretical and experimental inorganic chemistry. In the past, charges have often been discussed in connection with metals and intermetallic compounds, and in particular, ionized species immersed in an electron cloud (“electron gas”) have been viewed as one of the driving forces for stabilization of structural patterns [1]. New opportunities for the quantum chemical analysis of the bonding in this family of inorganic substances became available with the emergence of analysis techniques in position space, including the Quantum Theory of Atoms In Molecules (QTAIM) which utilizes the topological analysis of the electron density [2], and the implementation of the 2-electron functionals for bonding indication, i.e. methods such as the electron localizability approach [3,4] or the electron localization function [5,6,7].
The distribution of the QTAIM charges facilitates studies of the ionic component of atomic interactions in intermetallic compounds. So, in the study of Al2Cu, a compound with components of rather similar electronegativity, a not necessarily expected charge transfer was found: −1.60 for Cu and +0.8 for Al [8]. The systematic QTAIM analysis of the compounds in the Al–Pt system with components differing strongly in their electronegativities revealed a complex concentration dependence of the atomic charges and volumes [9]. While—independent from composition—aluminum has positive QTAIM charges between 0 and +2 being the cation, platinum plays the role of the anionic species with charges between 0 and −4. The atomic shapes reflect the local coordination and are different in each compound. The atomic volumes show monotonic non-linear dependence on the atomic concentration. The volume of the aluminum atoms increases, and the volume of the platinum atoms decreases with the aluminum content [9]. Even larger negative QTAIM charges of −4.8 and −5.7 were found for Pt in the recent discovery of the binary compound Be21Pt5 [10], which is consistent with the slightly larger difference in electronegativity compared to the Al-Pt compounds. An interesting interconnection between the charge transfer per atom and the superconducting transition temperature was found for the compounds of bismuth with transition metals showing a very small charge transfer per atom [11]. Within the special group of intermetallic compounds, the so-called Laves phases, the evaluated QTAIM charges are proportional to the electronegativity difference between the components, revealing the important role of ionic interactions [12].
Understanding the atomic interactions in the intermetallic compounds of lanthanides is especially challenging. The combination of strong electron correlation within the valence orbital manifold, the weakness of the ligand field and relativistic effects are found nowhere else in the periodic table, and all must be properly accounted for in order to derive meaningful insight [13]. Recent attempts to apply the QTAIM approach to the individual intermetallic compounds containing rare-earth metals revealed their cationic behavior and charge depletion of less than two electrons: e.g., La1.73+ in LaB6 [14], Yb1.4+ in Yb2Pt6Al15 [15], Eu1.20+ in Eu2GaPt2 [16], and Ce0.8+ in CeIn5Ir [17]. We present here a systematic study of the atomic interactions in the binary compounds of yttrium with gallium to gain more insight into the chemical bonding in this family of intermetallic compounds.
The yttrium compounds with gallium were chosen in order to avoid the calculation difficulties with the f-electron containing rare-earth metals. On the other hand, the crystallographic information available allows the quantum-mechanical study of all the binary Y-Ga compounds found in the literature. By investigating the phase diagram of the binary system [18] the previously known compounds YGa2, YGa, Y3Ga5 and two modifications of Y5Ga3 were confirmed. Later, the compounds, YGa6, Y3Ga2 and the low-temperature modification m-Y5Ga3 were discovered. Crystallographic information on the binary compounds is presented in Table 1. The electron counting in YGa was discussed in order to understand the effect of the substitution of gallium by zinc and copper [29].

2. Methods

The TB-LMTO-ASA program package [30,31] with exchange correlation potential (LDA), according to Barth and Hedin [32], was used for quantum chemical calculations on yttrium-gallium compounds. Experimentally obtained lattice parameters and atomic coordinates (Table 1) were employed for the calculations. The radial scalar-relativistic Dirac equation was solved to get the partial waves. The calculation within the atomic sphere approximation (ASA) includes corrections for the neglect of interstitial regions and partial waves of higher order [33], hence the addition of empty spheres was necessary only for Y3Ga2 and h-Y5Ga3. The radii of atomic spheres applied for the calculations can be obtained from the authors. Basis sets containing Y(5s,4d) and Ga(4s,4p) orbitals were employed for the self-consistent calculations with the Y(5p,4f) and Ga(4d) functions being downfolded.
The electron localizability indicator was evaluated in its ELI-D representation [3,4] with a module already implemented within the TB-LMTO-ASA program package [30]. To gain deeper insight into the chemical bonding, the topology of ELI-D and electron density was analyzed with the program DGrid [34]. The electron density was integrated in spatial regions, which are bounded by zero-flux surfaces of the electron density gradient vector field. These electron density basins, each containing the atomic nucleus, represent the atomic regions defined in the Quantum Theory of Atoms In Molecules (QTAIM) [2], and their electronic population gives rise to the QTAIM effective atomic charges. In the framework of ELI-D analysis, the analogous procedure provides electron counts also for each ELI-D basin. With QTAIM space partitioning defining atomic regions, and ELI-D space partitioning defining intra-atomic core and interatomic bond regions complementary information can be obtained. Moreover, the two types of space partitioning can be combined within the ELI-D/QTAIM basin intersection method, where both types of partitioning are superimposed to determine how ELI-D bond basins are spatially composed of QTAIM atomic regions and their electronic populations. The QTAIM- and ELI-D-based electron counts reveal basic information for the description of the bonding situation [35].
In order to evaluate delocalization indexes, the calculations for YGa2 and YGa were also performed using the all-electron full potential LAPW program package Elk [36]. For the DFT/PBE [37] calculation the atomic Y(4s2p6d1 5s2) and Ga(3s2p6d10 4s2p1) states were treated as semi-core and valence states; the remaining atomic states of lower energy were treated as core states. The resulting wavefunction was analyzed and two-center delocalization indices were calculated with the DGrid-4.7 program [38], the subsequent calculation of three-center delocalization indices and bond delocalization ratios G [14] was effectuated with the DISij program [39].

3. Results and Discussion

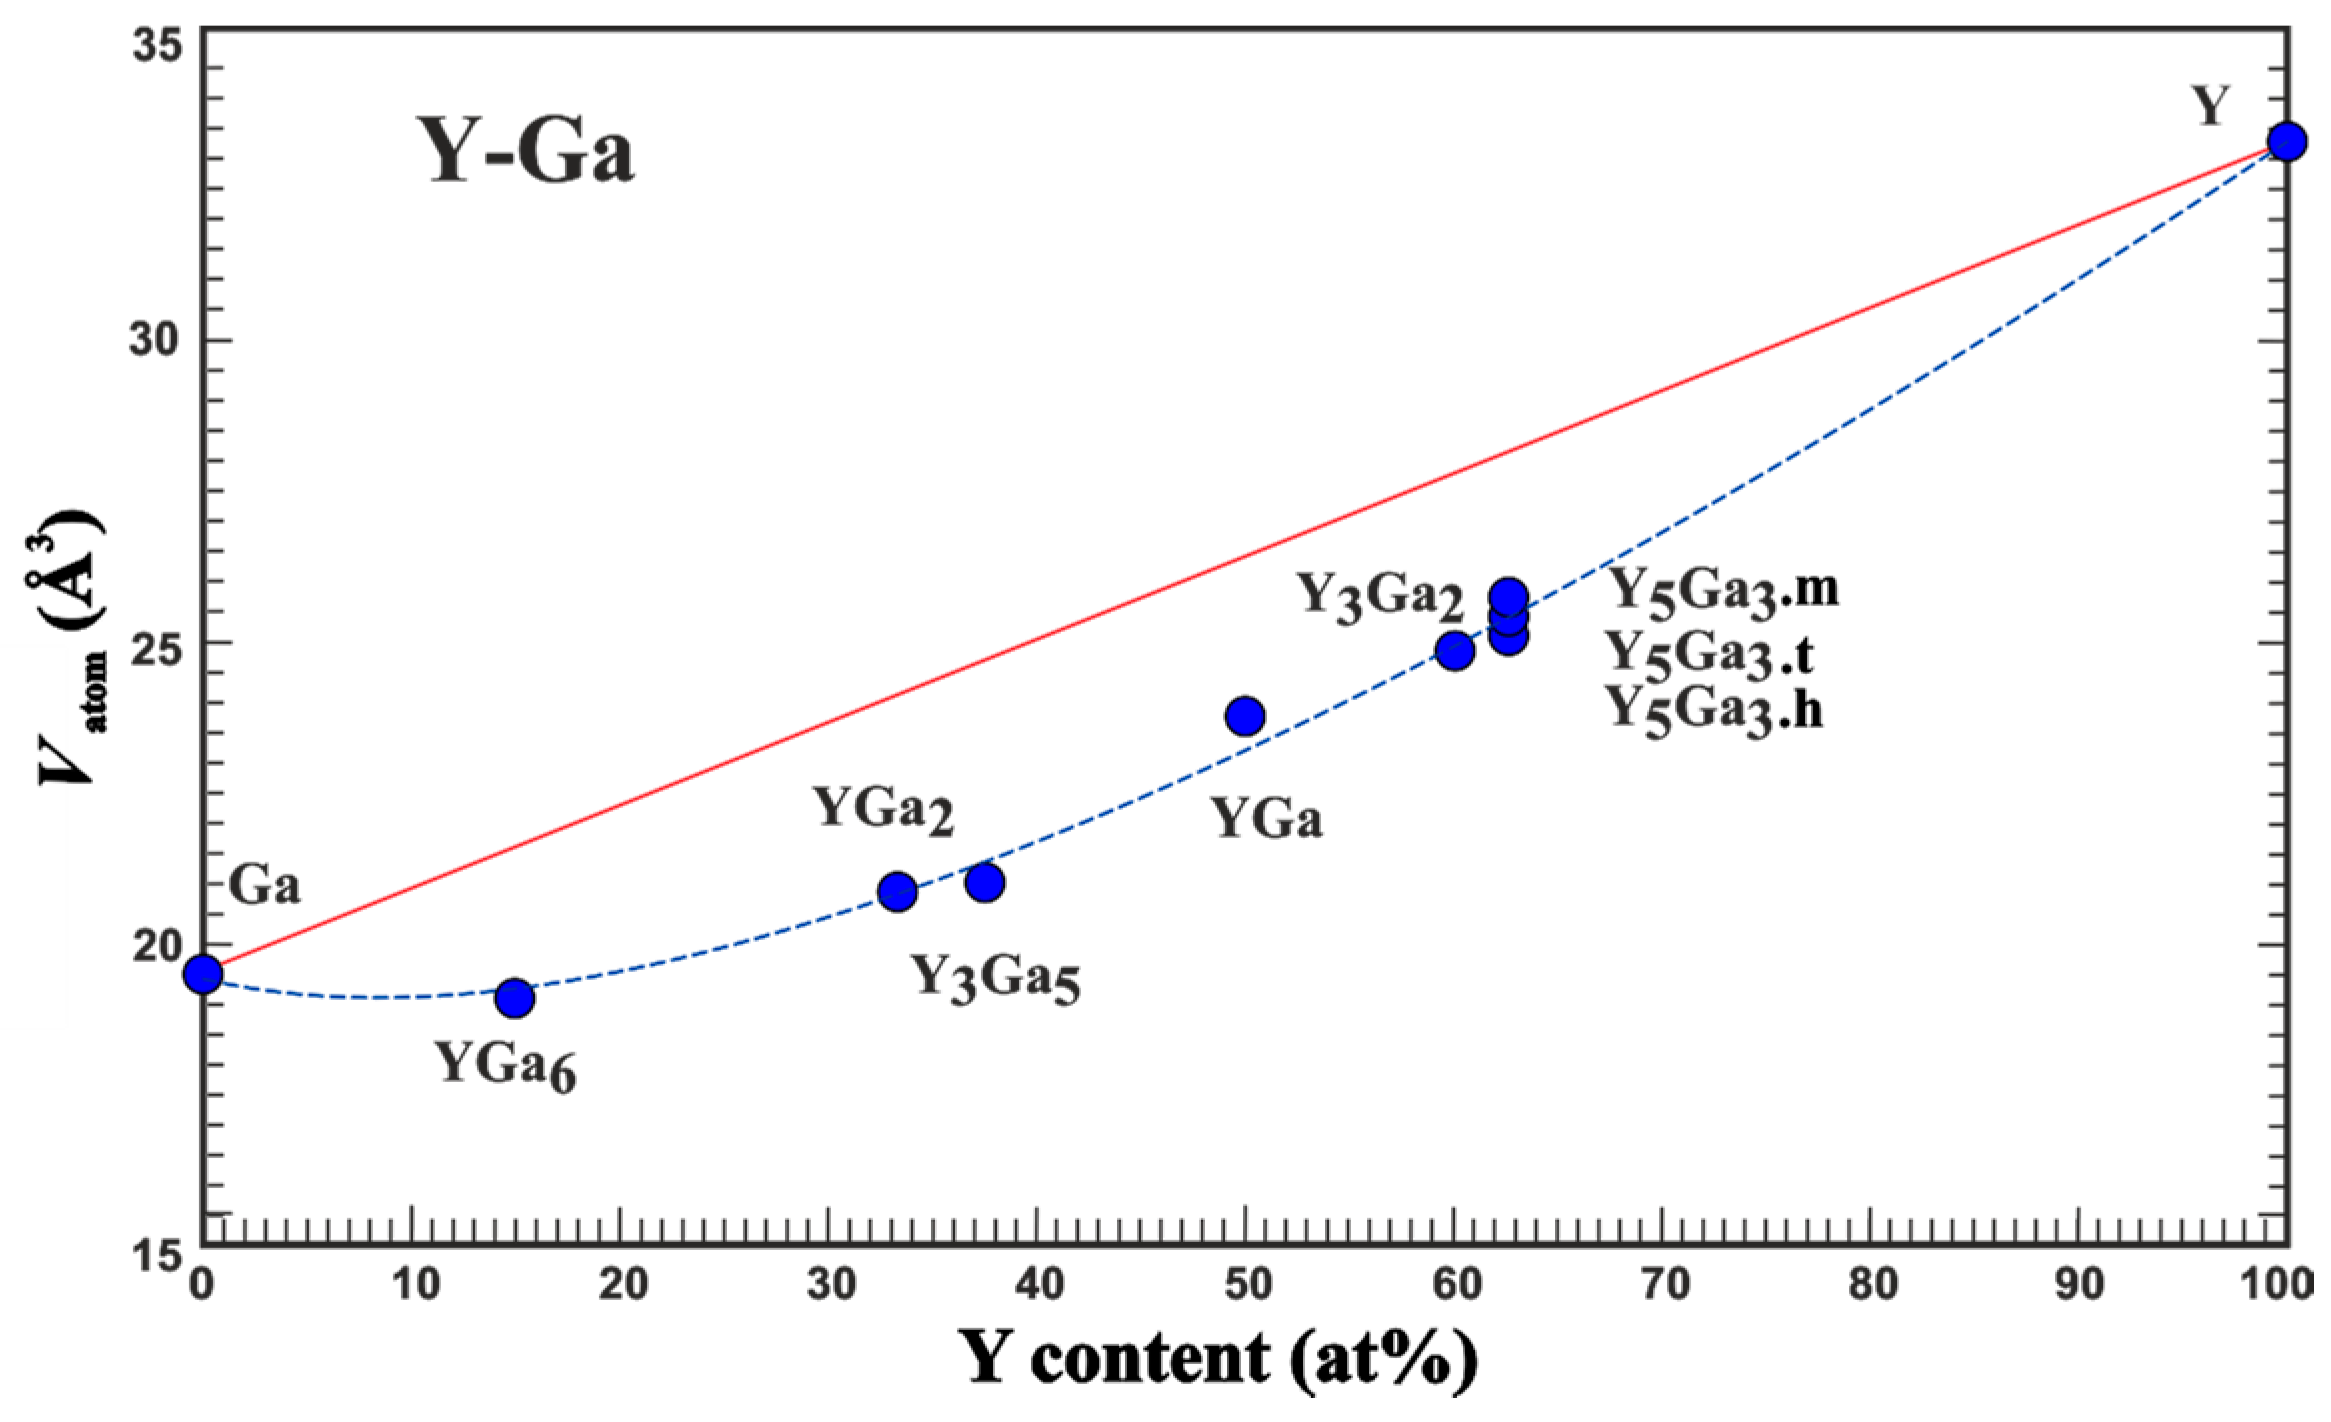
3.1. Average Atomic Volume

An experimental quantity suitable for comparison with the results of the quantum chemical calculations in position space is the average atomic volume Vatom which is obtained from the volume of the unit cell [9]. Analysis of the experimental data on lattice parameters of the compounds of yttrium with gallium (Table 1) shows that the average atomic volume systematically deviates from the expected one assuming the validity of the Vegard rule (Figure 1). Already the adoption of the minimal amount of yttrium (YGa6 compound) results in a strong reduction in the average atomic volume. The deviation from the Vegard line (red in Figure 1) increases towards Y3Ga5 and becomes slightly smaller for the yttrium-richer compounds. These findings indicate the importance of the yttrium-gallium interactions, which were further studied by quantum-chemical techniques in position space.

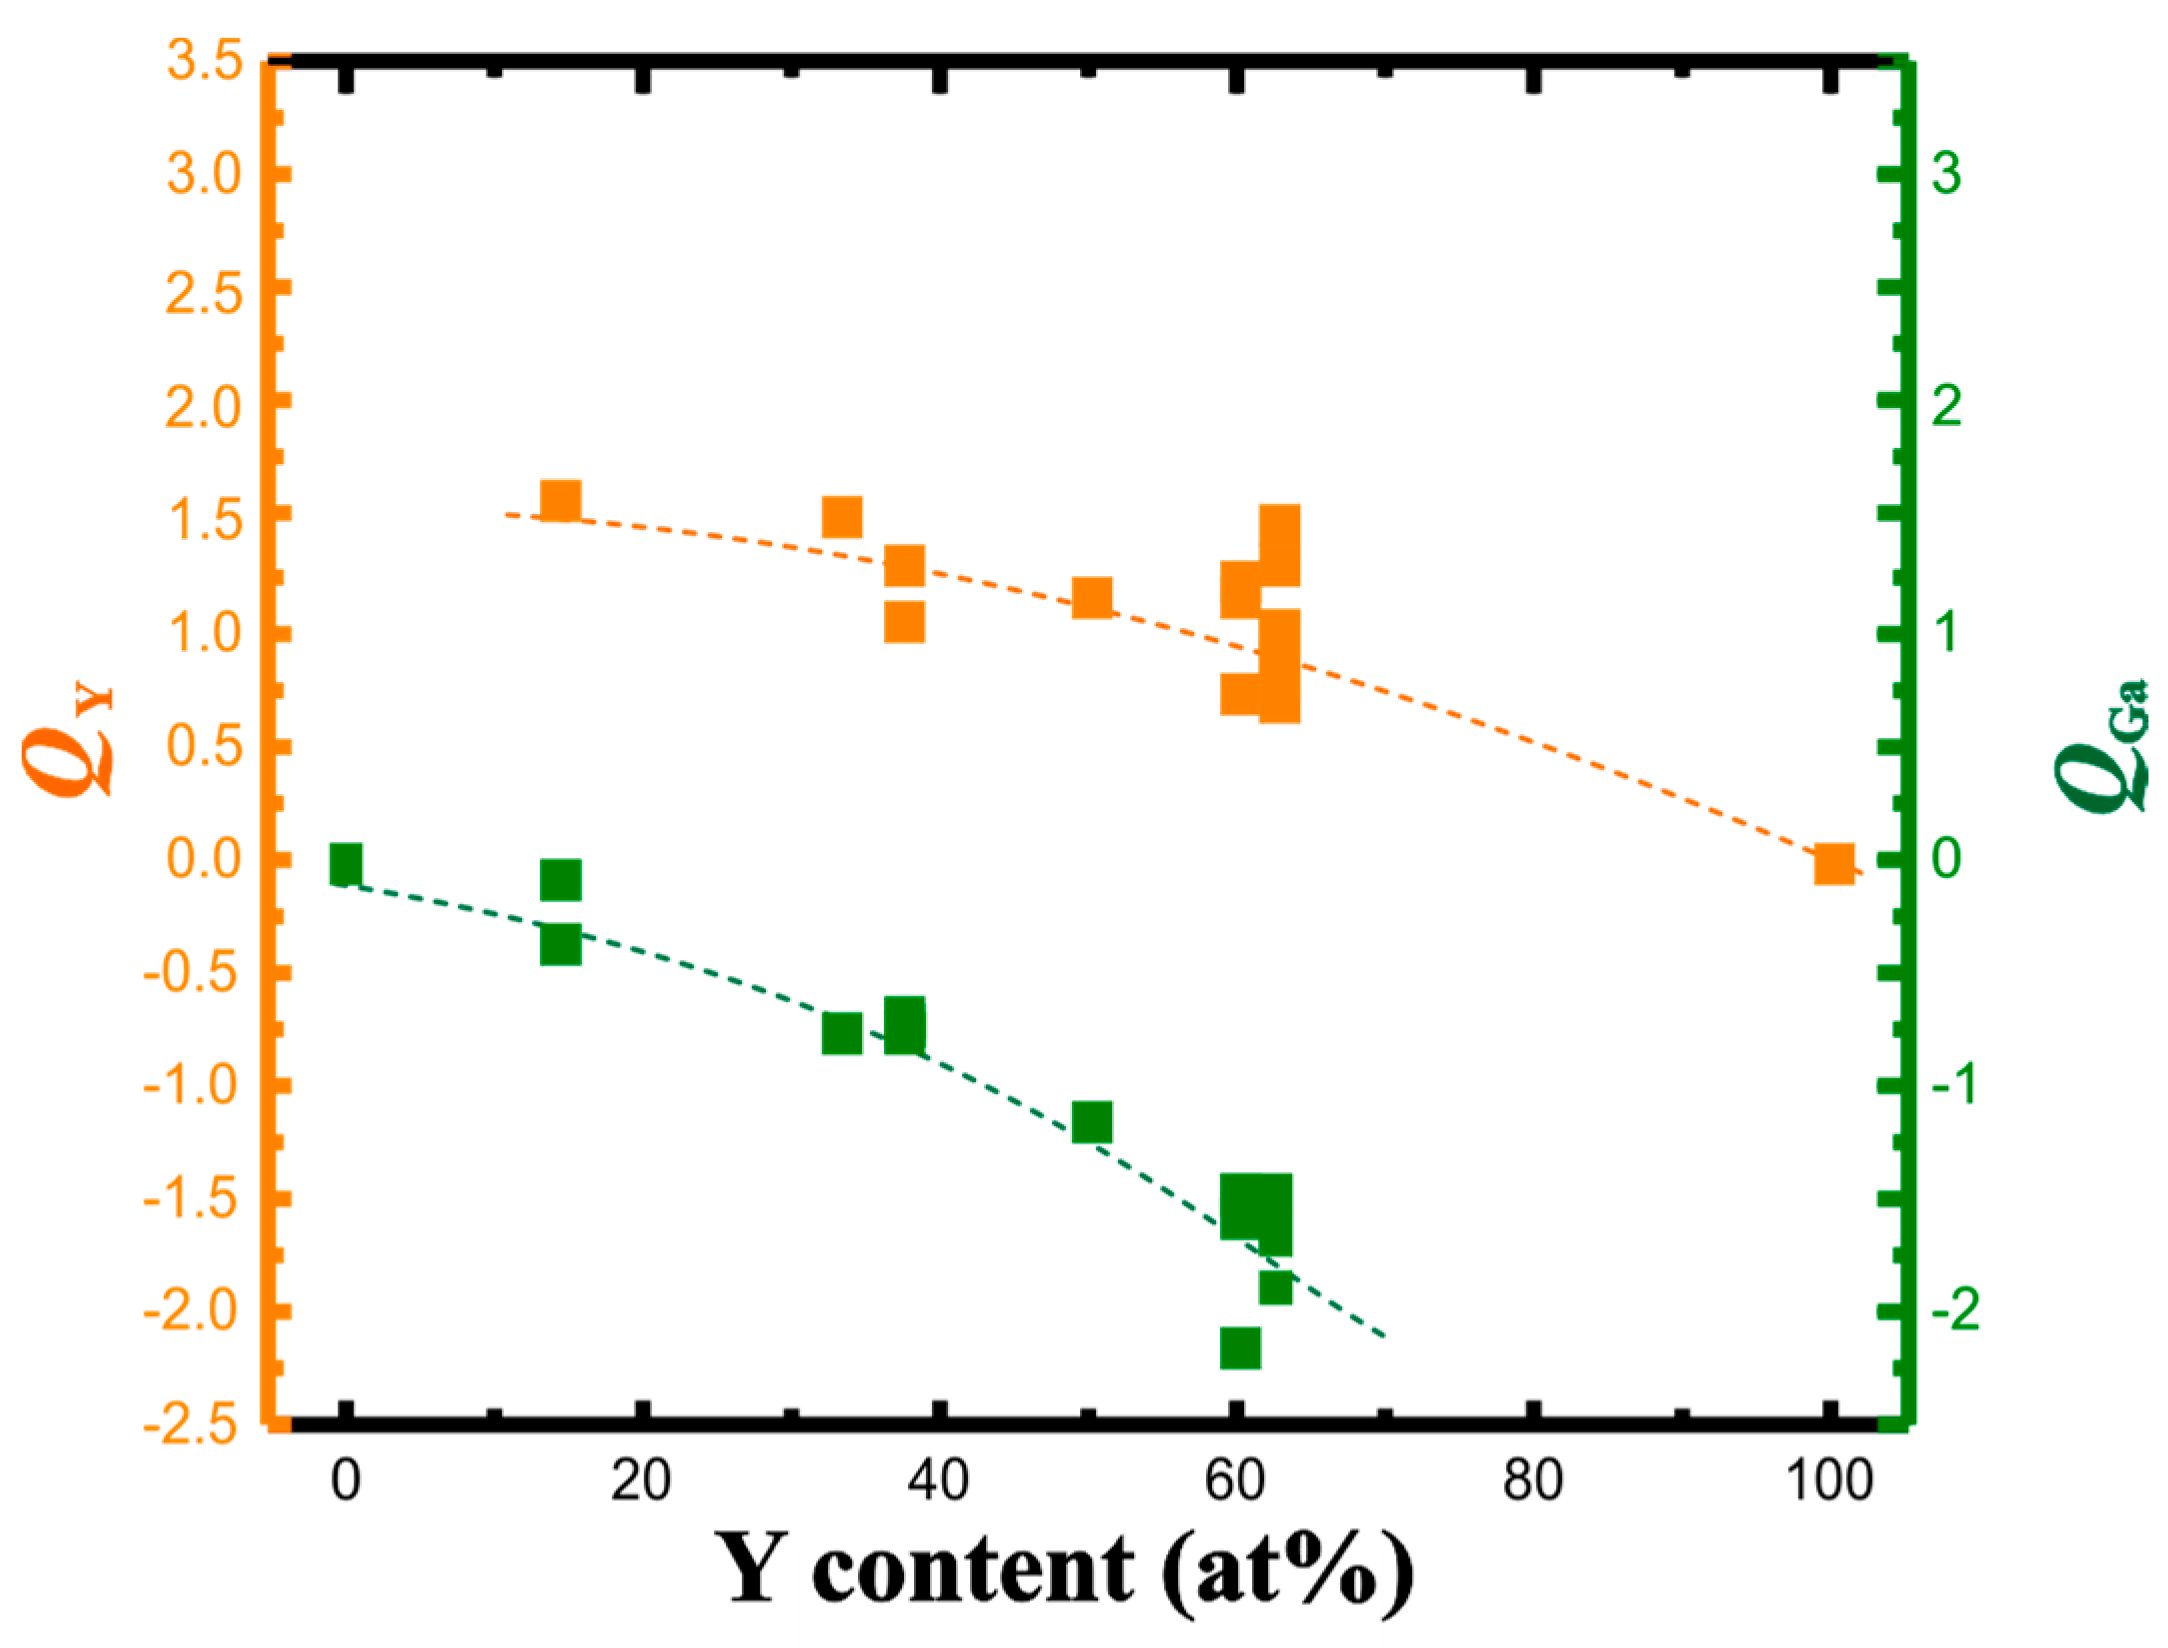
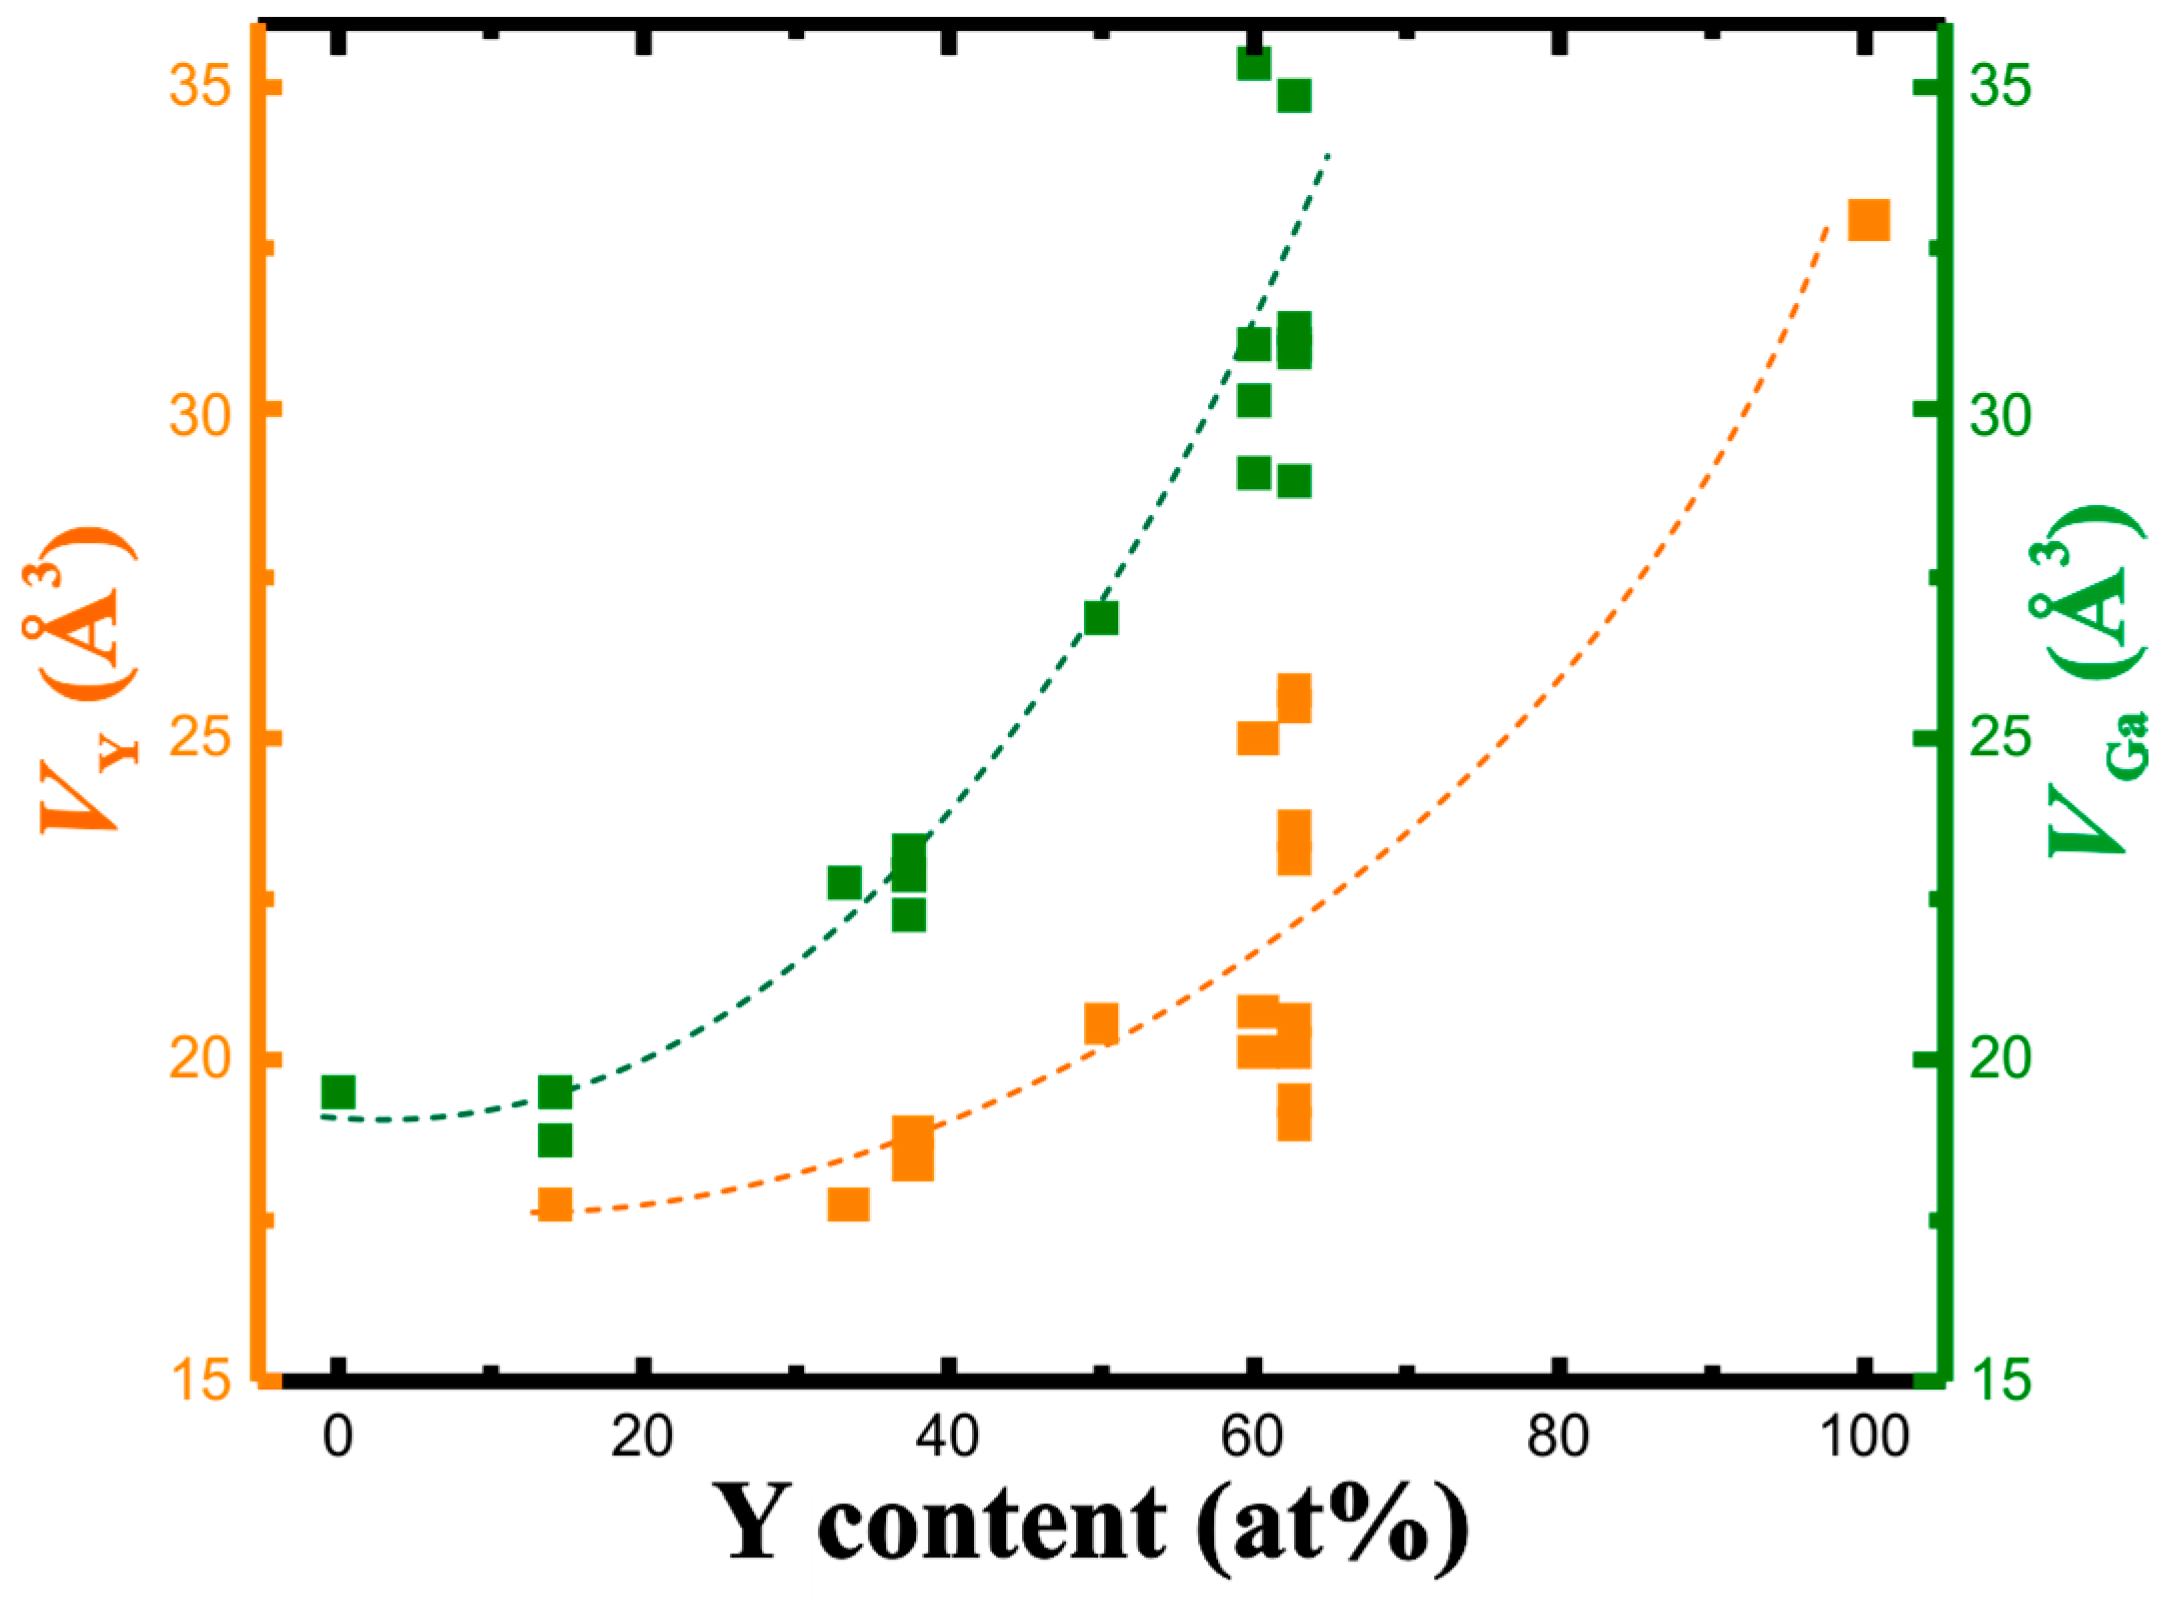
3.2. QTAIM Charges and Atomic Volumes

Analysis of the shapes of the QTAIM atoms in the yttrium gallides (Figure 2) reveals, that with increasing concentration of yttrium, the shape of the yttrium atoms deviates more and more from being spherical. In YGa6 and YGa2, the yttrium species have approximately spherical shapes. The shapes of the gallium atoms display concave regions originating from the common surface with the cationic yttrium species. This is characteristic for the predominately ionic Y-Ga interactions in the system. In such a case, the atomic basin of yttrium includes mostly chemically inert (“hard”) inner atomic shells, while the QTAIM gallium species also include, besides their own core regions, the whole valence space. This situation is accompanied by a comparably high charge transfer from yttrium to gallium, and large effective charges on Y (+1.60 and +1.54 for YGa6 and YGa2, respectively). With increasing yttrium concentration, the shapes of the yttrium atoms reflect more and more their coordination environment, and their surface contains flat or convex elements being the common surfaces with neighboring yttrium or gallium atoms, respectively. For example, the shapes of the QTAIM atoms in the elemental structures of Y and Ga reveal flat common surfaces in agreement with the depiction of non-polar covalent bonding. This finding indicates the increase in the covalency of the interaction Y-Ga in the binary compounds. Similar behavior was found recently e.g., for Be21Pt5 [10] and CdSb [40]. The QTAIM effective charges of yttrium atoms drop towards +1 (Table 1).
With each of the yttrium atoms transferring between 1.6 and 1.0 electrons to the gallium partial structure, the gallium atoms increase the accepted charge from 0.2 towards 2 electrons per atom (Figure 3). The change in the effective charges versus yttrium concentration—similar to the Al-Pt system—is monotonic indicating the continuous change of the ionic component of chemical bonding.
The concentration dependence of the QTAIM charges, that is, the charge reduction per Y atom and charge increase per Ga atom with increasing yttrium concentration, suggests a shrinking of the atomic volume of Y with increasing yttrium content. The calculated atomic volumes show just the opposite development. In fact, both atomic volumes (Y and Ga) increase with the yttrium concentration (Figure 4). The increase is non-linear for both. It is caused by increasingly covalent Y-Ga interactions with stronger participation of genuine penultimate shell electrons (electrons from Y(4d) orbitals) in the valence region. Upon summing the individual atomic volumes for the unit cell, this development of the individual atomic volumes allows to understand the trend in the change of the experimental average atomic volumes with the negative deviation from the Vegard rule (cf. Figure 1).

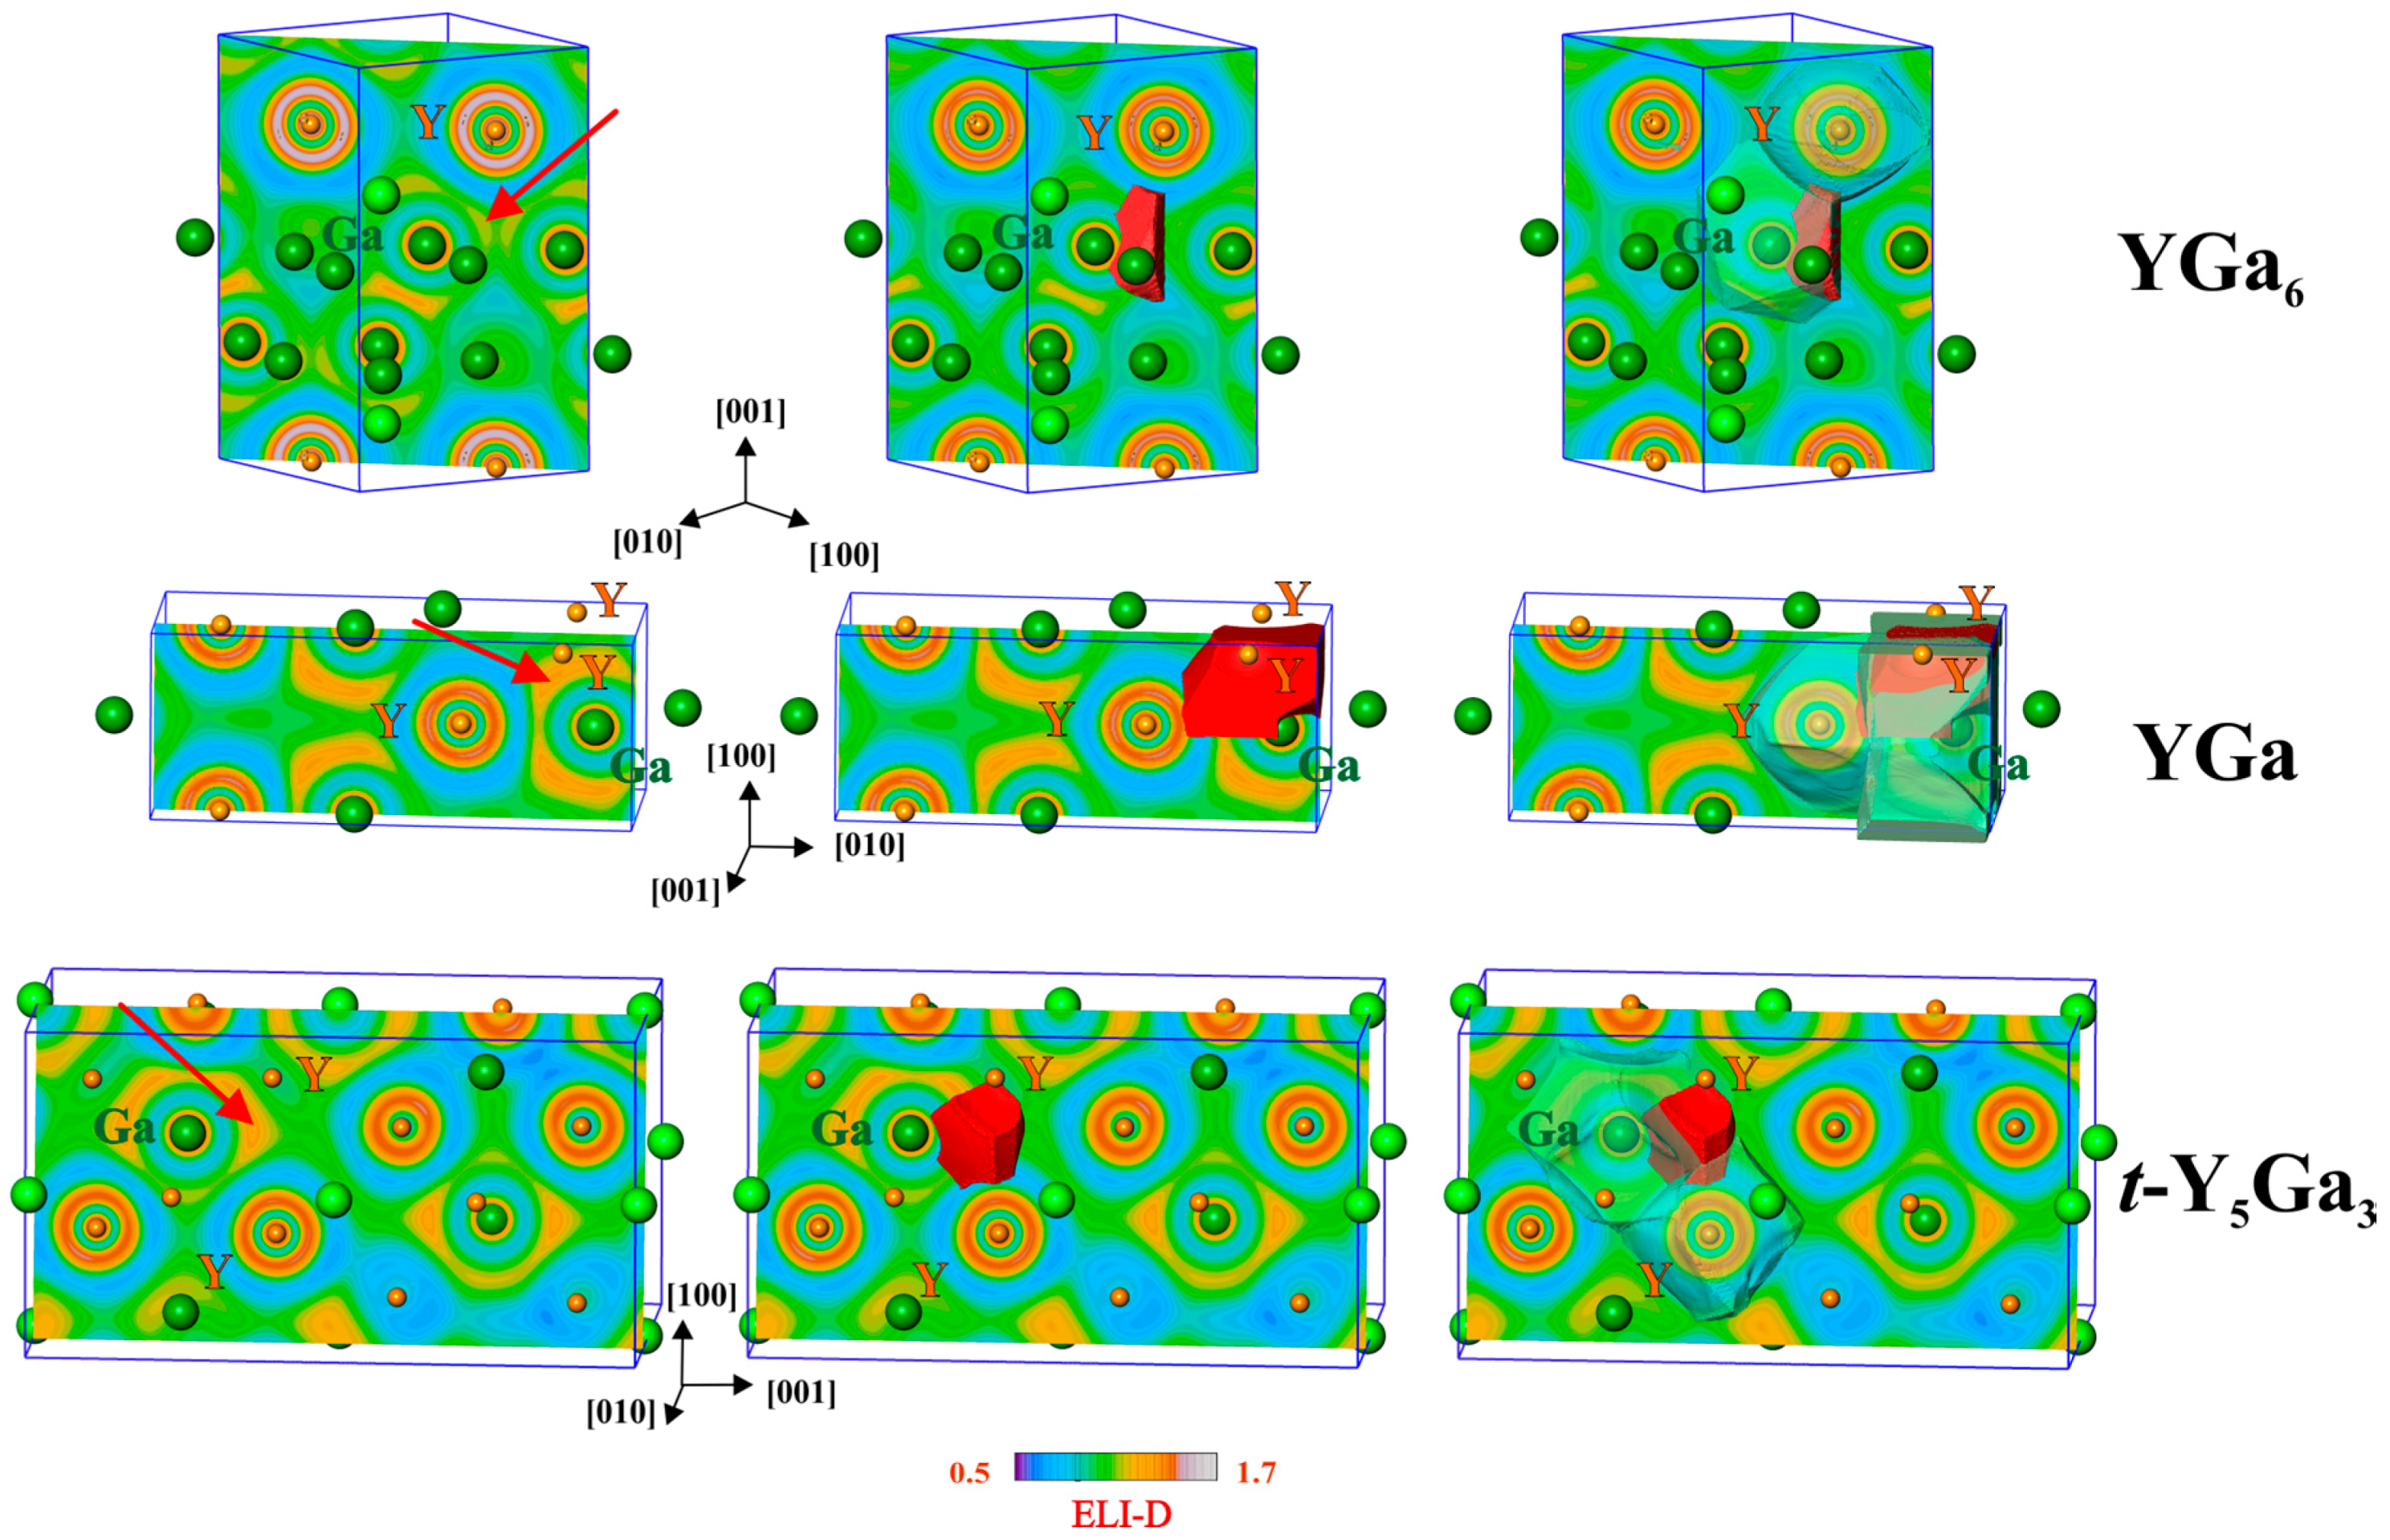
3.3. Yttrium–Gallium Interactions from Electron-Localizabilty Approach

In order to understand the role of the yttrium-gallium interactions in the stabilization of the binary structural patterns in the compounds of the system Y-Ga, further analysis of chemical bonding in the representative compounds YGa6, YGa and t-Y5Ga3, representing different yttrium contents, was made applying the electron localizability approach.
The ELI-D distribution in the penultimate shell of the yttrium atoms shows systematically increasing deviations from the isotropic shape (structuring [4], Figure 5, left). Quantitative characterization of this trend was made using the so-called structuring index ε (the difference between the maximal ELI-D value in the shell and the value when the isosurface of the shell closes [4]). The value increases from 0.024 via 0.030 to 0.064–0.079, from YGa6 via YGa to t-Y5Ga3, respectively (two crystallographically different Y atoms in the last case). The feature of structuring is a fingerprint of the participation of the electrons of the penultimate shell in the interactions within the valence region [4,41]. This participation increases with the Y content. Formally, Y delivers two instead of three electrons for Ga from the outer shell; in the ELI-D picture of the free Y and Ga atoms, there are 2.321 and 3.368 valence (outer shell) electrons, respectively [42]. The decrease in valence electron concentration with the yttrium content requires transfer of more electrons from yttrium.
The ELI-D maxima (attractors) are mostly not located on the lines between two atoms (the exceptional case is shown in YGa with the ELI-D maximum on the Ga–Ga line in the center of the (110) plane). The ELI-D basins of the attractors (Figure 5, middle) are usually located within several QTAIM atomic basins. For the selected Y–Ga interactions this is show in Figure 5, right. This visualizes the multi-center nature of the atomic interactions. Quantitatively this is characterized by the ELI-D/QTAIM basin intersection technique, which yields the distribution of the electron population of the ELI-D basin (bonding electrons) between the QTAIM atomic basins which intersect the ELI-D ones.
For the selected basin in YGa6 (total population of 0.6 electrons), 96.6% of the population originates from the QTAIM basin of the Ga atom, and 2.1% from the Y atom, which are shown in Figure 5 by the transparent shapes. The remaining 1.3% are donated by three further neighboring gallium atoms. Using the recently developed technique [43], the polarity of the bonding is quantitatively characterized by the bond fraction—the part of electrons contributed to the bonding basin by the atomic basin possessing the majority of the electrons—in this case—of gallium. The bond fraction is related to the earlier defined bond polarity index [44], but is more generally usable in cases where more than two QTAIM atoms contribute to an ELI-D basin. Assuming this interaction as a two-center one, the bond fraction of the selected Y–Ga bond is 0.966 (0.5 characterizes the non-polar bond, 1.0 is the value for the fully polar (ionic) constellation), and this interaction is strongly polar. One may understand this ELI-D basin as a lone-pair-like bonding feature [43].
In the YGa2 compound (structure type AlB2), there is only one type of ELI-D attractor observed, namely, close to the shortest Ga–Ga contact signifying the most pronounced covalent interaction in the system. The Ga–Ga bond in the planar graphite-like gallium nets looks initially like a two-center one. Nevertheless, the value of the delocalization index (in other words, its effective covalent bond order [45]) for this interaction is 0.77 and raises the question of the three-center contributions to this bond. Moreover, the ELI-D/QTAIM intersection technique reveals the participation of four yttrium atoms below and above the net. These findings are additionally supported with the bond delocalization ratio G(A,B) characterizing the three-center character of a two-center interaction A-B. This tool was developed during the bonding study on metal hexaborides [14], and subsequently applied to intermetallic diborides [46]. For the classical three center bonding in H3+ it amounts to 1, for the two-center bond it is close to zero. For the Ga–Ga bond in YGa2, G(Ga,Ga) = 0.45, which is already at the upper limit of observed bond delocalization ratios in classical valence compounds, i.e., for Ge bond delocalization ratios G(Ge,Ge’) = 0.32, while G(B,B’) ≈ 1 for endohedral B–B bonds in B6 octahedra for CaB6 and YB6 [14].
For YGa, the calculated delocalization index Ga−Ga’ equals 0.60, and G(Ga,Ga’) = 0.74, which clearly shows the trend of decreasing effective covalent bond order Ga–Ga corresponds with an increasing delocalization of the Ga−Ga bonding. The tendency towards increasing the number of bond centers continues also for the Y–Ga interaction in yttrium monogallide. In this compound the ELI-D basin of the Y–Ga interaction is intersected by one QTAIM basin of Ga and three of Y atoms (Figure 5, middle right). The contribution of the Ga atom to the bonding basin (total population of 2.30 electrons) is 77.8%, i.e., much smaller than it was in YGa6. The bonding has a predominately two-center character because the next large contribution (14.3%) originates from one yttrium atom alone. The two remaining yttrium atoms together yield only 7.9% of the population of the bonding basin, revealing its more pronounced three-center character than was found above for YGa6 and YGa2. Considering this interaction as a two-center one, i.e., keeping only these two contributions, its bond fraction would be 0.845 (0.778/(0.778 + 0.143)). Summing all Y contributions together as required by the definition of the bond fraction, the Ga bond fraction of this (four-atomic) interaction amounts to 0.778. Both values are markedly smaller than the value of 0.966 discussed above for YGa6.
The trend towards the formation of multi-center bonds is continued in the compound t-Y5Ga3 (Figure 5, bottom). The basin of the selected bonding ELI-D attractor (total population of 0.95 electrons) is also intersected by one Ga- and three Y-QTAIM basins. The contributions of the participating atoms are 71.5% for Ga and 8.4%, 9.5% and 10.6% for the yttrium atoms. The bond fraction of this four-atomic interaction is 0.715, showing further reduction in the bond polarity.

4. Conclusions

From experimentally available structural data for binary Y-Ga compounds, a negative deviation from the Vegard rule for the dependence of the average atomic volume from the yttrium concentration was obtained. Analysis of the calculated electron density in the binary compounds of yttrium with gallium shows that this can be understood considering the non-linear increase of the QTAIM atomic volumes for both yttrium and gallium, with the yttrium content.
With the increase in the yttrium content from YGa6 to Y5Ga3, the polarity of the bonding and, thus, its ionicity is reduced. The covalency of the interactions corresponds with their delocalization from the two-center to multi-center ones.

Author Contributions

Y.G. developed the concept of the study; A.F. prepared and evaluated crystallographic information; Y.G., R.J.F. and F.R.W. performed the calculations; Y.G., A.F. and F.R.W. wrote the manuscript.

Conflicts of Interest

The authors declare no conflicts of interest.

References and Note

  1. Barrett, C.S.; Massalski, T.B. Structure od Metals, 3rd ed.; Pergamon Press: Oxford, UK; New York, USA; Seoul, Korea; Tokyo, Japan, 1992; p. 306. [Google Scholar]
  2. Bader, R.F. Atoms in Molecules—A Quantum Theory; Clarendon Press: Oxford, UK, 1995. [Google Scholar]
  3. Kohout, M. Bonding indicators from electron pair density functionals. Faraday Discuss. 2007, 135, 43–54. [Google Scholar] [CrossRef] [PubMed]
  4. Wagner, F.R.; Bezugly, V.; Kohout, M.; Grin, Y. Charge Decomposition Analysis of the Electron Localizability Indicator: A Bridge between the Orbital and Direct Space Representation of the Chemical Bond. Chem. Eur. J. 2007, 13, 5724–5741. [Google Scholar] [CrossRef] [PubMed]
  5. Becke, A.D.; Edgecombe, K.E. A simple measure of electron localization in atomic and molecular systems. J. Chem. Phys. 1990, 92, 5397–5403. [Google Scholar] [CrossRef]
  6. Savin, A.; Becke, A.D.; Flad, J.; Nesper, R.; Preuss, H.; von Schnering, H.G. A new look at electron localization. Angew. Chem. Int. Ed. Engl. 1991, 30, 409–412. [Google Scholar] [CrossRef]
  7. Grin, Y.; Savin, A.; Silvi, B. The ELF perspective of chemical bonding. In The Chemical Bond: Chemical Bonding Across the Periodic Table; Wiley-VCH: Weinheim, Germany, 2014; Volume 1, p. 345. [Google Scholar]
  8. Grin, Y.; Wagner, F.R.; Armbrüster, M.; Kohout, M.; Leithe-Jasper, A.; Schwarz, U.; Wedig, U.; von Schnering, H.G. CuAl2 revisited: Composition, crystal structure, chemical bonding, compressibility and Raman spectroscopy. J. Solid State Chem. 2006, 179, 1707–1719. [Google Scholar] [CrossRef]
  9. Baranov, A.; Kohout, M.; Wagner, F.R.; Grin, Y.; Bronger, W. Spatial chemistry of the aluminum-platinum compounds: A quantum chemical approach. Z. Kristallogr. 2007, 222, 527–531. [Google Scholar] [CrossRef]
  10. Amon, A.; Ormeci, A.; Bobnar, M.; Akselrud, L.G.; Avdeev, M.; Gumeniuk, R.; Burkhardt, U.; Prots, Y.; Hennig, C.; Leithe-Jasper, A.; Grin, Y. Cluster Formation in the Superconducting Complex Intermetallic Compound Be21Pt5. Acc. Chem. Res. 2018. [Google Scholar] [CrossRef] [PubMed]
  11. Guo, K.; Akselrud, L.; Bobnar, M.; Burkhardt, U.; Schmidt, M.; Zhao, J.-T.; Schwarz, U.; Grin, Y. Weak Interactions under Pressure: hp-CuBi and its Analogues. Angew. Chem. Int. Ed. 2017, 56, 5620–5624. [Google Scholar] [CrossRef] [PubMed]
  12. Ormeci, A.; Simon, A.; Grin, Y. Structural Topology and Chemical Bonding in Laves Phases. Angew. Chem. Int. Ed. 2010, 49, 8997–9001. [Google Scholar] [CrossRef] [PubMed]
  13. Kaltsoyannis, K.; Kerridge, A. Chemical Bonding in Lanthanides and Actinides. In The Chemical Bond Chemical Bonding Across the Periodic Table; Wiley-VCH: Weinheim, Germany, 2014; Volume 2, p. 337. [Google Scholar]
  14. Börrnert, C.; Grin, Y.; Wagner, F.R.W. Position-Space Bonding Indicators for Hexaborides of Alkali, Alkaline Earth, and Rare Earth Metals in Comparison to the Molecular Crystal K2[B6H6]. Z. Anorg. Allg. Chem. 2013, 639, 2013–2024. [Google Scholar] [CrossRef]
  15. Prots, Y.; Deppe, M.; Cardoso-Gil, R.; Cervellino, A.; Ormeci, A.; Geibel, C.; Grin, Y. Yb2Al15Pt6—Tshe most ordered variety of the Sc1.2Fe4Si9.8 aristotype. Chem. Met. Alloys 2014, 7, 85–99. [Google Scholar]
  16. Pöttgen, R.; Borrmann, H.; Grin, Y. Multi-Center vs. Two-Center Bonding within the Hetero-Polyanion in Eu2GaPt2 and its Prototype Ca2SiIr2. Z. Anorg. Allg. Chem. 2017, 643, 1338–1343. [Google Scholar] [CrossRef]
  17. Wirth, S.; Prots, Y.; Wedel, M.; Ernst, S.; Kirchner, S.; Fisk, Z.; Thompson, J.D.; Steglich, F.; Grin, Y. Structural Investigations of CeIrIn5 and CeCoIn5 on Macroscopic and Atomic Length Scales. J. Phys. Soc. Jpn. 2014, 83, 061009. [Google Scholar] [CrossRef]
  18. Yatsenko, S.P.; Semyannikov, A.A.; Semenov, G.B.; Chuntonov, K.A. Phase diagrams of rare earth metals with gallium. J. Less Common Met. 1979, 64, 185–199. [Google Scholar] [CrossRef]
  19. Sharma, B.D.; Donohue, J.A. A refinement of the crystal structure of gallium. Z. Kristallogr. 1962, 117, 293–300. [Google Scholar] [CrossRef]
  20. Gryniv, O.I.; Gryniv, I.A.; Grin, Y.; Yarmolyuk, Y.P. Synthesis and crystalline structure of the YGa6 compound. Dopov. Akad. Nauk Ukr. RSR Ser. B 1985, 5, 42–44. [Google Scholar]
  21. Bruzzone, G.; Ruggiero, A.F.; Bonino, G.B. Struttura di alcuni composti intermetallici dell‘ittrio. II. Composti con Al, Ga, In, Tl, Pb, Sn. Atti Accad. Naz. Lincei Cl. Sci. Fis. Mat. Nat. Rend. 1962, 33, 465–471. [Google Scholar]
  22. Yatsenko, S.P.; Gladyshevskii, E.I.; Tschuntonow, K.A.; Yarmolyuk, Y.P.; Grin, Y. Kristallstruktur von Tm3Ga5 und analoger Verbindungen. J. Less-Common Met. 1983, 91, 21–32. [Google Scholar] [CrossRef]
  23. Schob, O.; Parthé, E. AB Compounds with Sc, Y and Rare Earth Metals. I. Scandium and Yttrium Compounds with CrB and CsCl Structure. Acta Crystallogr. 1965, 19, 214–224. [Google Scholar] [CrossRef]
  24. Yatsenko, S.P.; Gladyshevskii, R.E.; Sitschewitsch, O.M.; Belskii, V.K.; Semyannikov, A.A.; Grin, Y.; Yarmolyuk, Y.P. Kristallstruktur von Gd3Ga2 und isotypen Verbindungen. J. Less-Common Met. 1986, 115, 17–22. [Google Scholar] [CrossRef]
  25. Zhao, J.-T.; Corbett, J.D. R5Ga3 compounds of selected rare earth metals R: Structures and properties. J. Alloys Compds. 1994, 210, 1–7. [Google Scholar] [CrossRef]
  26. Markiv, V.Y.; Belyavina, N.N. Crystal structure of new compounds of the composition R5Ga3 (R = Y, Tm, Lu). Dopov. Akad. Nauk Ukr. 1992, 10, 142–416. [Google Scholar]
  27. Schob, O.; Parthé, E. Sc5Ga3 and Y5Ga3 with D88 structure. Acta Crystallogr. 1964, 17, 1335–1336. [Google Scholar] [CrossRef]
  28. Spedding, F.H.; Sanden, B.; Beaudry, B.J. The Er-Y, Tb-Ho, Tb-Er, Dy-Ho, Dy-Er and Ho-Er phase systems. J. Less-Common Met. 1973, 31, 1–13. [Google Scholar] [CrossRef]
  29. Zhao, J.-T.; Seo, D.-K.; Corbett, J.D. Synthesis, structure and properties of CaGa, YGa and Y(Ga,Z) phases: A model for the transformation of a CrB to MoB-type structure in doped YGa phases. J. Alloys Compds. 2002, 334, 110–117. [Google Scholar] [CrossRef]
  30. Kohout, M.; Wagner, F.R. Modified version lmto47e of the Stuttgart TB-LMTO-ASA Code; Max-Planck-Institut für Chemische Physik fester Stoffe: Dresden, Germany, 2016. [Google Scholar]
  31. Jepsen, O.; Burkhardt, A.; Andersen, O.K. The Program TB-LMTO-ASA; Version 4.7; Max-Planck-Institut für Festkörperforschung: Stuttgart, Germany, 1999. [Google Scholar]
  32. Barth, U.; Hedin, L. A local exchange-correlation potential for the spin polarized case I. J. Phys. C 1972, 5, 1629–1642. [Google Scholar] [CrossRef]
  33. Andersen, O.K. Linear methods in band theory. Phys. Rev. B 1975, 12, 3060–3083. [Google Scholar] [CrossRef] [Green Version]
  34. Kohout, M. DGrid, version 4.6. Available online: http://www2.cpfs.mpg.de/~kohout/dgrid.html (accessed on 25 January 2018).
  35. Bende, D.; Grin, Y.; Wagner, F.R. Chemical Bonding in MgAgAs-Type Compounds. In Heusler Alloys; Felser, C., Hirohata, A., Eds.; Springer: Cham, Switzerland; Heidelberg, Germany; New York, USA; Dodrecht, The Netherland; London, UK, 2016; p. 133ff. [Google Scholar]
  36. Dewhurst, K.; Sharma, S.; Nordström, L.; Granäs, O.; Gross, E.K.U. Program Elk, version 2.2.10. Available online: http://www.sourceforge.net (accessed on 25 January 2018).
  37. Perdew, J.P.; Burke, K.; Ernzerhof, M. Generalized Gradient Approximation Made Simple. Phys. Rev. Lett. 1996, 77, 3865–3868. [Google Scholar] [CrossRef] [PubMed]
  38. Kohout, M.; Baranov, A.I. DGrid 4.7. Radebeul, Germany, 2012. [Google Scholar]
  39. Wagner, F.R. Program DISij, version 7.1.0; Max-Planck-Institut für Chemische Physik fester Stoffe: Dresden, Germany, 2015. [Google Scholar]
  40. Wang, S.; Yang, J.; Wu, L.; Wei, P.; Yang, J.; Zhang, W.; Grin, Y. Anisotropic multicenter bonding and high thermoelectric performance in electron-poor CdSb. Chem. Mater. 2015, 27, 1071–1081. [Google Scholar] [CrossRef]
  41. Kohout, M.; Wagner, F.R.; Grin, Y. Electron localization function for transition-metal compounds. Theor. Chem. Acc. 2002, 108, 150–156. [Google Scholar] [CrossRef]
  42. Baranov, A.I. Electron Localizability Indicators from Spinor Wavefunctions. J. Comp. Chem. 2014, 35, 565–585. [Google Scholar] [CrossRef] [PubMed]
  43. Wagner, F.R.; Bende, D.; Grin, Y. Heteropolar bonding and a position-space representation of the 8 − N rule. Dalton Trans. 2016, 45, 3236–3243. [Google Scholar] [CrossRef] [PubMed]
  44. Raub, S.; Jansen, G. A quantitative measure of bond polarity from the electron localization function and the theory of atoms in molecules. Theor. Chem. Acc. 2001, 106, 223–232. [Google Scholar] [CrossRef]
  45. Angyan, J.G.; Loos, M.; Meyer, I. Covalent Bond Orders and Atomic Valence Indices in the Topological Theory of Atoms in Molecules. J. Phys. Chem. 1994, 98, 5244–5248. [Google Scholar] [CrossRef]
  46. Wagner, F.R.; Baranov, A.I.; Grin, Y.; Kohout, M. A Position-Space View on Chemical Bonding in Metal Diborides with AlB2 Type of Crystal Structure. Z. Anorg. Allg. Chem. 2013, 639, 2025–2035. [Google Scholar] [CrossRef]
Figure 1. Average atomic volume Vatom vs yttrium concentration in the compounds of yttrium with gallium. The red line presents the behavior expected from the Vegard rule. The blue line only serves as an eye guide.
Crystals 08 00099 g001
Figure 2. The shapes of selected Y and Ga atoms in the yttrium compounds with gallium. All panels are shown in the same scale.
Crystals 08 00099 g002
Figure 3. QTAIM charges of yttrium (orange) and gallium (green) in the Y-Ga compounds in dependence on the yttrium concentration. Dashed lines are eye-guides only.
Crystals 08 00099 g003
Figure 4. QTAIM atomic volumes of yttrium (orange) and gallium (green) in the Y-Ga compounds in dependence on the yttrium concentration. Dashed lines serve as eye-guides only.
Crystals 08 00099 g004
Figure 5. Electron localizability indicator (ELI-D) in YGa6 (top), YGa (middle) and t-Y5Ga3 (bottom): (left) distribution of ELI-D in the selected planes, the position of the selected attractor is marked by arrows; (middle) shapes of the ELI-D basins for the selected attractors; (right) positions of the selected basins within the atomic QTAIM basins which contribute to the selected interaction.
Crystals 08 00099 g005
Table 1. Crystallographic and quantum chemical information for the yttrium gallides.
CompoundStructure TypeSpace GroupUnit Cell DimensionsAtomic CoordinatesVAtom, Å3QAtomCharge Transfer per Ga Atom, eReference for Crystallo-Graphic Data
a, Åb, Åc, Åβ, degVUnit Cell, Å3Atomxyz
GaGaCmca4.5237.6614.524 156.76Ga00.15490.081019.600019
YGa6PuGa6P4/nbm5.947 7.549 225.87Y¼¾017.84+1.600.2720
Ga1¼¼0.161018.75−0.08
Ga20.43591 − x0348019.53−0.36
YGa2AlB2P6/mmm4.211 4.112 63.15Y00017.70+1.540.7721
Ga½22.83−0.77
Y3Ga5Tm3Ga5Pnma11.4509.6746.098 675.46Y10.35210.00920.109918.49+1.310.7422
Y20.0736¼0.152418.93+1.06
Ga10.09090.55270.124422.22−0.76
Ga20.0052¼0.628023.23−0.74
Ga30.2520¼0.825022.91−0.70
Ga40.2980¼0.397022.94−0.72
YGaα-ITlCmcm4.30210.8604.073 190.29Y00.138¼20.61+1.151.1523
Ga00.417¼26.91-1.15
Y3Ga2Gd3Ga2I4/mcm11.620 14.860 2006.46Y10.06660.20290.135620.78+1.161.6524
Y20.1688x + ½025.02+0.74
Y30½0.151020.14+1.22
Ga10.1777x + ½0.201329.18−1.48
Ga20.6160x − ½031.06−2.13
Ga300035.46−1.47
Ga400¼30.22−1.58
t-Y5Ga3Ba5Si3P4/ncc7.6474 14.147 827.36Y10½0.260319.39+1.301.5925
Y20.17230.16210.102723.61+0.87
Ga100.50.99434.94−1.88
Ga20.3768x¼29.03−1.45
m-Y5Ga3Y5Ga3C2/m8.63514.8946.51091.19837.07Y10.730000.22625.77+0.791.6026
Y200.1800019.03+1.48
Y300.151½20.24+1.03
Y40.3780.1230.26425.49+0.71
Ga10.11000.19831.16−1.51
Ga20.2120.3010.29331.03−1.65
h-Y5Ga3Mn5Si3P63/mcm8.576 6.479 412.67Y10.2360¼20.67+1.011.6627
Y2023.19+0.98
Ga0.59910¼31.41−1.66
YMgP63/mmc3.6482 5.7318 66.08Y¼33.040 28

