Crystal Structures and Optical Properties of Two Novel 1,3,5-Trisubstituted Pyrazoline Derivatives

1
School of Chemistry & Chemical Engineering, Yangzhou University, Yangzhou 225002, China
2
School of Chemistry and Chemical Engineering, Southeast University, Nanjing 211189, China
*
Author to whom correspondence should be addressed.
Crystals 2018, 8(12), 467; https://doi.org/10.3390/cryst8120467
Submission received: 18 November 2018
/
Revised: 8 December 2018
/
Accepted: 11 December 2018
/
Published: 13 December 2018
(This article belongs to the Section Crystalline Materials)
Abstract
:Two novel 1,3,5-trisubstituted pyrazoline derivatives—1-acetyl-3-(4-methoxyphenyl)-5-(6-methoxy-2-naphthyl)-pyrazoline (2a) and 1-(4-nitrophenyl)-3-(4-methoxyphenyl)-5-(6-methoxy-2-naphtyl)-pyrazoline (2b)—were synthesized and their structures were determined by single crystal X-ray crystallography. Both of the two crystals exhibit twisted structures due to the large dihedral angles between the pyrazolinyl ring and the aromatic ring at the 5-position (88.09° for 2a and 71.26° for 2b). The optical–physical properties of the two compounds were investigated. The fluorescent emission of 2b arises from the 1,3-disubstituted pyrazoline chromophores and exhibits a red shift in polar solvents and solid-state, which could be attributed to photo-induced intramolecular charge transfer (ICT) from N1 to C3 in the pyrazoline moiety and the intermolecular interactions within the crystal. The fluorescent emissions of 2a (λmax 358–364 nm) in solvents and solid-state both come from 6-methoxy-2-naphthyl chromophores, which are fairly insensitive to the solvent polarity.
1. Introduction
A development in the design and preparation of novel organic luminescent materials has recently been the subject of great interest from both academia and industry, including the fields of fluorescent biological labels, optical sensors, and organic light-emitting diodes (OLEDs) [1,2,3,4]. Amongst the numerous organic luminescent materials, pyrazoline and its derivatives have received increasing attention due to their excellent electro–optical properties and wide range of applications [5,6,7,8,9,10]. In the past decades, although extensive research has focused on the photophysical properties of 1,3,5-triaryl-substituted pyrazolines [11,12], 1-acetyl-pyrazoline derivatives have also attracted a lot of attention because they have many unique advantages [13]. For example, a large number of 1-acetyl-pyrazoline derivatives show high sensitivity and selectivity towards different metal ions and can be used as fluorescent sensors [14]. However, relevant research about the photophysical properties of 1-acetyl-pyrazoline derivatives, especially in solid-state, is rare.
In this work, two novel 1,3,5-trisubstituted pyrazoline derivatives: 1-acetyl-3-(4-methoxyphenyl)-5-(6-methoxy-2-naphthyl)-pyrazoline (2a) and 1-(4-nitrophenyl)-3-(4-methoxyphenyl)-5-(6-methoxy-2-naphtyl)-pyrazoline (2b) were synthesized and their structures were confirmed by X-ray crystallographic analyses. The two compounds contain the same substituent groups on 3- and 5-positions, but different electron-withdrawing groups on 1-position. According to previous reports, the substituent groups on 1-position of the pyrazoline ring could primarily influence the photophysical properties [15]. Thus, the different optical-physical properties of the two compounds in solvents and solid-state were investigated and discussed. Moreover, from the view of crystallography, the introduction of the hydrogen bond acceptors, such as methoxyl and carbonyl groups, could cause the formation of hydrogen bonds, which may primarily affect their 3D crystal structures. Therefore, Hirshfeld surface analysis was also performed to give insight regarding intermolecular interactions in the two crystals.
2. Materials and Methods
2.1. Synthesis
The pyrazoline derivatives were synthesized by the following reactions (Scheme 1). Chalcones (1a and 1b) were synthesized by condensing 1-(4-methoxyphenyl)ethanone with aryl aldehyde in a dilute ethanolic sodium hydroxide solution at room temperature, according to the Claisen-Schmidt condensation given in the literature [16,17].
2.1.1. Synthesis of 2a
A mixture of chalcone 1a (1.2466 g) and hydrazine hydrate (85%, 2 mL) in glacial acetic acid (6 mL) was refluxed at 110 °C for 4 h. The reaction mixture was then poured into ice water. The crude product was filtered and recrystallized from ethyl acetate/petroleum ether (v/v = 2:1) to afford compound 2a in 91% yield as white crystals, m.p. 116–118 °C. 1H Nuclear Magnetic Resonance (NMR) (300 MHz, CDCl3, Figure S1) δ ppm: 2.43 (s, 3H), 3.16–3.23 (dd, 1H), 3.70–3.81 (m, 1H), 3.84–3.89 (d, 6H), 5.68–5.72 (dd, 1H), 6.92–7.71 (m, 10H). IR (KBr, cm−1, Figure S2): 3450, 2946, 2302, 1653, 1606, 1516, 1444, 1409, 1248, 1176, 1030, 852, 626, 559.
2.1.2. Synthesis of 2b
A mixture of chalcone 1b (0.9978 g), 4-nitrophenylhydrazine (0.5401 g), and HCl (37%, 1 mL) in ethanol (10 mL) was refluxed for 8 h. The precipitate was filtered from the cool reaction solution and further recrystallized from ethyl acetate and petroleum ether (v/v = 3:1) to afford compound 2b in 83% yield as yellow crystals, m.p. 214–216 °C. 1H NMR (300 MHz, CDCl3, Figure S3) δ ppm: 3.24–3.32 (dd, 1H), 3.85–3.90 (m, 6H), 3.95–4.00 (m, 1H), 5.48–5.54 (dd, 1H), 6.93–8.04 (m, 14H). IR (KBr, cm−1, Figure S4): 3444, 1593, 1494, 1400, 1305, 1250, 1172, 1109, 1026, 839, 680.
2.2. Crystals’ Preparation
The single crystals of the two compounds were recrystallized in ethanol. Slow evaporation of the solvents at room temperature for 4–5 days yielded colorless (2a) and yellow (2b) prism crystals.
2.3. Measurement
The 1H NMR spectra were recorded at 297 K on a Bruker Avance 300 MHz NMR spectrometer (Bruker, Billerica, MA, USA) using CDCl3 as solvent and Tetramethyl silane (TMS) as internal standard. The IR spectra were measured on a Bruker Tensor 27 FT-IR spectrometer (Bruker, Billerica, MA, USA) with KBr pellets in the range 4000–400 cm−1. UV-Vis absorption spectra were recorded on a Shimadzu UV-2450 spectrometer (Shimadzu, Kyoto, Japan) operating between 190 and 900 nm. Fluorescence spectra were obtained with a Horiba FluoroMax 4 spectrofluorometer (HORIBA Scientific, Kyoto, Japan).
Single X-ray diffraction data for the two crystals were collected on a Rigaku SCXmini diffractometer (Rigaku, Tokyo, Japan) with a Mercury2 CCD area-detector by using graphite-monochromatized Mo-Kα radiation (λ = 0.71073 Å). The structures were solved with direct methods using the SHELXS-97 program (University of Göttingen, Göttingen, Germany, 1997) and refined anisotropically with SHELXTL-97 using full-matrix least-squares procedure [18]. All non-hydrogen atoms were refined with anisotropic displacement parameters and were placed in idealized positions. The structural data for three crystals have been deposited as CIFs at the Cambridge Crystallographic Data Base (CCDC No. 911423 and 911424) and are also available as Supporting Information (SI). Powder X-ray diffraction (PXRD) patterns were measured with a Bruker D8 advance superspeed powder diffractometer, which operated at ambient temperature, using Cu Kα radiation (λ = 0.15405 nm).
2.4. Hirshfeld Surface Analysis
Hirshfeld surface analysis was performed by using Crystal Explorer 3.1(University of Western Australia: Perth, Australia, 2012) [19].
3. Results
3.1. Crystal Structure
Single crystal X-ray diffraction analyses were performed for the two crystals to determine their structures. A summary of the crystallographic data are shown in Table 1, and selected bond distance and angle are shown in Table 2. From the thermal ellipsoid plots (Figure 1), each asymmetric unit (ASU) accommodates only one molecule, and both of them exhibited twisted structures with dihedral angles between the pyrazolinyl ring and the aromatic ring at the 5-position of 88.09° (2a) and 71.26° (2b), respectively. However, the other aromatic rings at 1- or 3-positions were almost coplanar with the pyrazoline rings, and the dihedral angles are 4.61° for 2a and 4.61° and 5.47° for 2b. In the two crystals, N1–N2 bond length was shorter than the typical N–N single bond (1.45 Å) and longer than the typical N=N bond (1.25 Å), and the N2=C3 bond length was shorter than the typical N=C double bond (1.35 Å). These coplanar structures and the shorter bond lengths suggested the formation of a conjugated π system in the two molecules, which were composed of N1, N2, C3 atoms in pyrazoline ring and the substituents at 1- and 3-positions.
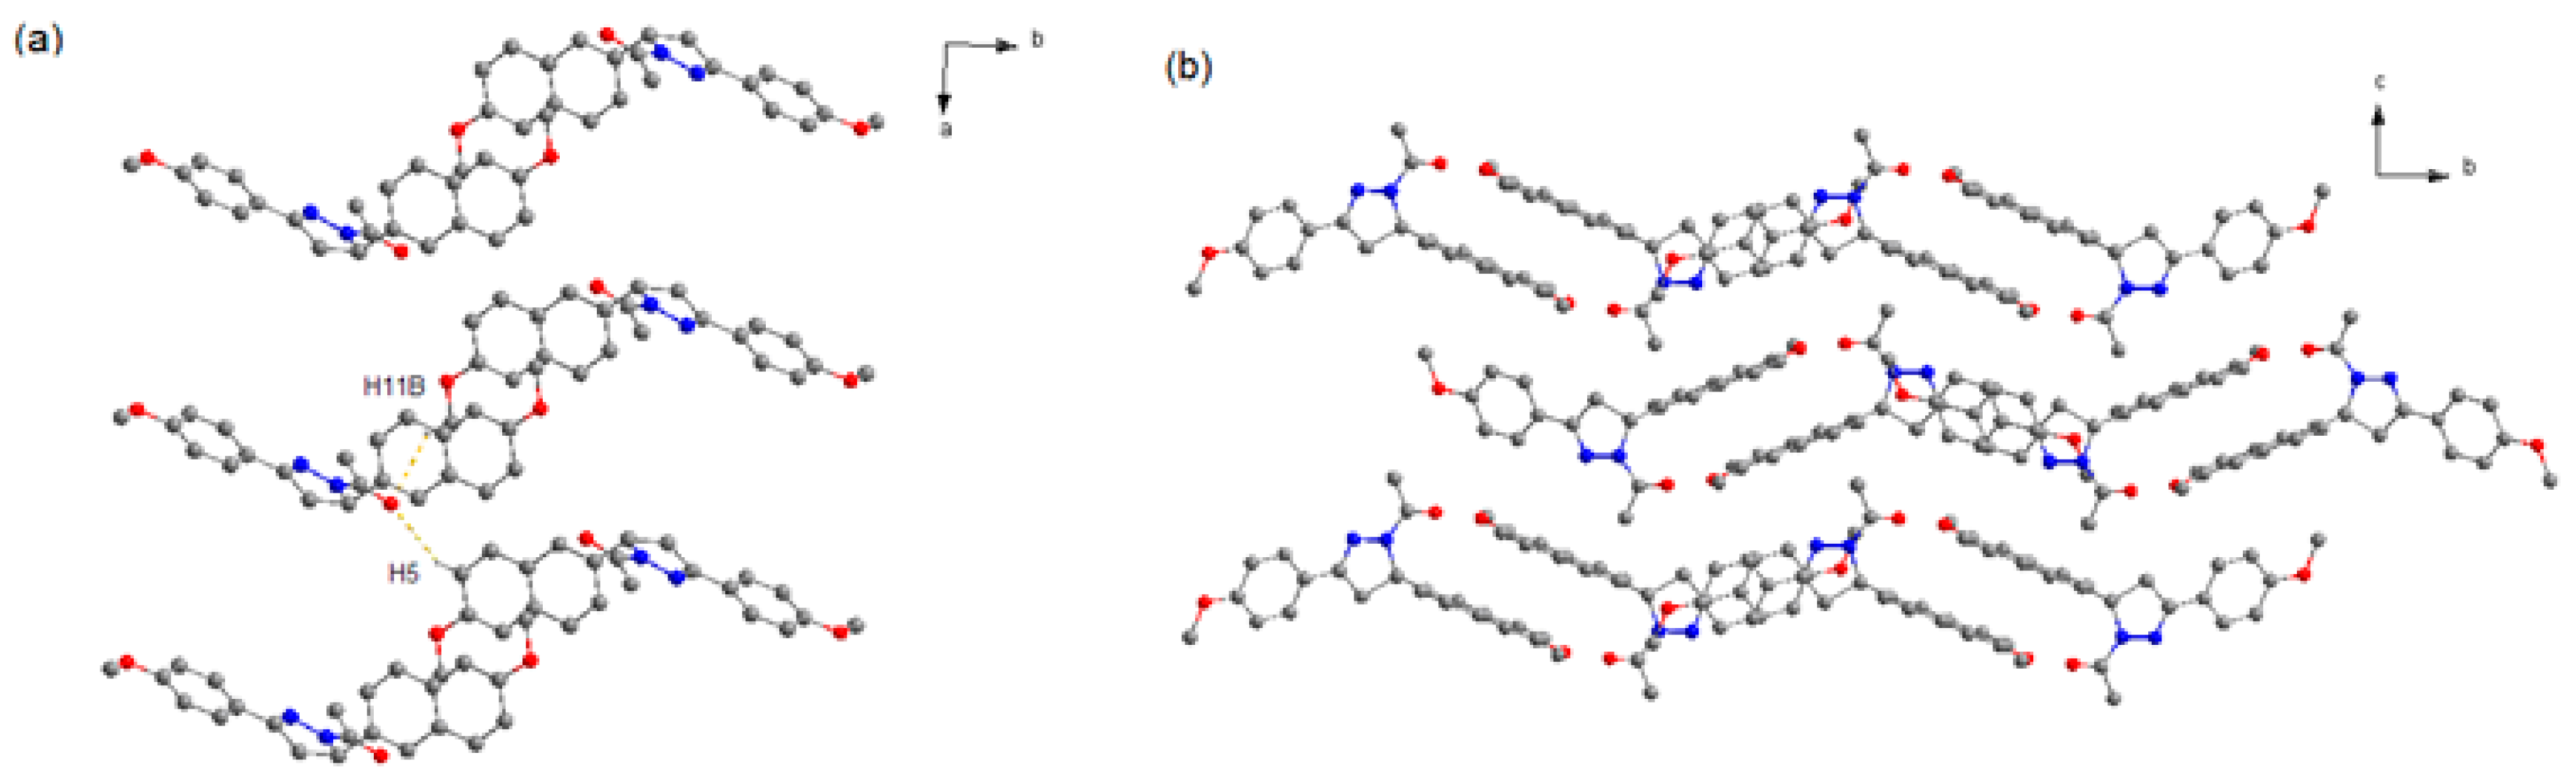
It can be seen that 2a crystallizes in space group P21/n. As shown in Figure 2, the two neighboring heterochiral molecules are connected via weak C–H···O hydrogen bonds (Table 3) to afford the racemic dimer. The dimers also associate through weak C–H···O hydrogen bonds along the a axis to form the racemic chain motifs, which are connected with each other to provide its 3D structure. Moreover, the closest centroid distance between adjacent naphthalene rings is 5.382 Å, indicating that there is no strong π-overlap between them.
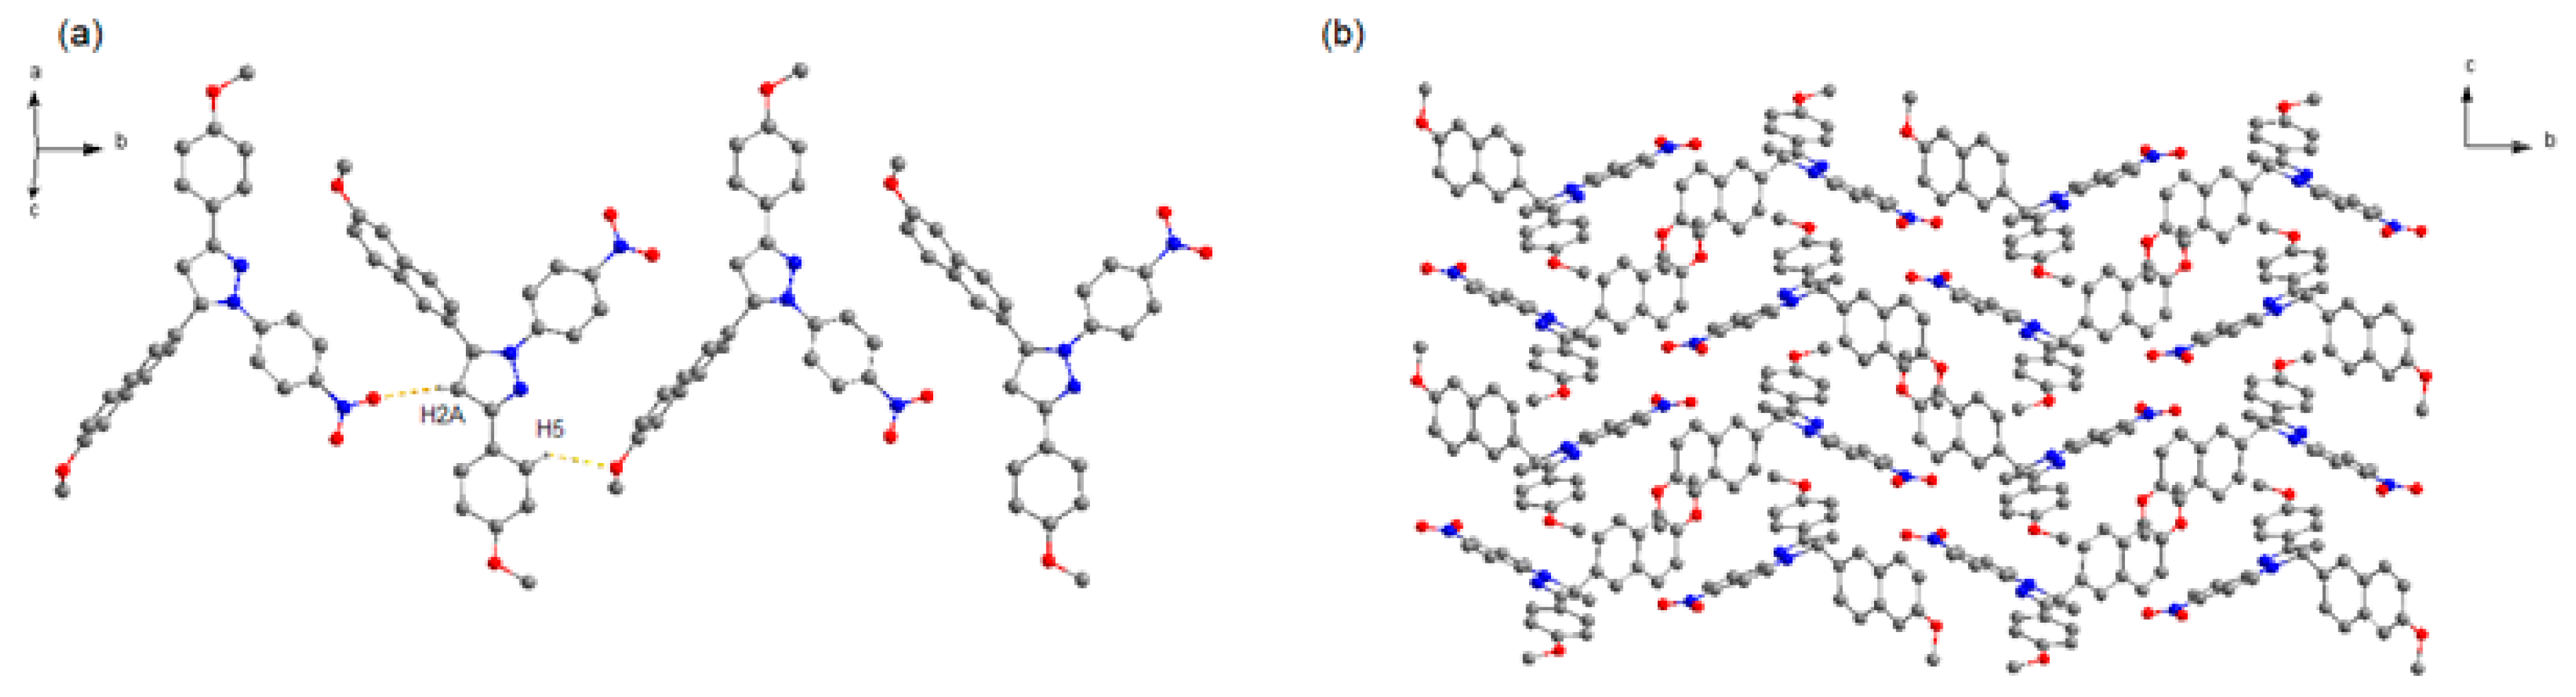
It can be seen that 2b crystallizes in space group P21/c. In this structure (Figure 3), the one-handed enantiomers associate along the b axis to construct two kinds of homochiral chain motifs. The two homochiral chains with mirror symmetry are stacked alternately along the c axis to form the 2D structure, which are stacked in a parallel fashion to give the 3D crystal structure. Like crystal 2a, no strong π–π interaction exists between adjacent naphthalene rings, due to the long distance of 5.469 Å between the two centroids.
3.2. Hirshfeld Surface Analyses
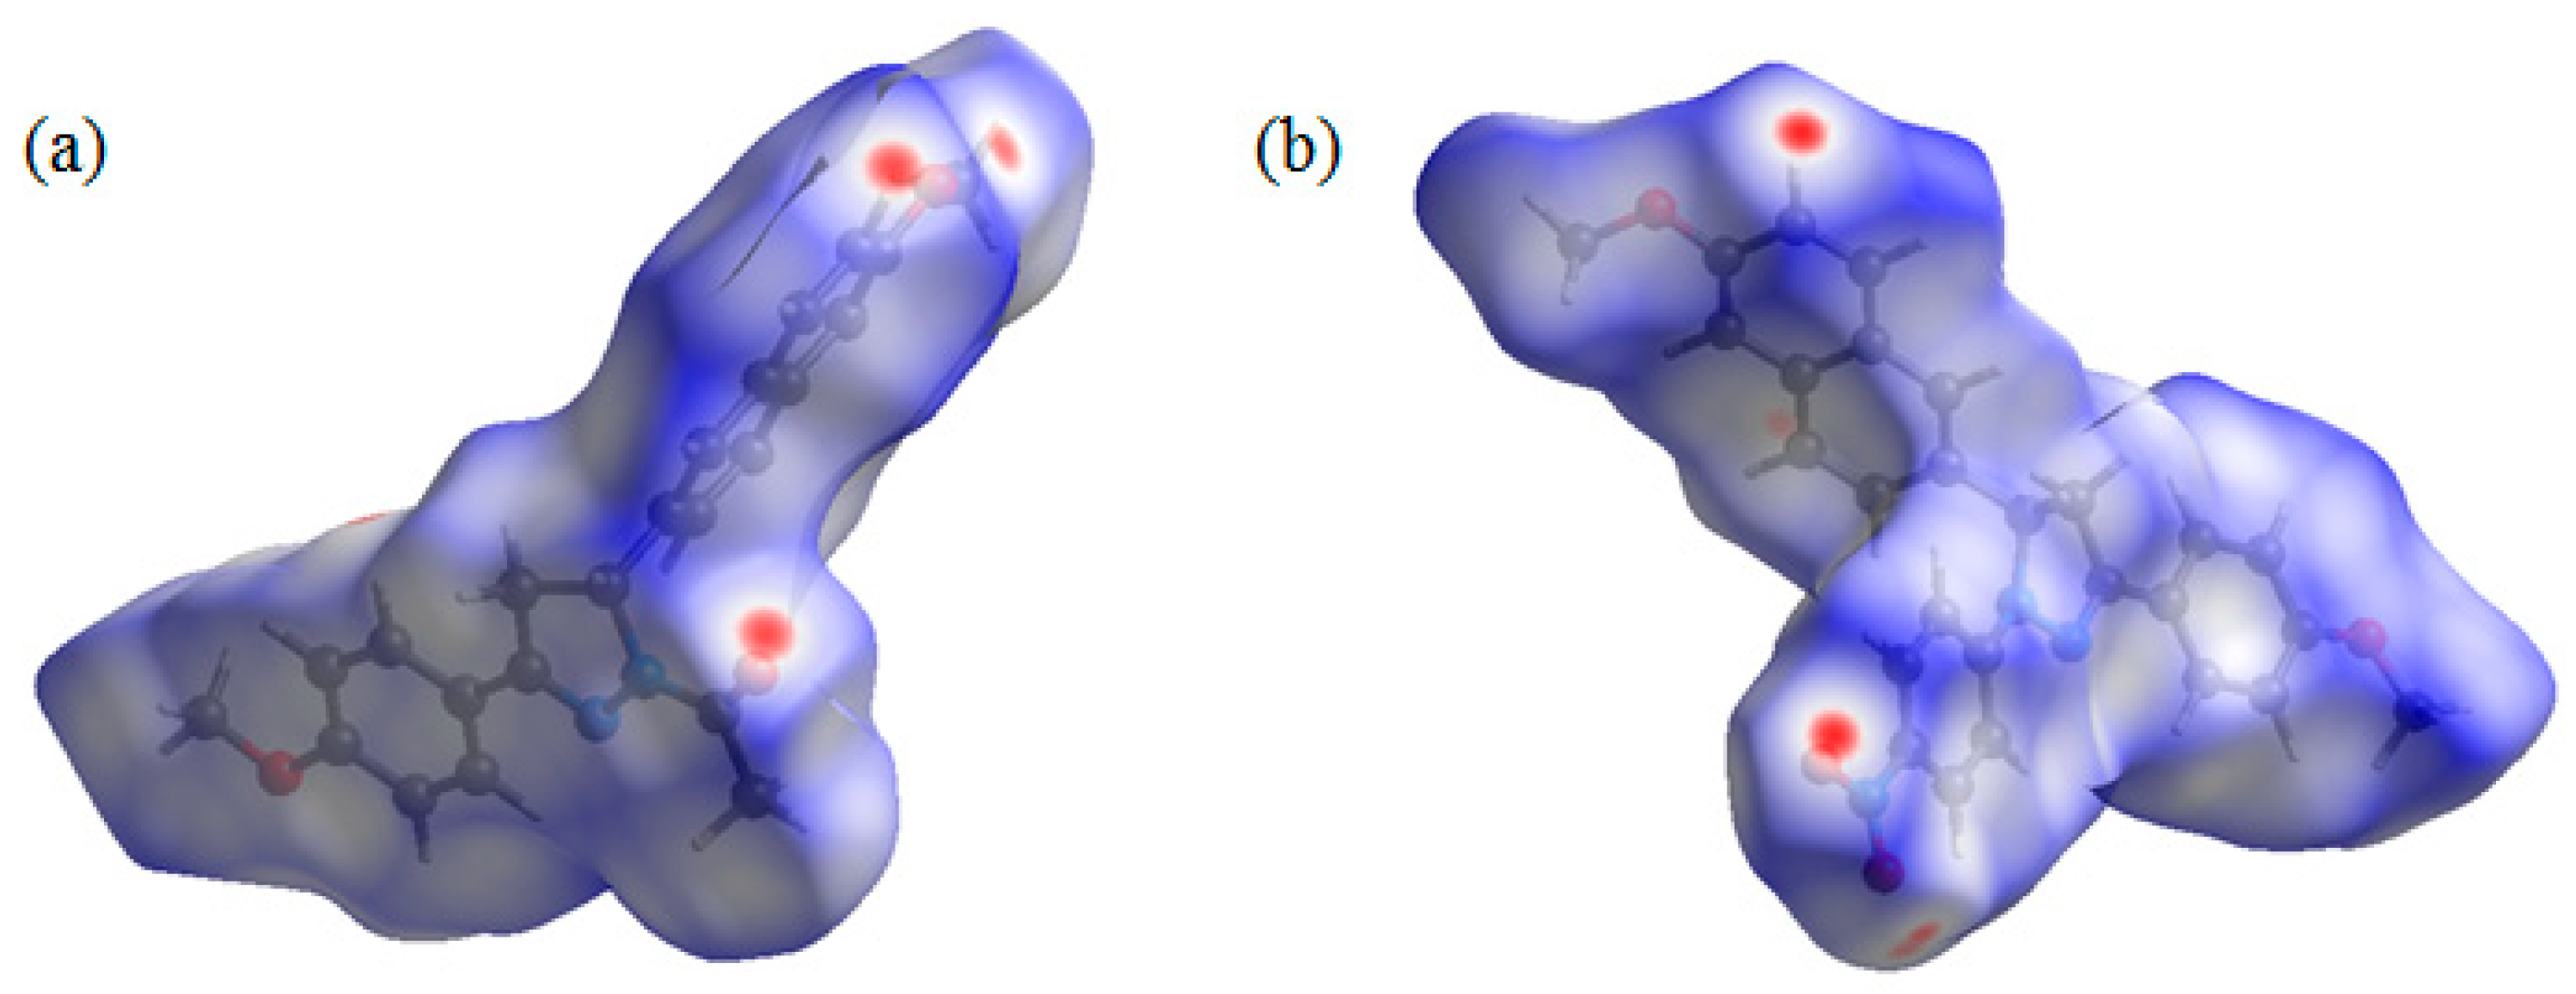
Both compounds 2a and 2b contain several hydrogen bond acceptors, such as methoxyl, carbonyl, and nitryl groups. Hirshfeld surface analysis was performed to give insight regarding the intermolecular interactions in the two crystals [20]. The inspection of the intermolecular interactions was normalized by van der Waals radii through a red-white-blue color scheme, where the red spots denote closer contacts. From the Hirshfeld surface (Figure 4), several red spots were obviously observed on oxygen atoms on carbonyl and two methoxyl groups of 2a and oxygen atoms on nitryl groups of 2b, corresponding to the weak C–H···O hydrogen bonds. Moreover, all the other red spots exist around H atoms, and most of them are also attributed to the weak C–H···O hydrogen bonds. That is to say, due to the introduction of the hydrogen bond acceptors, these weak hydrogen bonds play a key role in crystal packing for the two crystals.
A two-dimensional fingerprint plot over the Hirshfeld surface was used to highlight the contribution of the intermolecular interactions for crystal packing (Figure 5 and Table 4). It was found that weak H···H contacts made the major contribution in the two crystals, with 51.5% and 39.9% of total surface area, respectively. The C···H contacts were second largest contribution, comprising 25.5% and 31.5% of total surface area, respectively. Apart from that, O···H contacts caused by weak C–H···O hydrogen bonds also showed important contribution for the supramolecular architectures with 17.3% and 22.2% of total surface area, respectively, which appear as two wings in the left (H···O) and right (O···H) areas of the related plots (Figure S5).
3.3. Photo-Physical Properties
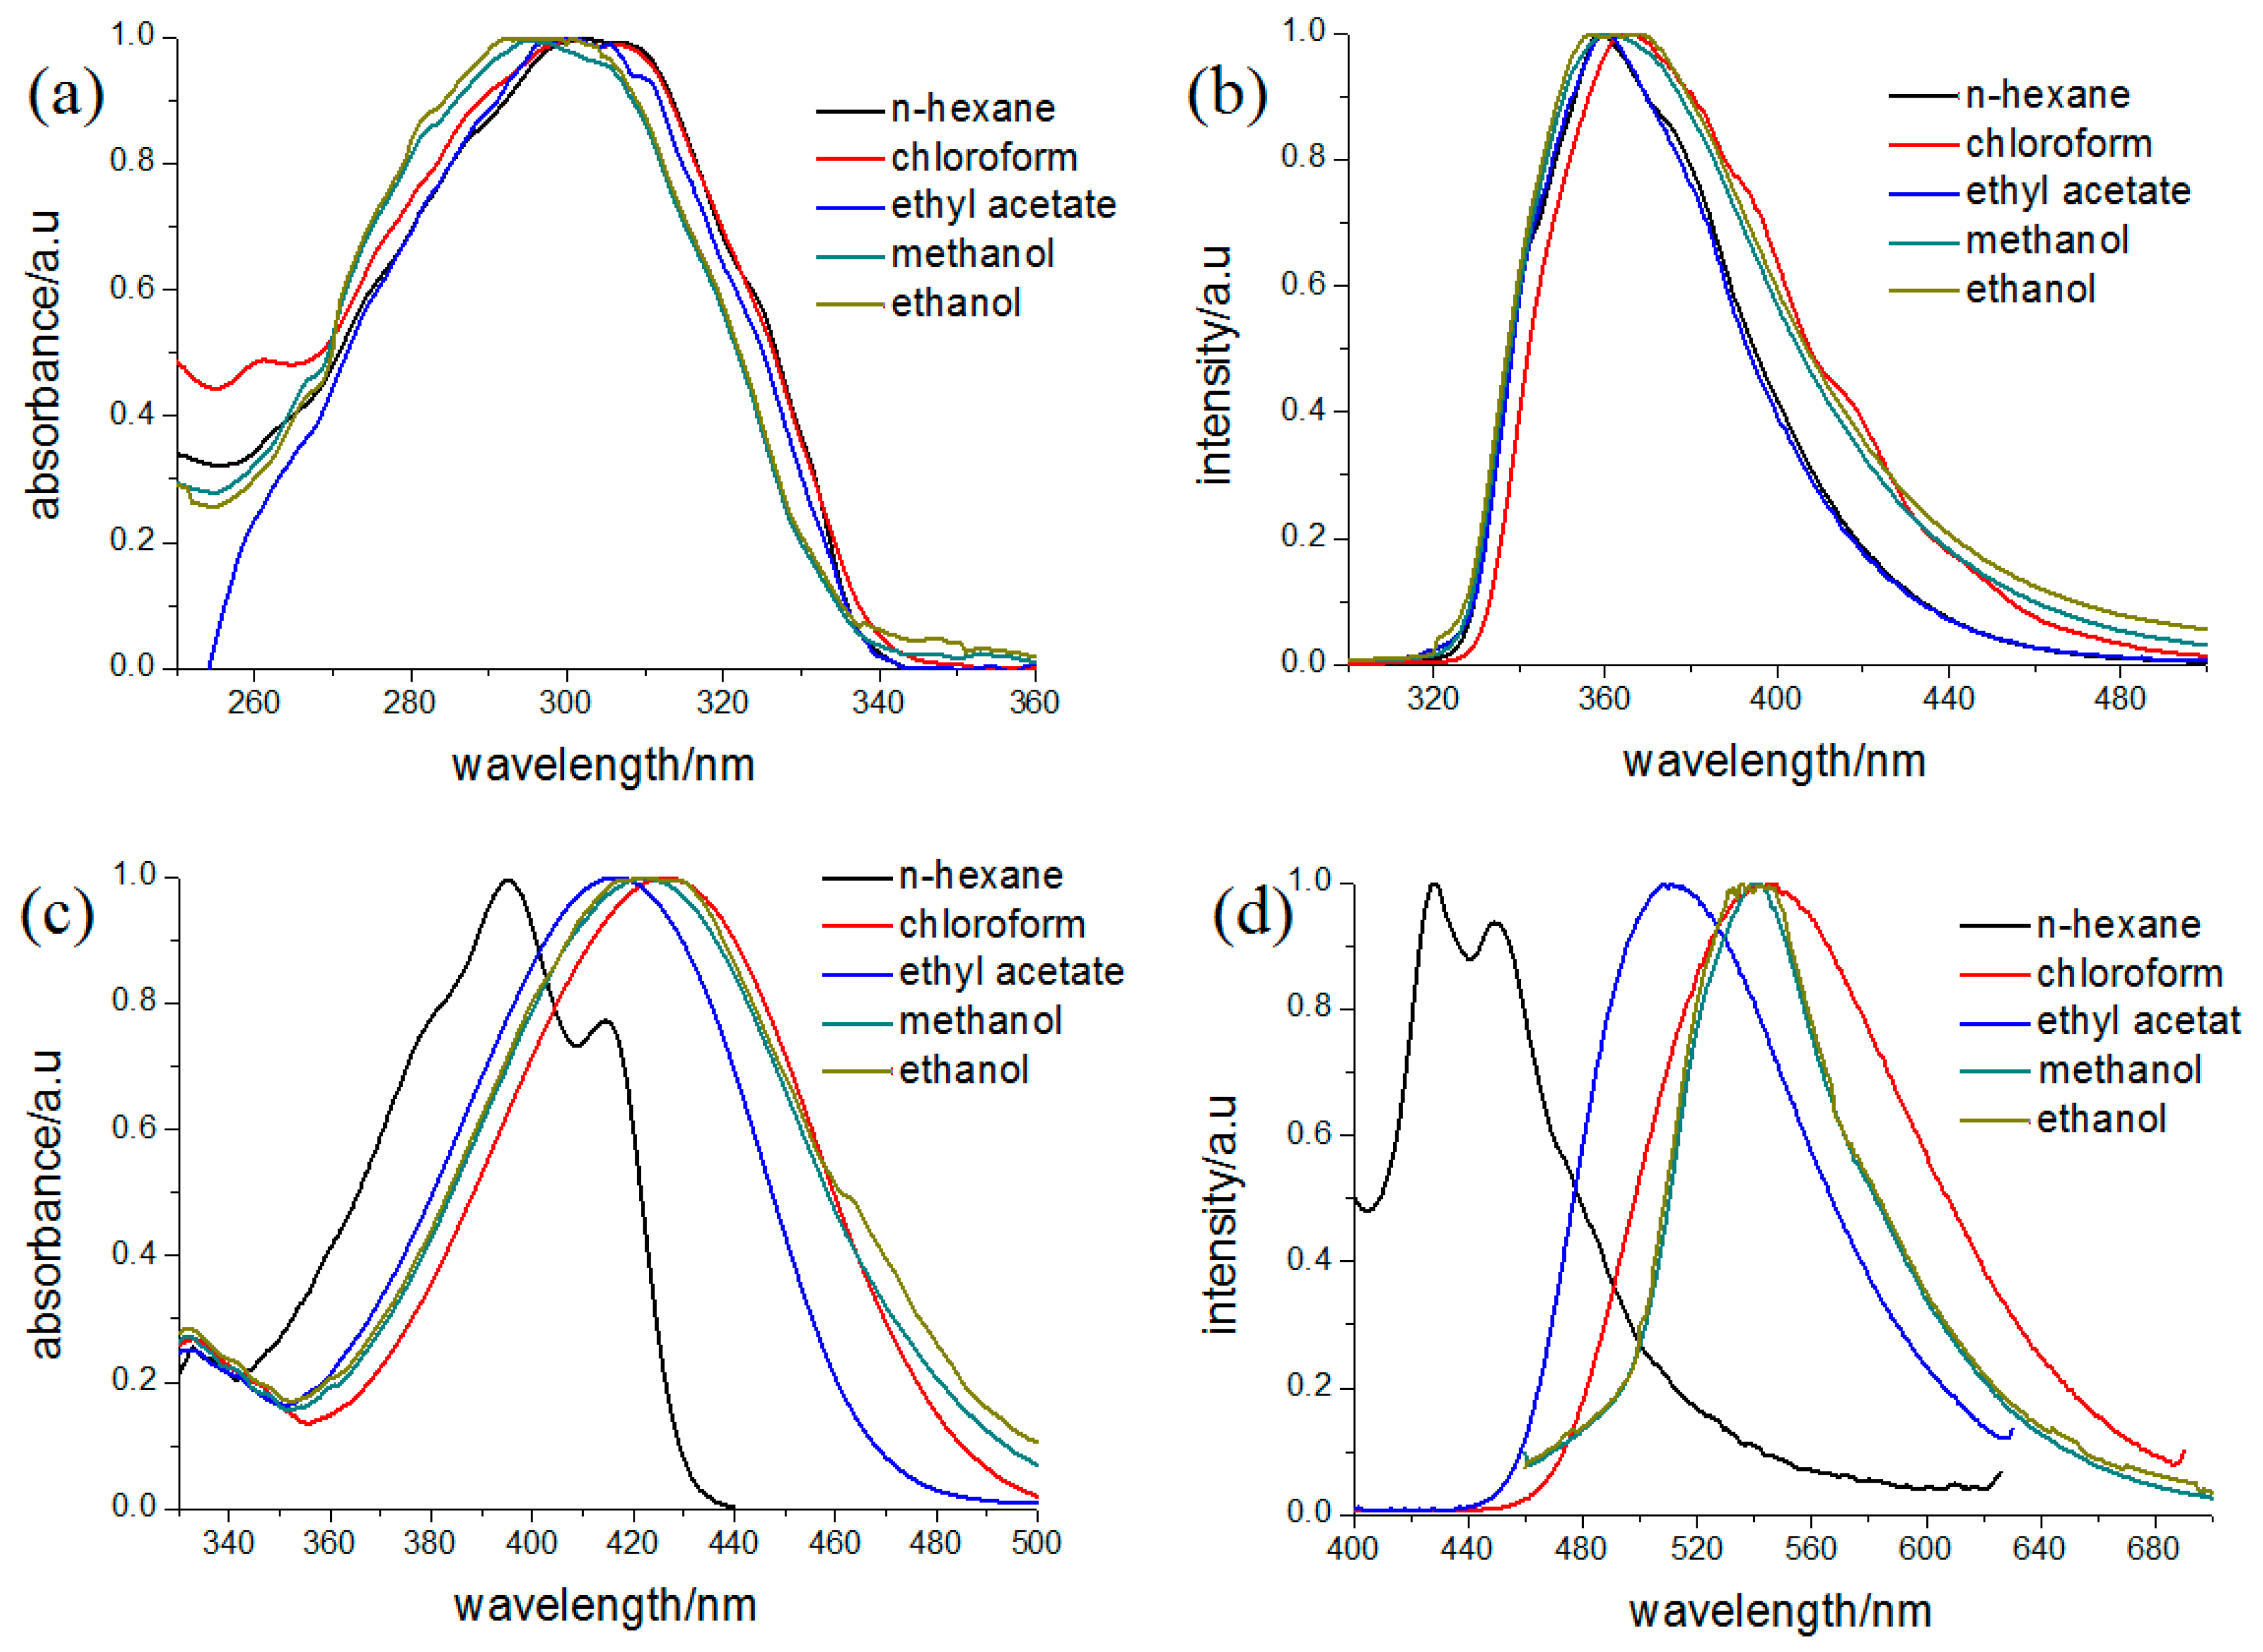
The absorption spectra of the two compounds in different solvents are shown in Figure 6. Because naphthalene exhibits several maximum peaks near 350 nm, the absorption of 2a was considered a combination of 1-acetyl-3-(4-methoxyphenyl)-pyrazolinyl and the 6-methoxy-2-naphthyl chromophores. In addition, it could be observed that the absorption spectra of 2a exhibit little change with increasing solvent polarity, indicating that there is no charge transfer in its ground state. Compound 2b exhibits two absorption bands around 400 nm in non-polar solvent n-hexane (Table 5), which should be ascribed to the π–π* transition of the 3-(4-methoxyphenyl)-1-(4-nitrophenyl)-2-pyrazoline chromophore. Compared with other 1,3,5-triphenyl-pyrazoline and 1,3-diphenyl-pyrazolines, the absorption band shifts to lower energy in the solvents of moderate polarity. The red shift may be attributed to the stronger electron-withdrawing group located in 1-position in 2b, which causes an intramolecular charge transfer (CT) character for the transition.
Corresponding to the absorption spectra, the fluorescent spectra of 2b also exhibits a large red shift in the polar solvents. When the solvent is changed from n-hexane to methanol, the red shift in their emission bands is nearly 110 nm. The red shift could be attributed to an intramolecular charge transfer (ICT) state formed by intramolecular electron transfer in the 3-(4-methoxyphenyl)-1-(4-nitrophenyl)-2-pyrazoline chromophore, which is effectively stabilized in polar media such as methanol and causes an increase of Stokes’ shift. These characters are similar with 5-(9-anthryl)-3-(4-nitrophenyl)-1-phenyl-2-pyrazoline (ANPP) [21,22]. Although the nitro group exists on 3-position, it emitted a large red shift of about 110 nm in the polar solvents, which is also caused by charge transfer from N1 to C3 in the pyrazoline moiety in the excited state. In contrast, 2a exhibited only one band with fluorescence maxima centered at 358 nm in the n-hexane and no obvious change could be found with increasing the polarity of solvents. It was considered that the fluorescence of 2a arises from the 6-methoxy-2-naphthyl, and the fluorescence of pyrazoline is quenched due to the enhanced intersystem crossing from the pyrazoline excited state [23]. Similar circumstances could be found in 1-acetyl-3-naphthyl-5-(9-anthryl)-2-pyrazoline (APPP), where the emission band is assigned to anthracene chromophore and is fairly insensitive to the solvent polarity [24], suggesting the same optical–physical process for these 1-acetyl-pyrazolines.
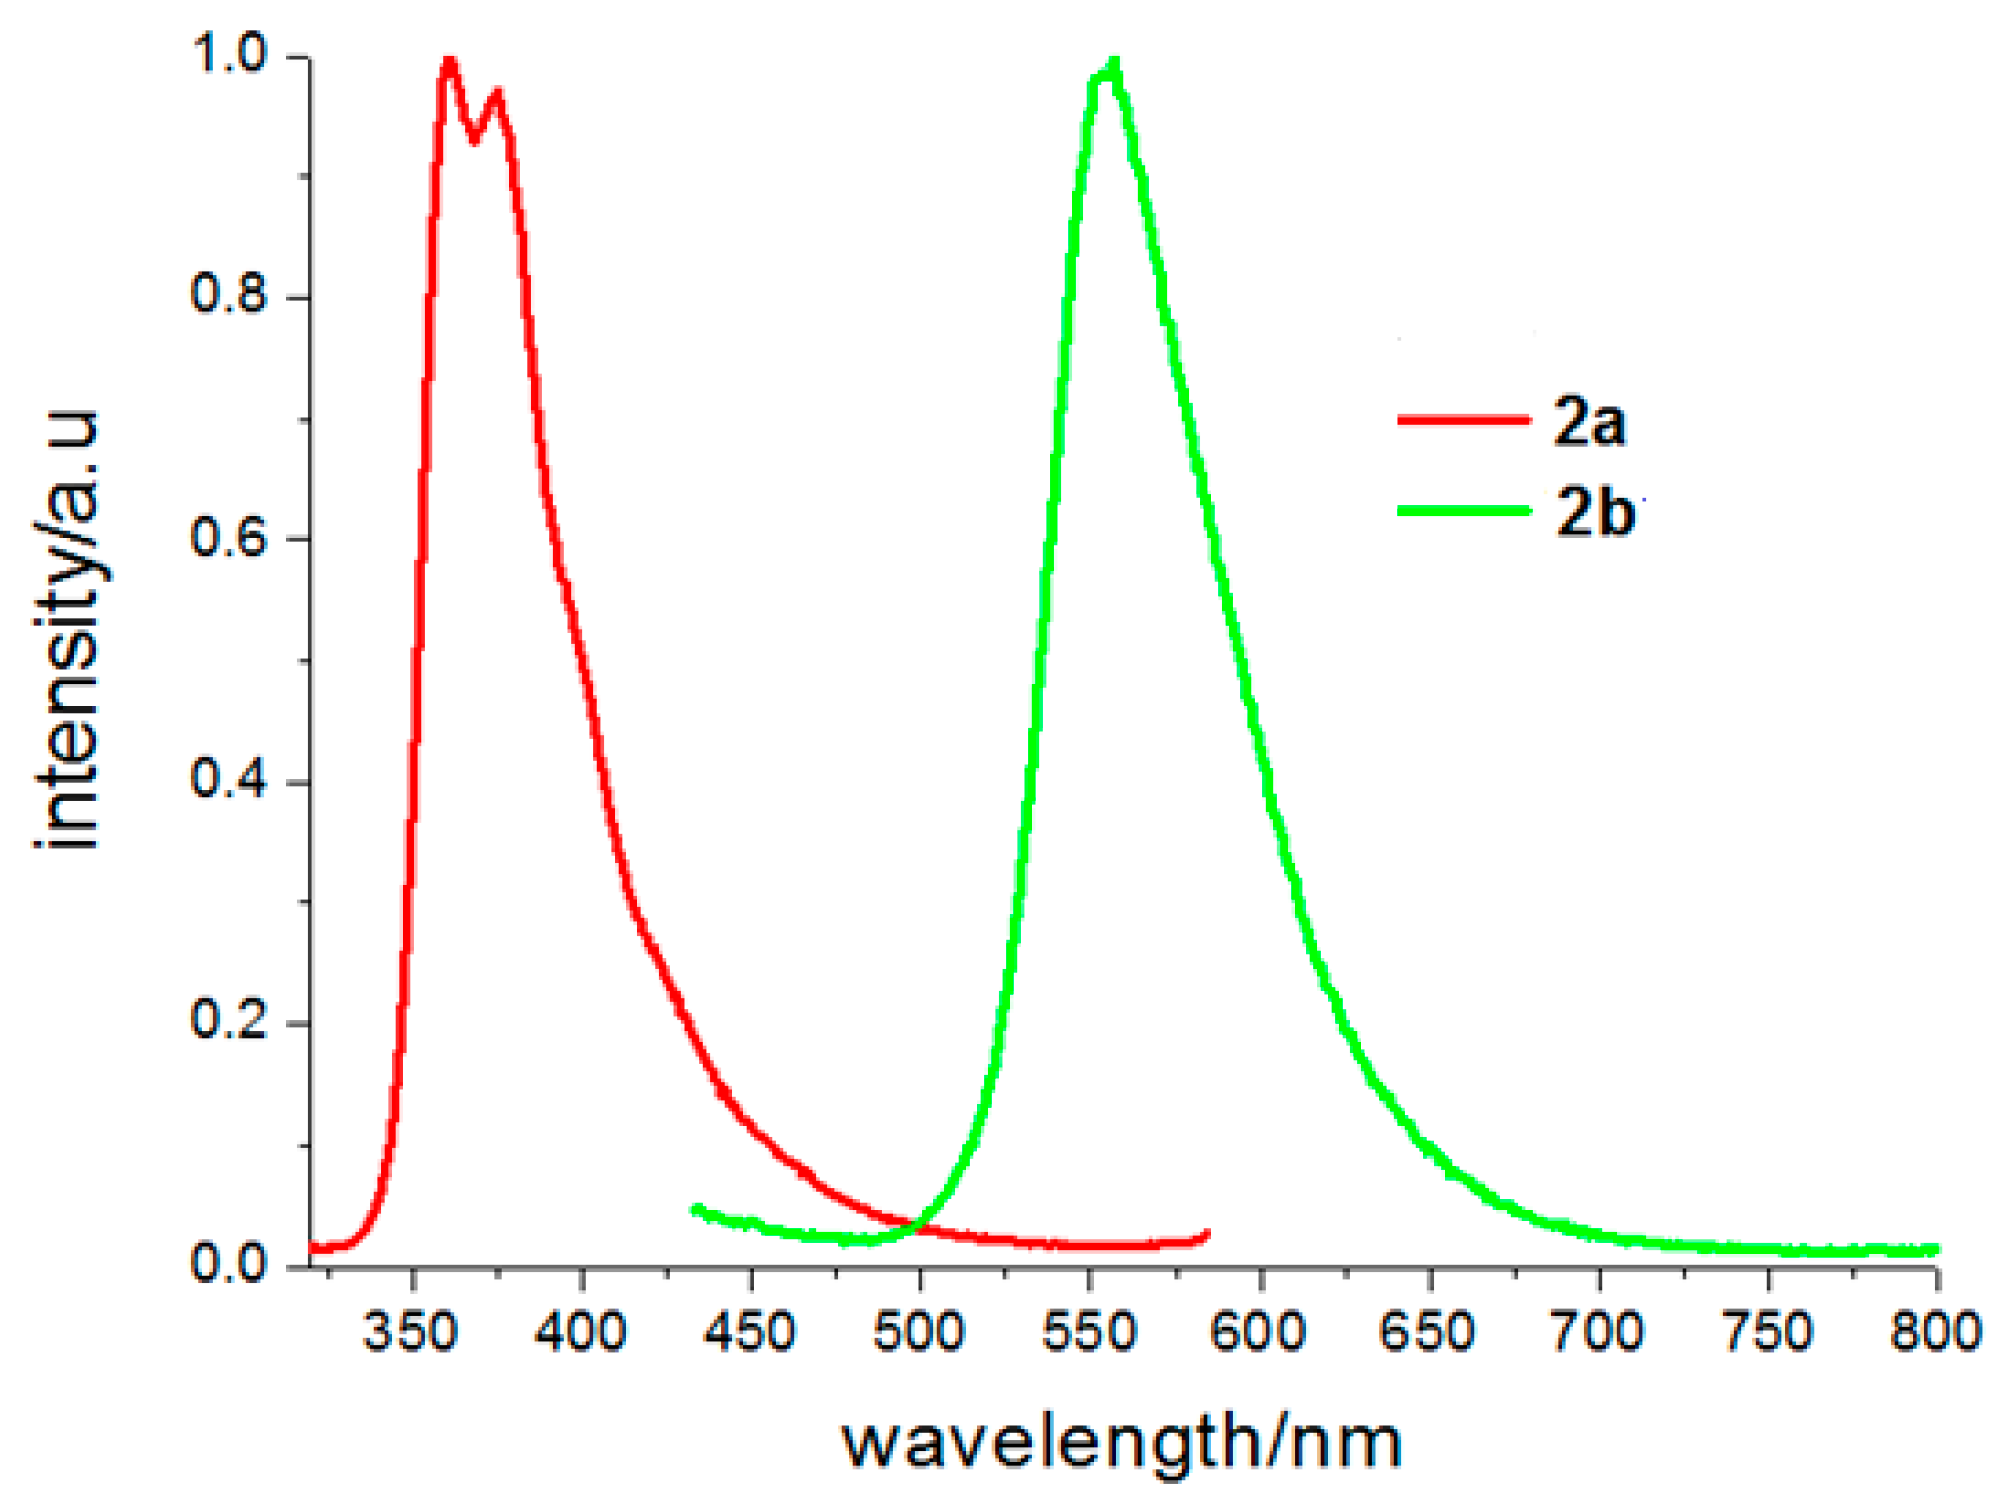
Solid fluorescence spectra of the two crystals are shown in Figure 7. The fluorescence spectrum of 2a is similar with that of ethanol, which exhibits two emission peaks at 360 and 374 nm. According to its crystal structure, no strong π–π interaction existed between naphthalene rings, so it was considered that the fluorescent emission of 2a should be attributed to monomer fluorescence of 6-methoxy-2-naphthyl chromophore. Emission peaks of 2b are centered at 556 nm. Compared to its emission in the ethanol solvent, it had a red shift of 23 nm in solid state. In solid-state, the molecules are closer to each other, which result in enhancement of dipole-dipole interaction of the polarized excited-state and a larger red shift in its fluorescence spectrum.
4. Conclusions
In summary, two novel 1,3,5-trisubstituted pyrazoline derivatives were synthesized and their structures were confirmed by IR, 1H NMR and X-ray crystallographic analysis. It was found that the aromatic rings at 5-position are almost perpendicular with pyrazoline rings, while the aromatic rings at 1- and 3-position pyrazoline rings are nearly coplanar to form the conjugated π-system. According to Hirshfeld Surface analysis, due to the introduction of hydrogen bond acceptors, the weak C–H···O hydrogen bonds play a key role in crystal packing for the two crystals. Fluorescence measurement revealed the primary influence of the substituent groups on 1-position of pyrazoline ring. For 2b, the emission arises from the 1,3-disubstituted pyrazoline chromophores and the mechanism involves photo-induced intramolecular charge transfer (ICT) from N1 to C3 in the pyrazoline moiety. The fluorescent emission of 2a comes from the 6-methoxy-2-naphthyl chromophore, which shows little change when increasing the polarity of solvents.
Supplementary Materials
The following are available online at https://www.mdpi.com/2073-4352/8/12/467/s1, X-ray crystallographic information files (CIF) for the two crystals.
Author Contributions
Q.F. designed the experiments and wrote and revised the manuscript. W.H. and J.W. performed the X-ray single diffraction study and Hirshfeld surface analyses. J.L. performed 1H NMR and IR spectra spectroscopy. Y.S. synthesized the compounds and crystals. G.D. conceived the project.
Funding
This work is partly supported by the National Natural Science Foundation of China (Grant No. 21773203), Certificate of China Postdoctoral Science Foundation Grant (No. 2018M632387), the Natural Science Foundation of the Jiangsu Higher Education Institutions of China (No. 18KJB150035), and Innovation and Cultivation Fund of Yangzhou University (No. 2017CXJ012).
Conflicts of Interest
The authors declare no conflict of interest.
References
- Lustig, W.P.; Mukherjee, S.; Rudd, N.D.; Desai, A.V.; Li, J.; Ghosh, S.K. Metal-organic frameworks: Functional luminescent and photonic materials for sensing applications. Chem. Soc. Rev. 2017, 46, 3242–3285. [Google Scholar] [CrossRef]
- Gong, X.Q.; Cai, J.; Zhang, B.; Zhao, Q.; Piao, J.F.; Peng, W.P.; Gao, W.C.; Zhou, D.M.; Zhao, M.; Chang, J. A review of fluorescent signal-based lateral flow immunochromatographic strips. J. Mater. Chem. B 2017, 5, 5079–5091. [Google Scholar] [CrossRef]
- Wu, A.L.; Sun, P.P.; Sun, N.; Yu, Y.; Zheng, L.Q. Coassembly of a Polyoxometalate and a Zwitterionic Amphiphile into a Luminescent Hydrogel with Excellent Stimuli Responsiveness. Chem.-Eur. J. 2018, 24, 16857–16864. [Google Scholar] [CrossRef] [PubMed]
- Bui, T.T.; Goubard, F.; Ibrahim-Ouali, M.; Gigmes, D.; Dumur, F. Recent advances on organic blue thermally activated delayed fluorescence (TADF) emitters for organic light-emitting diodes (OLEDs). Beilstein. J. Org. Chem. 2018, 14, 282–308. [Google Scholar] [CrossRef] [PubMed] [Green Version]
- Zhang, L.; Liu, J.; Gao, J.K.; Zhang, F.; Ding, L. High Solid Fluorescence of a Pyrazoline Derivative through Hydrogen Bonding. Molecules 2017, 22, 1304. [Google Scholar] [CrossRef] [PubMed]
- Varghese, B.; Al-Busafi, S.N.; Suliman, F.O.; Al-Kindy, S.M.Z. Unveiling a versatile heterocycle: Pyrazoline a review. RSC Adv. 2017, 7, 46999–47016. [Google Scholar] [CrossRef]
- Haupa, K.A.; Szukalski, A.; Mysliwiec, J. Low-Molecular Push Pull Pyrazoline Derivatives: Solvatochromic Effect and Theoretical Insights into Dye-based Molecular Engineering. J. Chem. Phys. 2018, 122, 7808–7818. [Google Scholar] [CrossRef] [PubMed]
- Vandana, T.; Ramkumar, V.; Kannan, P. Synthesis and fluorescent properties of poly(arylpyrazoline)’s for organic-electronics. Opt. Mater. 2016, 58, 514–523. [Google Scholar] [CrossRef]
- Zhang, R.-R.; Zhang, J.-F.; Wang, S.-Q.; Cheng, Y.-L.; Miao, J.-Y.; Zhao, B.-X. Novel pyrazoline-based fluorescent probe for detecting thiols and its application in cells. Spectrochim. Acta. A 2015, 137, 450–455. [Google Scholar] [CrossRef]
- Singh, P.; Rawat, B.; Rawat, B.S.; Pant, G.J.N.; Rawat, M.S.M.; Joshi, G.C. Synthesis, centrifugal chromatographic separation and fluorescence study of a 2-pyrazoline. J. Indian Chem. Soc. 2014, 91. [Google Scholar]
- Jin, M.; Liang, Y.J.; Lu, R.; Chuai, X.H.; Yi, Z.H.; Zhao, Y.Y.; Hong, J.Z. Synthesis and properties of photoluminescence and electroluminescence of pyrazoline derivatives. Synth. Met. 2004, 140, 37–41. [Google Scholar] [CrossRef]
- Bai, G.; Li, J.F.; Li, D.X.; Dong, C.; Han, X.Y.; Lin, P.H. Synthesis and spectrum characteristic of four new organic fluorescent dyes of pyrazoline compounds. Dyes Pigment. 2007, 75, 93–98. [Google Scholar] [CrossRef]
- Maslakci, N.N.; Eren, E.; Topel, S.D.; Cin, G.T.; Oksuz, A.U. Electrospun plasma-modified chitosan/poly(ethylene terephthalate)/ferrocenyl-substituted N-acetyl-2-pyrazoline fibers for phosphate anion sensing. J. Appl. Polym. Sci. 2016, 133, 43344. [Google Scholar] [CrossRef]
- Yang, A.B.; Xu, Z.X.; Wu, J.; Feng, Y.Y.; Wang, B.X. Synthesis of 1-Acetyl-3-(2-hydroxyl-4,6-dimethoxylphenyl)-5-phenyl-2-pyrazoline and Studies on Its Zinc Ion Probe. Chem. J. Chin. Univ. 2010, 31, 1365–1368. [Google Scholar]
- Fahrni, C.J.; Yang, L.C.; VanDerveer, D.G. Tuning the photoinduced electron-transfer thermodynamics in 1,3,5-triaryl-2-pyrazoline fluorophores: X-ray structures, photophysical characterization, computational analysis, and in vivo evaluation. J. Am. Chem. Soc. 2003, 125, 3799–3812. [Google Scholar] [CrossRef] [PubMed]
- Ohashi, K.; Kinoshita, Y.; Tamiaki, H. Synthesis of chlorophyll-a derivatives possessing the 3-(2-acylethenyl) group by cross-aldol condensation and their optical properties. Tetrahedron 2018, 74, 2703–2715. [Google Scholar] [CrossRef]
- Mellado, M.; Madrid, A.; Martinez, U.; Mella, J.; Salas, C.O.; Cuellar, M. Hansch’s analysis application to chalcone synthesis by Claisen-Schmidt reaction based in DFT methodology. Chem. Pap. 2018, 72, 703–709. [Google Scholar] [CrossRef]
- Sheldrick, G.M. A short history of SHELX. Acta Crystallogr. Sect. A Found. Crystallogr. 2008, 64, 112–122. [Google Scholar] [CrossRef]
- Wolff, S.K.; Grimwood, D.J.; McKinnon, J.J.; Jayatilaka, D.; Spackman, M.A. CrystalExplorer 3.1; The University of Western Australia: Perth, Australia, 2012. [Google Scholar]
- McKinnon, J.J.; Spackman, M.A.; Mitchell, A.S. Novel tools for visualizing and exploring intermolecular interactions in molecular crystals. Acta Crystallogr. Sect. B Struct. Sci. 2004, 60, 627–668. [Google Scholar] [CrossRef]
- Bozkurt, E.; Gul, H.I.; Mete, E. Solvent and substituent effect on the photophysical properties of pyrazoline derivatives: A spectroscopic study. J. Photoch. Photobio. A 2018, 72, 703–709. [Google Scholar] [CrossRef]
- Wang, M.L.; Zhang, J.X.; Liu, J.Z.; Xu, C.X.; Ju, H.X. Intramolecular energy and charge transfer in 5-(9-anthryl)-3-(4-nitrophenyl)-1-phenyl-2-pyrazoline. J. Lumin. 2002, 99, 79–83. [Google Scholar] [CrossRef]
- Kucukoz, B.; Sevinc, G.; Yildiz, E.; Karatay, A.; Zhong, F.; Yilmaz, H.; Tutel, Y.; Hayvali, M.; Zhao, J.; Yaglioglu, H.G. Enhancement of two photon absorption properties and intersystem crossing by charge transfer in pentaaryl boron-dipyrromethene (BODIPY) derivatives. Phys. Chem. Chem. Phys. 2016, 18, 13546–13553. [Google Scholar] [CrossRef] [PubMed]
- Khan, A.; Wang, M.L.; Usman, R.; Lu, J.; Sun, H.; Du, M.; Zhang, R.M.; Xu, C.X. Organic charge-transfer complexes for the selective accommodation of aromatic isomers using anthracene derivatives and TCNQ. New J. Chem. 2016, 40, 5277–5284. [Google Scholar] [CrossRef]
Scheme 1.
Syntheses of 2a and 2b.
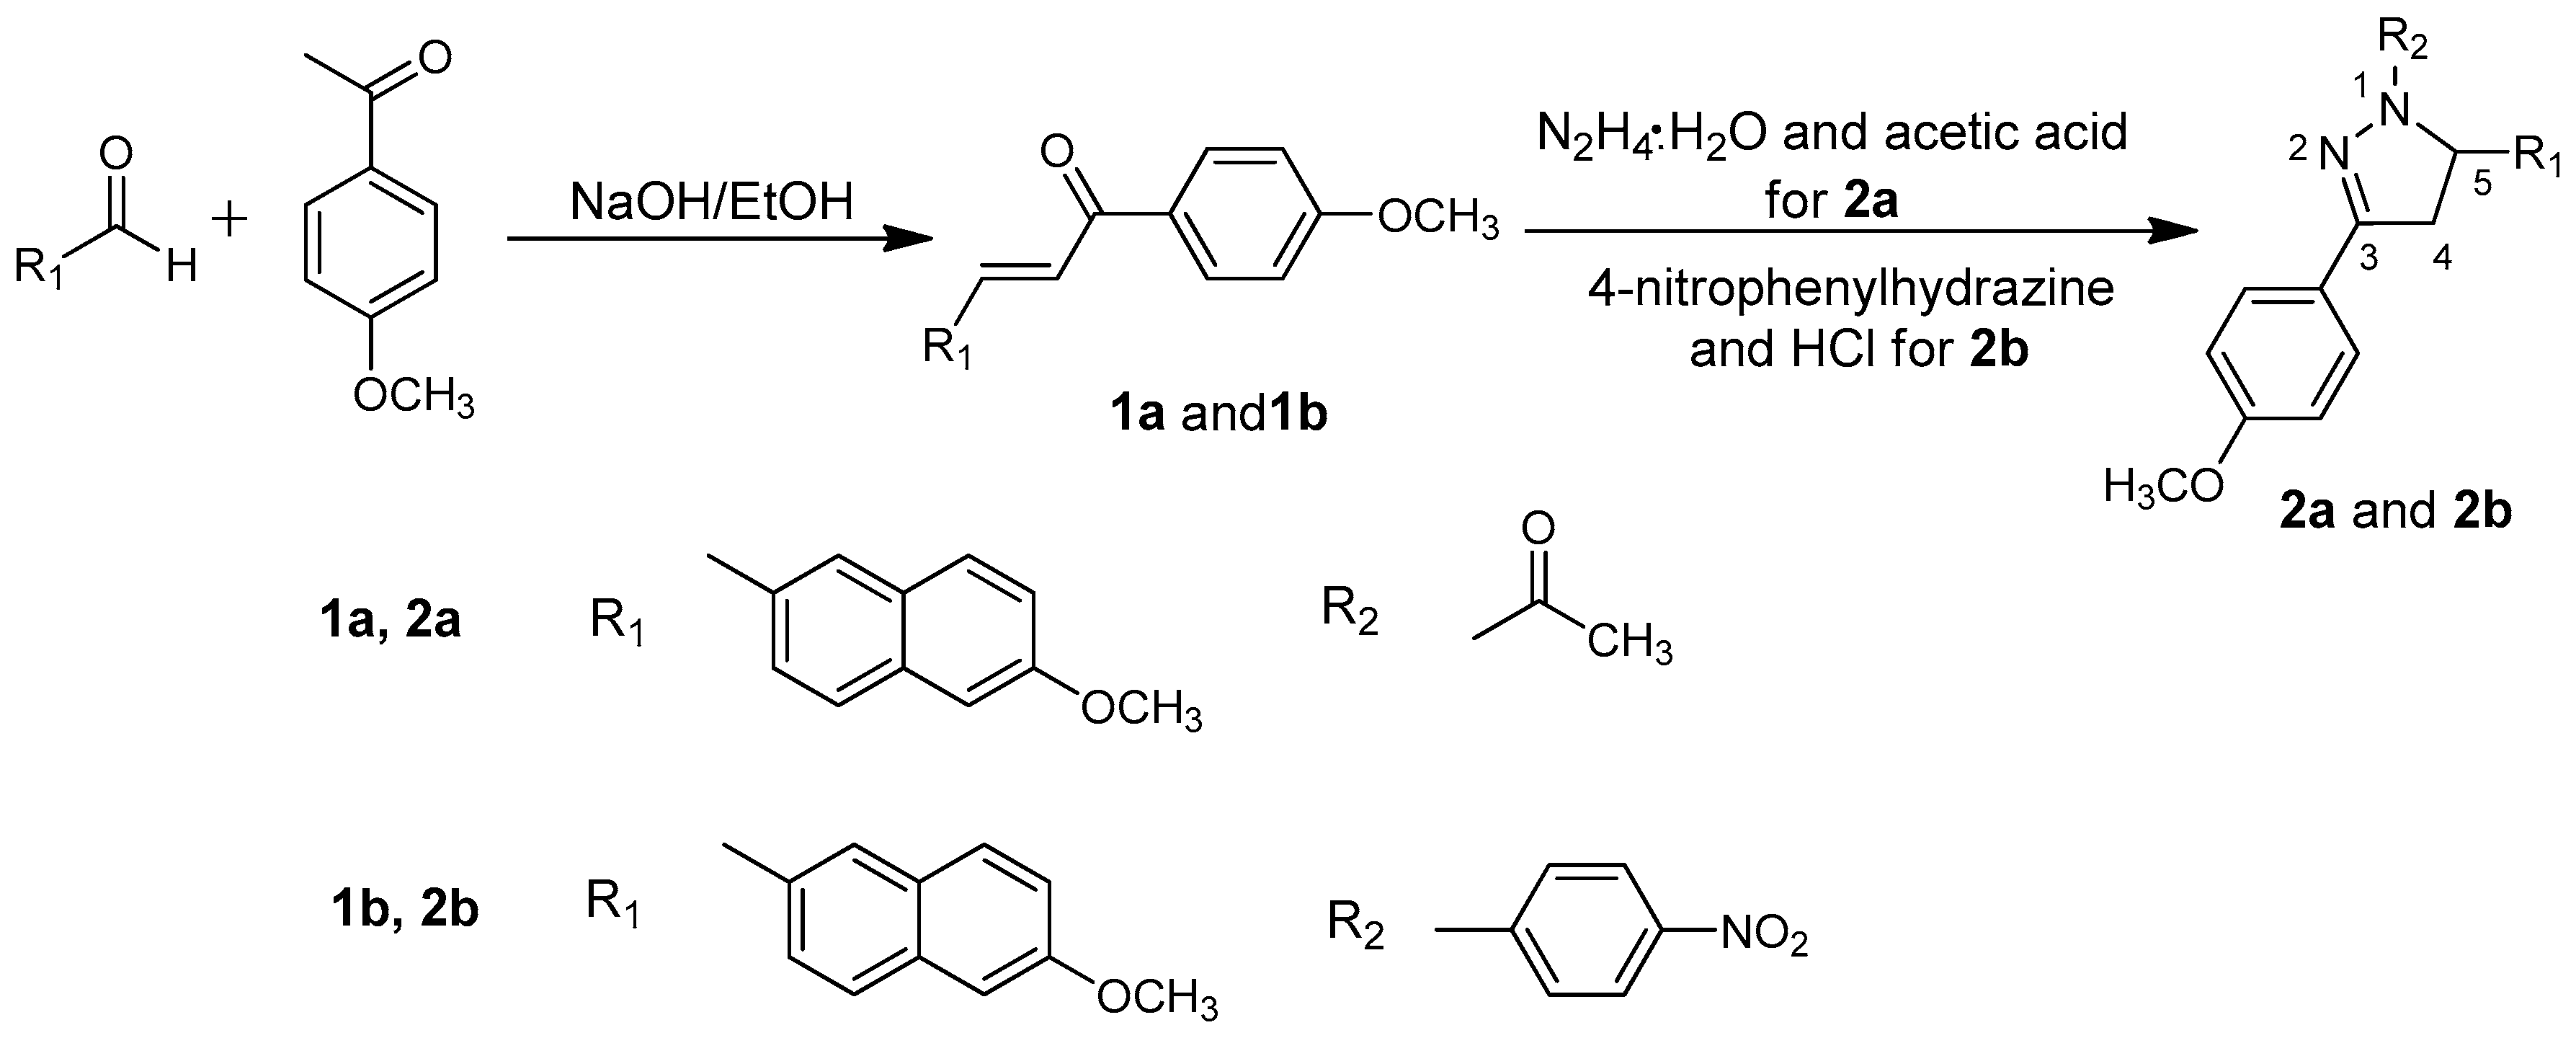
Figure 1.
Thermal ellipsoids plots of crystals 2a and 2b at 20% probability.
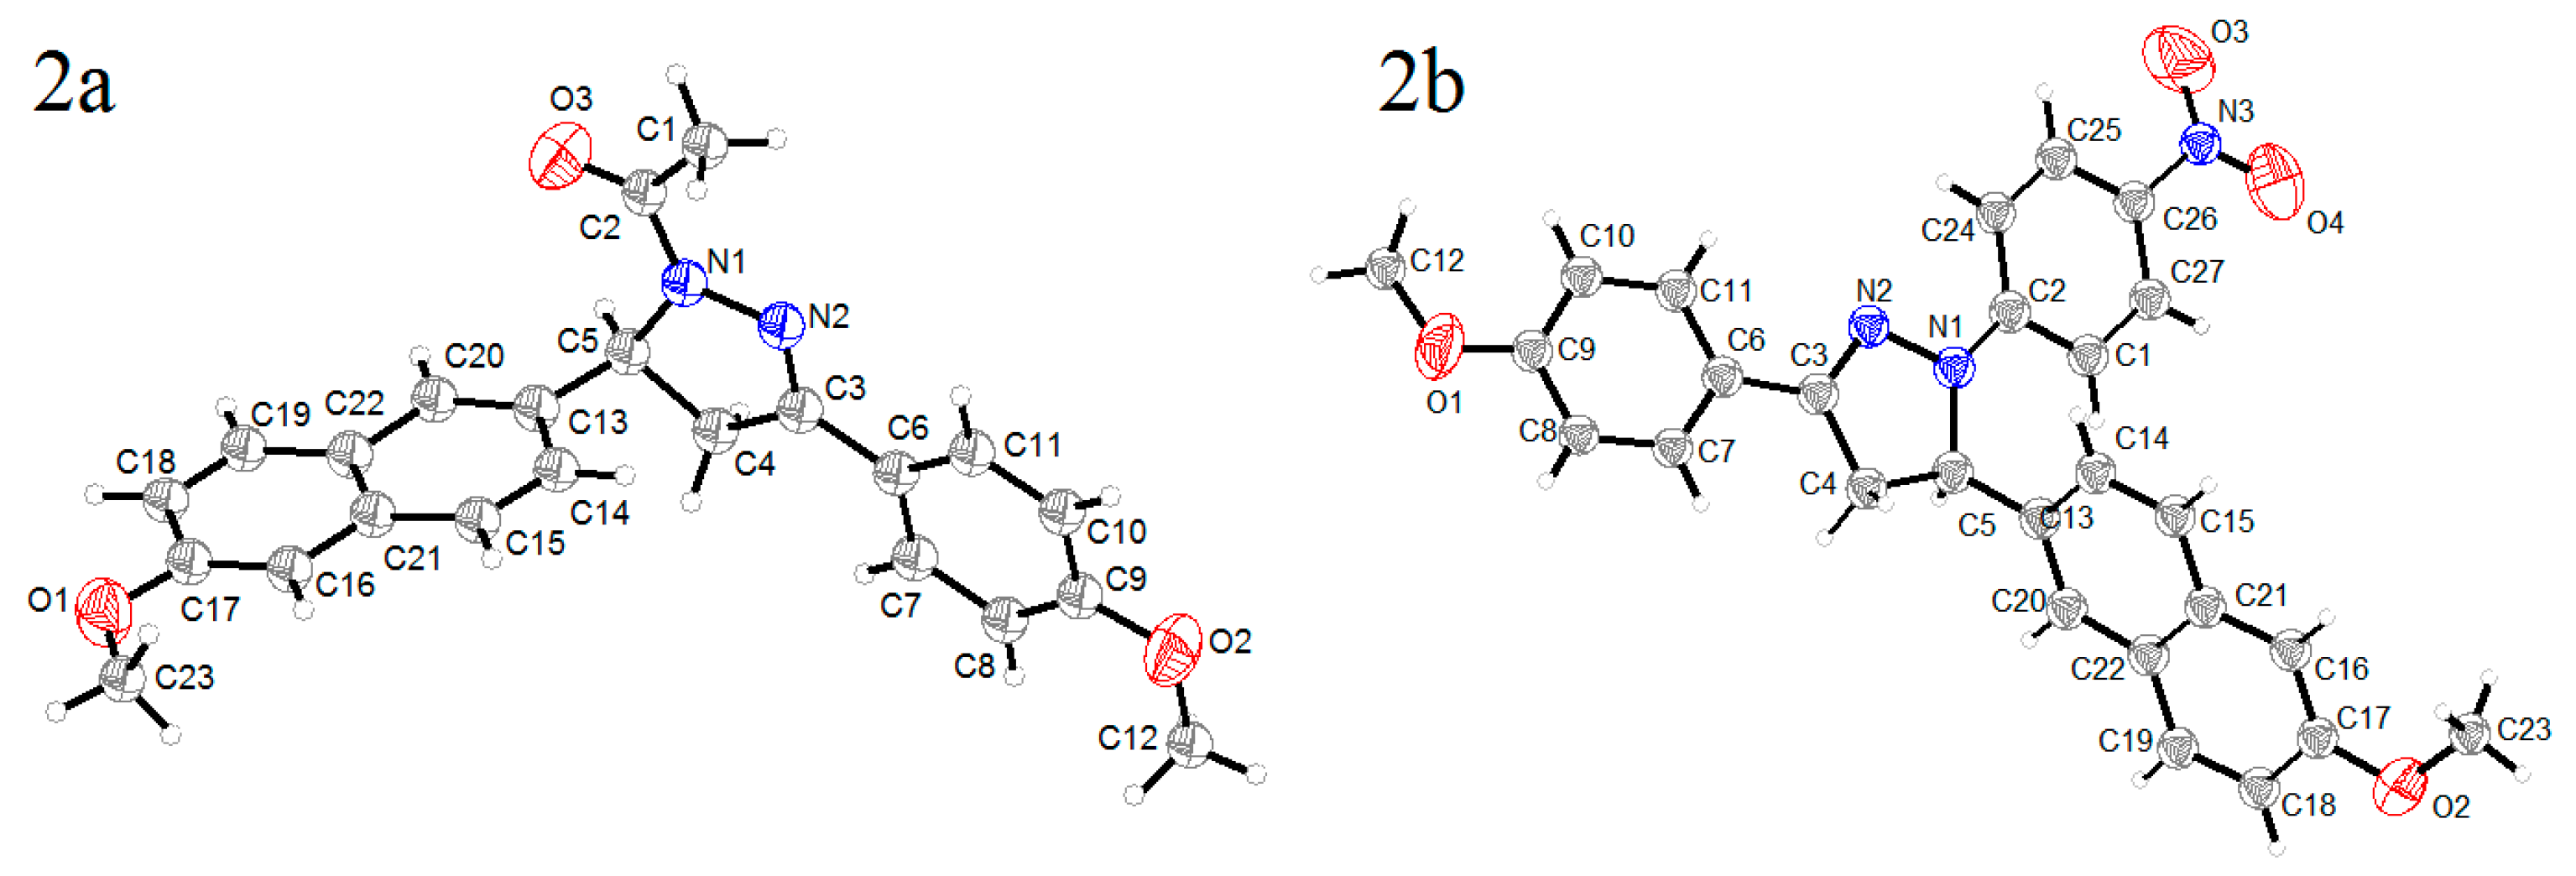
Figure 2.
Crystal structure of 2a (a) Racemic chain motif. (b) 3D packing diagram of crystal 2a (projected in bc plane). The dotted lines show the weak hydrogen bonds. C atoms in gray, N atoms in blue, and O atoms in red. H atoms not participating in the interactions have been omitted for clarity.
Figure 2.
Crystal structure of 2a (a) Racemic chain motif. (b) 3D packing diagram of crystal 2a (projected in bc plane). The dotted lines show the weak hydrogen bonds. C atoms in gray, N atoms in blue, and O atoms in red. H atoms not participating in the interactions have been omitted for clarity.

Figure 3.
Crystal structure of 2b. (a) Homochiral chain motif. (b) 3D packing diagram of crystal 2b (projected in bc plane). The dotted lines show the weak hydrogen bonds. C atoms in gray, N atoms in blue, and O atoms in red. H atoms not participating in the interactions have been omitted for clarity.

Figure 4.
Hirshfeld surface mapped with dnorm for the molecules of 2a (a) and 2b (b).

Figure 5.
Two-dimensional fingerprint plots for the molecules of 2a (a) and 2b (b).

Figure 6.
Absorption and fluorescence spectra of 2a (a,b) and 2b (c,d) in various solvents (10−4 mol/L).
Figure 6.
Absorption and fluorescence spectra of 2a (a,b) and 2b (c,d) in various solvents (10−4 mol/L).

Figure 7.
Solid fluorescence spectra of 2a and 2b (the fluorescence emission spectra excited at 300 nm for 2a and 400 nm for 2b).
Figure 7.
Solid fluorescence spectra of 2a and 2b (the fluorescence emission spectra excited at 300 nm for 2a and 400 nm for 2b).


Table 1.
Crystallographic data and refinement for 2a and 2b.
| Crystal | 2a | 2b |
|---|---|---|
| Molecular formula | C23H22N2O3 | C27H23N3O4 |
| Formula weight | 374.43 | 452.48 |
| Crystal system | Monoclinic | Monoclinic |
| Space group | P21/n | P21/c |
| a (Å) | 8.5757 (17) | 10.356 (2) |
| b (Å) | 17.422 (4) | 20.342 (4) |
| c (Å) | 13.279 (3) | 11.787 (2) |
| α (°) | 90.00 | 90.00 |
| β (°) | 97.65 (3) | 112.81 (3) |
| γ (°) | 90.00 | 90.00 (3) |
| volume (Å3) | 1966.3 (7) | 2288.7 (8) |
| density (g/cm3) | 1.265 | 1.316 |
| Z | 4 | 4 |
| F(000) | 792 | 952 |
| Absorption coefficient/mm−1 | 0.084 | 0.090 |
| Parameters | 256 | 309 |
| θ Range for data collection/° | 3.02–27.48 | 3.00–25.00 |
| R1 (I > 2σ(I)) | 0.0726 | 0.0856 |
| w R2 (I > 2σ(I)) | 0.1569 | 0.1655 |
| GOF | 1.024 | 1.016 |
| CCDC No. | 911423 | 911424 |
Table 2.
Selected bond lengths (Å) and angles (°) for the two crystals.
| Parameter | 2a | 2b |
|---|---|---|
| N1–N2 | 1.396 | 1.407 |
| N1–C2 | 1.362 | 1.380 |
| N1–C5 | 1.483 | 1.479 |
| N2–C3 | 1.293 | 1.299 |
| C3–C6 | 1.460 | 1.461 |
| C3–C4 | 1.507 | 1.501 |
| C4–C5 | 1.539 | 1.540 |
| C5–C13 | 1.510 | 1.515 |
| N2–C3–C6 (degree) | 122.1 | 122.5 |
| C2–N1–N2 (degree) | 121.9 | 117.5 |
| N1–C5–C13 (degree) | 111.0 | 115.6 |
Table 3.
Intermolecular weak C–H···O hydrogen bond parameters in the two crystals.
| Crystal | D–H (Å) | H···A (Å) | D···A (Å) | D–H···A (°) |
|---|---|---|---|---|
| 2a | ||||
| C14–H1···O2 | 0.930 | 2.453 | 3.178 | 134.93 |
| C18–H5···O3 | 0.929 | 2.527 | 3.378 | 152.42 |
| C12–H21B···O1 | 0.960 | 2.566 | 3.503 | 165.36 |
| C23–H11B···O3 | 0.960 | 2.699 | 3.438 | 134.18 |
| C7–H16···O1 | 0.929 | 2.603 | 3.458 | 153.09 |
| 2b | ||||
| C11–H5···O2 | 0.930 | 2.710 | 3.393 | 130.97 |
| C4–H2A···O3 | 0.970 | 2.521 | 3.133 | 120.97 |
| C18–H14···O4 | 0.931 | 2.526 | 3.370 | 150.73 |
Table 4.
Contributions of the intermolecular contacts.
| Crystal | H···H % | C···H % | O···H % | N···H % | C···C % | C···O % | C···N % | O···N % | O···O % |
|---|---|---|---|---|---|---|---|---|---|
| 2a | 39.9 | 31.5 | 22.2 | 3.2 | 0.5 | 0.6 | 1.7 | 0.3 | 0.2 |
| 2b | 51.5 | 25.5 | 17.3 | 2.6 | 2.7 | 0.2 | 0.1 | 0 | 0 |
Table 5.
Spectroscopic data of 2a and 2b.
| 2a | 2b | |||
|---|---|---|---|---|
| Solvents | λab (nm) | λem (nm) | λab (nm) | λem (nm) |
| n-Hexane | 302 | 358 | 395 | 428 |
| Chloroform | 300 | 364 | 426 | 547 |
| Ethyl acetate | 300 | 359 | 416 | 508 |
| Ethanol | 294 | 358 | 422 | 533 |
| Methanol | 294 | 360 | 422 | 540 |
© 2018 by the authors. Licensee MDPI, Basel, Switzerland. This article is an open access article distributed under the terms and conditions of the Creative Commons Attribution (CC BY) license (http://creativecommons.org/licenses/by/4.0/).
Share and Cite
MDPI and ACS Style
Feng, Q.; Huan, W.; Wang, J.; Lu, J.; Diao, G.; Shan, Y. Crystal Structures and Optical Properties of Two Novel 1,3,5-Trisubstituted Pyrazoline Derivatives. Crystals 2018, 8, 467. https://doi.org/10.3390/cryst8120467
AMA Style
Feng Q, Huan W, Wang J, Lu J, Diao G, Shan Y. Crystal Structures and Optical Properties of Two Novel 1,3,5-Trisubstituted Pyrazoline Derivatives. Crystals. 2018; 8(12):467. https://doi.org/10.3390/cryst8120467
Chicago/Turabian StyleFeng, Qi, Wenhui Huan, Jiali Wang, Jiadan Lu, Guowang Diao, and Yaqi Shan. 2018. "Crystal Structures and Optical Properties of Two Novel 1,3,5-Trisubstituted Pyrazoline Derivatives" Crystals 8, no. 12: 467. https://doi.org/10.3390/cryst8120467
Note that from the first issue of 2016, this journal uses article numbers instead of page numbers. See further details here.