Article

Aging Behavior and Precipitation Analysis of Cu-Ni-Co-Si Alloy

1
Institute of Engineering Research, Jiangxi University of Science and Technology, Hongqi Ave. No.86, Ganzhou 341000, China
2
School of Materials Science and Engineering, Jiangxi University of Science and Technology, Hongqi Ave. No.86, Ganzhou 341000, China
*
Authors to whom correspondence should be addressed.
Crystals 2018, 8(11), 435; https://doi.org/10.3390/cryst8110435
Submission received: 28 August 2018 / Revised: 14 November 2018 / Accepted: 15 November 2018 / Published: 20 November 2018

Abstract

:
Cu-Ni-Si alloy with a different Co content was prepared by inductive melting and hot rolling. The alloy was solution treated at 950 °C for 1.5 h and aged at 450 °C, 500 °C, and 550 °C for different times. The phase diagram calculation and transmission electron microscopy was used to investigate the effect of Co addition on the aging precipitation behavior of the Cu-Ni-Si alloy. The phase transformation kinetics equation was calculated as well. The results show that, with the increase of aging temperature, the two-phase region of Fcc + Ni2Si in the Cu-Ni-Si ternary diagram would get wider. Some NixSiy phases would also form in the Cu-rich isothermal section. The addition of Co would replace part of Ni to form the (Ni, Co)2Si phase, which inhibits the spinodal decomposition process of the Cu-Ni-Si alloy during the aging process. The precipitated phase of the Cu-Ni-Si alloy with a high content of the Co element is more likely to grow with the extension of aging time. The phase transformation kinetic equations of the Cu-Ni-Si alloy at 450 °C and 500 °C showed good agreement with the experimental results. Furthermore, it can be seen from the precipitation kinetic curve the addition of the Co element accelerates precipitation in the aging process.

1. Introduction

The Cu-Ni-Si alloy is a typical high-strength and age-hardening alloy that has been successfully applied to various industries. It has been widely used and developed since Dr. Corson had found that it has a precipitation strengthening effect at the beginning of the 20th century [1,2,3,4,5]. The development of alloys such as C64710, C64730, C70250, and C70350 has further promoted the development of Cu-Ni-Si alloy in recent years [6,7,8]. This series of alloys has attracted much attention due to its high strength, good electrical conductivity, and stress relaxation resistance. Some of these alloys have even been investigated to replace beryllium copper [9,10,11].
The strengthening mechanism of Cu-Ni-Si alloys includes solid solution strengthening, aging strengthening, and work hardening [12,13,14,15]. Since the strengthening power of this alloy is mainly due to the fine, dispersed Ni2Si that precipitated during the aging treatment, the strength and electrical conductivity are closely related to the distribution, number, and size of the precipitated phases. Deformation can further increase the strength of the alloy, but, at the same time, it can also slightly decrease electrical conductivity. So far, the research on Cu-Ni-Si alloys is limited to the ternary alloy system. In other words, there are few research studies focused on the influence of the fourth trace alloying element addition [16,17,18]. Lei Jingguo et al. [19,20,21] studied the effect of Cr addition on mechanical properties and electrical properties of Cu-Ni-Si alloy and showed that the addition of a trace amount of Cr can produce a dual alloy aging strengthening effect, which can increase the hardness and strength of the Cu-Ni-Si alloy while ensuring that the conductivity is not greatly affected. Wang Li et al. [22,23] added 0.03% P to the Cu-3Ni-0.6Si alloy for comparison. It was found that the strength property was improved while the conductivity was sacrificed significantly. In this paper, a small amount of Co is added to the Cu-Ni-Si alloy to study its influence on the early precipitation phase during the aging treatment. The objective is to distinguish the phase transformation in the Cu-Ni-Co-Si alloy during aging at a wide aging temperature range.

2. Experimental

High-purity electrolytic copper, nickel ingots, cobalt ingots, and silicon ingots were melted in a 50 kg medium frequency induction furnace and cast at 1100 °C to 1200 °C. The four-component alloys shown in Table 1 were obtained. The alloy ingot obtained after casting was hot-rolled in multiple passes into a plate with a thickness of 4 mm. Then, the SX2-18-16T box resistance furnace produced by Shanghai Shiyan Electric Furnace Co., Ltd. was used for solution and aging treatment. The solid solution was taken into the temperatures of 950 °C for 1.5 hours, which was followed by water quenching at room temperature. The aging temperatures were 450 °C, 500 °C, and 550 °C. The different isothermal cross-section phase diagrams have been optimized via the CALPHAD approach using Pandat software and the version of the software is CT-1067. Electrical conductivity was carried out on a 7501 eddy current conductivity meter. A transmission electron microscope (TEM) observation of the aged samples was carried out by a JEM-2000 transmission electron microscopy (200 kV) and selected area electron diffraction analysis was carried out to determine the type and structure of the precipitated phase and the orientation relationship between the precipitated phase and the matrix. The transmission sample was mechanically ground to 100 μm, then punched into a small piece of Φ3 mm, and then thinned to about 50 μm. Lastly, a thin zone was obtained by double-spray electrolytic thinning and the electrolyte ratio was 25% HNO3 + 75% CH3OH. The electropolishing temperature was −30 °C and the voltage was 15~20 V.

3. Results and Discussions

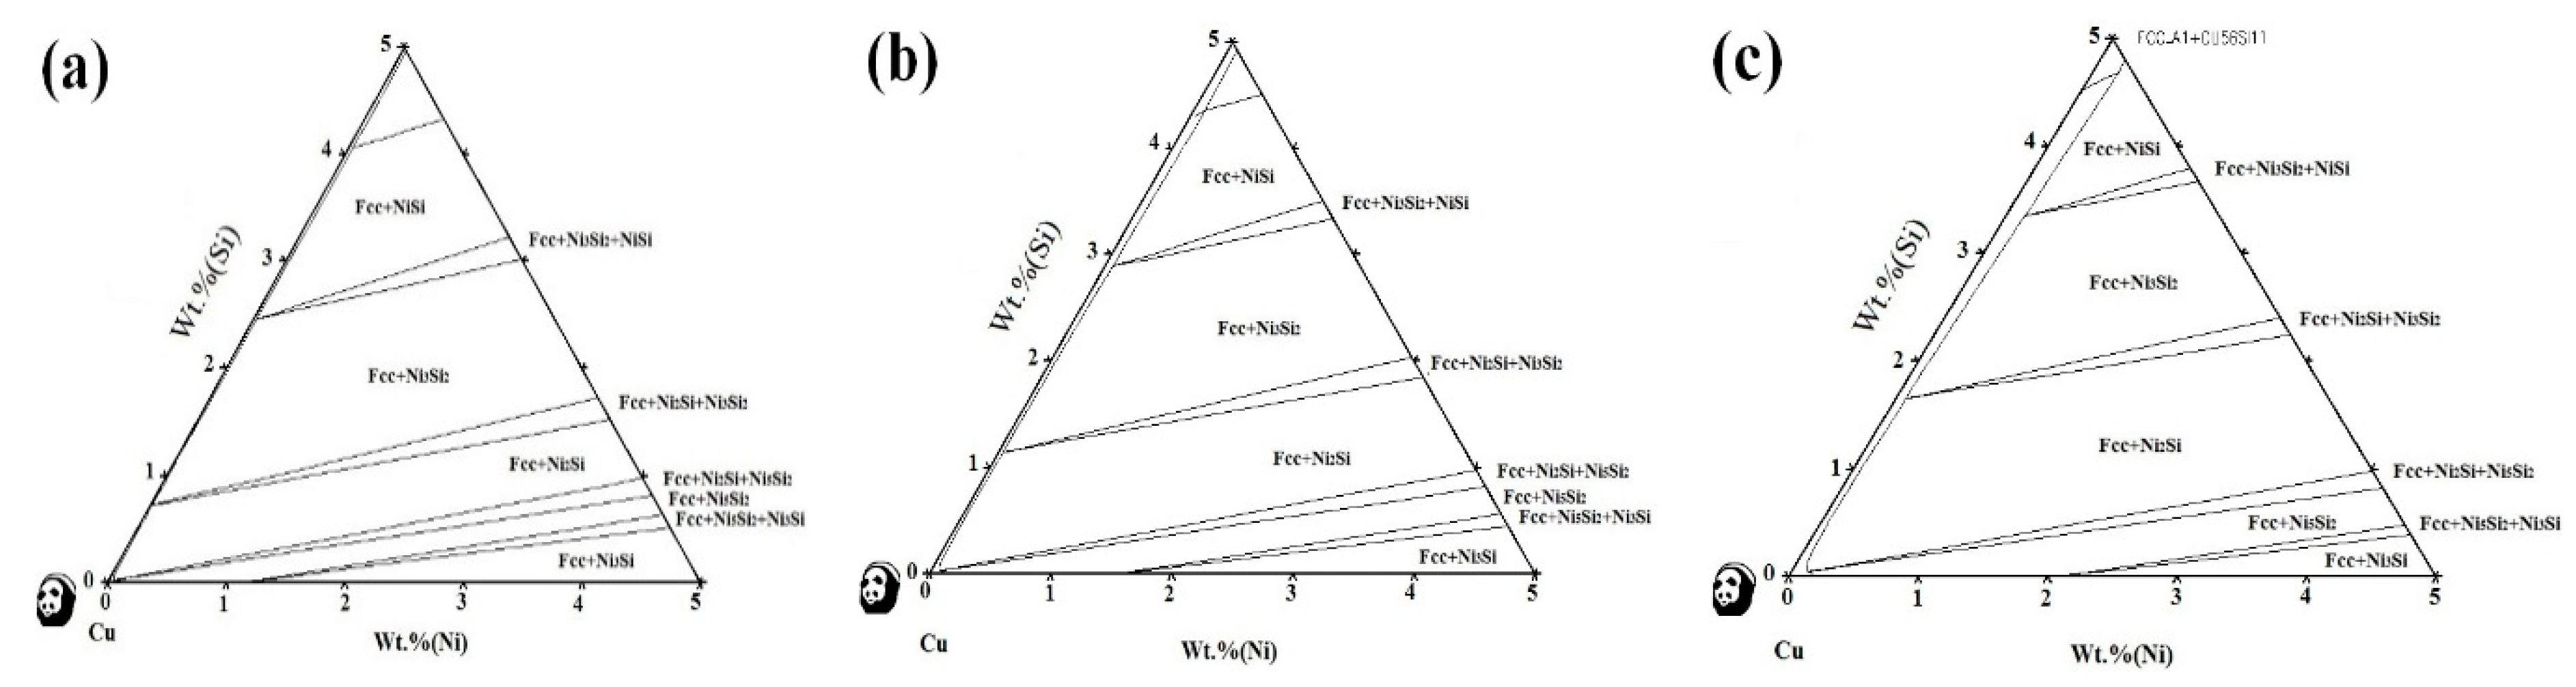
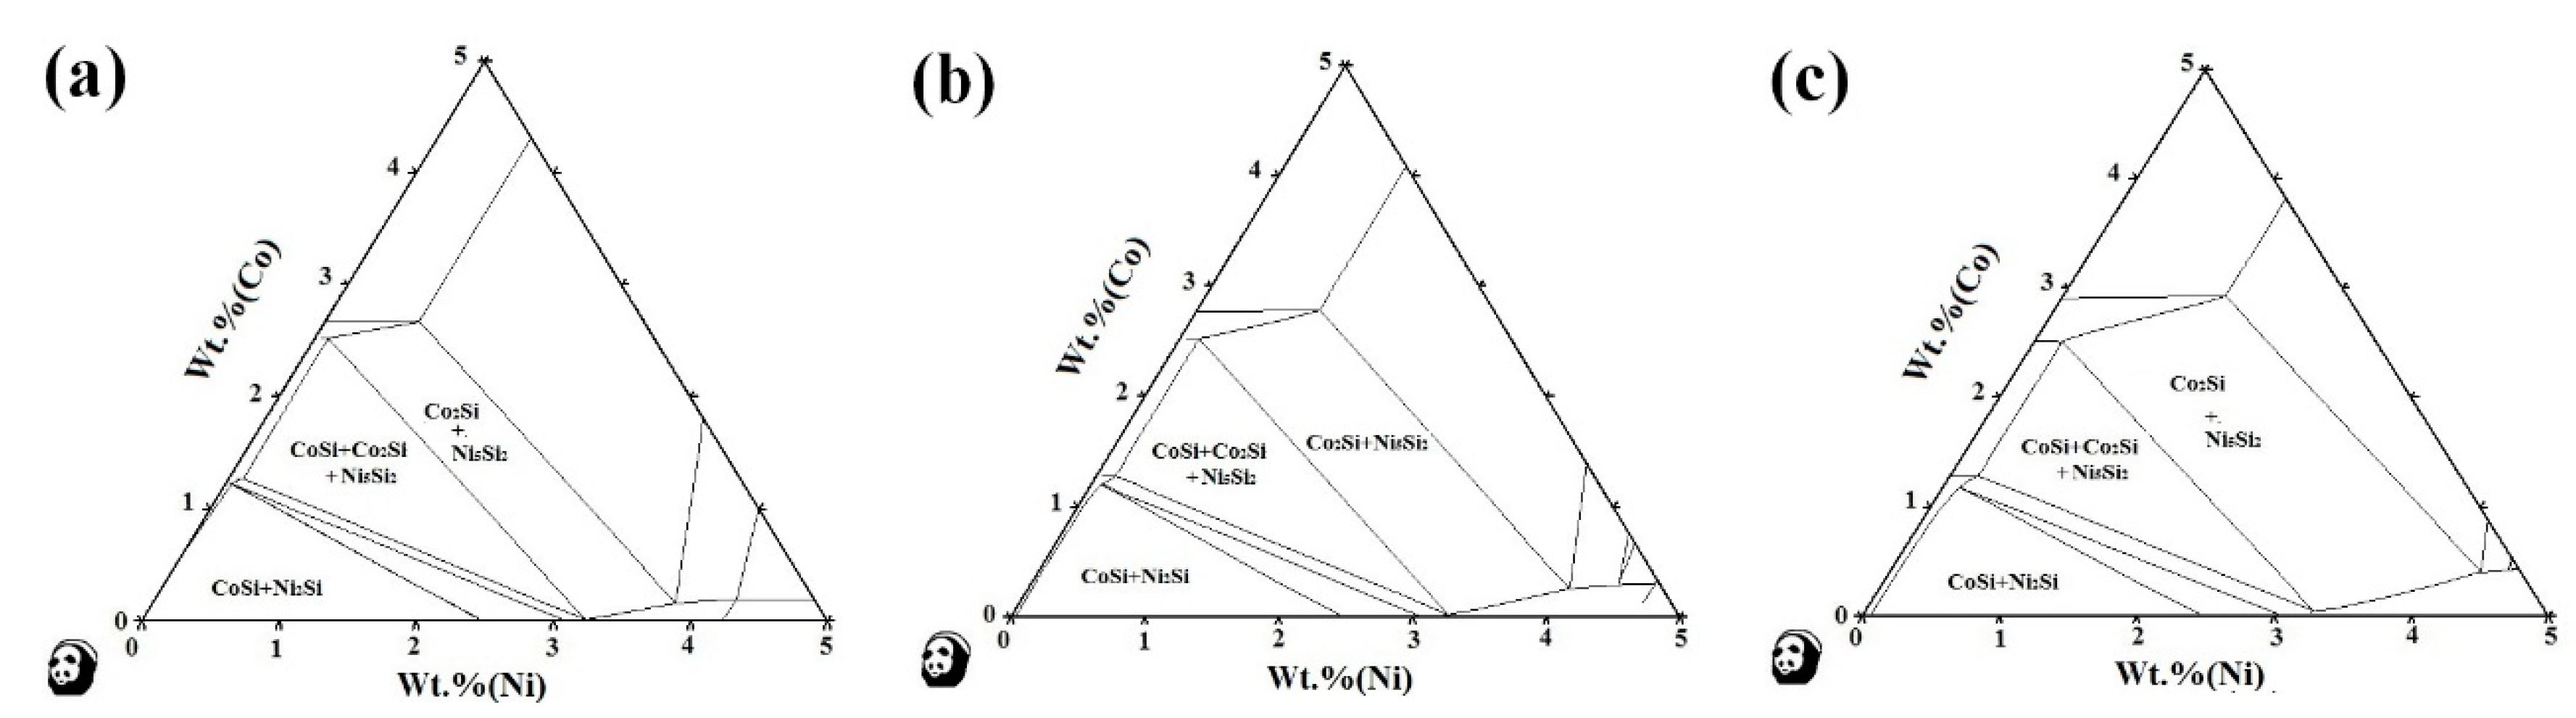
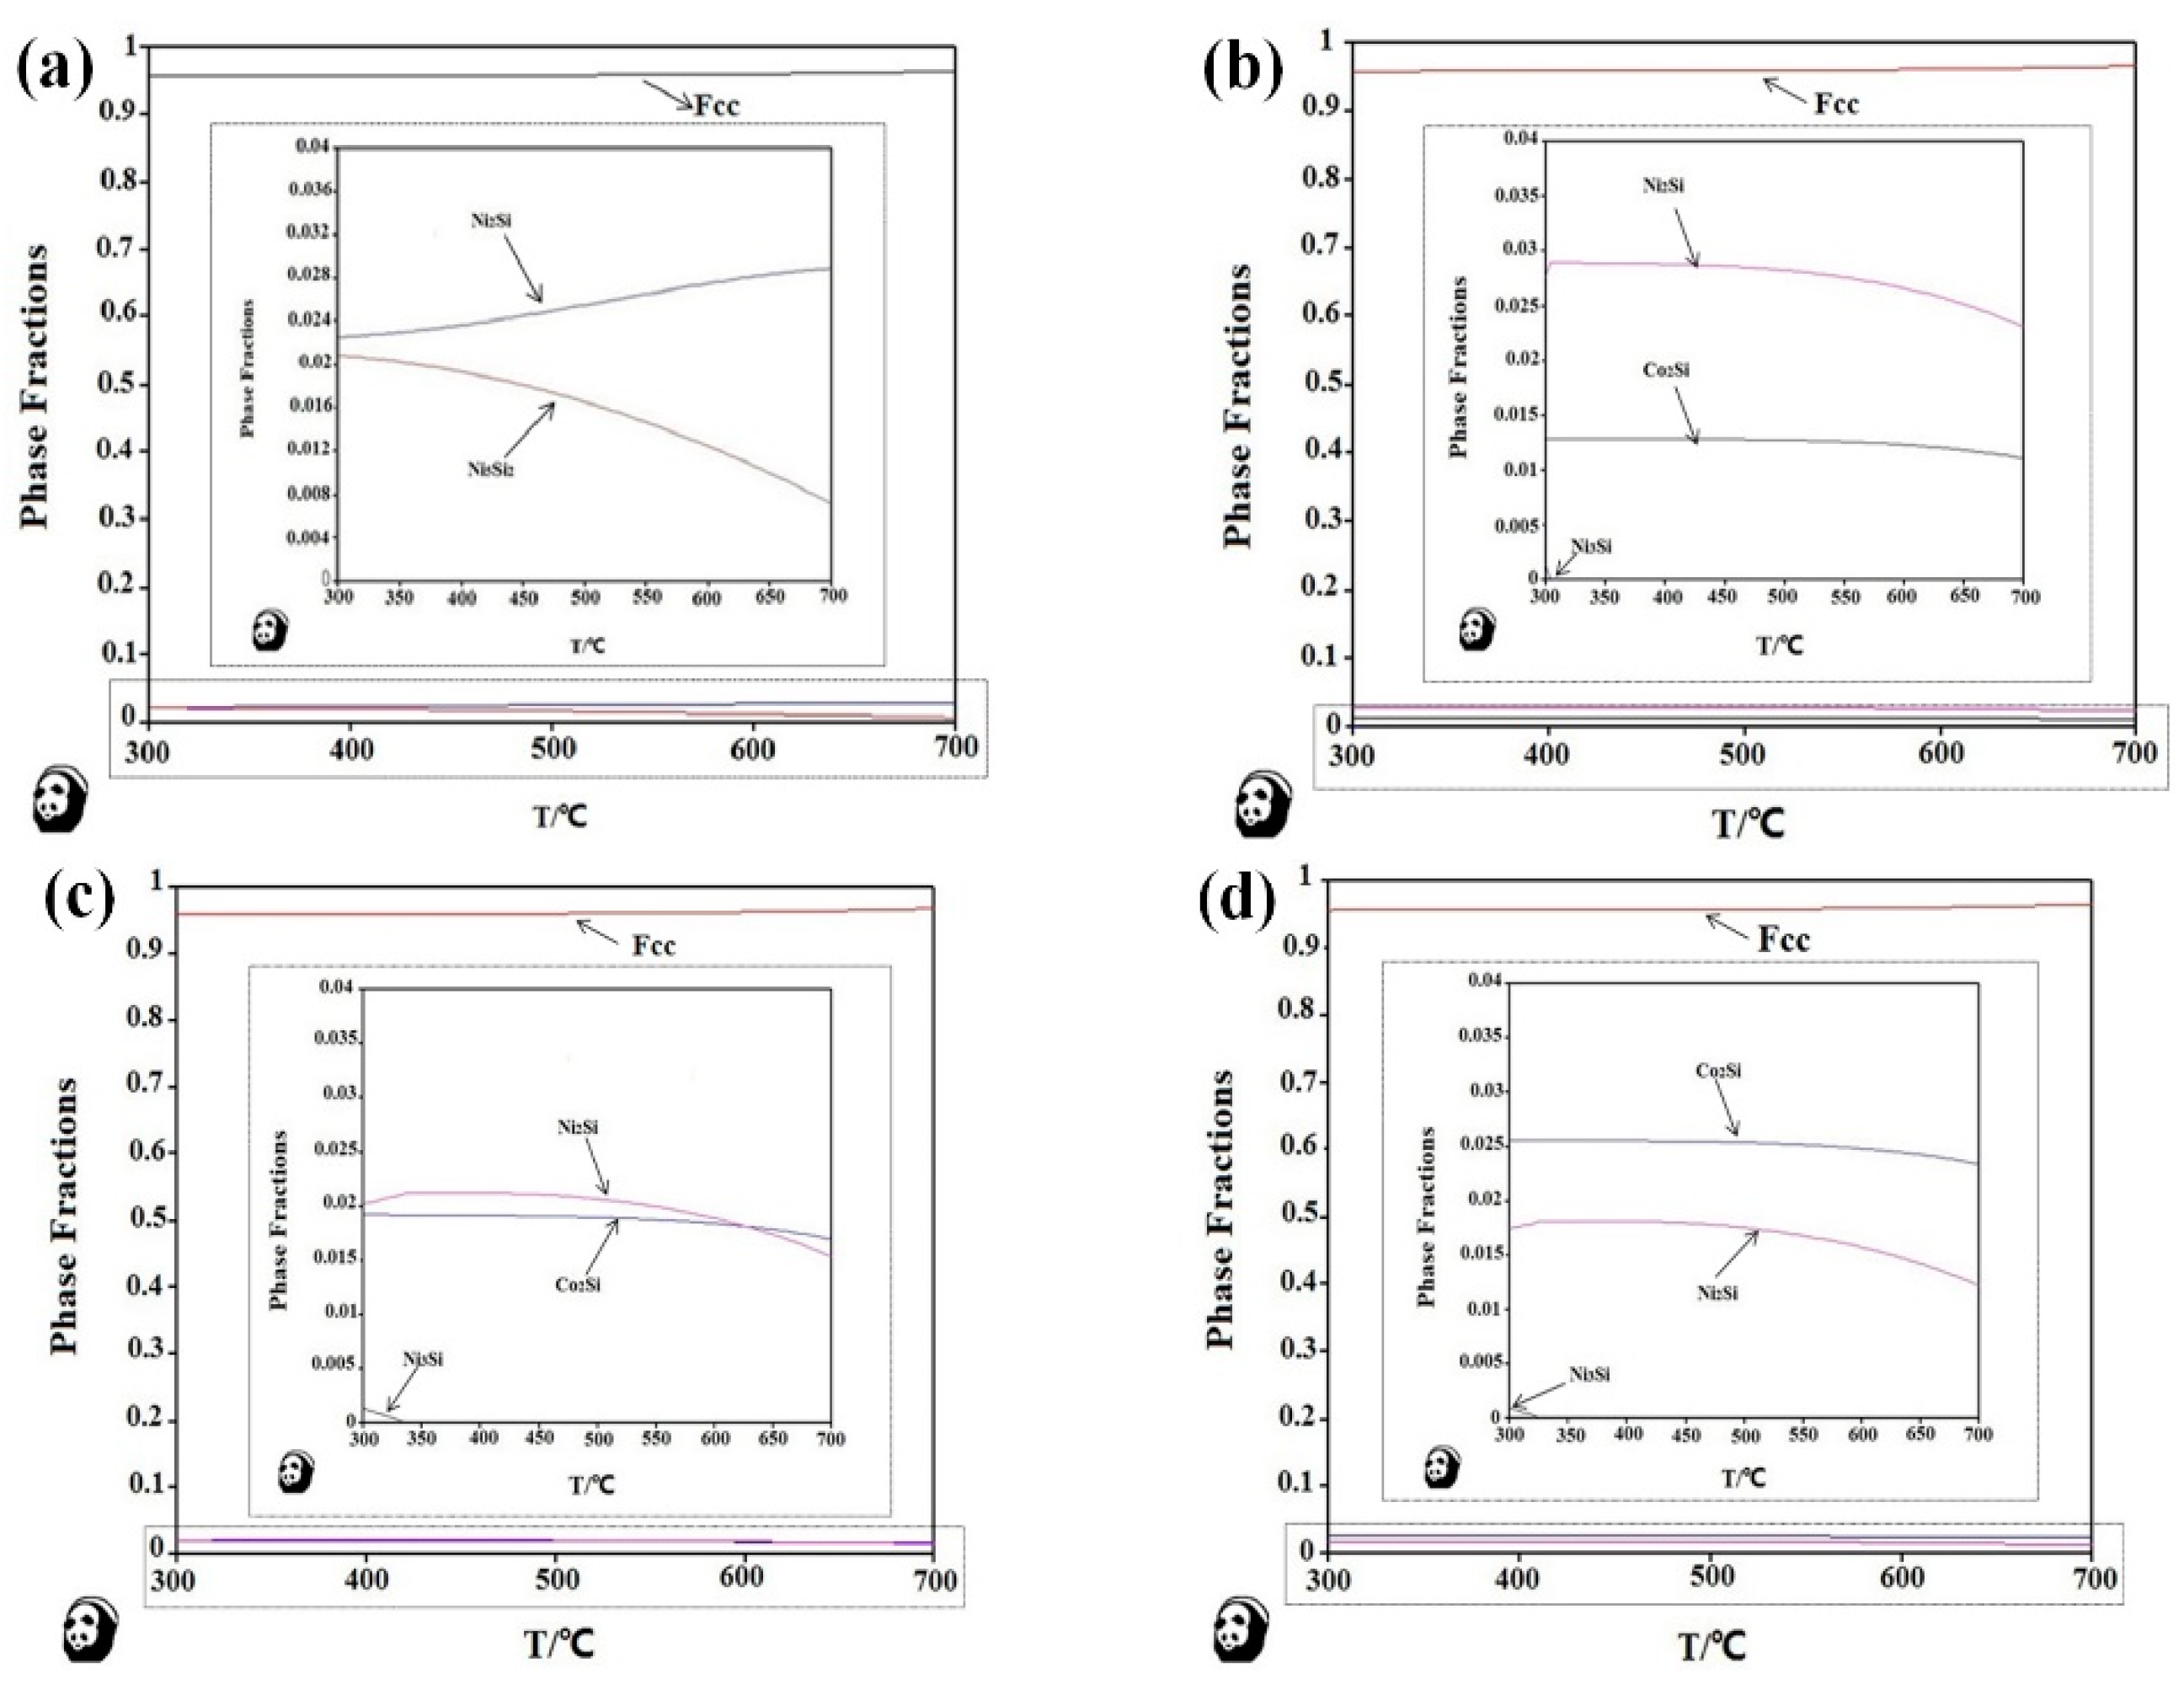
3.1. Phase Diagram Calculation

Figure 1 shows the calculation results of different isothermal cross-section phase diagrams in the copper-rich region of the Cu-Ni-Si ternary alloy. With the increased temperatures, the Fcc + Ni2Si phase region gradually get wider. There are Fcc + NiSi, Fcc + Ni3Si2, Fcc + Ni2Si, Fcc + Ni3Si, and Fcc + Ni5Si2 two-phase regions and three-phase regions such as Fcc + Ni3Si + NiSi, Fcc + Ni2Si + Ni3Si2, Fcc + Ni2Si + Ni5Si2, Fcc + Ni3Si2+NiSi in the copper-rich section of the Cu-Ni-Si ternary alloy aging at 450 °C, 500 °C, and 550 °C. Therefore, it can be inferred that the Cu-Ni-Si alloy with these components in these regions may have NiSi, Ni2Si, Ni3Si, Ni3Si2, and Ni5Si phases as the composition and aging temperature of the alloy change, which explains the reason for the formation of so many types of precipitation during the aging treatment of Cu-Ni-Si alloys.
Figure 2 shows the calculated Cu-Ni-Co-Si quaternion phase diagram with the variation of Ni and Co contents when the Si content is fixed at 0.6 wt.%. It can be seen that, when the content of Ni and Co is less than 5 wt.%, the precipitated phase mainly includes CoSi, Co2Si, Ni2Si, and Ni5Si2.
Figure 3 shows the influence of the temperature on the mass fraction of the equilibrium phases. The isothermal sections of the alloy at 450 °C, 500 °C, and 550 °C are located between the two phase regions of Fcc + Ni2Si and Fcc + Co2Si. The theoretical calculations indicate that the Ni2Si and Co2Si are the main precipitates and, as the Co content increases, the proportion of the Co2Si phase also increases. The above suggests that the addition of Co would combine with some Si atoms to form the Co2Si phase.

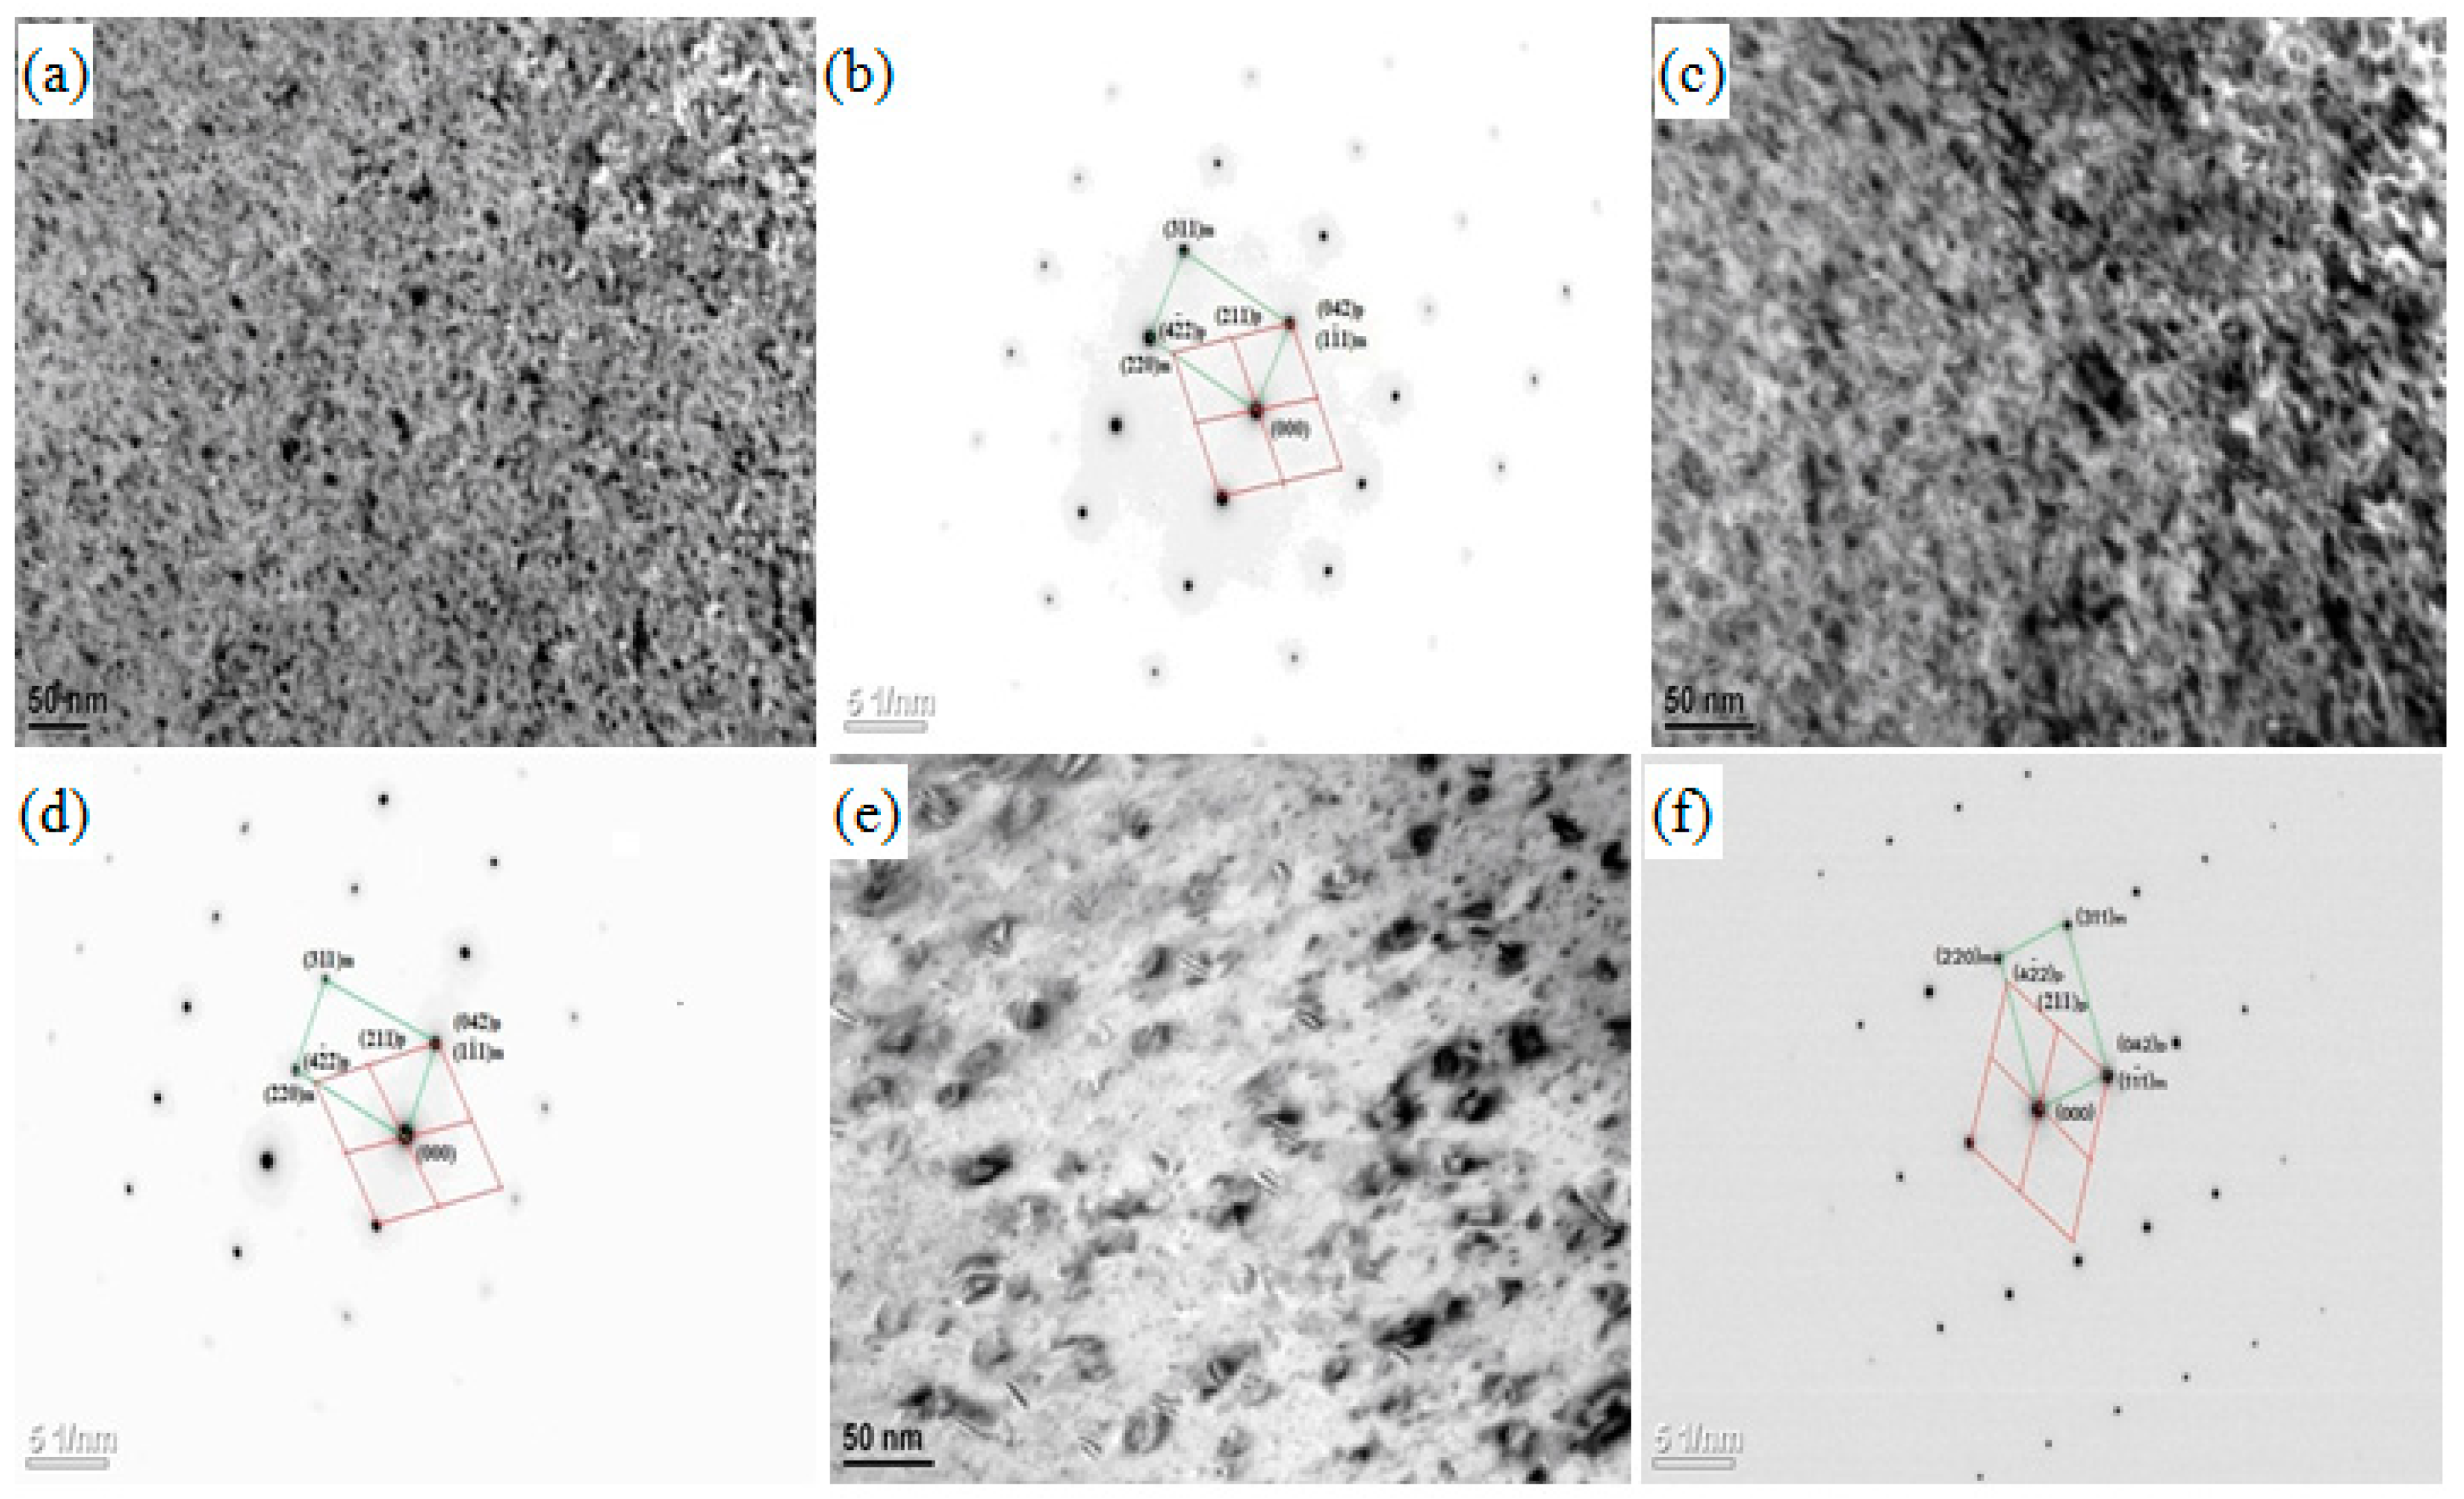
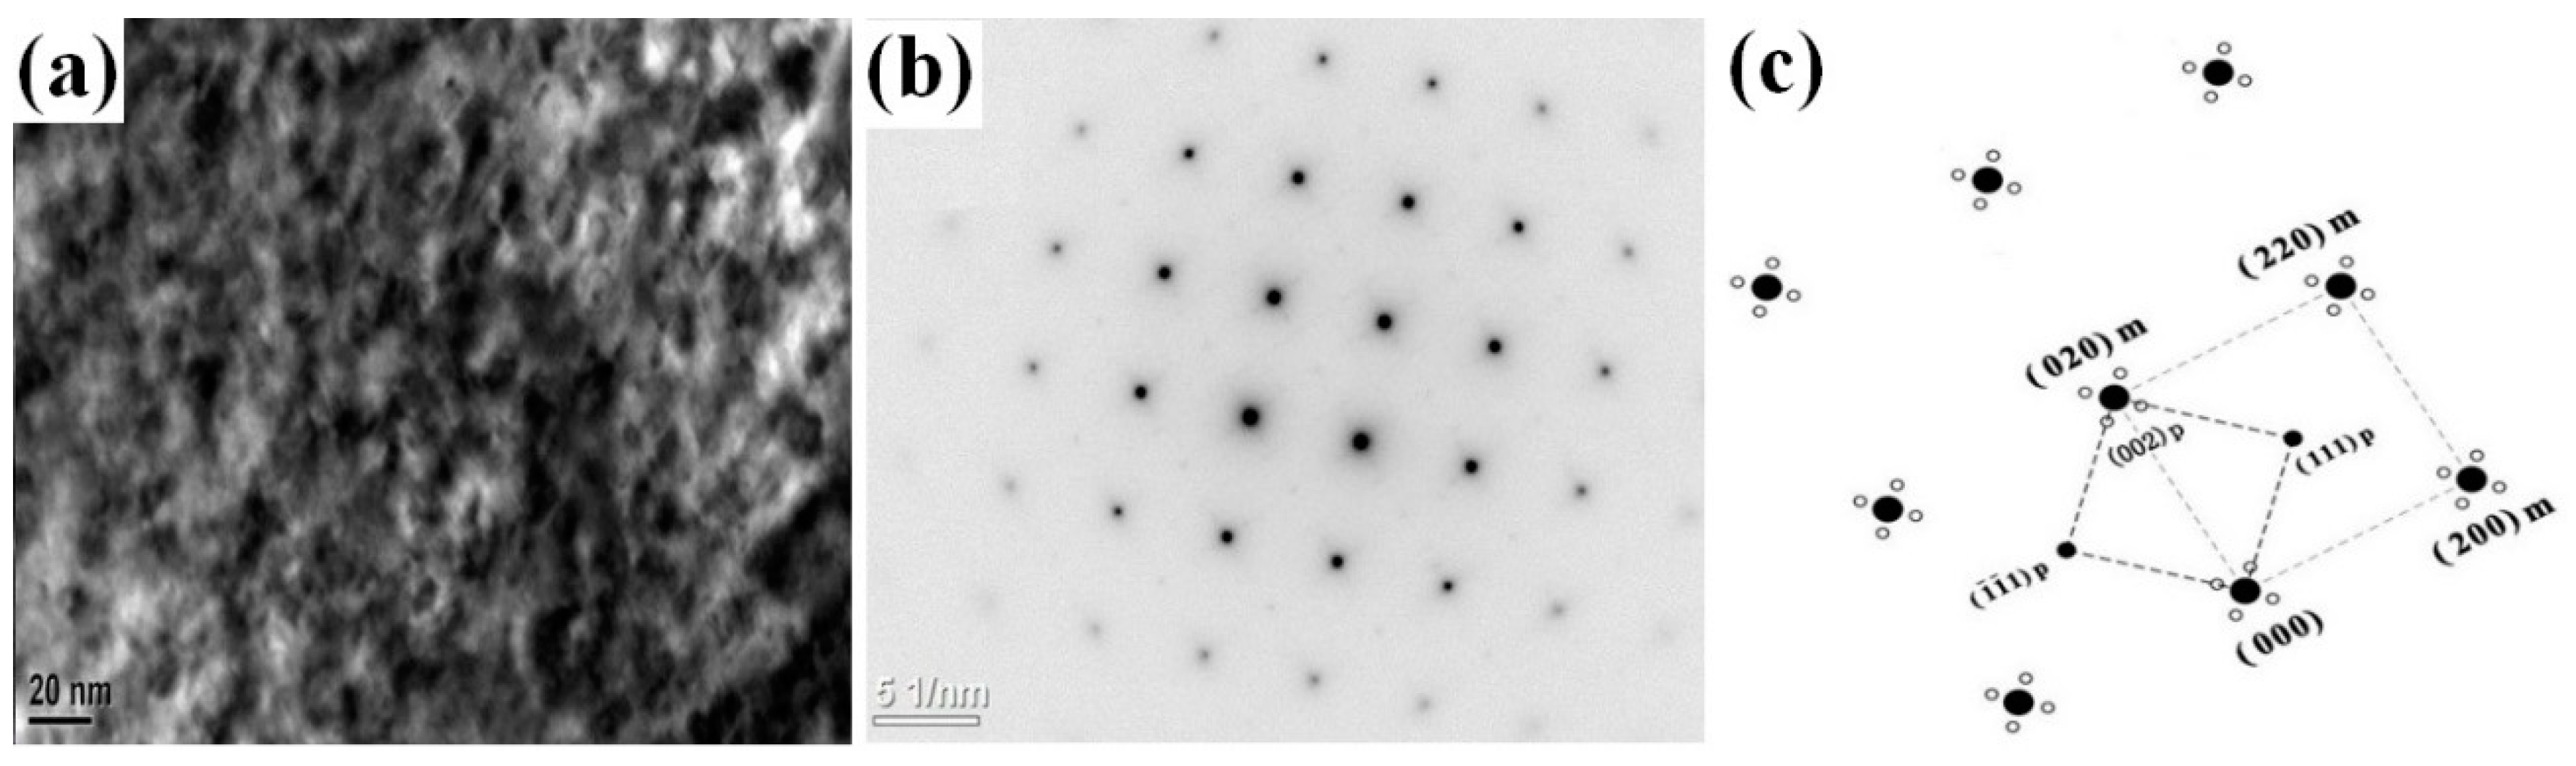
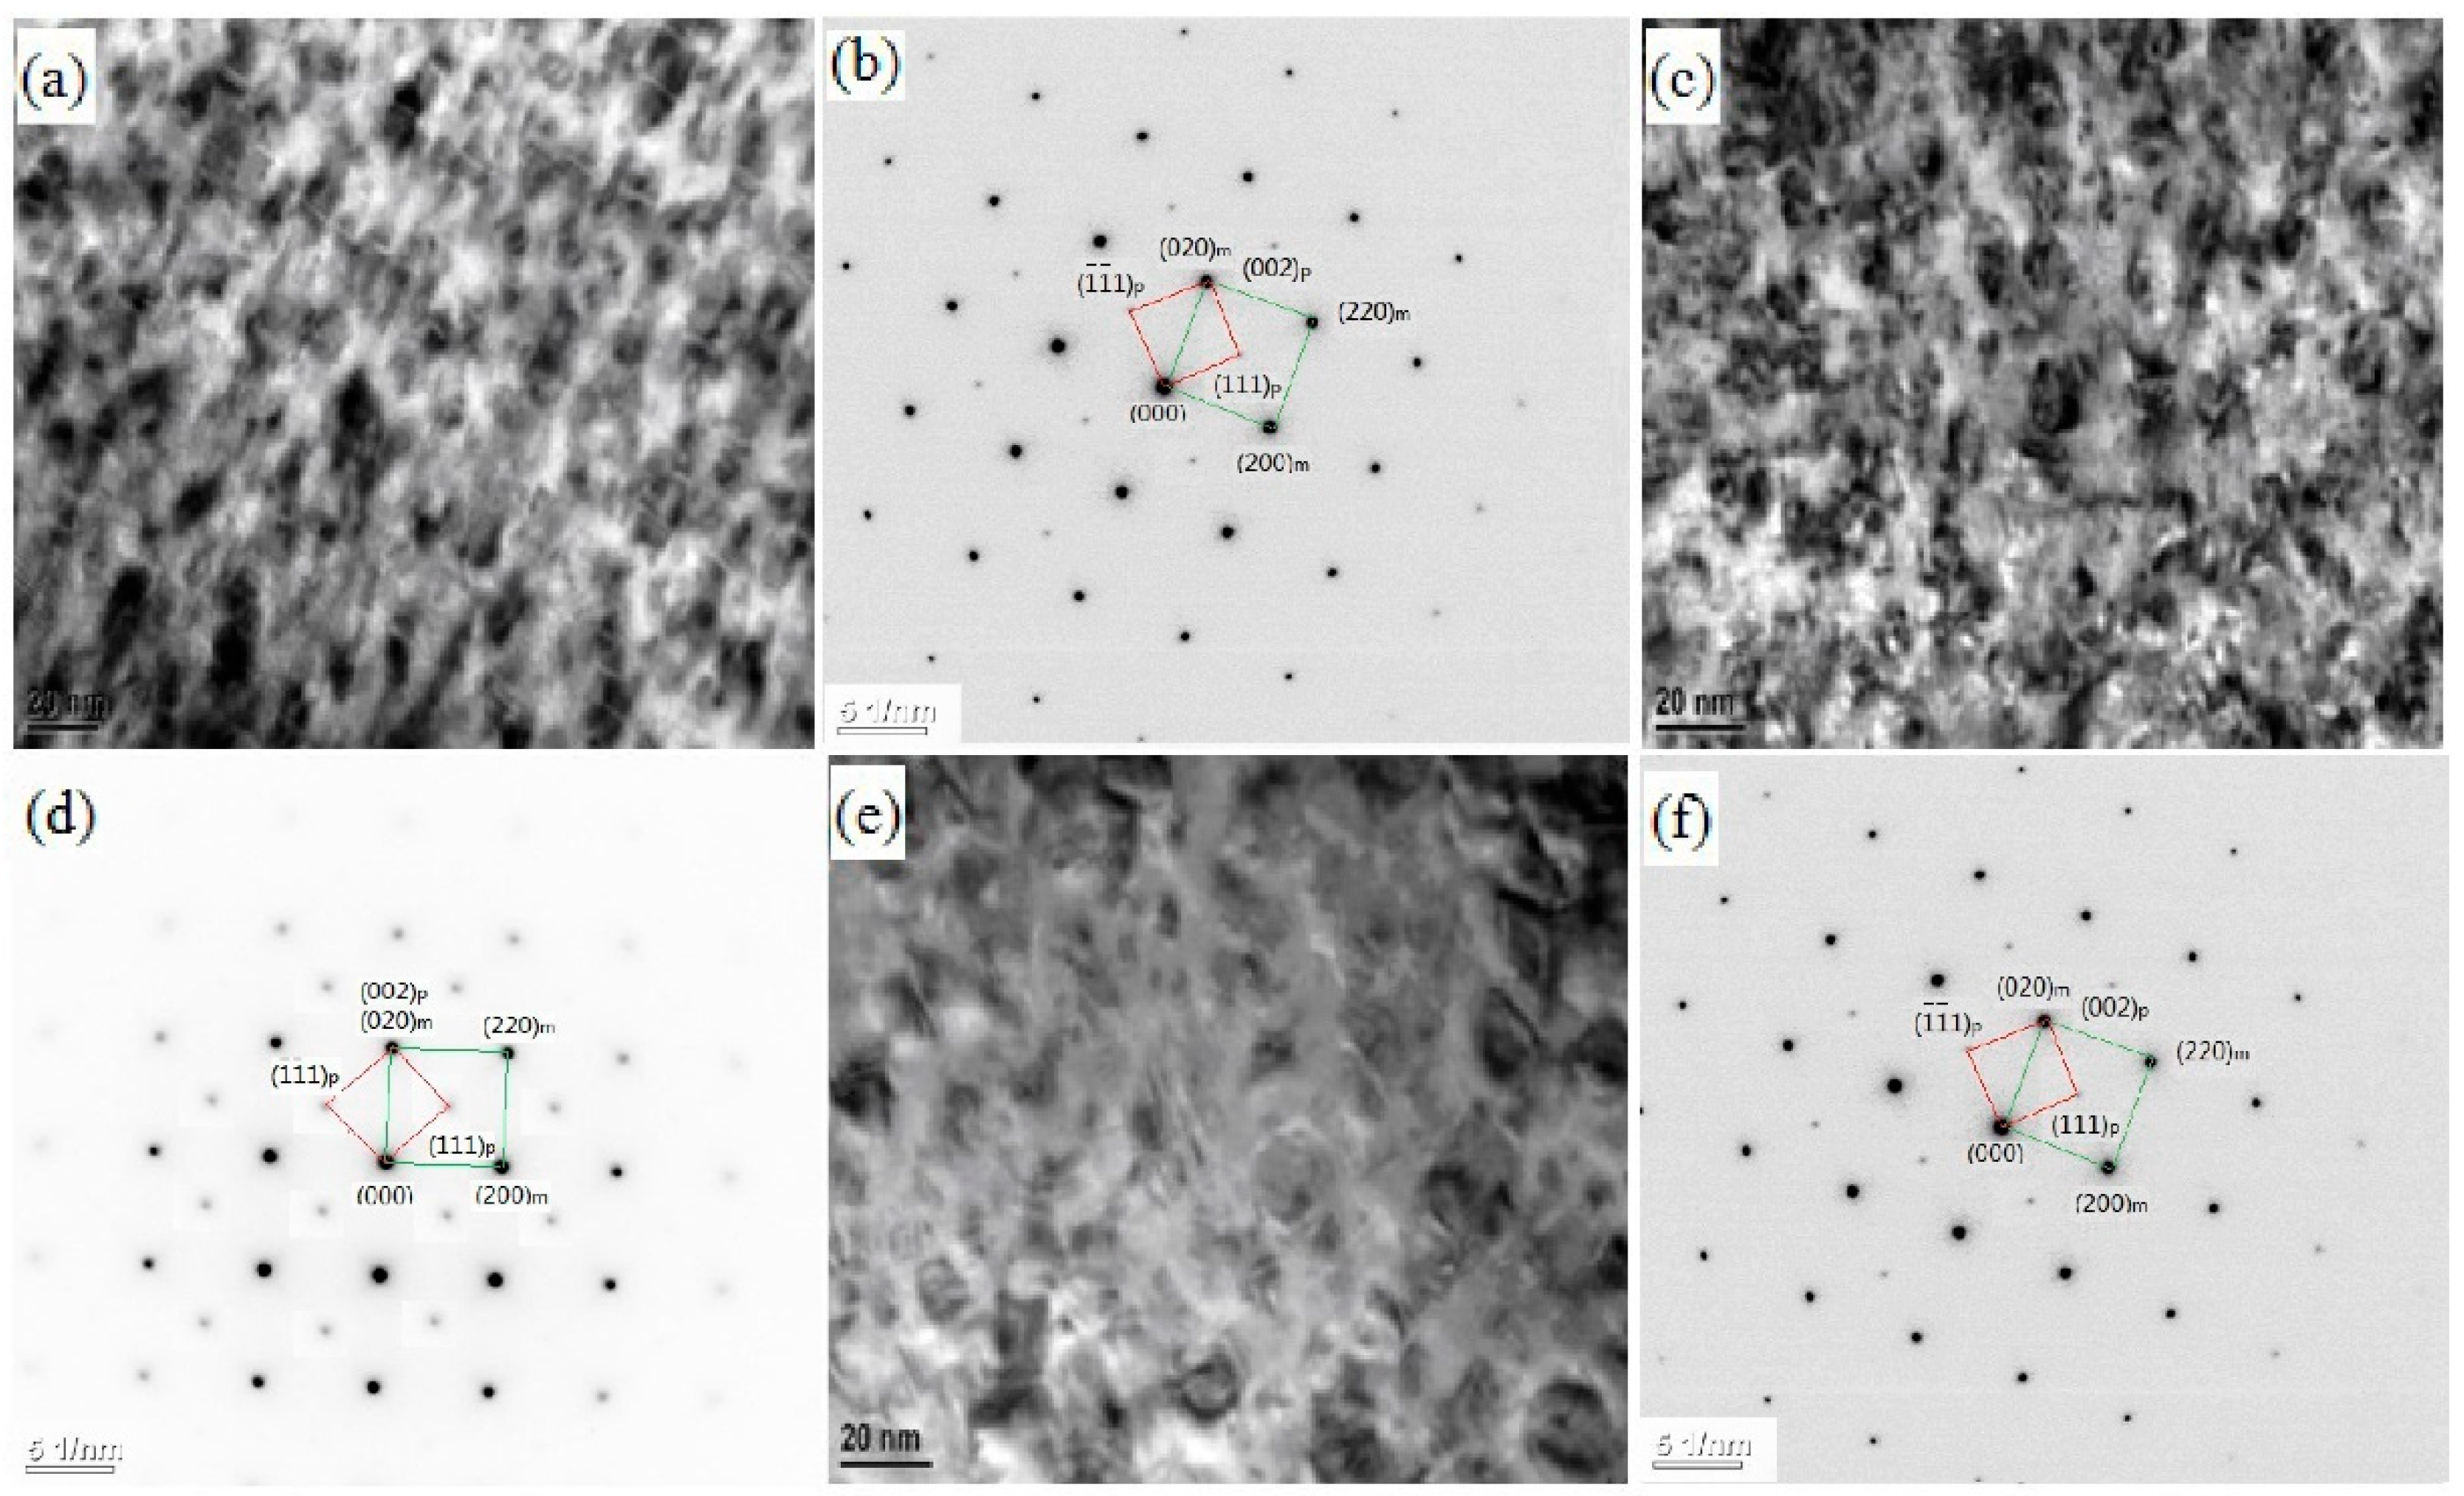
3.2. Aging Precipitation Evolution

Figure 4 is the TEM bright field images and selected area electron diffraction pattern (SADP) of the S1 alloy after aging at 500 °C for 1 hour. The spots have a modulated structure, which produced satellite reflections. Aged for 1 hour, since spinodal decomposition happened in the supersaturated solid solution, in the following process of aging, the affinity of Ni to Si was greater. Therefore, the process of the ordering was stronger and the super-lattice diffraction peak appeared. The super-lattice diffraction spots are between (000)m and (220)m in Figure 4c (at the position of ( 1 2 10)m), which means that the ordering occurred at the early stage of the aging process. From Figure 4c, it can be distinguished that the type of the ordering is DO22 ordering because the typical ( 1 2 10)m is unique to DO22 ordering [24]. A small amount of secondary precipitated particles with a size of approximately 5 nm can also be observed in the matrix. From the SADP in Figure 4b, the crystal structure of the precipitates was orthorhombic and consists of the δ-Ni2Si phase. From the analysis in Figure 4b,c, the crystal orientations between the copper based matrix and precipitates was determined as: [ 001 ] m / / [ 1 ¯ 10 ] p , ( 010 ) m / / ( 001 ) p .
TEM images and the electron diffraction patterns of selected areas and the calibration results of the S2, S3, and S4 alloy aged at 500 °C for 1 hour are shown in Figure 5. We can see that, compared with the traditional ternary Cu-Ni-Si alloy, more precipitates are formed in the early stage of the aging process in the Cu-Ni-Co-Si alloy part of the Ni atoms of which are replaced by Co addition. There are many dispersed precipitates in the matrix that are about 10 nm in size and are slightly larger than the precipitates of the S1 alloy. These phases are completely coherent with the matrix, which indicates that the movement of dislocations would be hindered by this type of precipitate. However, no satellite spots or ordered spots were found in the electron diffraction spots in the selected area at this stage. Therefore, we can speculate that the addition of Co may delay the formation of spinodal decomposition while the Ni element slightly accelerates the spinodal decomposition. According to the literature, this is because Co has a small solid solubility in Cu and easily combines with vacancies, which inhibits the movement of vacancies required for the formation of spinodal decomposition. The binding energy of Co and Si to form the second phase is larger than the binding energy of Ni and Si. In the early stage of aging of the Cu-Ni-Co-Si alloy, no microstructure was generated due to spinodal decomposition. Its corresponding satellite spots were found.
Figure 6 shows the transmission electron micrographs and select-area diffraction patterns of the S1 alloy after aging at 500 °C for 4 hours. Many precipitates can be observed in Figure 6a. From the diffraction pattern in Figure 6b, the modulated structure, which caused satellite reflections with the beam direction paralleling to [001]Cu, can be seen. A computer simulation (Figure 6c) of the diffraction pattern produced by δ-Ni2Si in a beam direction paralleling to [001]Cu was to help to index the diffraction pattern of Figure 6b. Based on the analysis, the satellite spots are due to spinodal decomposition and the spots is due to the precipitate of δ-Ni2Si. The relationship between the matrix and δ-Ni2Si can be expressed as [ 001 ] m / / [ 1 ¯ 10 ] p , ( 010 ) m / / ( 001 ) p .
TEM images and the SADP of selected areas and their calibration results of the S2, S3, and S4 alloy specimens aged at 500 °C for 4 hours are shown in Figure 7. After increasing the holding time, more second phase particles within the matrix were observed. The precipitates average diameters are about 20 nm. According to the analysis of SADP in Figure 7b,d,f, the precipitate can be determined as (Ni,Co)2Si. The relationship between the matrix and (Ni,Co)2Si is [ 001 ] m / / [ 1 ¯ 10 ] p , ( 010 ) m / / ( 001 ) p .

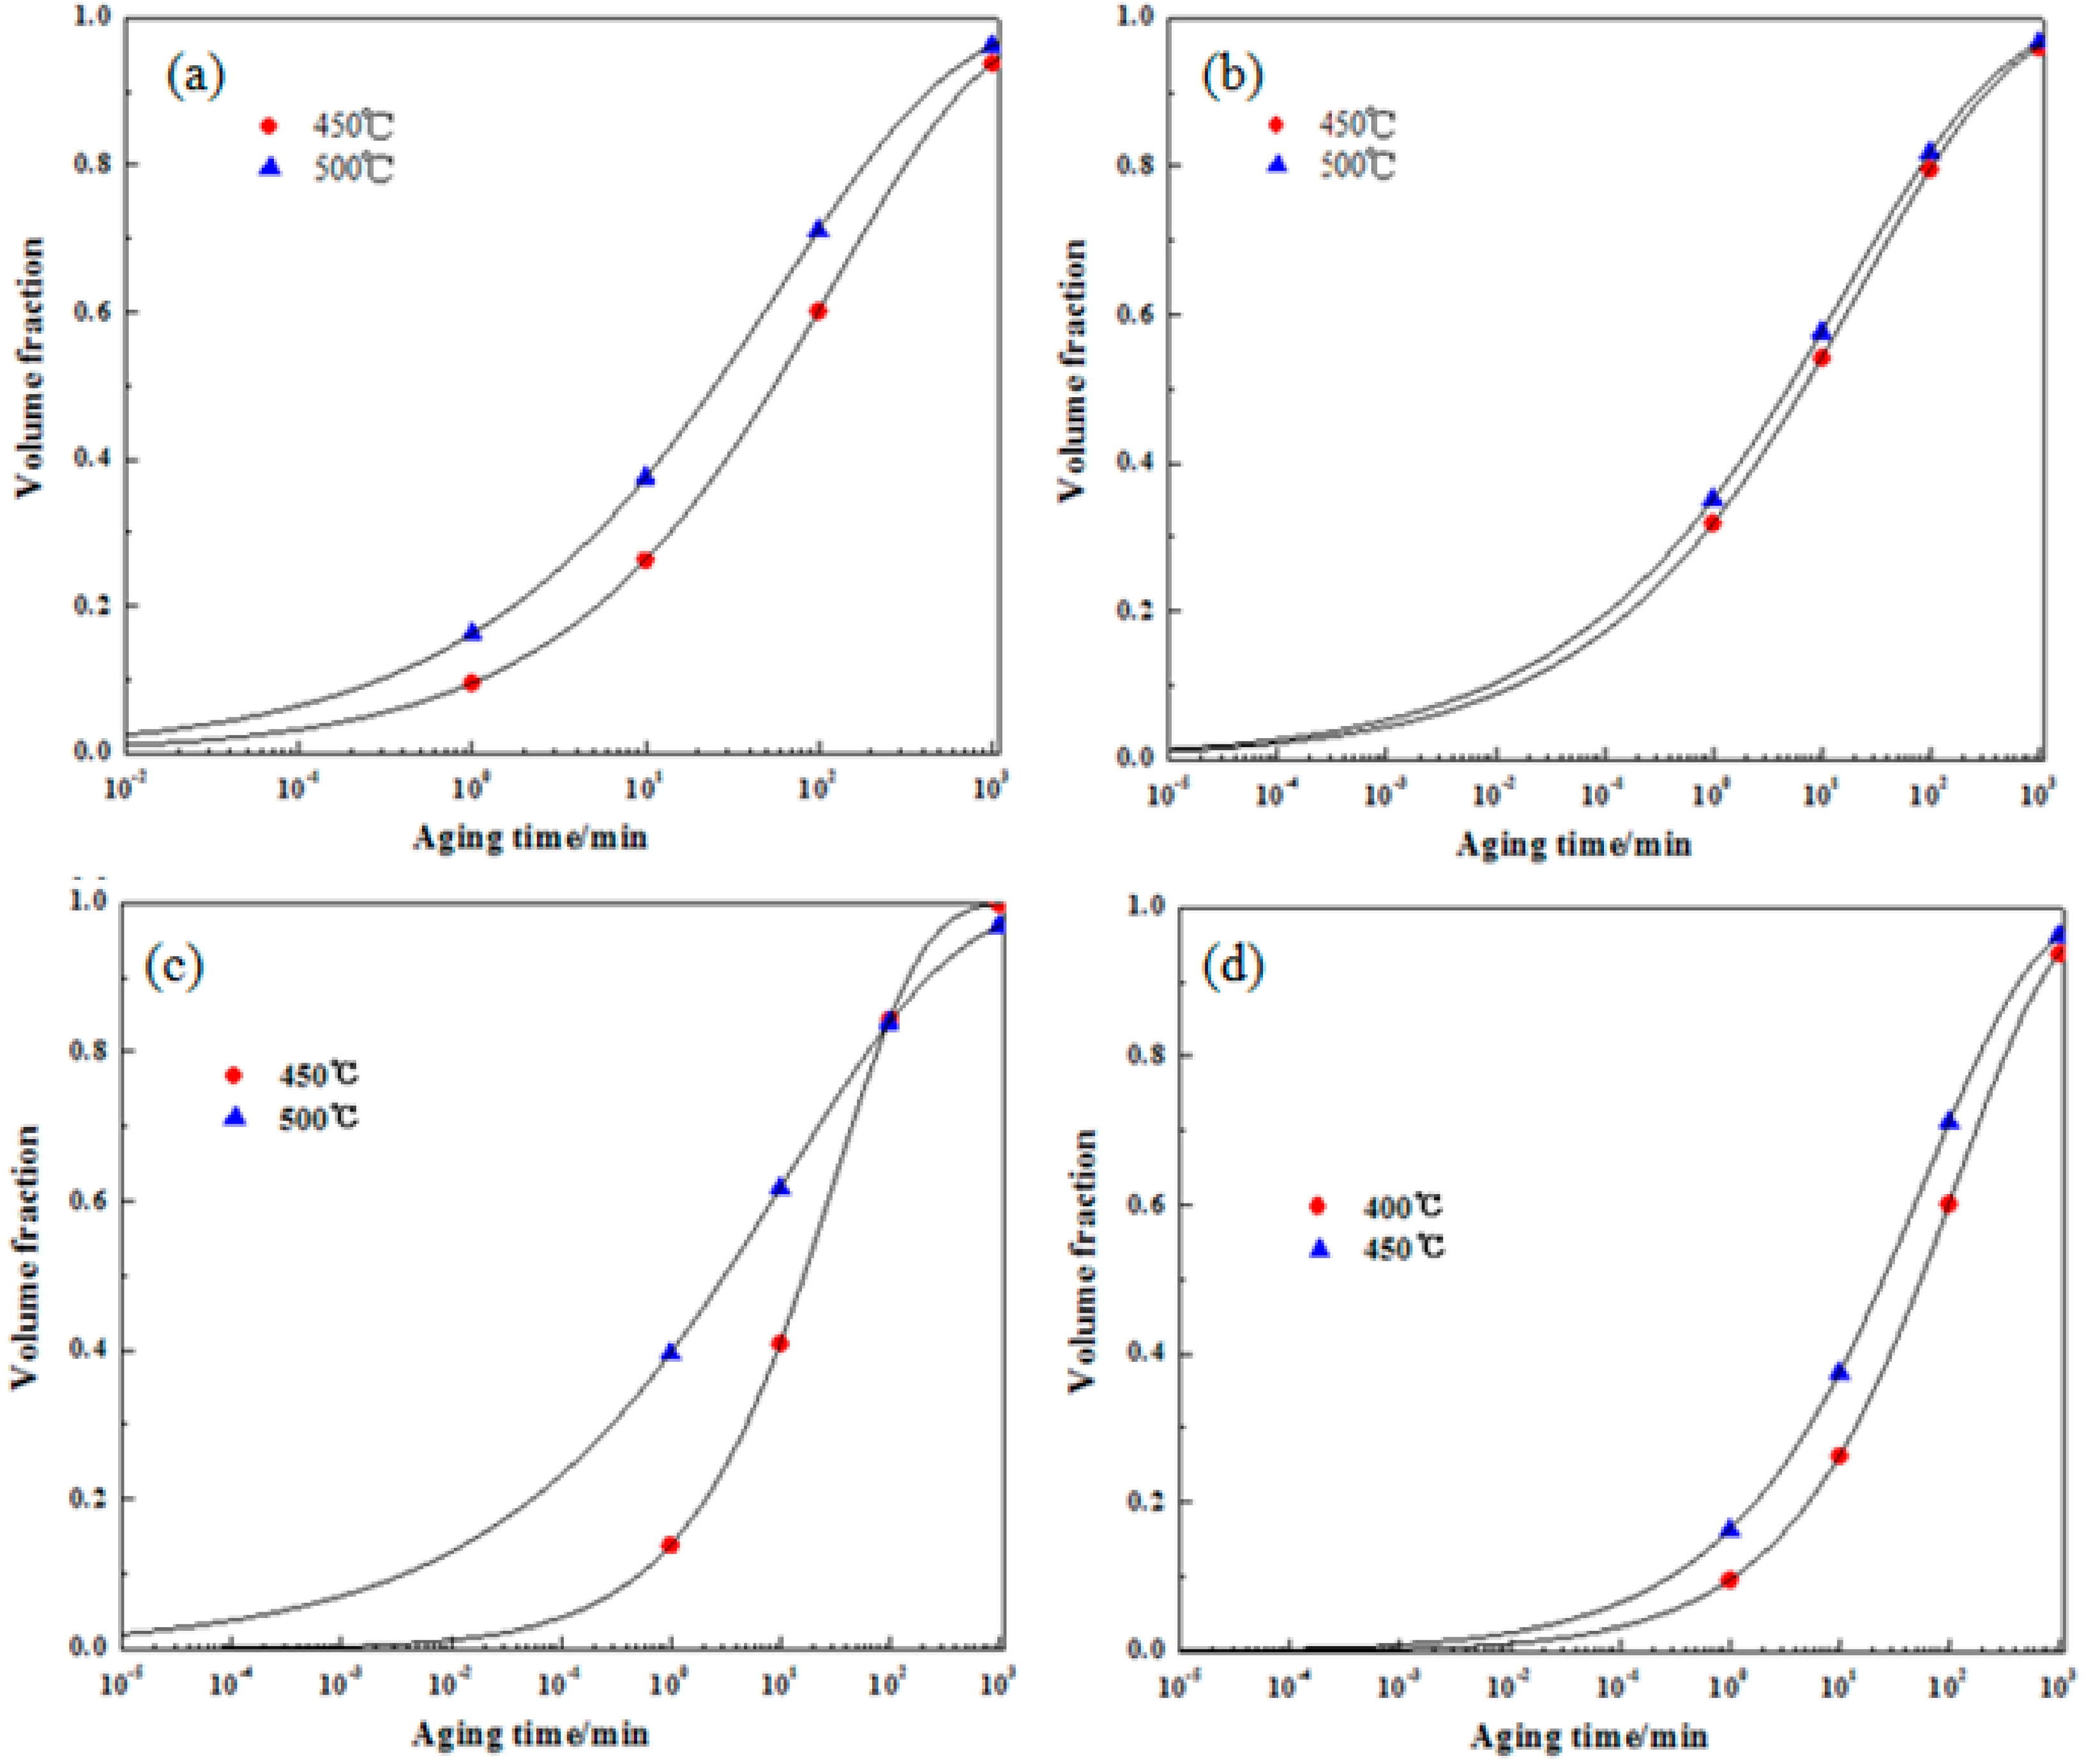
3.3. Phase Transformation Kinetics Equation

The electrical conductivity of the alloy in aging mainly depends on the purity of the copper matrix. Because of the sensitivity of electrical conductivity to the precipitation behavior, the kinetics of precipitated phase can be studied by measuring the change of the conductivity and the phase transformation kinetics can be calculated. During aging, the solute atoms precipitate from the solid solution to form the precipitates. Since the solute atoms such as Ni and Si cannot be completely extracted out of the copper matrix, the volume fraction of the precipitated can be expressed as [25]:
f = V/Vf
Vf is the equilibrium volume of the new phase in a unit volume of the matrix when precipitation is over and V is the volume of the new phase formed in a unit volume of the matrix during aging for a certain time t. Clearly, before phase transformation, V = 0 and f = 0. The initial state of electrical conductivity is σ0. After a long aging time, the phase transformation process ended and the electrical conductivity hardly increases and reaches the maximum σmax. So V = Vf and f = 1.
According to Matthissen’s rule, the electrical conductivity and volume fraction of precipitates has a linear relationship, which can be expressed as Equation (2) below [26].
σ = σ0 + Af
On the hypothesis of linearity, when transformation is finished, σ = σmax, A = σmax − σ0, and σ can be expressed by the equation below.
σ = σ0 + (σmax − σ0) f
The kinetics Avrami equation of phase transformation can be expressed by Equation (4) [27].
f = 1 − exp (−btn)
In this scenario, f is the volume fraction of precipitates, t is the aging time, and b and n are constants. According to Equations (2) and (4), the electrical conductivity equation can be expressed by the formula below.
σ = σ0 + (σmax − σ0) [1 − exp (−btn)]
Taking logarithms of both side of Equation (5), the following is calculated.
ln (ln (1/(1 − f))) = lnb + nlnt
With the date of Table 2 and Table 3, the relationship of ln (ln (1/(1 − f))) and lnt is shown in Figure 8. We can observe that the curve fitting diagram of ln (ln (1/(1 − f))) − lnt shows an approximately straight line. The n is the slope coefficient of the line and the lnt is the intercept.
Therefore, the phase transformation kinetics equation of the Cu-Ni-Co-Si alloy solid solution aged at 450 °C and 500 °C can be expressed as seen in Table 4.
The phase transformation kinetics curves are shown in Figure 9 and are based on Table 4. It can be seen that the experimentally obtained values agreed with the theoretical analysis.

4. Conclusions

(1)
There are various combinations of NixSiy phases in the Cu-rich isothermal section of the Cu-Ni-Si ternary alloy. With the increase of temperature, the Ni2Si two-phase region is widened. After the addition of the Co element, a part of the Ni atom is replaced to form a Co2Si phase, which increases as the content of the Co element increases.
(2)
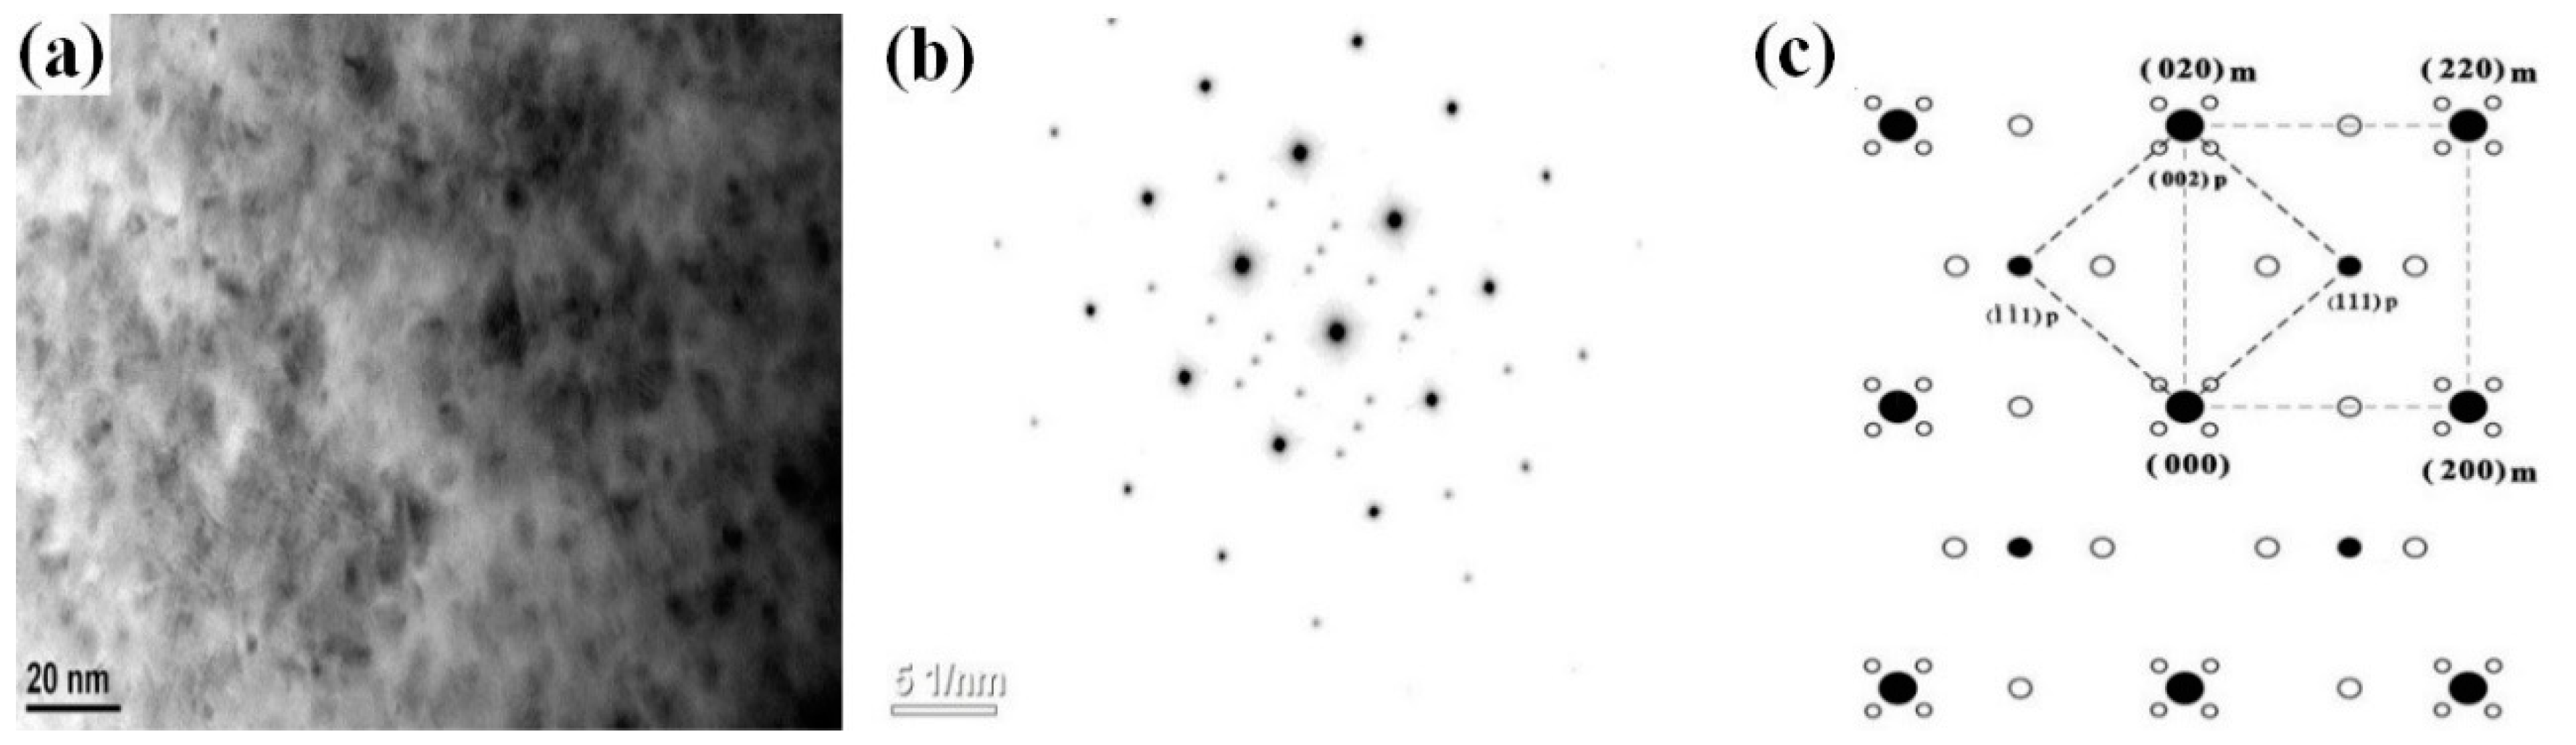
The addition of the Co element will delay the formation of spinodal decomposition during the aging of the Cu-Ni-Si alloy. After adding the Co element to the Cu-Ni-Si alloy to form the δ-Ni2Si phase, which has the [ 001 ] m / / [ 1 ¯ 10 ] p , ( 010 ) m / / ( 001 ) p orientation relationship with the matrix and will precipitate the (Ni,Co)2Si phase, the relationship between the matrix and (Ni,Co)2Si can be expressed as [ 001 ] m / / [ 1 ¯ 10 ] p , ( 010 ) m / / ( 001 ) p . In addition, with the aging time prolonged, the precipitates of the Cu-Ni-Si alloy with a high content of the Co element is more likely to grow.
(3)
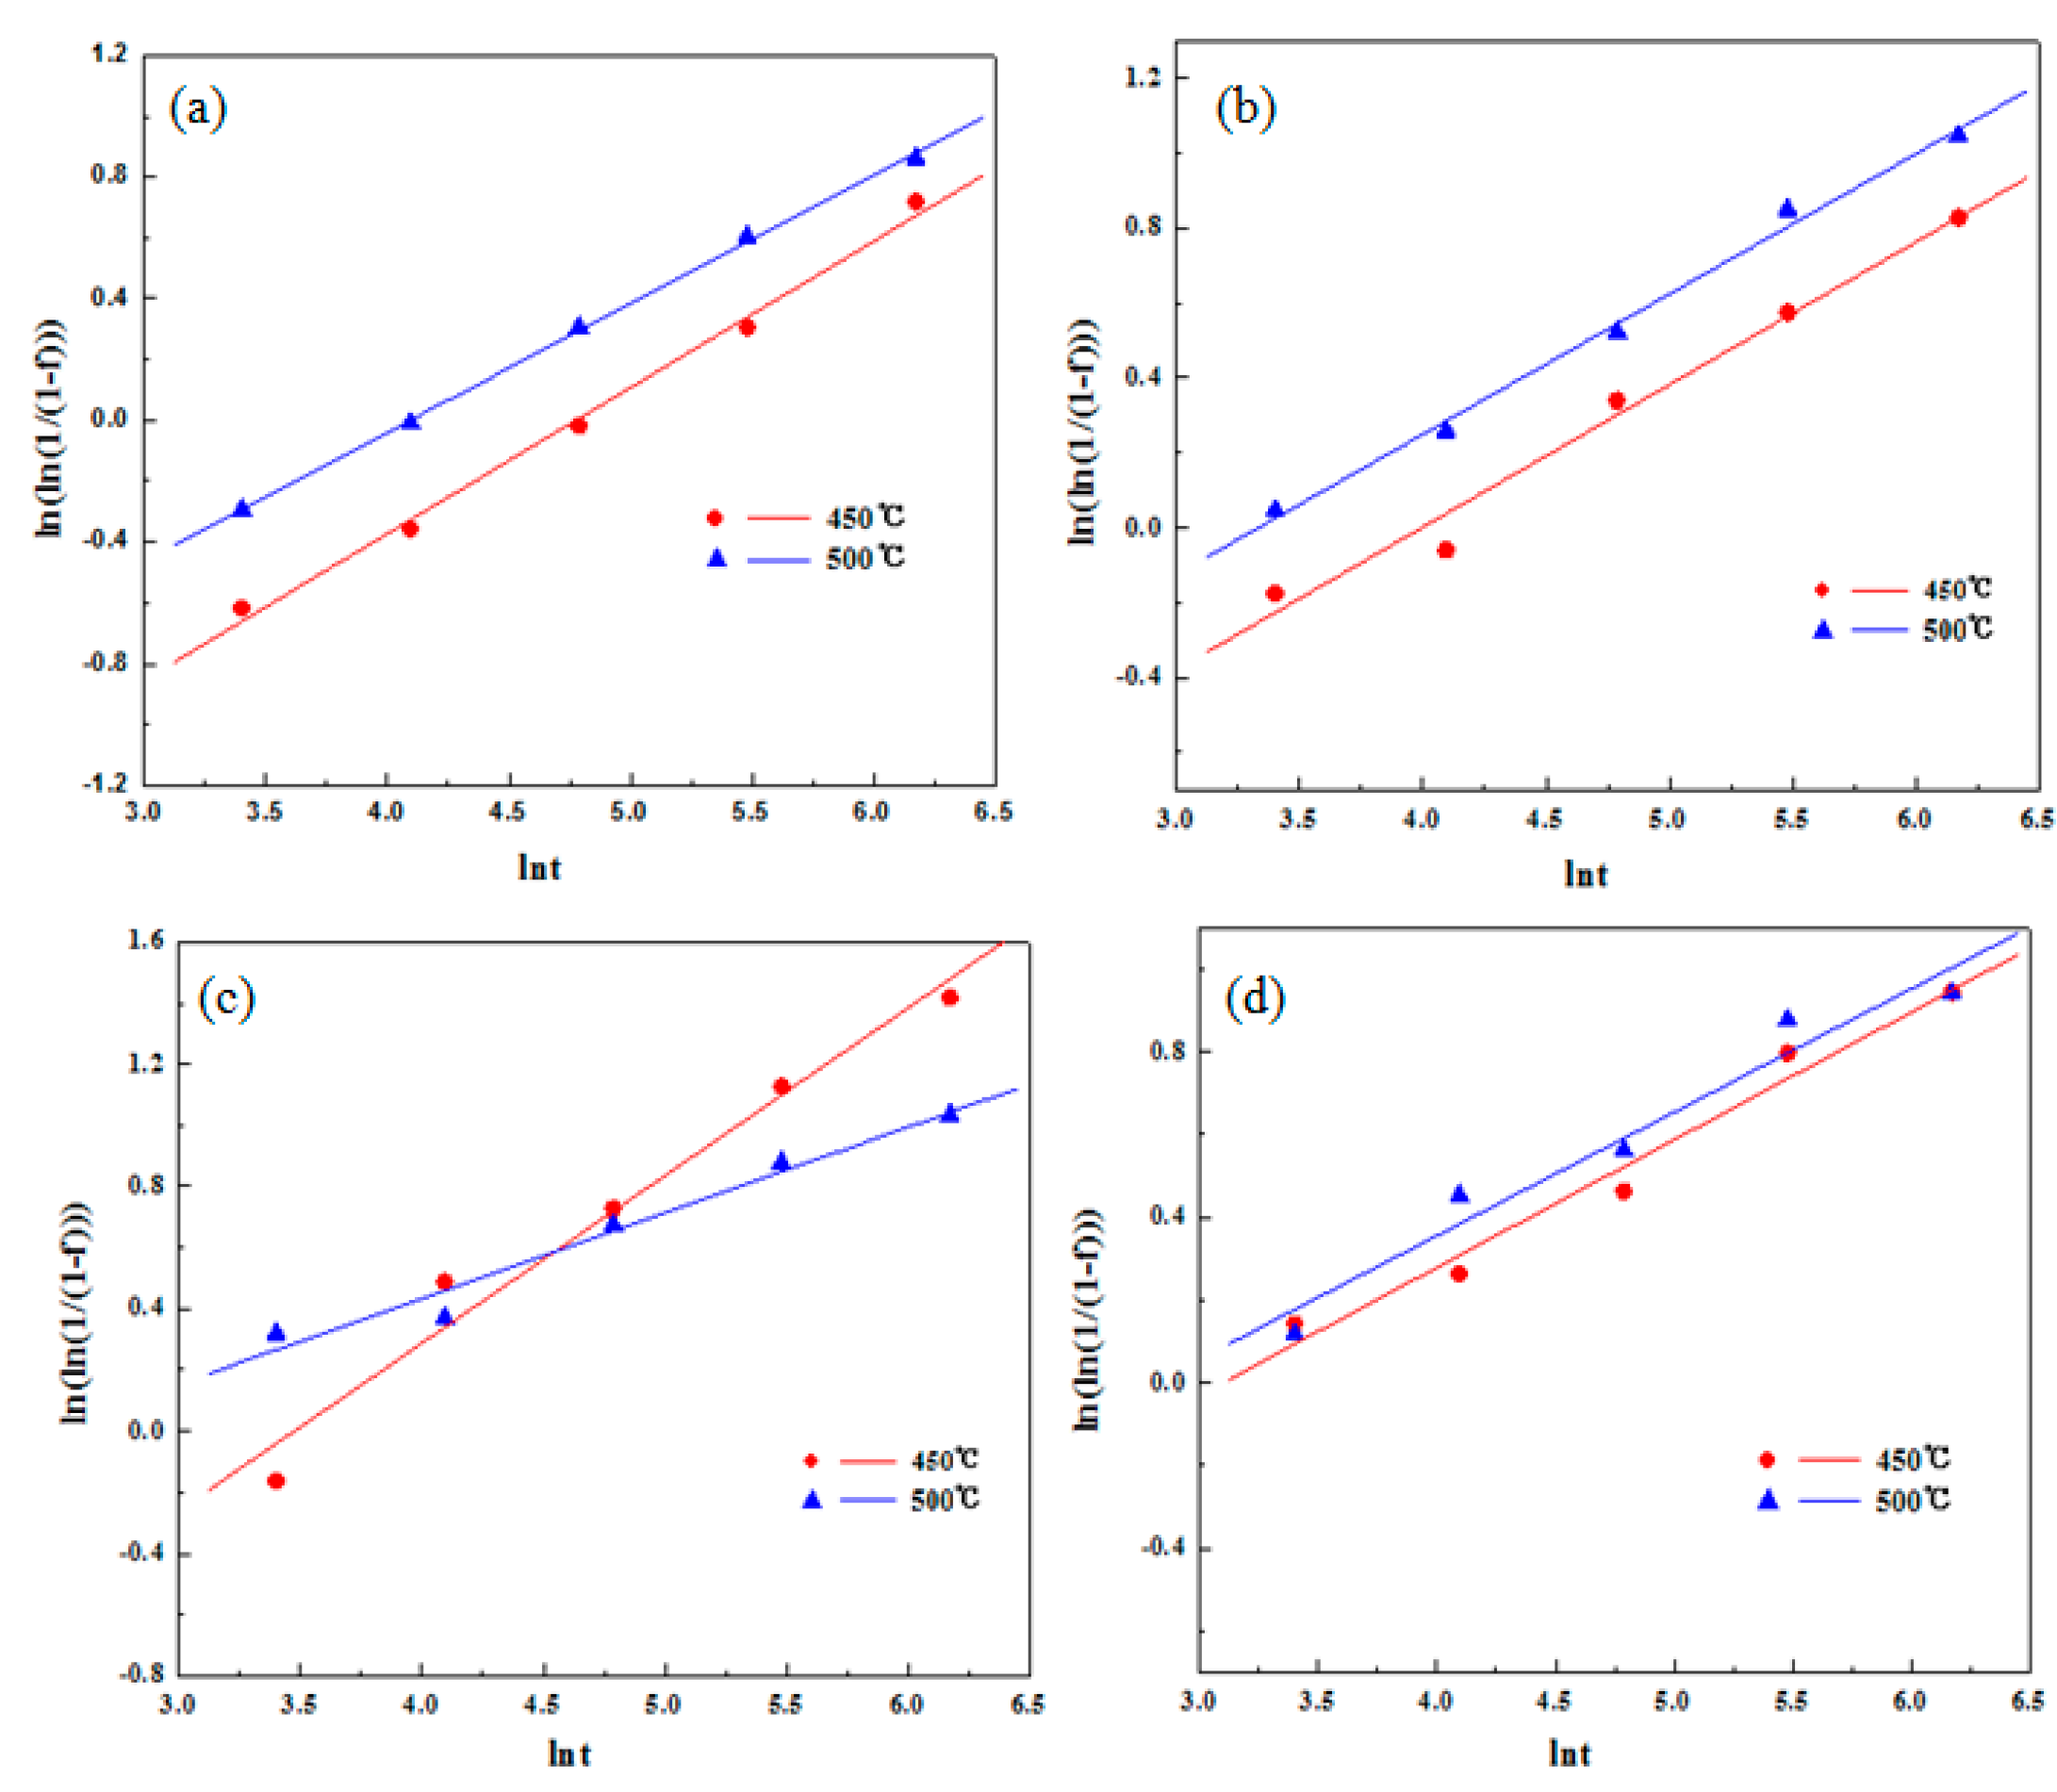
The precipitation kinetics of the Cu-Ni-Si alloy at 450 °C and 500 °C was calculated. The kinetic equation agrees with the experimental values and it can be seen from the precipitation kinetic curves that the addition of Co can promote the precipitation rate of the precipitated phase.

Author Contributions

Data curation, J.H. Investigation, J.C. Software, H.X. Methodology, Z.L. Supervision, X.X. Writing & original draft, J.Z.

Funding

National Natural Science Foundation of China (No. 51561008 and 51461017). Key Program of Jiangxi Natural Science Foundation for Young Scholar (No. 20171ACB21044 and 20161BBE50030).

Acknowledgements

This work was supported by the National Natural Science Foundation of China (No. 51561008 and 51461017) and the Key Program of Jiangxi Natural Science Foundation for Young Scholar (No. 20171ACB21044 and 20161BBE50030). Special thanks are given to Professor Liu Ruiqing and Wang Hang for enlightening discussions.

Conflicts of Interest

The authors declare no conflicts of interest.

References

  1. Hatano, T. Cu-Ni-Si System Alloy. U.S. Patent 20100000637A1, 21 September 2010. [Google Scholar]
  2. Zhao, D.M.; Dong, Q.M.; Liu, P.; Kang, B.X.; Huang, J.L. Transformation and strengthening of early stage of aging in Cu-3.2Ni-0.75Si alloy. Chin. J. Nonferr. Met. 2002, 12, 1167–1171. [Google Scholar]
  3. Monzen, R.; Watanabe, C. Microstructure and mechanical properties of Cu-Ni-Si alloys. Mate. Sci. Eng. A 2008, 483–484, 117–119. [Google Scholar] [CrossRef]
  4. Lei, Q.; Li, Z.; Xiao, T.; Pang, Y.; Xiang, Z.Q.; Qiu, W.T.; Xiao, Z. A new ultrahigh strength Cu-Ni-Si alloy. Intermetallics 2013, 42, 77–84. [Google Scholar] [CrossRef]
  5. Liu, H.Y.; Liu, P.; Tian, B.H.; Jia, S.G.; Ren, F.Z.; Zhang, Y. Development of Cu-Ni-Si alloy for lead frame. Mater. Res. Appl. 2007, 1, 260–264. [Google Scholar]
  6. Li, D.M.; Wang, Q.; Jiang, B.B.; Li, X.; Zhou, W.; Dong, C.; Wang, H.; Chen, Q. Minor-alloyed Cu-Ni-Si alloys with high hardness and electric conductivity designed by a cluster formula approach. Prog. Nat. Sci. Mater. Int. 2017, 27, 467–473. [Google Scholar] [CrossRef]
  7. Chen, Z.P.; Xiang, C.J.; Li, H.Q. The Oxide Defect of C70250 Alloy. Adv. Mater. Res. 2014, 936, 1168–1172. [Google Scholar] [CrossRef]
  8. Kuhn, A.K.; Käufler, A.; Ringhand, D.; Theobald, S. A new high performance copper based alloy for electro-mechanical connectors. Materialwiss. Werkstofftech. 2007, 38, 624–634. [Google Scholar] [CrossRef]
  9. Xiao, X.P.; Yi, Z.Y.; Chen, T.T.; Liu, R.; Wang, H. Suppressing spinodal decomposition by adding Co into Cu-Ni-Si alloy. J. Alloys Compd. 2016, 660, 178–183. [Google Scholar] [CrossRef]
  10. Witusiewicz, V.T.; Arpshofen, I.; Seifert, H.J.; Sommer, F.; Aldinger, F. Enthalpy of mixing of liquid and undercooled liquid ternary and quaternary Cu-Ni-Si-Zr alloys. J. Alloys Compd. 2002, 337, 155–167. [Google Scholar] [CrossRef]
  11. Zhao, D.M.; Dong, Q.M.; Liu, P.; Kang, B.X.; Huang, J.L.; Jin, Z.H. Structure and strength of the age hardened Cu-Ni-Si alloy. Mater. Chem. Phys. 2003, 79, 81–86. [Google Scholar] [CrossRef]
  12. Qian, L.; Zhou, L.; Yang, G.; Peng, X.; Derby, B. Microstructure and mechanical properties of a high strength Cu-Ni-Si alloy treated by combined aging processes. J. Alloys Compd. 2017, 695, 2413–2423. [Google Scholar]
  13. Semboshi, S.; Sato, S.; Iwase, A.; Takasugi, T. Discontinuous precipitates in age-hardening Cu-Ni-Si alloys. Mater. Charact. 2016, 115, 39–45. [Google Scholar] [CrossRef]
  14. Semboshi, S.; Ishikuro, M.; Iwase, A.; Takasugi, T. Microstructural Subsequence and Phase Equilibria in an Age-Hardenable Cu-Ni-Si Alloy. Mater. Trans. 2017, 59, 182–187. [Google Scholar] [CrossRef]
  15. Chalon, J.; Guérin, J.D.; Dubar, L.; Dubois, A.; Puchi-Cabrera, E.S. Characterization of the hot-working behavior of a Cu-Ni-Si alloy. Mater. Sci. Eng. A 2016, 667, 77–86. [Google Scholar] [CrossRef]
  16. Zhang, Y.; Volinsky, A.A.; Xu, Q.Q.; Chai, Z.; Tian, B.; Liu, P.; Tran, H.T. Deformation Behavior and Microstructure Evolution of the Cu-2Ni-0.5Si-0.15Ag Alloy During Hot Compression. Met. Mater. Trans. A 2015, 46, 5871–5876. [Google Scholar] [CrossRef]
  17. Watanabe, C.; Takeshita, S.; Monzen, R. Effects of Small Addition of Ti on Strength and Microstructure of a Cu-Ni-Si Alloy. Met. Mater. Trans. A 2015, 46, 2469–2475. [Google Scholar] [CrossRef] [Green Version]
  18. Li, S.H.; Li, Z.; Lei, Q.; Wang, M.P.; Sheng, L.N.; Pan, Z.Y.; Liu, H.Q. Microstructure and Properties of Superhigh Strength Cu-Ni-(Al)-Si Alloy. Rare Met. Mater. Eng. 2015, 44, 1427–1431. [Google Scholar]
  19. Wang, H.S.; Chen, H.G.; Gu, J.W.; Hsu, C.E.; Wu, C.Y. Improvement in strength and thermal conductivity of powder metallurgy produced Cu-Ni-Si-Cr alloy by adjusting Ni/Si weight ratio and hot forging. J. Alloys Compd. 2015, 633, 59–64. [Google Scholar] [CrossRef]
  20. Lei, J.-G.; Liu, P. The effects of aging precipitation on the recrystallization of CuNiSi alloy. Wuhan Univ. Technol. Mater. Sci. Ed. 2005, 20, 21–25. [Google Scholar]
  21. Cheng, J.Y.; Tang, B.B.; Yu, F.X.; Shen, B. Evaluation of nanoscaled precipitates in a Cu-Ni-Si-Cr alloy during aging. J. Alloys Compd. 2014, 614, 189–195. [Google Scholar] [CrossRef]
  22. Wang, L.; Sun, Y.S.; Fu, X.Q.; Xue, F.; Chen, X. Microstructure and properties of Cu-Ni-Si based alloys for lead frame. J. Southeast Univ. 2005, 35, 729–732. [Google Scholar]
  23. Kim, Y.G.; Seong, T.Y.; Han, J.H.; Ardell, A.J. Effect of heat treatment on precipitation behaviour in a Cu-Ni-Si-P alloy. J. Mater. Sci. 1986, 21, 1357–1362. [Google Scholar] [CrossRef]
  24. Bendersky, L.A.; Biancaniello, F.S.; Williams, M.E. Evolution of the two-phase microstructure L12+DO22 in near-Eutectoid Ni3(Al,V) alloy. J. Mater. Res. 1994, 9, 3068–3082. [Google Scholar] [CrossRef]
  25. Guy, A.G.; Hren, J.J. Elements of Physical Metallurgy; Addison-Wesley Publishing Company: Boston, MA, USA, 1956. [Google Scholar]
  26. Nagarjuna, S.; Balasubramanian, K.; Sarma, D.S. Effect of prior cold work on mechanical properties, electrical conductivity and microstructure of aged Cu-Ti alloys. J. Mater. Sci. 1999, 34, 2929–2942. [Google Scholar] [CrossRef]
  27. Fernee, H.; Nairn, J.; Atrens, A. Precipitation hardening of Cu-Fe-Cr alloys part I Mechanical and electrical properties. J. Mater. Sci. 2001, 36, 2711–2719. [Google Scholar] [CrossRef]
Figure 1. Cu-rich isothermal section of the Cu-Ni-Si ternary alloy (a) 450 °C. (b) 500 °C. (c) 550 °C.
Crystals 08 00435 g001
Figure 2. The equilibrium phase of the Co-Ni-Co-Si alloy with Ni, Co contents (a) 400 °C. (b) 450 °C. (c) 500 °C.
Crystals 08 00435 g002
Figure 3. Relationship between the mass fraction of the equilibrium precipitation phase and the temperature of the test alloy (a) S1. (b) S2. (c) S3. (d) S4.
Crystals 08 00435 g003
Figure 4. TEM of the S1 alloy aged at 500 °C for 1 hour with a zone axis of [001]Cu (a) Bright-image. (b) SADP. (c) Illustration of SADP.
Crystals 08 00435 g004
Figure 5. TEM of alloy aged at 500 °C for 1 hour with a zone axis of [−112]Cu: (a) Bright image of the S2 alloy. (b) SADP of (a) (c) Bright image of the S3 alloy. (d) SADP of (c) (e) Bright image of the S4 alloy. (f) SADP of (e).
Crystals 08 00435 g005
Figure 6. TEM of S1 alloy aged at 500 °C for 4 hours with a zone axis of [001]Cu: (a) Bright-image. (b) SADP. (c) Result of SADP.
Crystals 08 00435 g006
Figure 7. TEM of alloy aged at 500 °C for 4 hours with a zone axis of [001]Cu: (a) Bright image of the S2 alloy. (b) SADP of (a) (c) Bright image of the S3 alloy. (d) SADP of (c) (e) Bright image of the S4 alloy. (f) SADP of (e).
Crystals 08 00435 g007
Figure 8. The relation between volume fraction and transformation time (a) S1 alloy. (b) S2 alloy. (c) S3 alloy. (d) S4 alloy.
Crystals 08 00435 g008
Figure 9. Kinetic curves of phase transformation of the experimental alloys (a) S1 alloy. (b) S2 alloy. (c) S3 alloy. (d) S4 alloy.
Crystals 08 00435 g009
Table 1. Composition for the experimental alloy (Wt.%).
SampleCuNiCoSiNi/Co
S1Bal.2.80.00.60.00
S2Bal.1.80.80.63.00
S3Bal.1.41.20.61.17
S4Bal.1.21.40.60.86
Table 2. The electrical conductivity and new phase volume transformation ratio of precipitate for alloys aged at 450 °C for multiple periods of time.
t/minS1S2S3S4
σ/IACS%f/%σ/IACS%f/%σ/IACS%f/%σ/IACS%f/%
017.60.0015.20.0014.50.0019.60.00
302441.6728.656.7835.868.3944.768.39
6027.450.3829.661.0244.472.7546.372.75
12029.662.503375.424779.5648.879.56
24031.674.2434.883.055089.1052.389.10
48034.387.1236.489.8351.192.3753.592.37
96035.6100.0038.8100.0051.7100.0056.3100.00
Table 3. The electrical conductivity and new phase volume transformation ratio of precipitate for alloys aged at 500 °C for multiple periods of time.
t/minS1S2S3S4
σ/IACS%f/%σ/IACS%f/%σ/IACS%f/%σ/IACS%f/%
017.60.00 15.20.00 14.50.00 19.60.00
3033.352.51 3264.86 44.374.69 4567.55
6036.462.88 3472.59 4576.44 49.479.26
12039.874.25 36.381.47 48.885.96 50.782.71
24042.783.95 38.690.35 50.890.98 53.890.96
48044.790.64 39.694.21 5293.98 54.392.29
96047.5100.00 41.1100.00 54.4100.00 57.2100.00
Table 4. The Avrami-equation of phase transformation of alloys.
Alloy450 °C500 °C
S1f = 1 − exp (−0.1007t0.4807)f = 1 − exp (−0.1776t0.4223)
S2f = 1 − exp (−0.2184t0.3806)f = 1 − exp (−0.2870t0.3744)
S3f = 1 − exp (−0.1488t0.5481)f = 1 − exp (−0.5035t0.28)
S4f = 1 − exp (−0.3839t0.3089)f = 1 − exp (−0.4322t0.2985)

