Article

NMR Crystallography of the Polymorphs of Metergoline

Institute of Macromolecular Chemistry, Czech Academy of Sciences, Heyrovsky sq. 2, 162 06 Prague 6, Czech Republic
*
Author to whom correspondence should be addressed.
Crystals 2018, 8(10), 378; https://doi.org/10.3390/cryst8100378
Submission received: 5 September 2018 / Revised: 21 September 2018 / Accepted: 22 September 2018 / Published: 25 September 2018
(This article belongs to the Special Issue NMR Crystallography)

Abstract

:
Two polymorphs of the drug compound metergoline (C25H29N3O2) were investigated in detail by solid-state NMR measurements. The results have been analysed by an advanced procedure, which uses experimental input together with the results of quantum chemical calculations that were performed for molecular crystals. In this way, it was possible to assign the total of 40 1H–13C correlation pairs in a highly complex system, namely, in the dynamically disordered polymorph with two independent molecules in the unit cell of a large volume of 4234 Å3. For the simpler polymorph, which exhibits only small-amplitude motions and has just one molecule in the unit cell with a volume of 529.0 Å3, the values of the principal elements of the 13C chemical shift tensors were measured. Additionally, for this polymorph, a set of crystal structure predictions were generated, and the {13C, 1H} isotropic and 13C anisotropic chemical shielding data were computed while using the gauge-including projector augmented-wave approach combined with the “revised Perdew-Burke-Ernzerhof“ exchange-correlation functional (GIPAW-RPBE). The experimental and theoretical results were combined in an application of the newly developed strategy to polymorph discrimination. This research thus opens up new routes towards more accurate characterization of the polymorphism of drug formulations.

1. Introduction

NMR crystallography [1] is an important concept in structural studies of solid-phase systems and is complementary to X-ray diffraction (XRD) techniques. One of its variants directly relates solid-state NMR (SSNMR) measurements of interatomic distances to the parameters of crystal structures [2]. More frequently, however, extended sets of SSNMR data are combined with the theoretical modeling of periodic arrangements [3] and with quantum chemical predictions of the NMR chemical shielding and quadrupolar parameters [4]. This approach was the subject of recent reviews by Ashbrook et al. [5] and by Bryce [6]. Additionally, some of its notable applications were most recently discussed by Brown et al. [7] and by Emsley et al. [8]. Our group successfully employed NMR crystallography in the structural elucidation/refinement of framework materials [9], bioactive compounds [10], and drugs [11,12,13]. Here, further extensions of the NMR crystallography methodology are described, together with results that were obtained for the two known crystal modifications (polymorphs) of the active pharmaceutical ingredient (API) metergoline, which is an established serotonin antagonist [14].
The structure of the polymorph of metergoline denoted by I (see below) is available from a single-crystal (SC) XRD study [15]. This polymorph was previously investigated [16] by SSNMR measurements and by various density-functional theory (DFT)-based approaches to the description of structural and NMR-spectroscopic parameters. Importantly, the full assignment of the 1H-13C heteronuclear correlation (HETCOR) signals was achieved. Both plane-wave (PW) DFT methods with periodic boundary conditions being imposed to treat the structure as an infinite crystal and the cluster model [17] were applied. The experimental and computational results were then combined, and a method for the quantification of the similarity of measured and predicted two-dimensional (2D) HETCOR spectra was proposed (this method was later extended to other 2D spectra [18] and subsequently applied to several systems, including naproxen [19] and the oligopeptides model of silk fibroin [20]). The structure of the metergoline polymorph denoted by II (see Section 2.1) was solved by both powder and SC XRD and underwent preliminary characterization by SSNMR [21]. Because of the factors that are discussed below, the task of elucidating polymorph II is significantly more complicated than that for polymorph I. Thus, a number of additional SSNMR measurements were carried out for polymorph II, and the results were analyzed with the aid of PW DFT calculations. In particular, an application of the abovementioned method to the assignment of 2D spectra is presented in detail.
This group proposed a strategy for selecting the correct candidate structure(s) from a set of crystal structure predictions (CSPs) that were based on statistical evaluation of the level of agreement between theoretical and experimental values of the {1H, 13C} isotropic chemical shifts [12]. Most recently, this approach was expanded to include the 15N chemical shifts as well, and the selection procedure was partially automated [13]. In this work, measurements and PW DFT calculations of the principal elements of the 13C chemical shift tensors (CSTs) were carried out for polymorph I, and the data were included (together with the explicitly assigned 13C and 1H isotropic chemical shifts) in the process of discriminating between structural models in order to exclude incorrect CSPs. This enhancement represents the next step in increasing the reliability of NMR crystallography for the verification of crystal structures. The practical side of the evaluation procedure is documented, which involves the presentation of experimental NMR data, together with their theoretical counterparts predicted for all the considered CSPs.

2. Materials and Methods

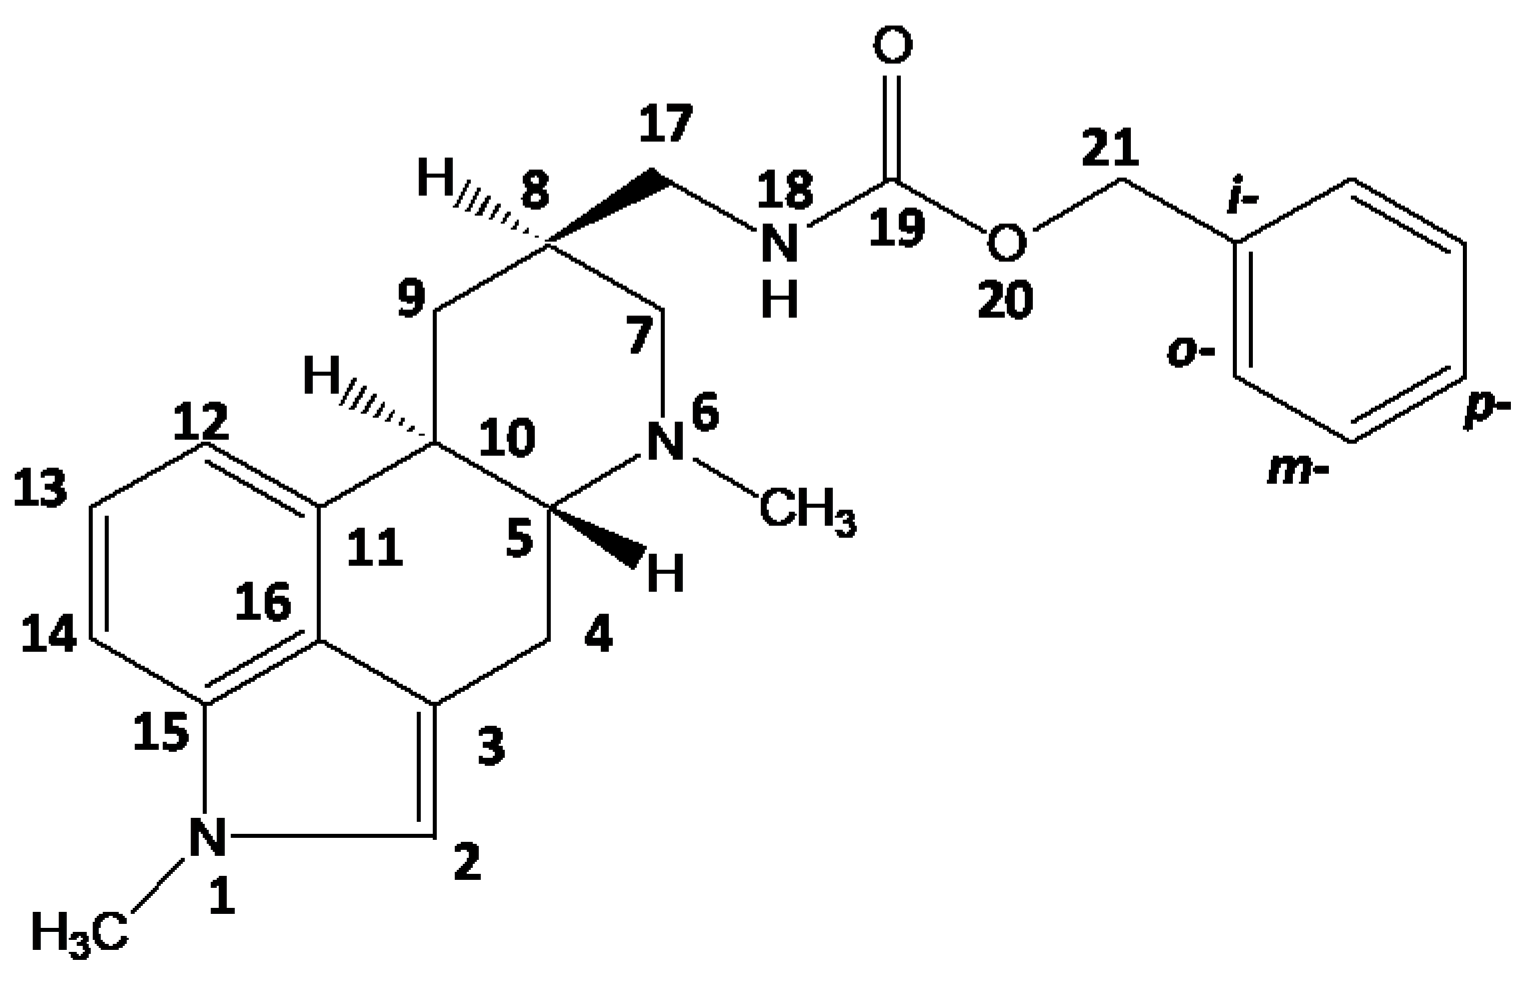
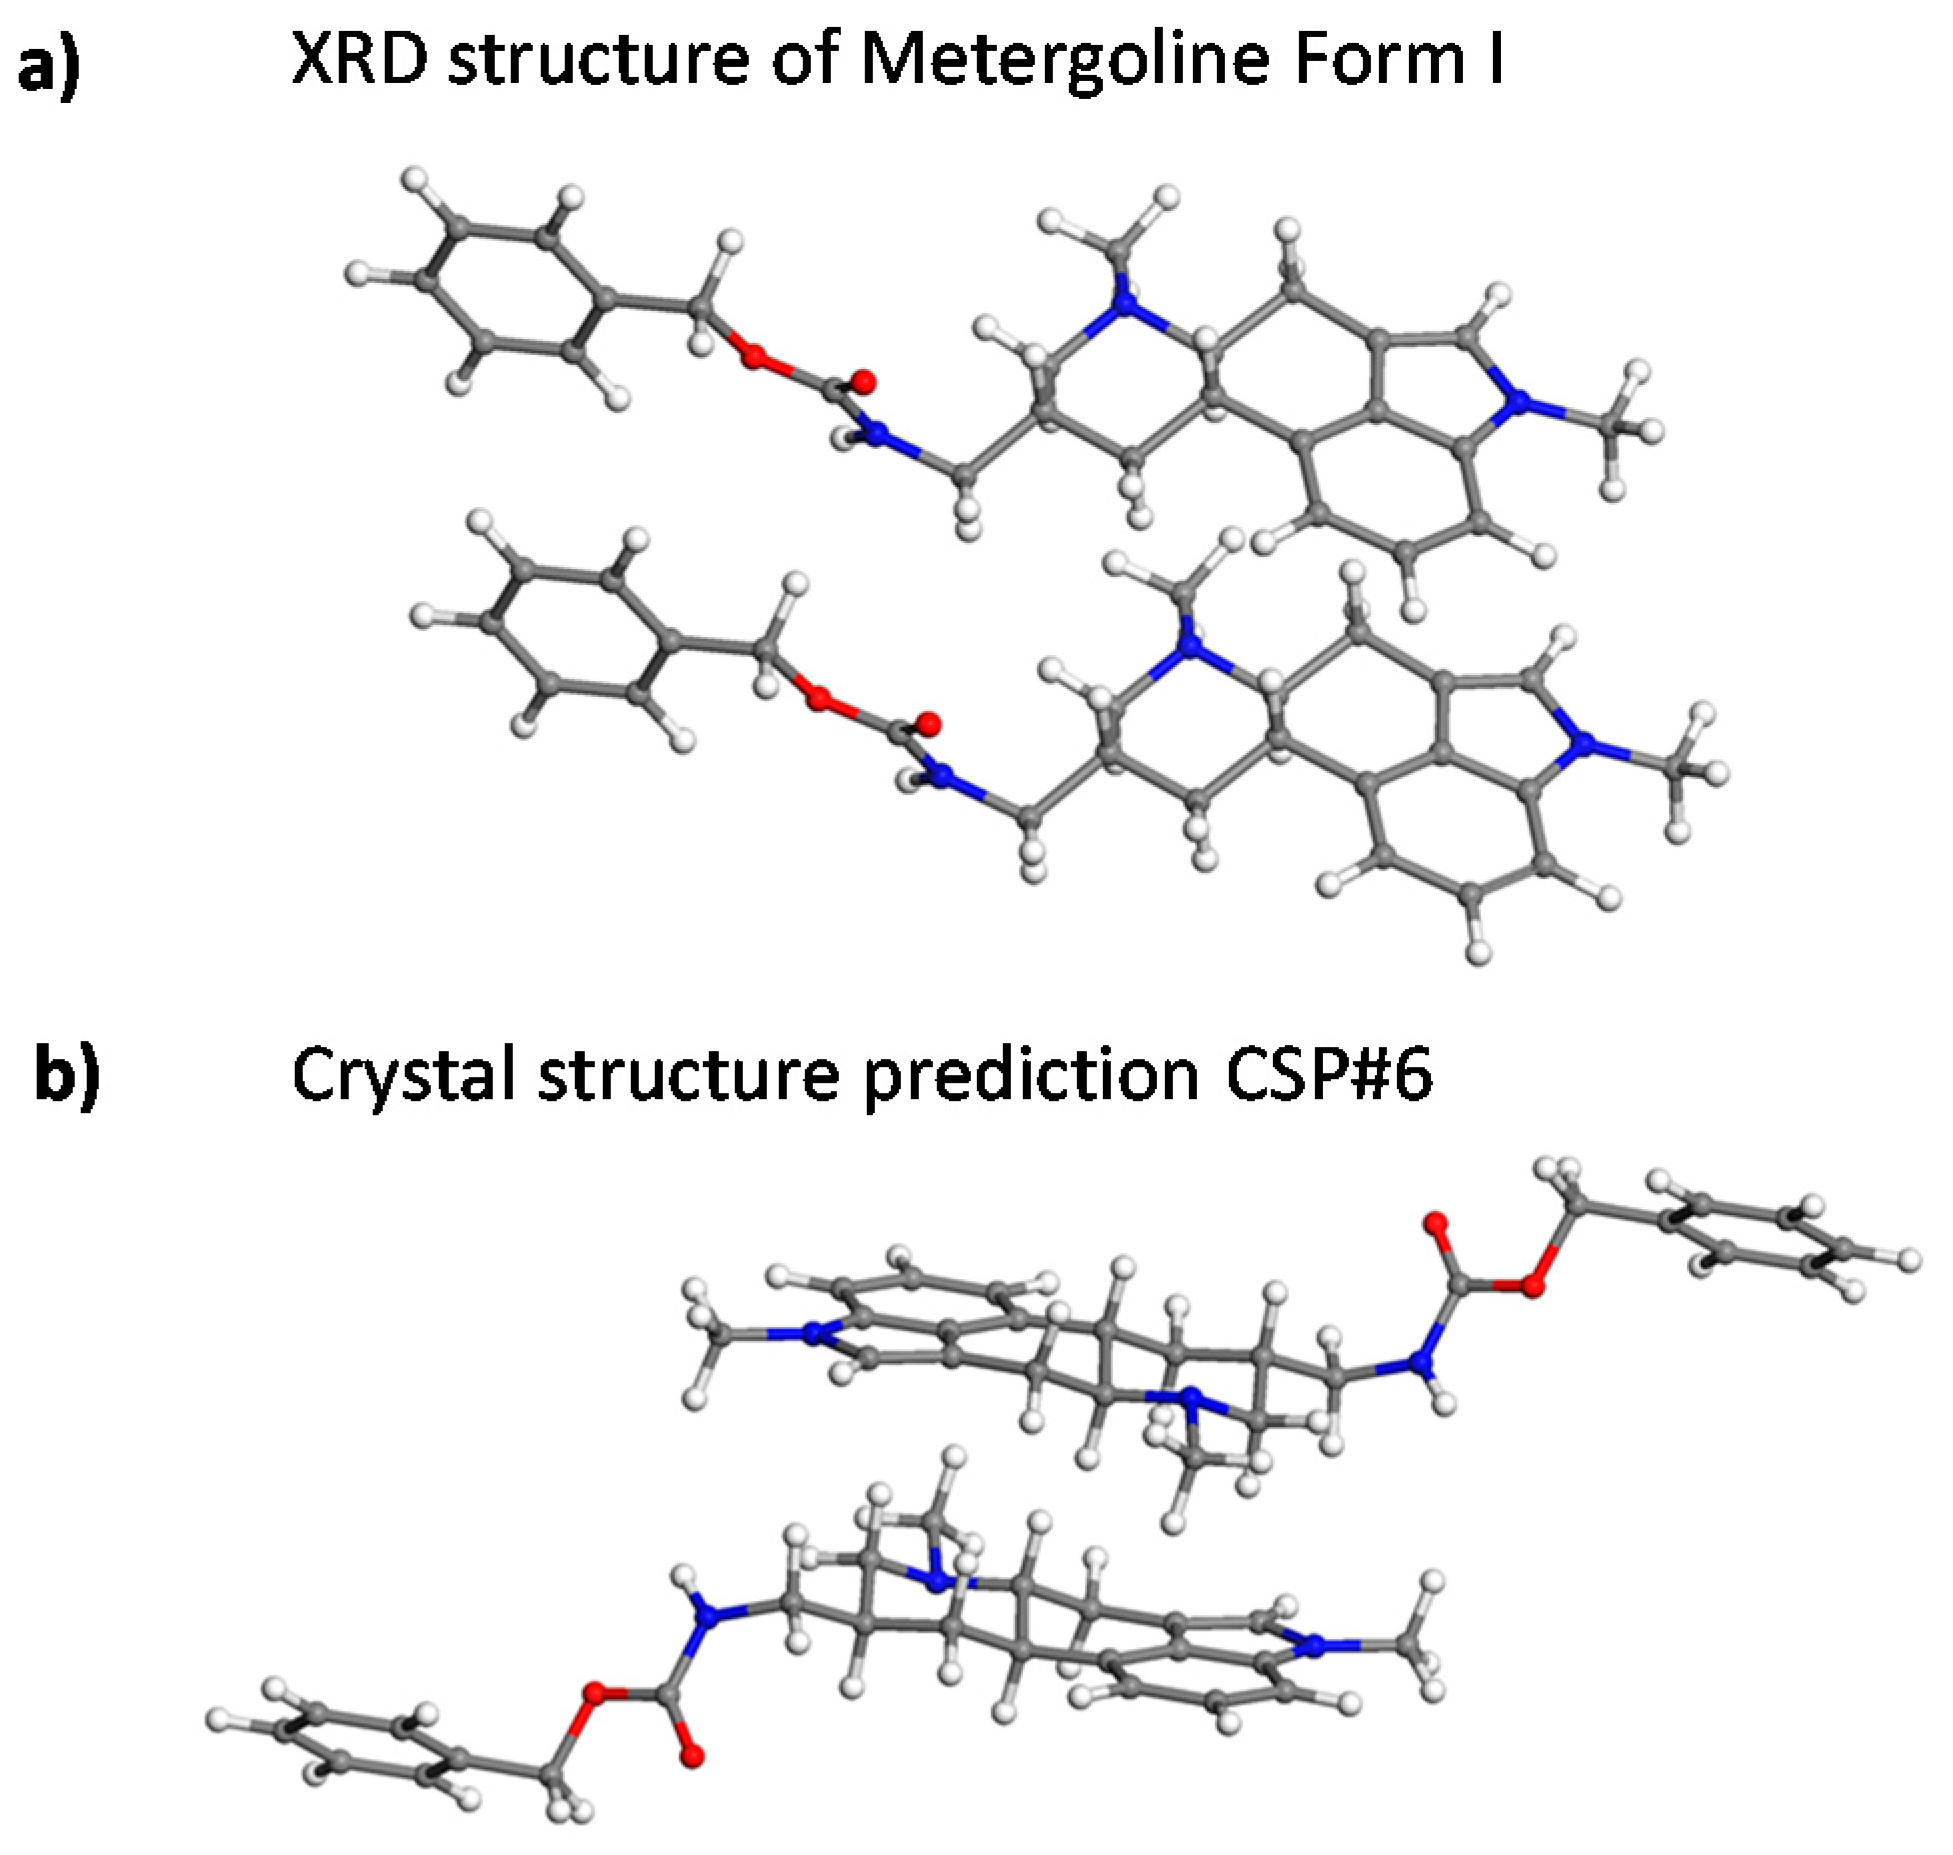
2.1. Metergoline Structures

Samples of the two polymorphs of metergoline (C25H29N3O2, CAS number: 17692-51-2; see Figure 1) were obtained from Teva Czech Industries s. r. o. The exclusive presence of either polymorph was assessed by powder XRD analysis. Polymorph I of metergoline crystalizes in the monoclinic space group P1 with a unit-cell volume of 529.0 Å3 and with one formula unit in the unit cell [15]. The crystal structure of polymorph II is much more complex than that of polymorph I [21]. Polymorph II crystallizes in the monoclinic space group C2, has a large unit-cell volume of approximately 4234 Å3, and it has eight formula units (Z = 8) in the unit cell, two of which are symmetry independent (Z′ = 2). This polymorph features two parallel chains that are stabilized by the hydrogen bonding between each type of symmetry-independent molecules [21], while the intermolecular arrangement of polymorph I is dominated by stacking along the c crystal axis [15]. In the following, the designations MI and MII are used for polymorphs I and II of metergoline, respectively.

2.2. Solid-State NMR Experiments

SSNMR spectra were measured at 11.7 T using a Bruker Avance III HD 500 US/WB NMR spectrometer (Bruker, Karlsruhe, Germany). For explicit determination of isotropic chemical shifts, the following techniques were used: (i) 1H NMR with DUMBO homodecoupling [22]; (ii) 13C CP/MAS and 13C CPPI/MAS NMR [23]; (iii) 2D 1H–13C FSLG HETCOR NMR [24]; (iv) 2D 13C–13C transverse-dephasing-optimized CP-INADEQUATE [25,26]; (v) 2D NOESY-type 1H–1H CRAMPS correlation NMR with DUMBO homodecoupling [27]; and, (vi) 2D 1H–1H DQ/SQ CRAMPS correlation NMR [28] with SPC5 DQ recoupling [29]. Moreover, the 2D PASS experiments [30,31] were applied with a spinning rate of 3 kHz to determine the principal values of the 13C chemical shift tensors, while the 2D 1H–13C LGCP [32], PILGRIM [33], and PISEMA [34] experiments were used to measure 1H–13C dipolar profiles (see also reference [35]). Frictional heating [36,37] of the spinning samples was compensated for by active cooling. For all the experimental details, see Supporting Information (SI-Experimental details.pdf).

2.3. Crystal Structure Predictions

The procedure that was successfully applied to predict the packing motifs of decitabine [12] and of sebacic acid [13] was adopted (the technical assistance was provided by Dr. M. Hušák, Institute of Chemical Technology Prague). It applies the DMol3 and Polymorph Predictor modules of the Materials Studio package [38]. For an initial structure, the electrostatic-potential fitted charges were computed in DMol3 using the RPBE (“revised PBE”) DFT exchange-correlation functional [39]. These charges were used together with the Dreiding force field to approximate crystal-lattice energies by the Polymorph Predictor in a process that automatically searches for potential polymorphs of a crystal within a given space group. The search was limited to polymorph I of metergoline (namely, to the P1 space group). In the abovementioned calculations, the “Fine” accuracy level of the Materials Studio computations was applied, and the default settings were kept for all of the remaining parameters [38]. Once the search was completed, low-energy structures were visually inspected. The first 14 of them feature a generally correct packing motif (stacking of the aromatic rings), while the 15th CSP, in which the molecules form hydrogen bonds between amidic protons and carbonyl oxygens, is clearly wrong. Thus, together with CSP#1–14, CSP#15 was considered for comparison purposes, and the higher-energy structures were not used.

2.4. DFT Calculations

Together with the CSPs described in the preceding paragraph, the XRD structures of MI [15] and MII [21] and the neutron diffraction structure of ibuprofen [40] were considered. These geometries were subjected to full optimization of all the internal coordinates while keeping the unit-cell parameters fixed using the PW DFT approach [41,42,43]. The crystal-lattice energy was approximated by the RPBE functional [39]. The CASTEP 16.1 suite of codes was applied with the “Fine” level of settings corresponding to the CASTEP implementation in Materials Studio 5.0 [38] (in particular, the PW cut-off energy value was 550 eV and the Monkhorst–Pack grids [44] are summarized in the Supplementary Materials file ‘grids.txt’). For the structures that were obtained in this manner, the NMR chemical shielding tensors of all the nuclei were predicted using the gauge-including projector augmented-wave (GIPAW) [45,46] technique. The default settings of the CASTEP-NMR module of CASTEP 16.1 were used together with the same DFT functional and parameters being employed in the abovementioned geometry optimizations.

3. Results

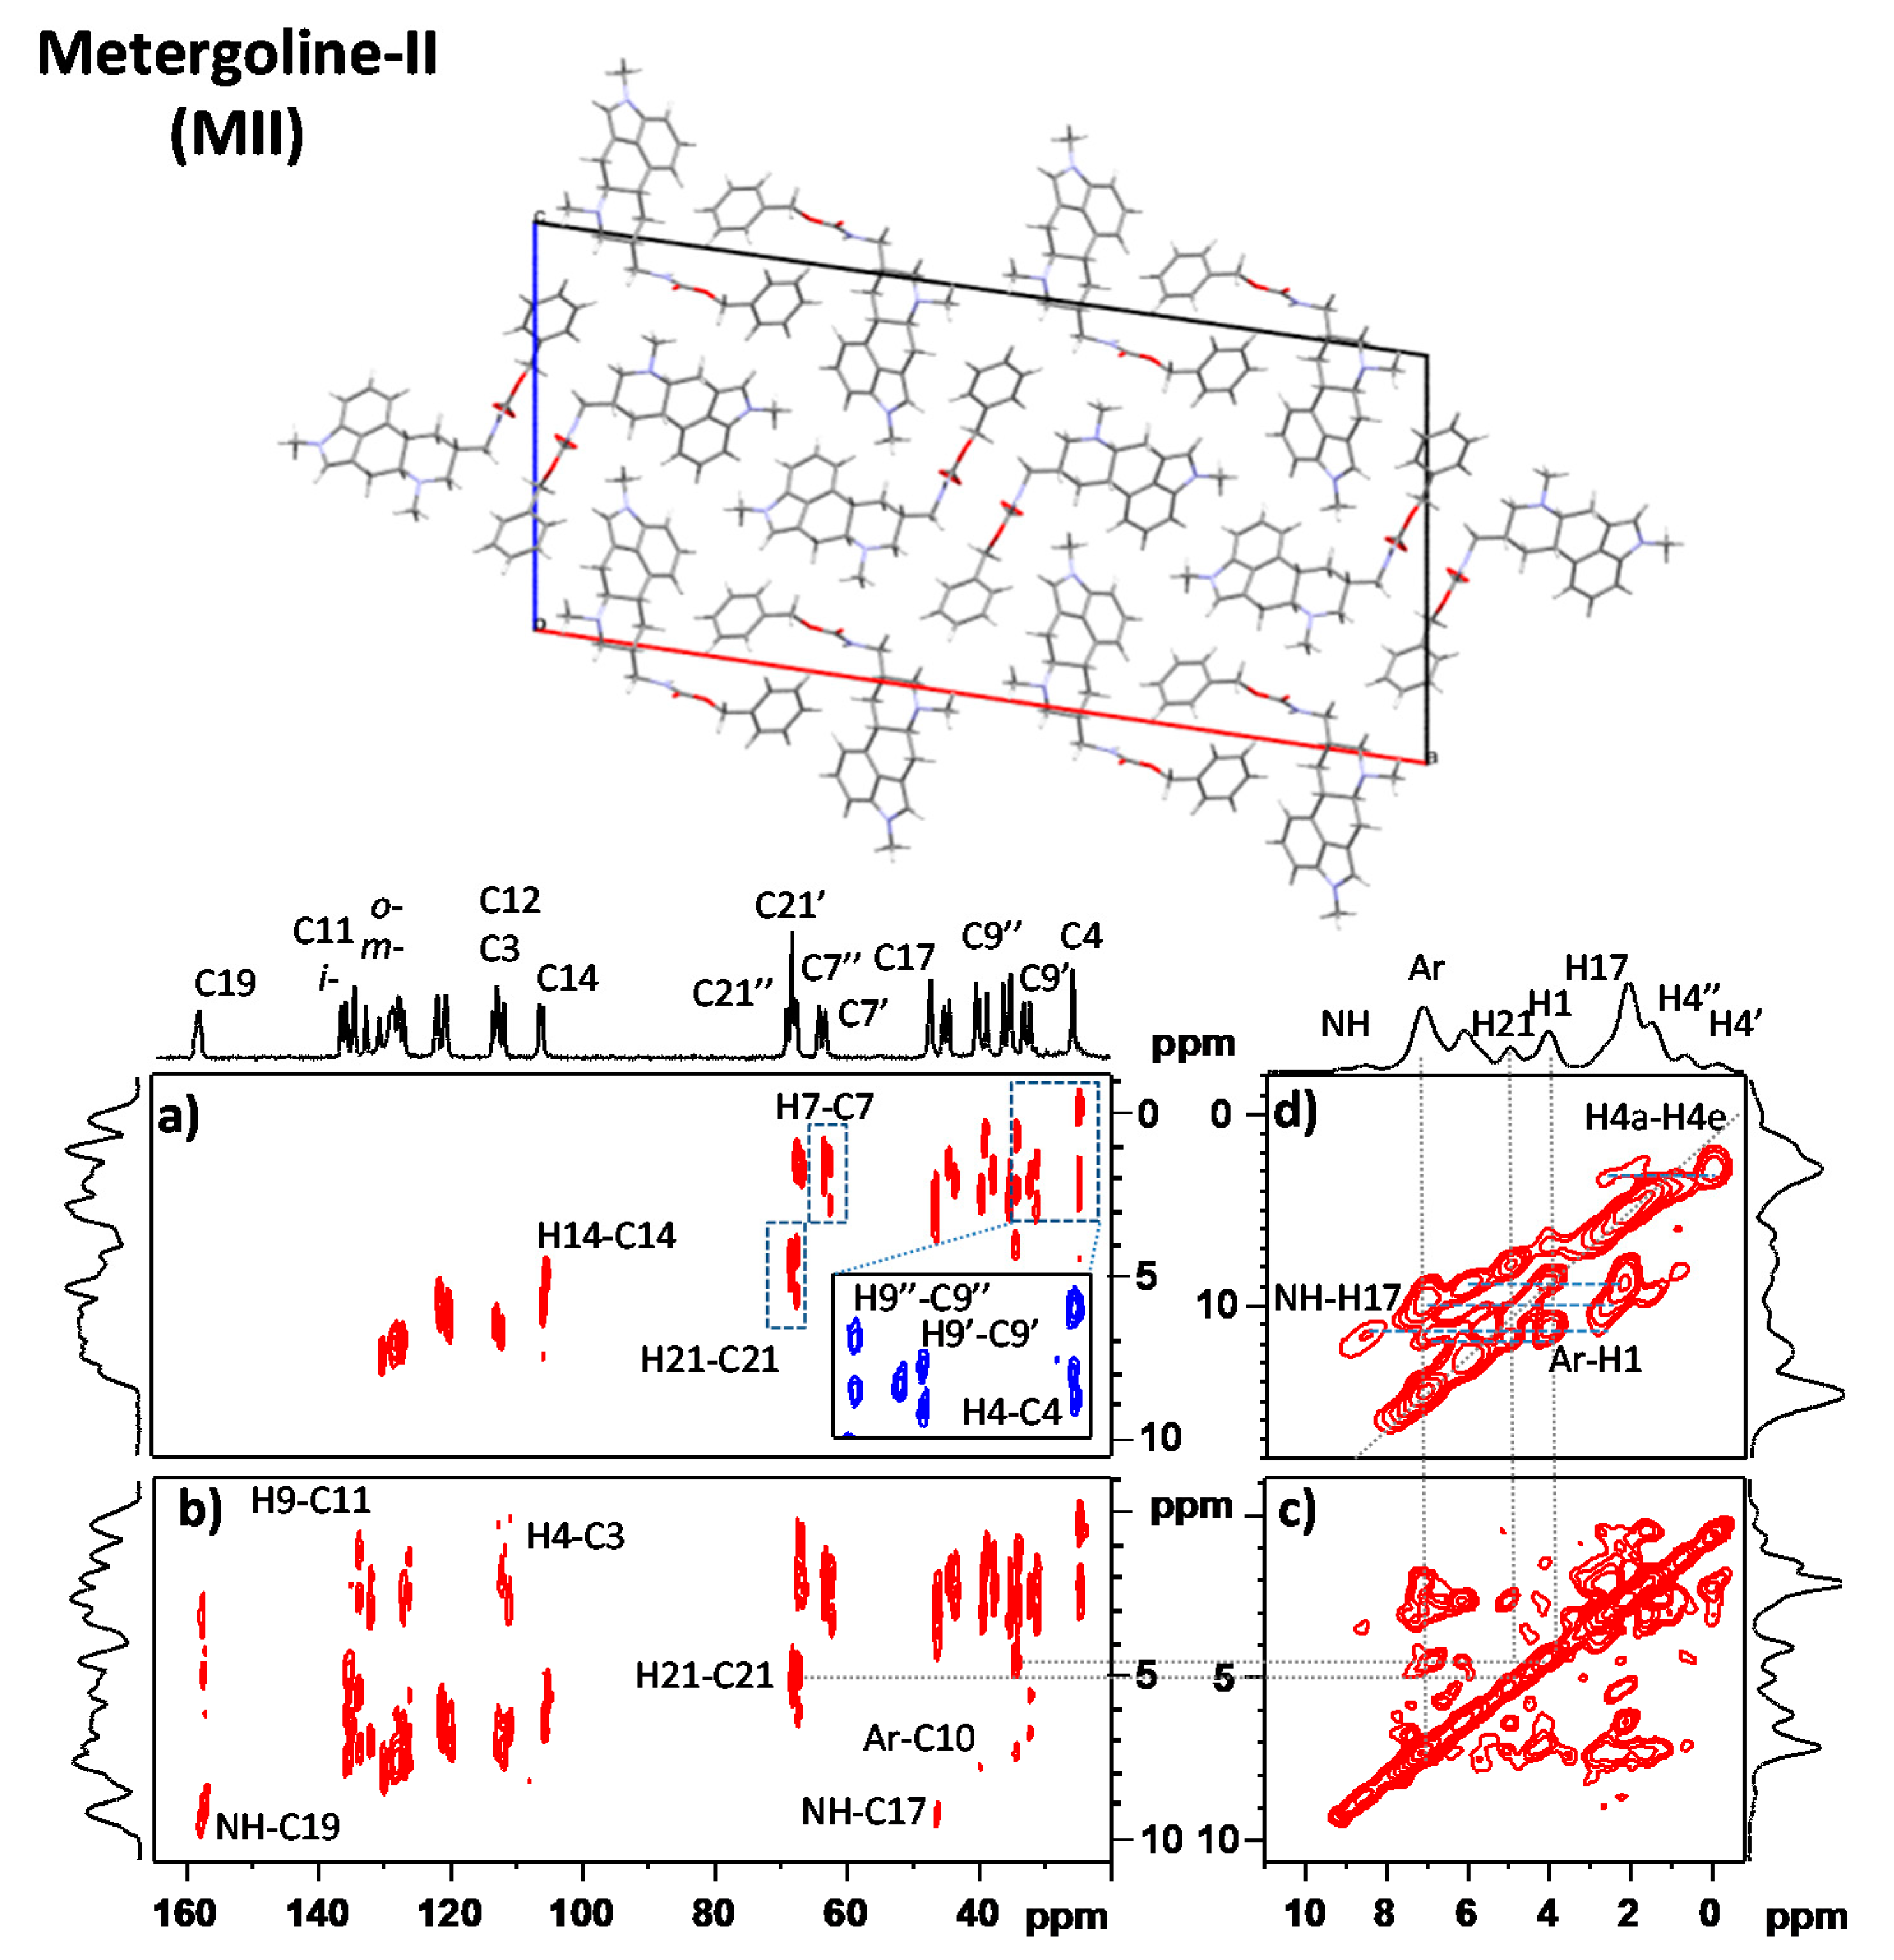
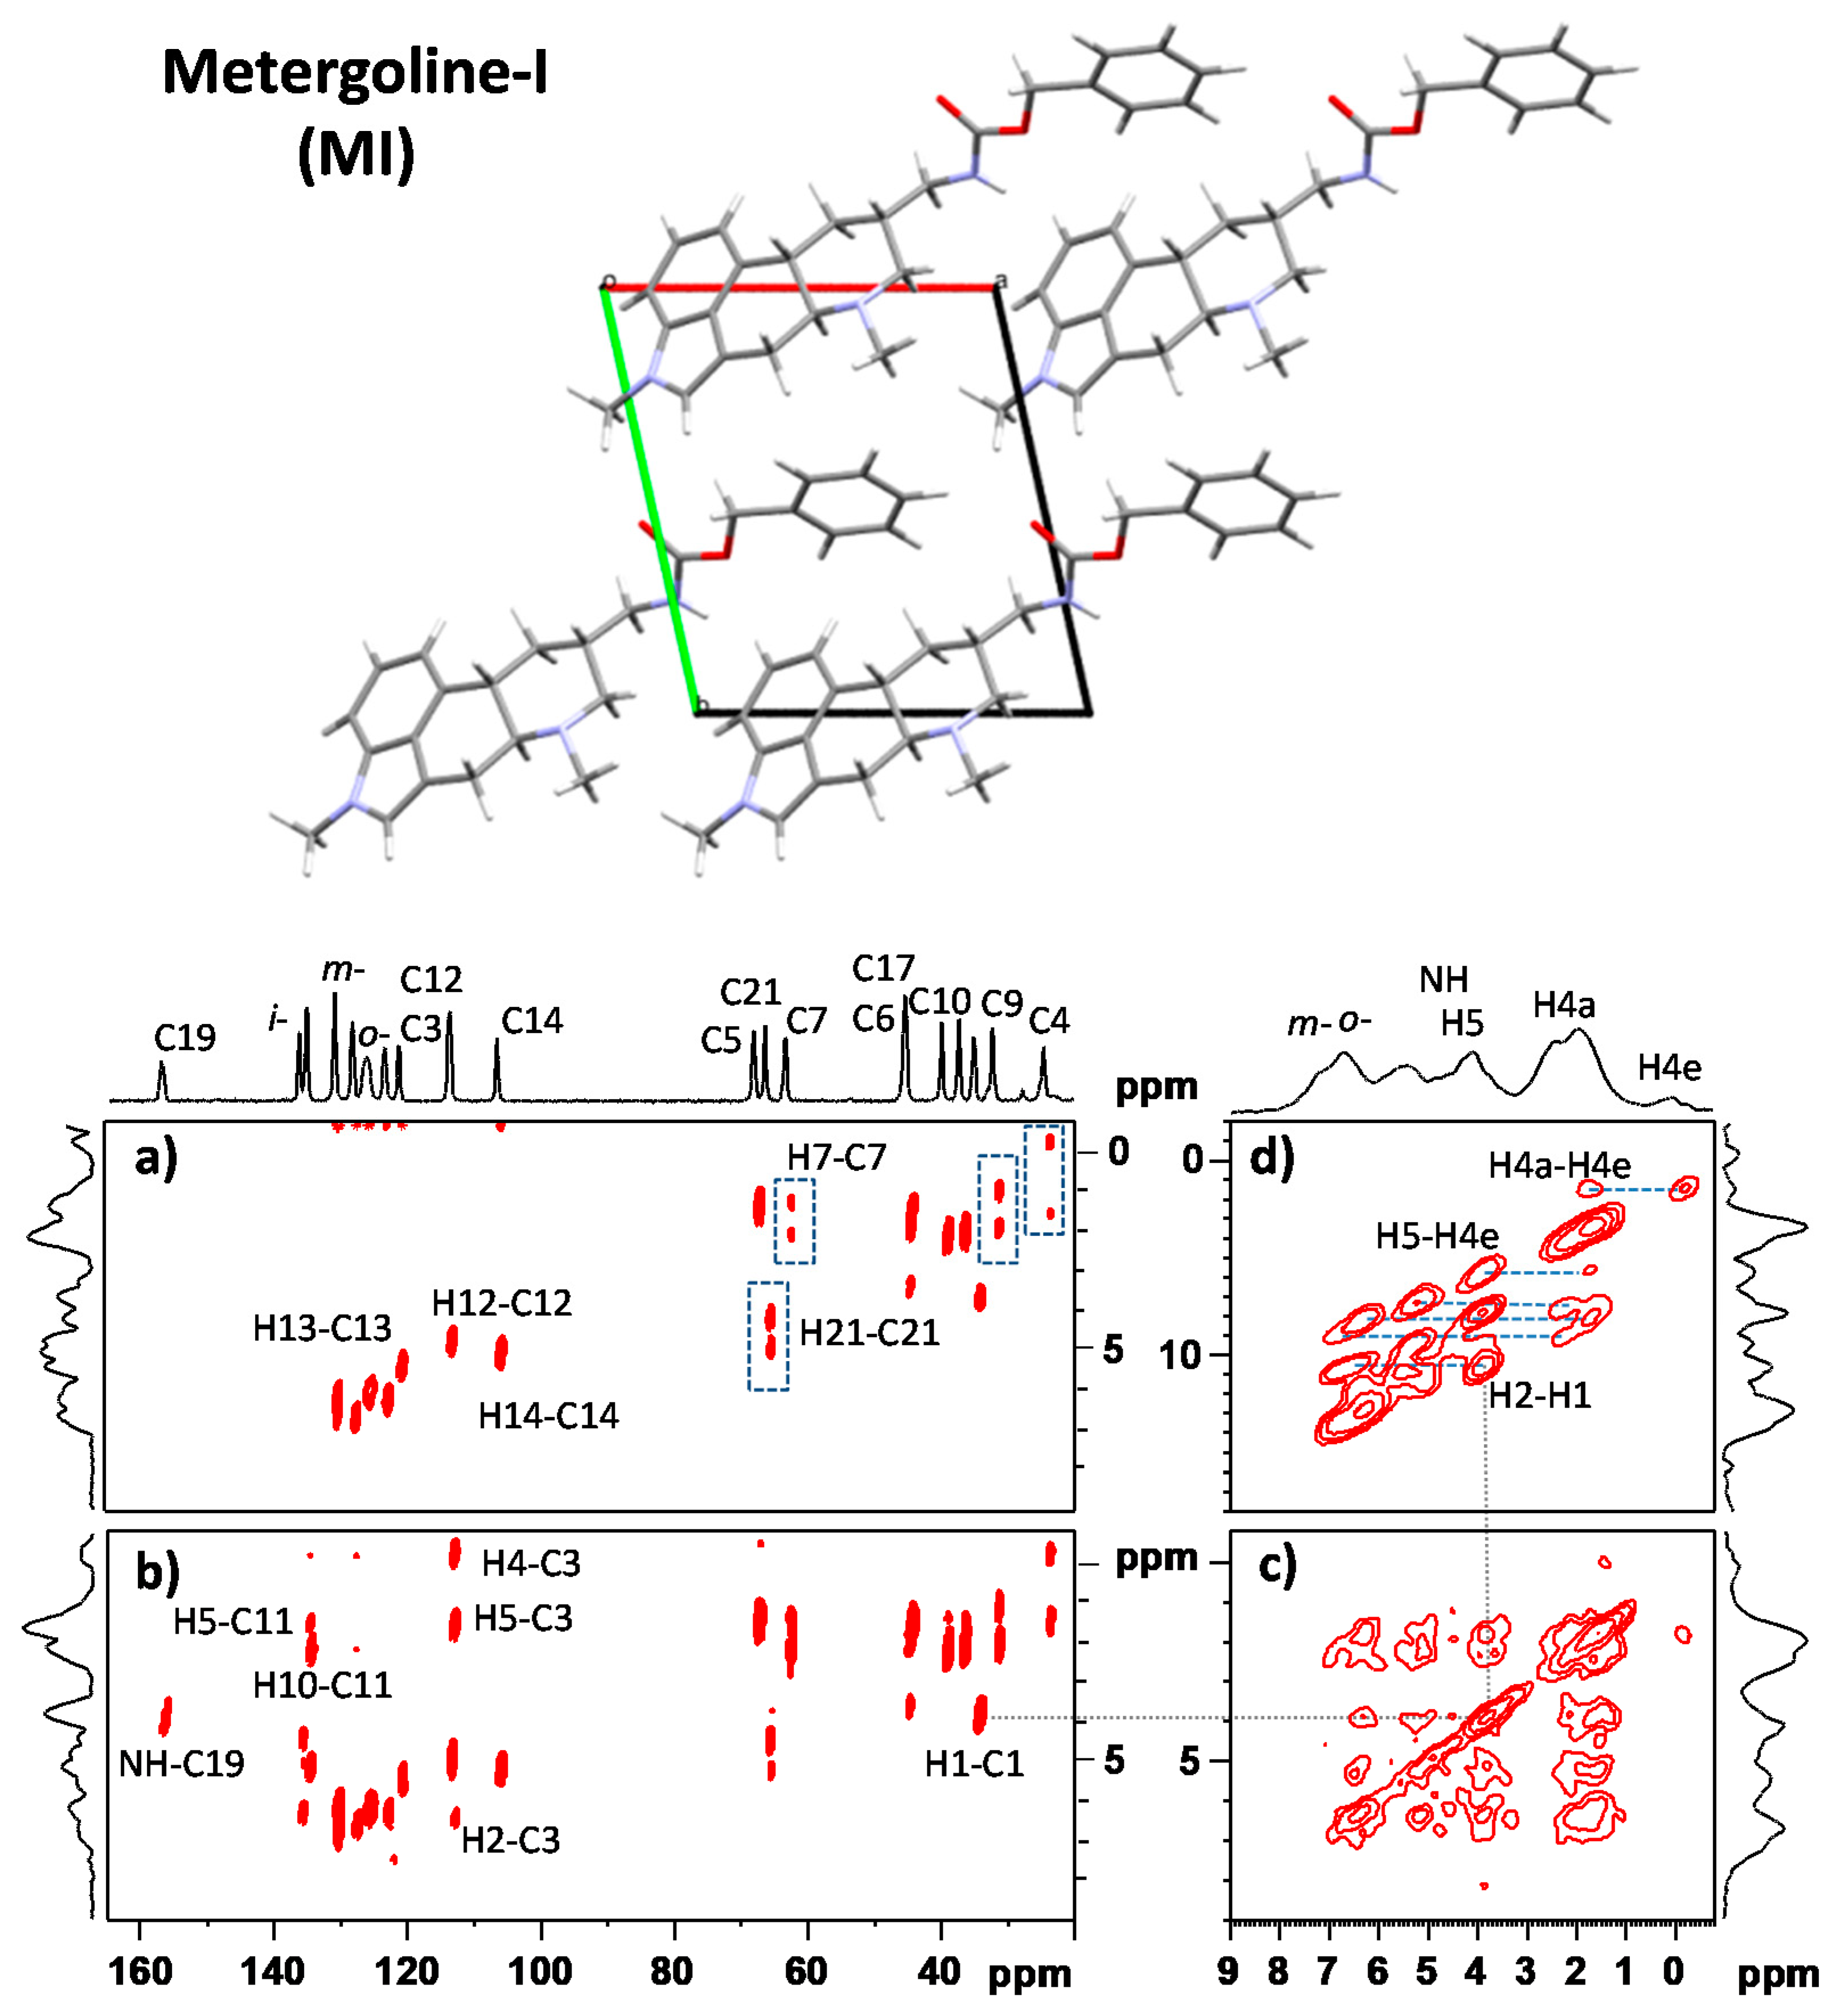
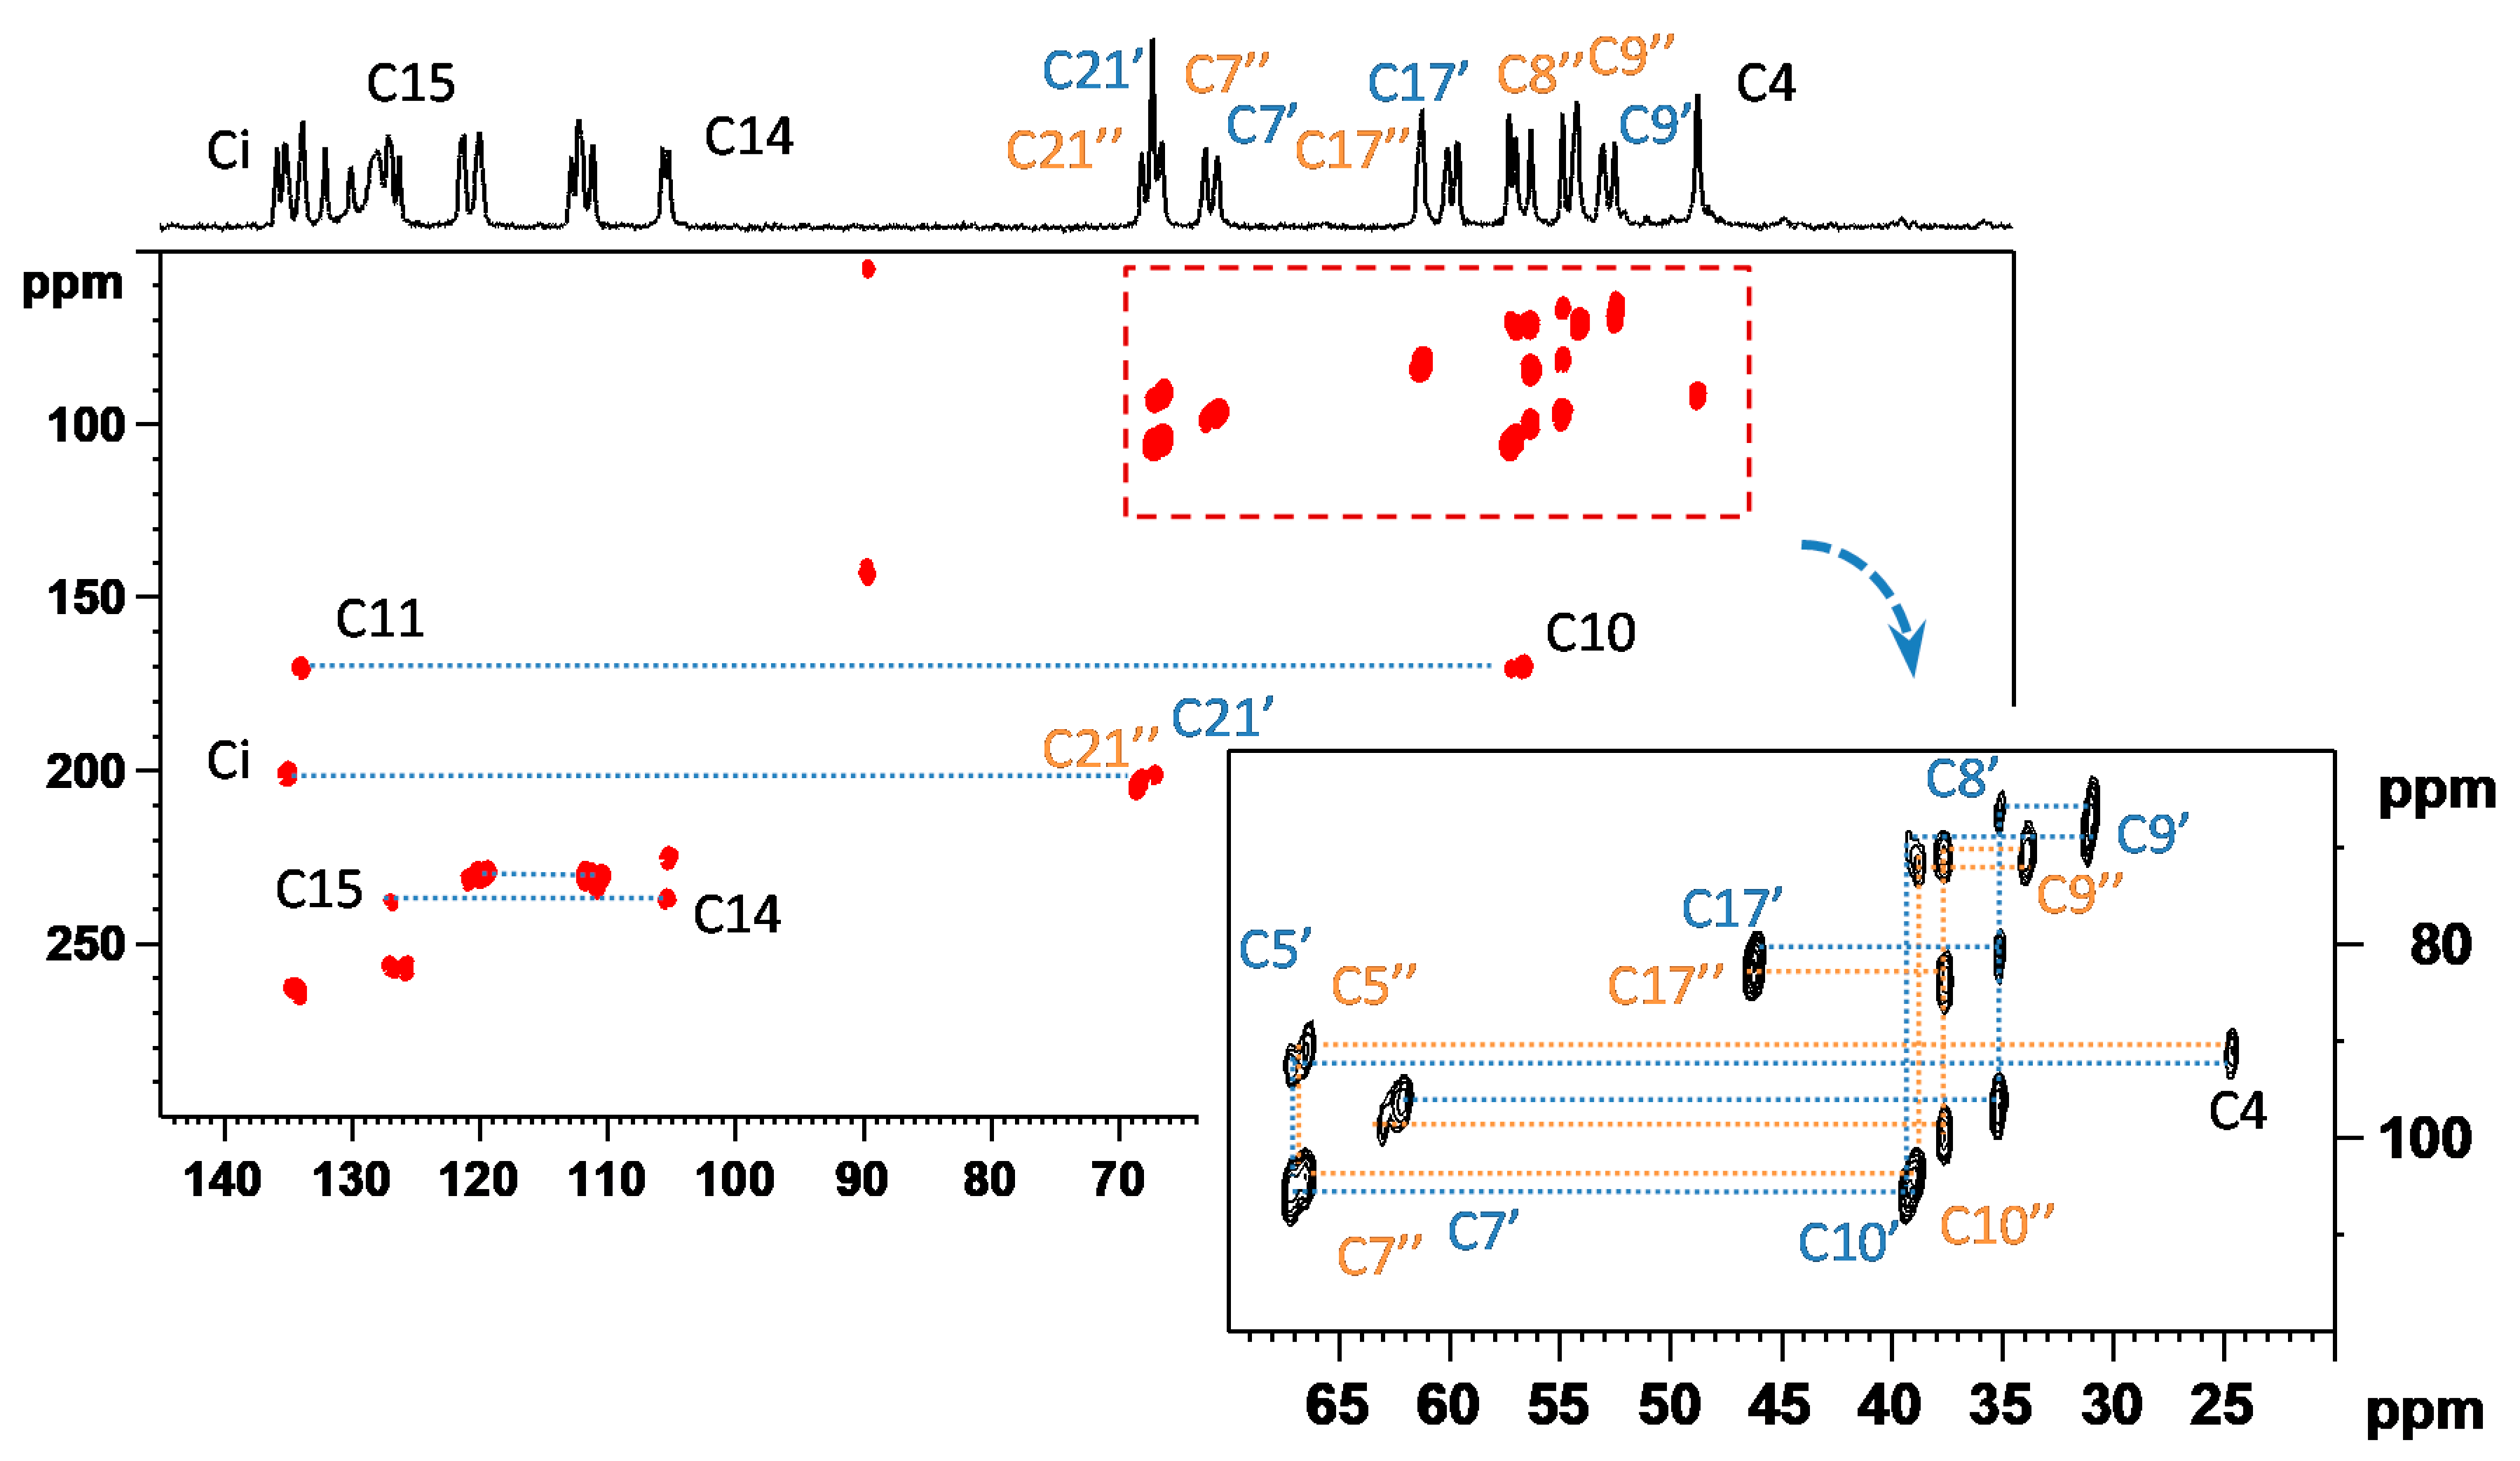
3.1. Signal Assignment of the Polymorphs

The explicit assignment of the {1H, 13C} signals is usually a prerequisite for subsequent SSNMR investigations of solid forms of APIs. This task was found to be especially important for the reliability of NMR crystallography studies [12,13] and is further examined here. Thus, the relatively simple MI polymorph (see Section 2.1) was measured first, and the experimental parameters for recording high-quality 2D correlation SSNMR spectra were utilized in the investigation of the rather complicated MII system. The experimental studies of both polymorphs were supported by the related GIPAW DFT calculations of the NMR chemical shielding, as discussed below.
As shown in Figure 2, for a medium-sized crystallographic system with a single symmetry-independent molecule in the crystal unit, such as the MI polymorph, complete signal assignment can be easily achieved by combining the traditional 1H–13C and 1H–1H correlation techniques. In this way, all one-bond 1H–13C spin pairs were determined, inequivalent protons in all CH2 units were resolved, and the amide proton was identified. The values of isotropic chemical shifts were precisely determined and they are summarized in the Supplementary Materials (files ‘isoC.txt’ and ‘isoH.txt’). Moreover, through variation of the mixing times, the proton-carbon and proton-proton through-space medium- and long-range connectivity of the molecular segments can be traced.
The 1D and 2D NMR spectra of the MII polymorph are quite complex (see Figure 3) due to the presence of two independent molecules in its unit cell. Nevertheless, it was still possible in this case to establish all one-bond 1H–13C spin pairs, resolve inequivalent protons in all CH2 units, and locate the peaks corresponding to the amide proton. The values of the isotropic chemical shifts were also precisely determined and they are included in the Supplementary Materials (file ‘MII.pdf’). However, the resolution in the 1H dimension of the recorded 1H–1H and 1H–13C correlation spectra is not sufficient to precisely trace the proton-proton connectivity in individual symmetry-independent molecules. Bear in mind that the size of the proton spin-system of MII counts 2 × 29 proton species. Consequently, the resulting 1H–1H correlation pattern is very complex, showing up to a hundred correlation resonances that are difficult to be spectroscopically resolved, even using highly efficient homodecoupling sequences.
Therefore to refine the information regarding the connectivity of individual structural units, the refocused transverse-dephasing-optimized 13C–13C CP-INADEQUATE experiment was applied [25,26]. Although 13C–13C double-quantum through-bond correlations driven by 1JCC couplings can be effectively detected even at natural isotopic abundance, it is worth noting that several days of accumulation are usually required to detect spectra with acceptable signal-to-noise ratio. Unfortunately, for the MII polymorph, due to the chemical composition when the carbon backbone is interrupted by 4 heteroatoms (O and N), it is not possible to attain the complete description of the carbon-carbon connectivity for each symmetry-independent molecule. Nevertheless, the molecular fragments that are separated by heteroatoms were identified and assigned for the aliphatic region as demonstrated in Figure 4. However, despite the extreme effort undertaken to record the 2D INADEQUATE spectrum of MII (total experimental time of data acquisition was eight days), the interconnectivity between the assigned C–C fragments remained unclear.
To complement missing information, the previously developed [18] procedure of the signal assignment in 2D 1H–13C correlation spectra was applied. Briefly, this procedure is based on the detailed analysis of 1H–13C and 1H–1H correlation signals with the aid of automated quantum-chemical prediction of 1H–13C correlation patterns, which are calculated for the refined crystal structure. The best agreement between the experimental and DFT-calculated correlation data is systematically searched and the parameter of covariance for 1H–13C pairs in ppm2 is considered to be a measure of this agreement. For further details, how to this procedure works see our previous study [18] and Supporting Information (file ‘MII.pdf’).
Specifically for finalizing the signal assignment of MII the information about C–C connectivity (incomplete) obtained from 2D 13C–13C CP-INADEQUATE NMR spectrum (Figure 4) was used as an input precondition. The experimentally determined C–C and C–H connectivity was kept constant when automatic searching of the most suitable signal assignment based on covariance of 1H and 13C isotropic chemical shifts was applied. The statistical parameters describing the level of agreement between GIPAW-RPBE chemical shieldings, σ, calculated for X-ray refined structures and the measured (explicitly assigned) chemical shifts, δ, are then summarized in Table 1 for both investigated polymorphs. Notably, there are only 24 13C data points for MI, because the carbons in the meta-positions of the phenyl ring were not experimentally resolved, so their σ values were equated. Similarly, since the protons in the ortho-positions could not be distinguished by the measurements, the predicted values were averaged for these sites. Of course, the two sets of methyl protons were also averaged out, thus bringing the total number of the 1H data points to 24. For MII, the number of data points analysed is correspondingly larger (46 and 50, see Table 1).
The low value of covariance parameter obtained for MI (0.0468 ppm2) clearly reflects unambiguous experimentally determined signal assignment, and the precisely refined crystal structure. As the crystal structure of MI is relatively simple the uncertainties in localizations of carbon and hydrogen atoms are negligible and the number of H-C pairs is relatively small. In addition, due to the plausible spectral resolution of all the recorded 2D correlation spectra the corresponding resonance frequencies could be extracted with a high precision. Subsequently from the linear regression of the σ and δ data for all the 1H and 13C nuclei the standard deviation of the correlations of the proton, 1H SD, and carbon atoms, 13C SD were calculated. These similarity parameters then can be considered as a reference level to indicate correctness of the predicted and/or solved crystal structure. For MI polymorph, these values are low reaching only 1.05 and 0.23 ppm for 13C SD and 1H SD, respectively. Both of these values are significantly lower than those mentioned in literature as typical threshold limits, 2.0 and 0.5 ppm for 13C SD and 1H SD, respectively. For MII polymorph, the covariance parameter is slightly increased to 0.125 ppm2, thus reflecting incomplete spectral resolution of 1H resonances, and higher number of C-H pairs. Nevertheless the calculated similarity parameters 13C SD = 1.38 and 1H SD = 0.39 are still low enough to confirm reliability of the signal assignment, as well as the correctness of the solved crystal structure.

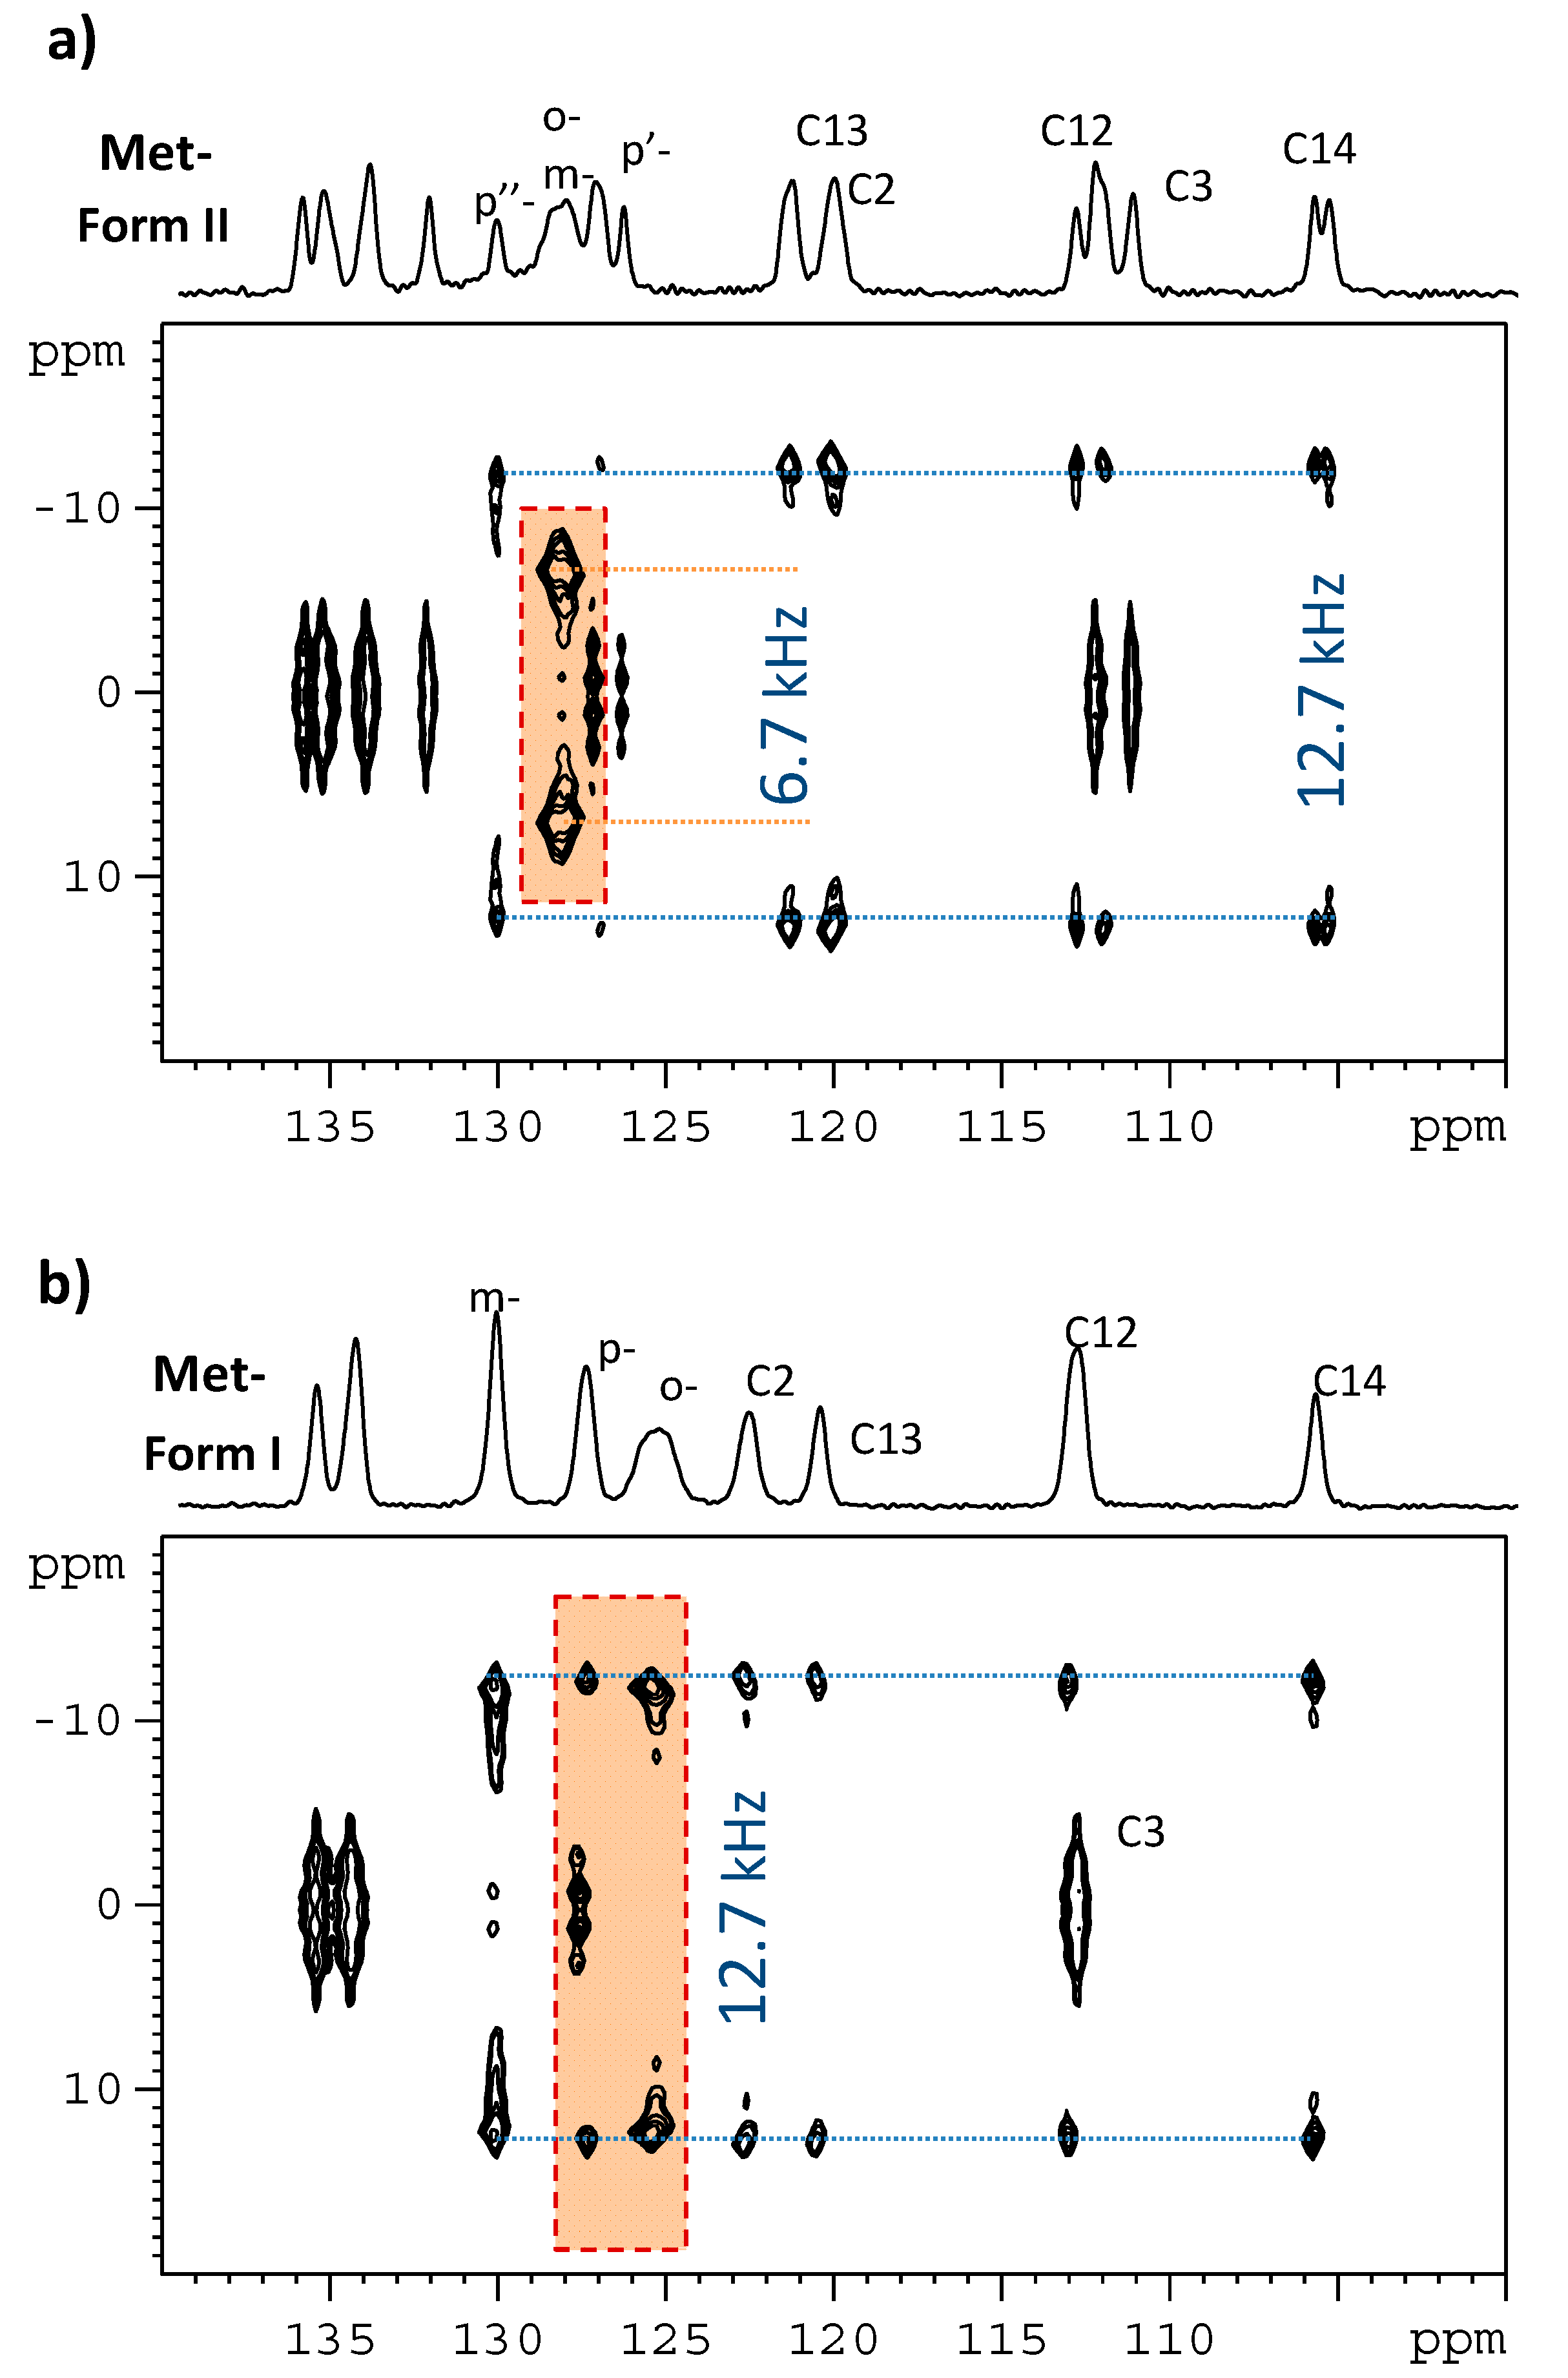
3.2. Segmental Dynamics

Assessing the extent of local motions of molecular segments in the investigated systems is important, as the motional parameters might affect an interpretation of the NMR parameters obtained by means of quantum chemical calculations [47,48,49]. Hence, site-specific measurements of one-bond 1H–13C dipolar couplings in CH or CH2 groups using the PISEMA experiment were carried out. As demonstrated previously [50,51,52], 1H–13C spin-pair dipolar interactions in typical CH and CH2 groups in powdered solids produce Pake-like doublets, the splitting of which reflects dipolar couplings DCH. Assuming a constant length of the C-H chemical bonds, the reduction in the observed splitting in one-bond 1H–13C dipolar spectra (with respect to the theoretical rigid-limit value, DCH,rig) can be attributed to the released internal motion [53]. These spectra can be extracted from the indirect dimension of the 2D 1H–13C PISEMA spectra, as shown in Figure 5. In this way, with the exception of the rapidly rotating methyl groups, all CH and CH2 segments of MI were found to exhibit the motionally averaged dipolar couplings, DCH, of ca. 12.0–12.7 kHz, which are close to the range of values expected for rigid segments (DCH,rig = 13.0–13.5 kHz). Consequently, the related order parameter, S C H 2 , which is defined as the ratio of motionally averaged dipolar coupling constant to the rigid-limit value, ranges from ca. 0.92 to 0.98. In this case, assuming segmental motion to be axially symmetric and small in amplitude (for a fluctuation angle θ, sin θ = θ ), the order parameter can be converted to a root-mean-square angular fluctuation angle, θ 2 , according to a definition described previously [53]. Thus, at room temperature, the polycyclic parts of the metergoline molecules are rigid, exhibiting low-amplitude motions with an average fluctuation angle that is smaller than approximately 10°, while slightly higher amplitudes (up to 16°) are found for the phenyl ring of polymorph MI. In contrast, considerably reduced dipolar couplings of ca. 6.7 kHz were measured for CH = segments in the ortho- and meta-positions of both aromatic rings of polymorph MII. The corresponding order parameter then drops to approximately 0.5. In this case, using a motional model for high-amplitude discrete jumps between N distinct orientations, the determined order parameter shows that the phenyl rings in MII undergo fast, large-amplitude 180° flips [54].

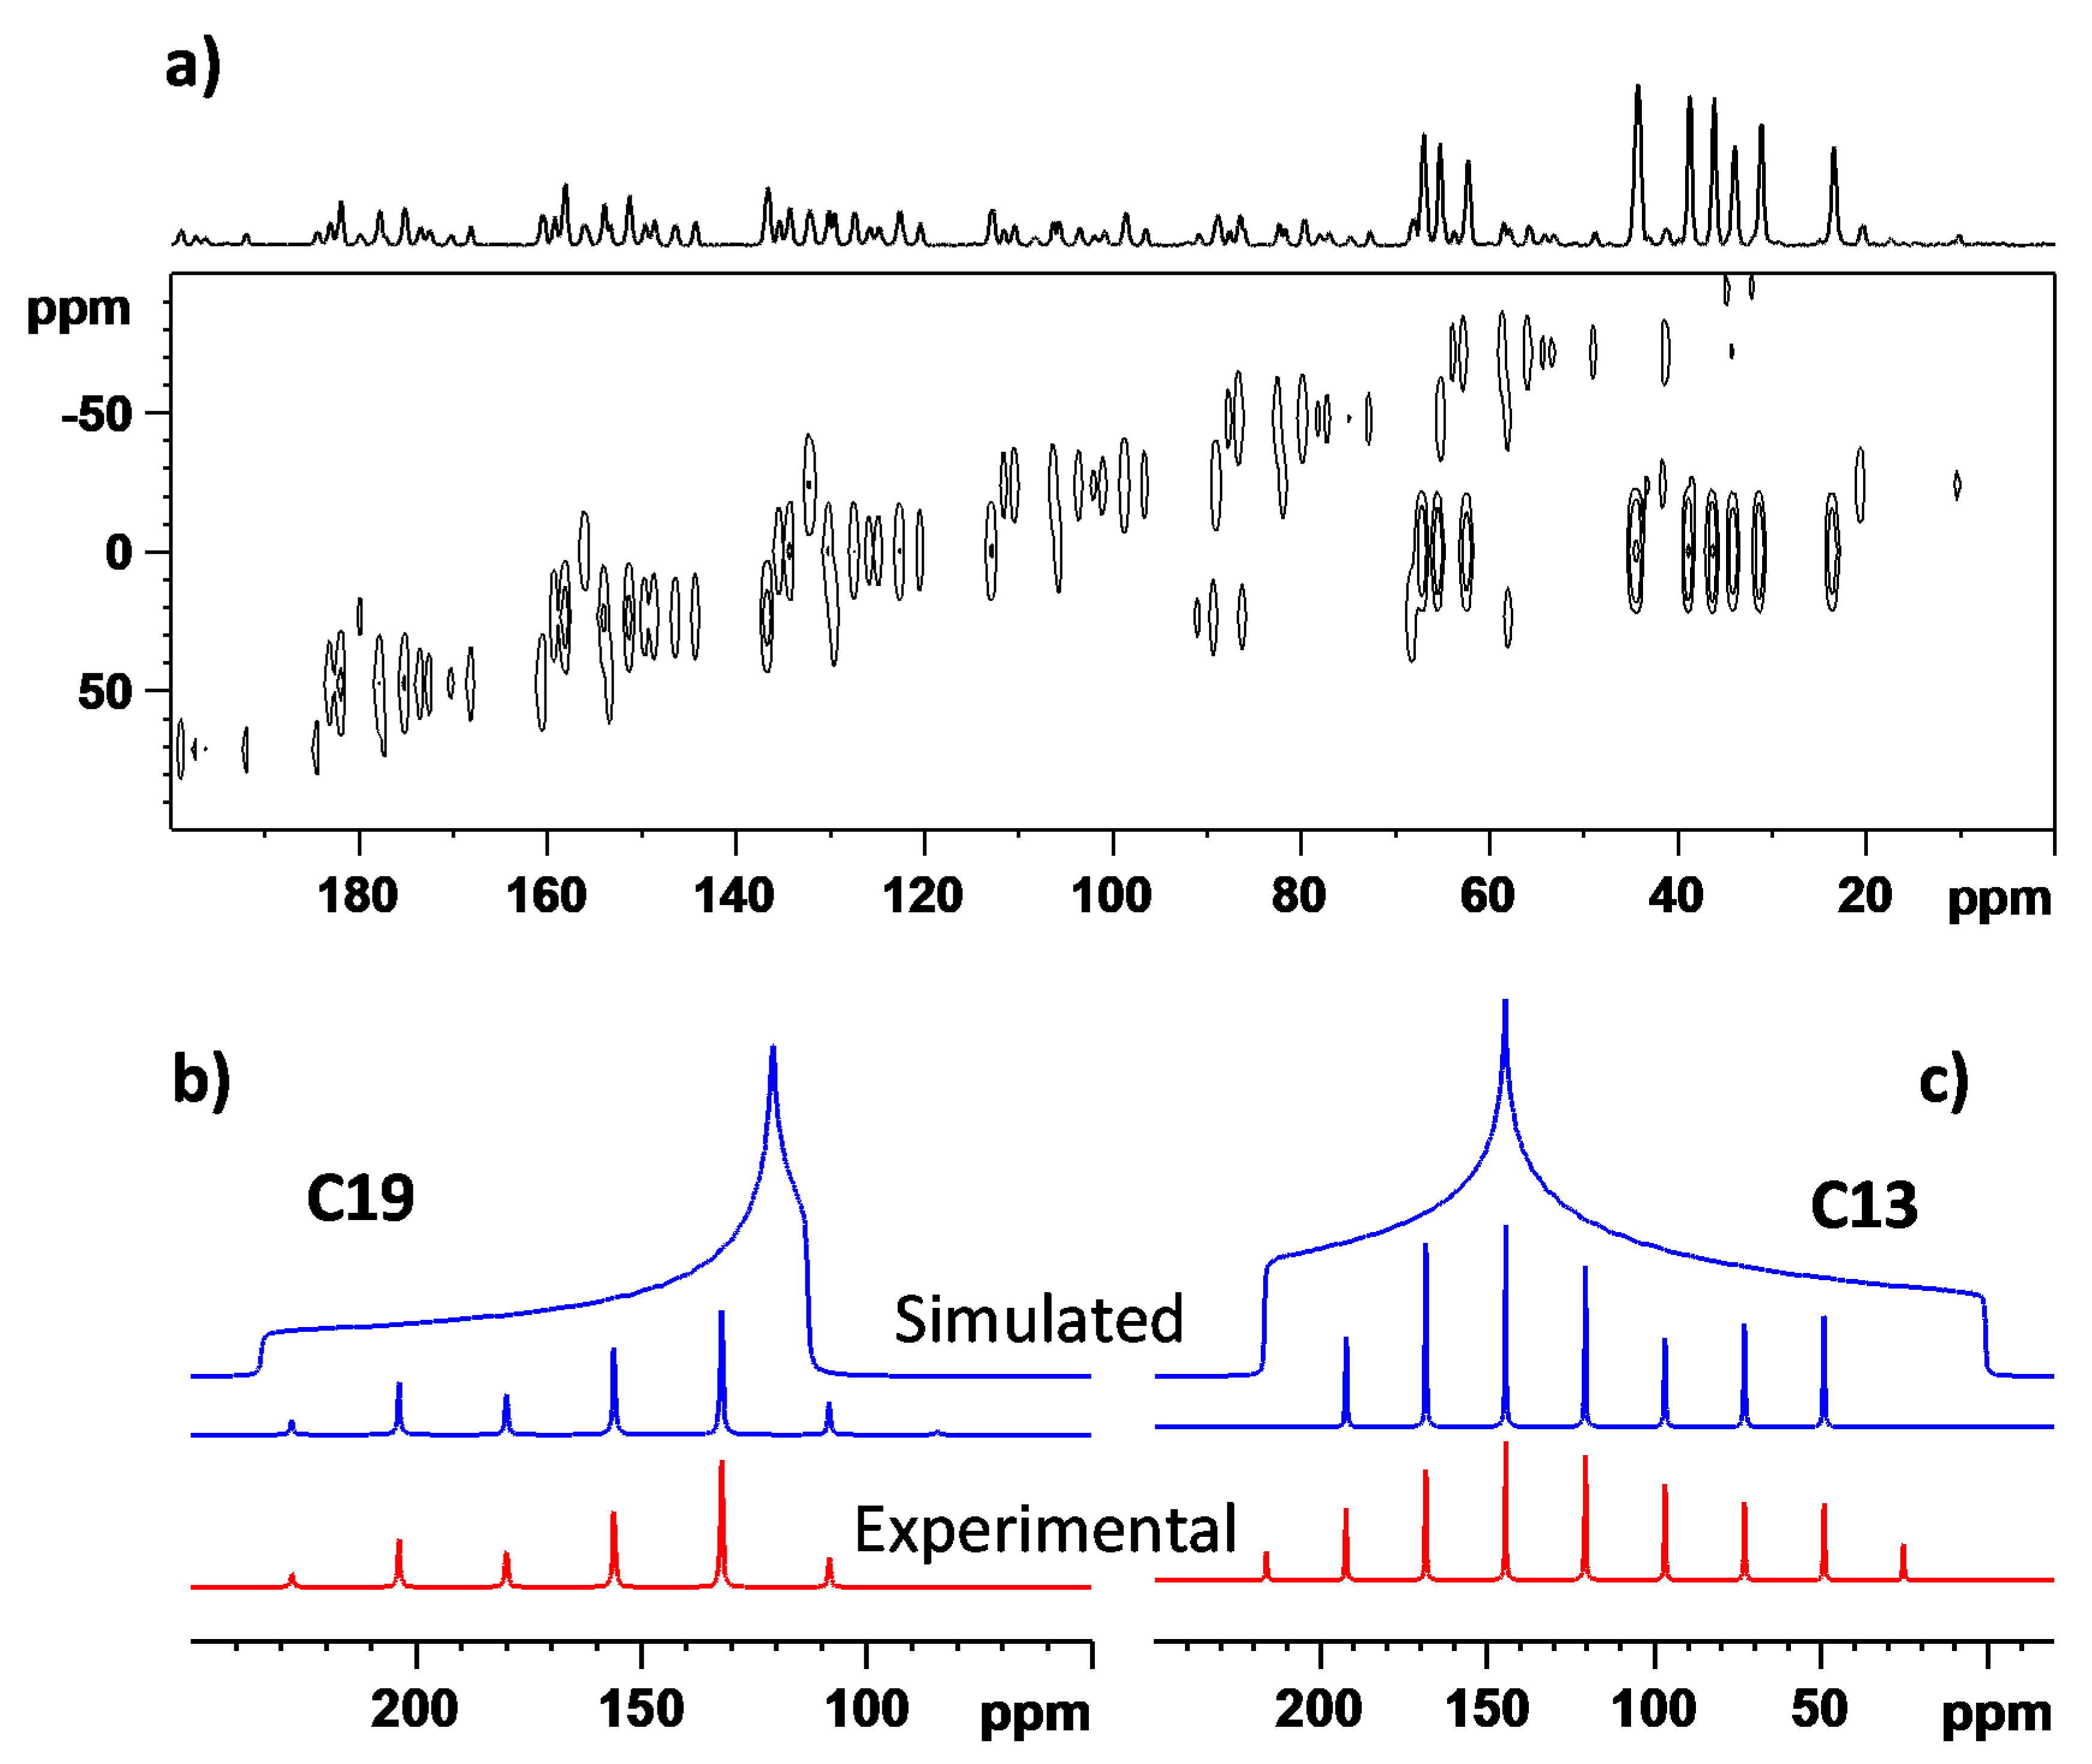
3.3. The 13C NMR Chemical Shift Tensors

To further extend the set of NMR parameters for structural elucidation, the principal elements of the 13C CSTs, δ11, δ22, and δ33, where δ11δ22δ33, of polymorph MI were also measured (see Figure 6). Namely, they were extracted from the 2D 13C PASS spectrum using the standard procedure of simulating the intensity of spinning sidebands [30,31], with an average error estimated to be ±3 ppm. Only the results for the sites not suffering from incomplete signal separation were considered (19 carbons, with a total of 57 principal elements summarized in the Supplementary Materials, namely, in ‘CST.txt’ file). The corresponding principal elements of the GIPAW-RPBE chemical shielding tensors, σ11, σ22, and σ33, where σ11σ22σ33, were computed for the SC XRD structure [15] and for the first 15 CSPs (see Section 2.3). All the theoretical data sets and their experimental counterparts were analyzed by POSEL (POlymorph SELector) software [13] written by one of the authors (J.C.); the relevant output is included in the Supplementary Materials (file ‘RESULTS.TXT’), together with the values of one standard deviation (RMSD) for the 13C and 1H isotropic and 13C CST data. Notably, among the 13C and 1H isotropic chemical shielding sets predicted for these 16 structures, only the results for the experimental geometry are in good agreement with the measured values of both the 13C and 1H isotropic chemical shifts and with the {1H, 13C} peak positions in a HETCOR spectrum (as already demonstrated in Table 1). The CSP ranked 6th by the force field energy was evaluated as the second best candidate (after the XRD geometry, of course), with the following values of selected statistical parameters: σ (13C) = −1.0326*δ (13C) + 174.05 ppm, RMSD = 2.98 ppm; σ (1H) = −1.1415*δ (1H) + 32.79 ppm, RMSD = 0.85 ppm; the covariance, sCH, between the measured and simulated {13C, 1H} HETCOR peaks [18], sCH = 0.226 (ppm)2. The differences in intermolecular arrangements of CSP#6 and XRD structures are apparent from Figure 7. Importantly, this and all the other CSPs have unacceptably high deviations between the computed and measured 1H chemical shifts. However, the discrepancies between the predicted and measured principal elements of the 13C tensors are relatively large even for the SC XRD structure.
Table 2 includes the related statistical results for the experimental geometry; for the aforementioned CSP#6, which was assessed to be the best candidate from among the generated structures; and, for CSP#15, which features close contacts that are not present in the actual structure of polymorph MI, namely, intermolecular interactions between amidic and carbonyl groups. While the best agreement between theory and experiment was still obtained for the SC XRD structure, the errors for the two CSPs are only moderately increased. An independent check of the present approach was performed for the neutron diffraction structure of ibuprofen [40] using the 13C SSNMR measurements by Geppi et al. [47]. The linear regression between the 13C isotropic GIPAW-RPBE chemical shieldings and measured chemical shifts is σ (13C) = −1.0374*δ (13C) + 174.60 ppm with an RMSD of 1.47 ppm (13 data points), while the evaluation of the 13C CST data is provided in Table 2. It is thus observed that, in the case of ibuprofen, which has a precisely determined crystal structure and is not influenced by large-scale motions [55], the predicted principal elements are also relatively inaccurate. In particular, the RMSD of the fit of the theoretical data to the corresponding experimental data (which were determined with ±2 ppm uncertainty [46]) is almost 6 ppm. The implications are discussed in the next section.

4. Discussion

According to an inspection of the results that are presented in Table 1, the XRD structures of polymorphs MI and MII are consistent with the SSNMR data: the key statistical parameters have values expected for a refined geometry of the correct polymorph [16]. An analysis of the measured HETCOR spectrum was straightforward in the case of MI since the connectivity could be traced experimentally, and the PW DFT methods provided high-quality chemical shielding values; in particular, the RMSD value of the theory-to-experiment fit was approximately one ppm for carbons and less than a quarter of a ppm for protons [16]. It should be mentioned, however, that these errors are caused not only by deficiencies in the PW DFT computations of the periodic structure and of the chemical shielding, but also by neglecting the influence of temperature, pressure, and other effects on the measured data. In the case of polymorph MII, the signal assignment was aided by the theoretical predictions. Due to the aforementioned inaccuracies, it is not possible to simply match the calculated chemical shielding with the measured chemical shift in both the 1H and 13C dimensions because it should not be assumed that the sorted σ and −δ values were obtained in the same order from theory and experiment. Instead, similarity measures need to be considered for the most likely permutations of the {1H, 13C} σ and δ data sets [18], with the connectivity kept as in the measured HETCOR spectrum. For example, carbons C21′ and C21″ have 13C chemical shifts of 67.35 and 68.21 ppm, respectively (prime and double prime symbols are used here to formally distinguish the carbons belonging to different symmetry-independent units of the MII crystal structure). The pairs of protons with 1H chemical shifts of 4.69 and 6.04 ppm and of 4.87 and 5.25 ppm are, respectively, connected to C21′ and C21″ (see Figure 3). The GIPAW-RPBE chemical shielding of the two distinct C21 sites is approximately 100.91 and 101.76 ppm, and since the XRD geometry served as an input for the PW calculations, the structural information is of course known for these data: they belong to the atoms numbered C119 and C219 [21]. The protons of the pair H1191 and H1192 bound to C119 have 1H chemical shielding of approximately 24.96 and 26.25 ppm, respectively, while the values amount to 26.50 and 25.96 ppm for the proton pair of H2191 and H2192, respectively, connected to C219. The abovementioned information has to be retained in the assignment of HETCOR peaks to the symmetry-independent structural units (in what follows, they will be designated A and B). One of the two assignment possibilities is to rely on the calculated 13C chemical shielding and assign C21′ to belong to B and C21″ to A; in this case, the ordering of the GIPAW-RPBE 13C chemical shielding, σ(C219) > σ(C119), would correspond to the experimental order of δ(C21′) < δ(C21″). However, the difference between the 1H shielding of the H2191, H2192 pair is 0.54 ppm, while it is 1.35 ppm for the 1H chemical shifts that are connected to C21′. The analogous differences are 1.29 ppm for the 1H shielding of the H1191, H1192 pair and 0.38 for the 1H chemical shifts connected to C21″. At this point, it becomes obvious that the correct assignment is the other one, in which C21′ belongs to A and C21″ belongs to B. Using this procedure, as many as 40 13C–1H pairs in polymorph MII were analysed, and are detailed in the Supplementary Materials.
By employing the measurements of the 13C CSTs of MI polymorph, computing the GIPAW-RPBE 13C chemical shielding tensors for the set of 16 candidate polymorphs (one of which is the SC XRD structure), and extending the POSEL software [13], it was possible to test the NMR crystallography approach, which combines the 13C CSTs with isotropic {1H, 13C} chemical shifts available at the same time. The correct structure was unambiguously identified previously on the basis of the 1H data. The additional information provided by the parameters of the linear regression of the predicted and experimental principal elements of the 13C CSTs turned out to be redundant in this case: for all of the candidates, the values of those parameters were similar in the sense that they alone could not be used to select the correct structure. Nevertheless, they were useful in combination with the isotropic {1H, 13C} data, as they further confirmed that the correct choice had been made. It should be kept in mind, however, that the predicted 13C CSTs are relatively inaccurate, which is also due to an implicit influence of several ppm uncertainties in the experimental values and of their temperature dependence [56].

5. Conclusions

The ability to predict and experimentally verify the structure of complex multicomponent molecular systems remains one of incompletely resolved issues in modern chemistry. A computational-experimental strategy for NMR crystallography that is based on the precise analysis of isotropic values of NMR chemical shifts combined with advanced protocols for crystal structure predictions (CSPs) has proven to be a powerful tool for validation and determination of crystal structures of organic solids. However, with the increase in complexity of crystal structures, the NMR crystallography approach encounters limitations in the reliability of CSPs. In particular, the increase in the number of symmetry-independent molecules in the unit cell or the presence of static and dynamic disorder results in incomplete signal assignment. Consequently, the strategy of NMR crystallography requires further extension. Utilization of anisotropic parameters, such as dipolar and quadrupolar interactions, and inclusion of all three principal components of the chemical shift tensors within the broad temperature range represents one of the possible ways.

Supplementary Materials

The following aforementioned files are available online at https://www.mdpi.com/2073-4352/8/10/378/s1, ‘grids.txt’, ‘isoC.txt’, ‘isoH.txt’, ‘CST.txt’, ‘RESULTS.TXT’, ‘MII.PDF’ and SI-Experimental details.pdf.

Author Contributions

Conceptualization, J.B.; Experiments, M.U., J.B.; Computations, J.C.; Software, J.C.; Writing—Original Draft Preparation, J.C.; Writing—Review & Editing, J.B.; Project Administration, J.B.

Funding

The work was supported by the Ministry of Education, Youth and Sports of CR within the National Sustainability Program I, Project LO1507 POLYMAT.

Conflicts of Interest

The authors declare no conflict of interest.

References

  1. Harris, R.K.; Wasylishen, R.E.; Duer, M.J. NMR Crystallography; Wile: Hoboken, NJ, USA, 2010. [Google Scholar]
  2. Salager, E.; Day, G.M.; Stein, R.S.; Pickard, C.J.; Elena, B.; Emsley, L. Powder crystallography by combined crystal structure prediction and high-resolution 1H solid-state NMR spectroscopy. J. Am. Chem. Soc. 2010, 132, 2564–2566. [Google Scholar] [CrossRef] [PubMed]
  3. Reilly, A.M.; Cooper, R.I.; Adjiman, C.S.; Bhattacharya, S.; Boese, A.D.; Brandenburg, J.G.; Bygrave, P.J.; Bylsma, R.; Campbell, J.E.; Car, R.; et al. Report on the sixth blind test of organic crystal structure prediction methods. Acta Crystallogr. B Struct. Sci. Cryst. Eng. Mater. 2016, 72, 439–459. [Google Scholar] [CrossRef] [PubMed]
  4. Bonhomme, C.; Gervais, C.; Babonneau, F.; Coelho, C.; Pourpoint, F.; Azaïs, T.; Ashbrook, S.E.; Griffin, J.M.; Yates, J.R.; Mauri, F.; et al. First-principles calculation of NMR parameters using the gauge including projector augmented wave method: A chemist’s point of view. Chem. Rev. 2012, 112, 5733–5779. [Google Scholar] [CrossRef] [PubMed]
  5. Ashbrook, S.E.; McKay, D. Combining solid-state NMR spectroscopy with first-principles calculations—A guide to NMR crystallography. Chem. Commun. (Camb.) 2016, 52, 7186–7204. [Google Scholar] [CrossRef] [PubMed] [Green Version]
  6. Bryce, D.L. NMR crystallography: Structure and properties of materials from solid-state nuclear magnetic resonance observables. IUCrj 2017, 4, 350–359. [Google Scholar] [CrossRef] [PubMed]
  7. Tatton, A.S.; Blade, H.; Brown, S.P.; Hodgkinson, P.; Hughes, L.P.; Lill, S.O.N.; Yates, J.R. Improving confidence in crystal structure solutions using NMR crystallography: The case of β-piroxicam. Cryst. Growth Des. 2018, 18, 3339–3351. [Google Scholar] [CrossRef]
  8. Nilsson Lill, S.O.; Widdifield, C.M.; Pettersen, A.; Svensk Ankarberg, A.; Lindkvist, M.; Aldred, P.; Gracin, S.; Shankland, N.; Shankland, K.; Schantz, S.; et al. Elucidating an amorphous form stabilization mechanism for Tenapanor hydrochloride: Crystal structure analysis using X-ray diffraction, NMR crystallography, and molecular modeling. Mol. Pharm. 2018, 15, 1476–1487. [Google Scholar] [CrossRef] [PubMed]
  9. Kobera, L.; Rohlicek, J.; Czernek, J.; Abbrent, S.; Streckova, M.; Sopcak, T.; Brus, J. Unexpected crystallization patterns of zinc boron imidazolate framework ZBIF-1: NMR crystallography of integrated metal-organic frameworks. ChemPhysChem 2017, 18, 3576–3582. [Google Scholar] [CrossRef] [PubMed]
  10. Czernek, J.; Pawlak, T.; Potrzebowski, M.J.; Brus, J. The comparison of approaches to the solid-state NMR-based structural refinement of vitamin B1 hydrochloride and of its monohydrate. Chem. Phys. Lett. 2013, 555, 135–140. [Google Scholar] [CrossRef]
  11. Hušák, M.; Jegorov, A.; Rohlíček, J.; Fitch, A.; Czernek, J.; Kobera, L.; Brus, J. Determining the crystal structures of peptide analogs of boronic acid in the absence of single crystals: Intricate motifs of ixazomib citrate revealed by XRPD guided by ss-NMR. Cryst. Growth Des. 2018, 18, 3616–3625. [Google Scholar] [CrossRef]
  12. Brus, J.; Czernek, J.; Kobera, L.; Urbanova, M.; Abbrent, S.; Husak, M. Predicting the crystal structure of decitabine by powder NMR crystallography: Influence of long-range molecular packing symmetry on NMR parameters. Cryst. Growth Des. 2016, 16, 7102–7111. [Google Scholar] [CrossRef]
  13. Brus, J.; Czernek, J.; Hruby, M.; Svec, P.; Kobera, L.; Abbrent, S.; Urbanova, M. Efficient strategy for determining the atomic-resolution structure of micro- and nanocrystalline solids within polymeric microbeads: Domain-edited NMR crystallography. Macromolecules 2018, 51, 5364–5374. [Google Scholar] [CrossRef]
  14. Turner, E.H.; Schwartz, P.J.; Lowe, C.H.; Nawab, S.S.; Feldman-Naim, S.; Drake, C.L.; Myers, F.S.; Barnett, R.L.; Rosenthal, N.E. Double-blind, placebo-controlled study of single-dose Metergoline in depressed patients with seasonal affective disorder. J. Clin. Psychopharmacol. 2002, 22, 216–220. [Google Scholar] [CrossRef] [PubMed]
  15. Serantoni, E.F.; Sabatino, P.; Riva di Sanseverino, L.; Sheldrick, G.M. 6-Dimethyl-8β-[(benzyloxycarbonyl) aminomethyl]-10α-ergoline, ‘Lyserdol’. Acta Crystallogr. B 1977, 33, 2899–2902. [Google Scholar] [CrossRef]
  16. Czernek, J.; Brus, J. Theoretical predictions of the two-dimensional solid-state NMR spectra: A case study of the 13C–1H correlations in metergoline. Chem. Phys. Lett. 2013, 586, 56–60. [Google Scholar] [CrossRef]
  17. Beran, G.J.O. Modeling polymorphic molecular crystals with electronic structure theory. Chem. Rev. 2016, 116, 5567–5613. [Google Scholar] [CrossRef] [PubMed]
  18. Czernek, J.; Brus, J. The covariance of the differences between experimental and theoretical chemical shifts as an aid for assigning two-dimensional heteronuclear correlation solid-state NMR spectra. Chem. Phys. Lett. 2014, 608, 334–339. [Google Scholar] [CrossRef]
  19. Czernek, J. On the solid-state NMR spectra of naproxen. Chem. Phys. Lett. 2015, 619, 230–235. [Google Scholar] [CrossRef]
  20. Asakura, T.; Ohata, T.; Kametani, S.; Okushita, K.; Yazawa, K.; Nishiyama, Y.; Nishimura, K.; Aoki, A.; Suzuki, F.; Kaji, H.; et al. Intermolecular packing in B. mori silk fibroin: Multinuclear NMR study of the model peptide (Ala-Gly) 15 defines a heterogeneous antiparallel antipolar mode of assembly in the silk II form. Macromolecules 2015, 48, 28–36. [Google Scholar] [CrossRef]
  21. Hušák, M.; Jegorov, A.; Brus, J.; van Beek, W.; Pattison, P.; Christensen, M.; Favre-Nicolin, V.; Maixner, J. Metergoline II: Structure solution from powder diffraction data with preferred orientation and from microcrystal. Struct. Chem. 2008, 19, 517–525. [Google Scholar] [CrossRef]
  22. Sakellariou, D.; Lesage, A.; Hodgkinson, P.; Emsley, L. Homonuclear dipolar decoupling in solid-state NMR using continuous phase modulation. Chem. Phys. Lett. 2000, 319, 253–260. [Google Scholar] [CrossRef]
  23. Wu, X.L.; Burns, S.T.; Zilm, K.W. Spectral editing in CPMAS NMR. Generating subspectra based on proton multiplicities. J. Magn. Reson. Ser. A 1994, 111, 29–36. [Google Scholar] [CrossRef]
  24. Van Rossum, B.-J.; Förster, H.; de Groot, H.J.M. High-field and high-speed CP-MAS13C NMR heteronuclear dipolar-correlation spectroscopy of solids with frequency-switched Lee–Goldburg homonuclear decoupling. J. Magn. Reson. 1997, 124, 516–519. [Google Scholar] [CrossRef]
  25. Lesage, A.; Bardet, M.; Emsley, L. Through-Bond Carbon−Carbon Connectivities in Disordered Solids by NMR. J. Am. Chem. Soc. 1999, 121, 10987–10993. [Google Scholar] [CrossRef]
  26. Brus, J.; Jegorov, A. Through-bonds and through-space solid-state NMR correlations at natural isotopic abundance: Signal assignment and structural study of simvastatin. J. Phys. Chem. A 2004, 108, 3955–3964. [Google Scholar] [CrossRef]
  27. Sakellariou, D.; Lesage, A.; Emsley, L. Proton-proton constraints in powdered solids from 1H–1H–1H and 1H–1H–13C three-dimensional NMR chemical shift correlation spectroscopy. J. Am. Chem. Soc. 2001, 123, 5604–5605. [Google Scholar] [CrossRef] [PubMed]
  28. Brown, S.P.; Lesage, A.; Elena, B.; Emsley, L. Probing proton-proton proximities in the solid state: High-resolution two-dimensional 1H–1H double-quantum CRAMPS NMR spectroscopy. J. Am. Chem. Soc. 2004, 126, 13230–13231. [Google Scholar] [CrossRef] [PubMed]
  29. Hohwy, M.; Rienstra, C.M.; Jaroniec, C.P.; Griffin, R.G. Fivefold symmetric homonuclear dipolar recoupling in rotating solids: Application to double quantum spectroscopy. J. Chem. Phys. 1999, 110, 7983–7992. [Google Scholar] [CrossRef]
  30. Antzutkin, O.N.; Shekar, S.C.; Levitt, M.H. Two-dimensional sideband separation in magic-angle-spinning NMR. J. Magn. Reson. Ser. A 1995, 115, 7–19. [Google Scholar] [CrossRef]
  31. Antzutkin, O.N.; Lee, Y.K.; Levitt, M.H. 13C and 15N-chemical shift anisotropy of ampicillin and penicillin-V studied by 2D-PASS and CP/MAS NMR. J. Magn. Reson. 1998, 135, 144–155. [Google Scholar] [CrossRef] [PubMed]
  32. Ladizhansky, V.; Vega, S. Polarization transfer dynamics in Lee-Goldburg Cross polarization nuclear magnetic resonance experiments on rotating solids. J. Chem. Phys. 2000, 112, 7158–7168. [Google Scholar] [CrossRef]
  33. Hong, M.; Yao, X.L.; Jakes, K.; Huster, D. Investigation of molecular motions by Lee-Goldburg cross-polarization NMR Spectroscopy. J. Phys. Chem. B 2002, 106, 7355–7364. [Google Scholar] [CrossRef]
  34. Ramamoorthy, A.; Wei, Y.F.; Lee, D.K. PISEMA solid-state NMR spectroscopy. Ann. Rep. NMR Spectrosc. 2004, 52, 1–52. [Google Scholar] [CrossRef]
  35. Brus, J.; Urbanova, M. Selective measurement of heteronuclear 1H–13C dipolar couplings in motionally heterogeneous semicrystalline polymer systems. J. Phys. Chem. A 2005, 109, 5050–5054. [Google Scholar] [CrossRef] [PubMed]
  36. Langer, B.; Schnell, I.; Spiess, H.W.; Grimmer, A.R. Temperature calibration under ultrafast MAS conditions. J. Magn. Reson. 1999, 138, 182–186. [Google Scholar] [CrossRef] [PubMed]
  37. Brus, J. Heating of samples induced by fast magic-angle spinning. Solid State Nucl. Magn. Reson. 2000, 16, 151–160. [Google Scholar] [CrossRef]
  38. Materials Studio 5.0. Available online: http://www.3dsbiovia.com/products/collaborative-science/biovia-materials-studio (accessed on 24 September 2018).
  39. Hammer, B.; Hansen, L.B.; Nørskov, J.K. Improved adsorption energetics within density-functional theory using revised Perdew-Burke-Ernzerhof functionals. Phys. Rev. B 1999, 59, 7413–7421. [Google Scholar] [CrossRef] [Green Version]
  40. Shankland, N.; Wilson, C.C.; Florence, A.J.; Cox, P.J. Refinement of ibuprofen at 100 K by single-crystal pulsed neutron diffraction. Acta Crystallogr. C 1997, 53, 951–954. [Google Scholar] [CrossRef]
  41. Clark, S.J.; Segall, M.D.; Pickard, C.J.; Hasnip, P.J.; Probert, M.J.; Refson, K.; Payne, M.C. First principles methods using CASTEP. Z. Kristallogr. 2005, 220, 567–570. [Google Scholar] [CrossRef] [Green Version]
  42. Kresse, G.; Joubert, D. From ultrasoft pseudopotentials to the projector augmented-wave method. Phys. Rev. B 1999, 59, 1758–1775. [Google Scholar] [CrossRef]
  43. Segall, M.D.; Lindan, P.J.D.; Probert, M.J.; Pickard, C.J.; Hasnip, P.J.; Clark, S.J.; Payne, M.C. First-principles simulation: Ideas, illustrations and the CASTEP code. J. Phys. Condens. Matter 2002, 14, 2717. [Google Scholar] [CrossRef]
  44. Monkhorst, H.J.; Pack, J.D. Special points for Brillouin-zone integrations. Phys. Rev. B 1976, 13, 5188–5192. [Google Scholar] [CrossRef]
  45. Pickard, C.J.; Mauri, F. All-electron magnetic response with pseudopotentials: NMR chemical shifts. Phys. Rev. B 2001, 63, 245101. [Google Scholar] [CrossRef]
  46. Yates, J.R.; Pickard, C.J.; Mauri, F. Calculation of NMR chemical shifts for extended systems using ultrasoft pseudopotentials. Phys. Rev. B 2007, 76, 024401. [Google Scholar] [CrossRef]
  47. Carignani, E.; Borsacchi, S.; Marini, A.; Mennucci, B.; Geppi, M. 13C chemical shielding tensors: A combined solid-state NMR and DFT study of the role of small-amplitude motions. J. Phys. Chem. C 2011, 115, 25023–25029. [Google Scholar] [CrossRef]
  48. Dračínský, M.; Hodgkinson, P. A molecular dynamics study of the effects of fast molecular motions on solid-state NMR parameters. CrystEngComm 2013, 15, 8705–8712. [Google Scholar] [CrossRef] [Green Version]
  49. Pawlak, T.; Trzeciak-Karlikowska, K.; Czernek, J.; Ciesielski, W.; Potrzebowski, M.J. Computed and experimental chemical shift parameters for rigid and flexible YAF peptides in the solid state. J. Phys. Chem. B 2012, 116, 1974–1983. [Google Scholar] [CrossRef] [PubMed]
  50. Brus, J.; Urbanová, M.; Kelnar, I.; Kotek, J. A solid-state NMR study of structure and segmental dynamics of semicrystalline elastomer-toughened nanocomposites. Macromolecules 2006, 39, 5400–5409. [Google Scholar] [CrossRef]
  51. Brus, J.; Urbanová, M.; Strachota, A. Epoxy networks reinforced with polyhedral oligomeric silsesquioxanes: Structure and segmental dynamics as studied by solid-state NMR. Macromolecules 2008, 41, 372–386. [Google Scholar] [CrossRef]
  52. Brus, J.; Jakeš, J. Geometry of multiple-spin systems as reflected in 13C–{1H} dipolar spectra measured at Lee-Goldburg cross-polarization. Solid State Nucl. Magn. Reson. 2005, 27, 180–191. [Google Scholar] [CrossRef] [PubMed]
  53. Palmer, A.G.; Williams, J.; McDermott, A. Nuclear magnetic resonance studies of biopolymer dynamics. J. Phys. Chem. 1996, 100, 13293–13310. [Google Scholar] [CrossRef]
  54. Lipari, G.; Szabo, A. Model-free approach to the interpretation of nuclear magnetic resonance relaxation in macromolecules. 1. Theory and range of validity. J. Am. Chem. Soc. 1982, 104, 4546–4559. [Google Scholar] [CrossRef]
  55. Carignani, E.; Borsacchi, S.; Geppi, M. Detailed characterization of the dynamics of ibuprofen in the solid state by a multi-technique NMR approach. ChemPhysChem 2011, 12, 974–981. [Google Scholar] [CrossRef] [PubMed]
  56. Carignani, E.; Borsacchi, S.; Concistrè, M.; Johannessen, O.G.; Geppi, M. Direct observation of the effects of small-amplitude motions on 13C nuclear shielding tensors by means of low-temperature 2D MAS NMR spectroscopy. Chem. Phys. Lett. 2018, 706, 107–112. [Google Scholar] [CrossRef]
Figure 1. Chemical structure and numbering of metergoline, C25H29N3O2.
Crystals 08 00378 g001
Figure 2. X-ray diffraction (XRD) crystal structure [15] and two-dimensional (2D) 1H–13C FSLG HETCOR NMR spectra of MI measured with 100 and 300 μs CP mixing times are shown in panels (a,b), respectively; 2D 1H–1H CRAMPS NMR spectrum of MI measured with a 25 μs spin-diffusion period (c); and 2D 1H–1H DQ/SQ CRAMPS NMR spectrum of MI measured with a 40 μs recoupling period (d). Upper projections are provided by one-dimensional (1D) 13C CP/MAS and 1H CRAMPS NMR spectra. The connectivity of individual structural units is indicated. For the full-size spectra, see Supporting Information (SI-Experimental details.pdf).
Crystals 08 00378 g002
Figure 3. XRD crystal structure [21] 2D 1H–13C FSLG HETCOR NMR spectra of MII measured with 100 and 300 μs CP mixing times are shown in panels (a,b), respectively; 2D 1H–1H CRAMPS NMR spectrum of MII measured with a 25 μs spin-diffusion period (c); and 2D 1H–1H DQ/SQ CRAMPS NMR spectrum of MII measured with a 40 μs recoupling period (d). Upper projections are provided by 1D 13C CP/MAS and 1H CRAMPS NMR spectra. The connectivity of individual structural units is indicated. For the full-size spectra, see Supporting Information (SI-Experimental details.pdf).
Crystals 08 00378 g003
Figure 4. The experimentally recorded 2D 13C–13C CP-INADEQUATE NMR spectrum of MII. In the inset, the connectivity of individual carbon chains in two symmetry-independent molecules is indicated for the aliphatic region. The upper projection is provided by the 1D 13C CP/MAS NMR spectrum. The total experimental time of data acquisition was eight days. For full-size spectra see Supporting Information (SI-Experimental details).
Crystals 08 00378 g004
Figure 5. Expanded regions of 2D 1H–13C PISEMA NMR spectra for polymorphs MI and MII in panels (a,b), respectively. Upper projections are provided by 1D 13C CP/MAS NMR spectra. For full-size spectra see Supporting Information (SI-Experimental details.pdf).
Crystals 08 00378 g005
Figure 6. The 2D 13C CP/PASS NMR spectrum of polymorph MI (panel a), and selected manifolds, shown in red: C19 (C=O) and C13 (CH=) sites in panels (b,c), respectively (the corresponding simulated spinning sidebands are shown in blue).
Crystals 08 00378 g006
Figure 7. A typical fragment of molecular packing in crystalline Metergoline Form I (MI) as determined by XRD analysis (a), and the corresponding fragment found in the crystal structure prediction CSP#6 (b).
Crystals 08 00378 g007
Table 1. Statistical evaluation of the agreement between the GIPAW-RPBE chemical shieldings and experimental chemical shifts for the polymorphs of metergoline.
ParameterPolymorph/Simulated Spectrum
MI/13C 1DMI/1H 1DMII/13C 1DMII/1H 1D
slope−1.0191−1.0464−1.0198−0.9237
standard error of slope0.00520.01920.00490.0218
intercept/(ppm)173.4032.20173.0030.84
standard error of intercept/(ppm)0.530.100.490.11
standard deviation/(ppm)1.050.231.380.39
average abs. deviation/(ppm)0.770.190.990.28
maximum abs. deviation/(ppm)2.340.444.181.29
adjusted R20.999410.992310.998980.97353
number of data points24244650
MI/{1H, 13C} 2DMII/{1H, 13C} 2D
covariance/((ppm)2)0.04680.125
number of pairs1840
Table 2. Statistical evaluation of the agreement between the principal elements of the GIPAW-RPBE 13C chemical shielding tensors obtained for three structural models of metergoline, and the principal elements of the 13C chemical shift tensors measured for polymorph I. The results for ibuprofen are included for comparison purposes.
ParameterMetergoline StructureIbuprofen
XRDCSP#6CSP#15
slope−1.0496−1.0576−1.0439−1.0744
standard error of slope0.00810.01030.01120.0113
intercept/(ppm)176.08176.18174.86177.93
standard error of intercept/(ppm)0.941.191.291.36
standard deviation/(ppm)4.535.726.215.66
average abs. deviation/(ppm)1.151.501.561.55
maximum abs. deviation/(ppm)13.516.015.712.5
adjusted R20.996640.994720.993640.99585
number of data points57575739

