Review

Ferroelectricity in Simple Binary Crystals

Department of Physics, Faculty of Science, Hokkaido University, Sapporo 060-0810, Japan
*
Author to whom correspondence should be addressed.
Crystals 2017, 7(8), 232; https://doi.org/10.3390/cryst7080232
Submission received: 28 April 2017 / Revised: 22 May 2017 / Accepted: 23 May 2017 / Published: 28 July 2017
(This article belongs to the Special Issue Crystal Structure of Electroceramics)

Abstract

:
The origin of ferroelectricity in doped binary crystals, Pb1−xGexTe, Cd1−xZnxTe, Zn1−xLixO, and Hf1−xZrxO2 is discussed, while no binary ferroelectrics have been reported except for two crystals, HCl and HBr. The ferroelectricity is induced only in doped crystals, which shows an importance of electronic modification in chemical bonds by dopants. The phenomenological and microscopic treatments are given for the appearance of ferroelectric activity. The discovery of ferroelectricity in binary crystals such as ZnO and HfO2 is of high interest in fundamental science and also in application for complementary metal–oxide semiconductor (CMOS) technology.

1. Introduction

Ferroelectrics are expected as a key material for next-generation nonvolatile ferroelectric memories (FeRAM), piezoelectric actuators, high-k gate-materials for high-speed FET (field effect transistor), and optoelectronic devices [1,2,3,4,5,6]. Particularly, ferroelectric thin films such as perovskite PZT (PbZr1−xTixO3) and Bi-layered perovskite SBT (SrBi2Ta2O9) have been investigated extensively for FeRAM, because of their excellent dielectric properties, i.e., high dielectric constant and large spontaneous polarization. However, it is not so easy to fabricate good quality ferroelectric thin films on silicon substrate and integrate into devices overcoming degradation of ferroelectric properties due to the so-called size effect. Many ferroelectrics have crystal structures consisting of more than three atoms. For example, BaTiO3, known as a typical ferroelectric with a perovskite structure, consists of three atoms. New materials with a simple structure are not only preferable for understanding the microscopic origin of ferroelectricity, but are also easy for integrating into modern ferroelectric devices. No ferroelectrics with two atoms have been reported except for two molecular crystals, HCl and HBr (Table 1) [7]. In 1969, Cochran developed the theory of lattice dynamics for alkali halide crystals such NaCl and discussed the possibility of ferroelectricity, which revealed a real alkali halide crystal is not a ferroelectric, because a short-range restoring contribution is about twice as great as a long-range Coulomb contribution as discussed later [8,9,10]. However, it is important to point out that these two contributions are the same order for alkali halide crystals. We will show in this article that this balance of these two contributions may be modified by introducing some dopants, strain or defects in crystals.
The electronic ferroelectricity was found in wide-gap semiconductor ZnO by introducing a small amount of Li dopants, although pure ZnO does not show any evidence of ferroelectricity [11,12,13,14,15]. ZnO has a simple binary AB structure with high-symmetry (wurtzite structure). Besides ZnO, Ge-doped PbTe, a IV-VI narrow-gap semiconductor [16], and Zn-doped CdTe, a II-VI wide-gap semiconductor [17], have been investigated as materials of binary crystals accompanying ferroelectricity (Figure 1). Moreover, recent works showed that thin films of HfO2-ZrO2 systems exhibit ferroelectricity [18,19]. Hafnia (HfO2) and Zirconia (ZrO2) have been well studied as high-k dielectric materials in CMOS (complementary metal–oxide semiconductor) technology. Pure HfO2 crystal is monoclinic with space group P21/c at room temperature and atmospheric pressure. Only HfO2 thin films doped with Si, Y, Al and Zr change the monoclinic crystal structure to a polar orthorhombic structure. The discovery of ferroelectricity in binary crystals such as ZnO and HfO2 is of high interest in fundamental science and also in application fields. Our concern is to study the origin of this unexpected appearance of ferroelectricity in doped binary crystals. We will discuss why the ferroelectricity does not appear in pure systems but in doped crystals.

2. Ferroelectricity in Binary Semiconductors

Ferroelectrics, in general, have complicated crystal structures, which undergo a phase transition from a paraelectric high-temperature phase with decreasing temperature, breaking the symmetry of inversion. The dielectric constant (ε) and the spontaneous polarization (Ps) are characterized in the mean field approximation as
ε = C/(TTc)
Ps = Po (TTc)1/2
where Tc is a critical temperature. Ferroelectrics are generally classified into order-disorder, displacive and improper types, though multiferroic materials have been reported recently. According to these types, they show the following characteristic dielectric properties as summarized in Table 2 [20].
Binary ferroelectric crystals show different but common dielectric behavior from those of the usual ferroelectrics described above; a small dielectric anomaly at Tc and relatively large Ps. We will review the ferroelectric properties of the ferroelectric binary semiconductors, PbTe, CdTe and ZnO, and a high-k dielectric HfO2, briefly in this section. More detailed discussion should be referred in a monograph [15].

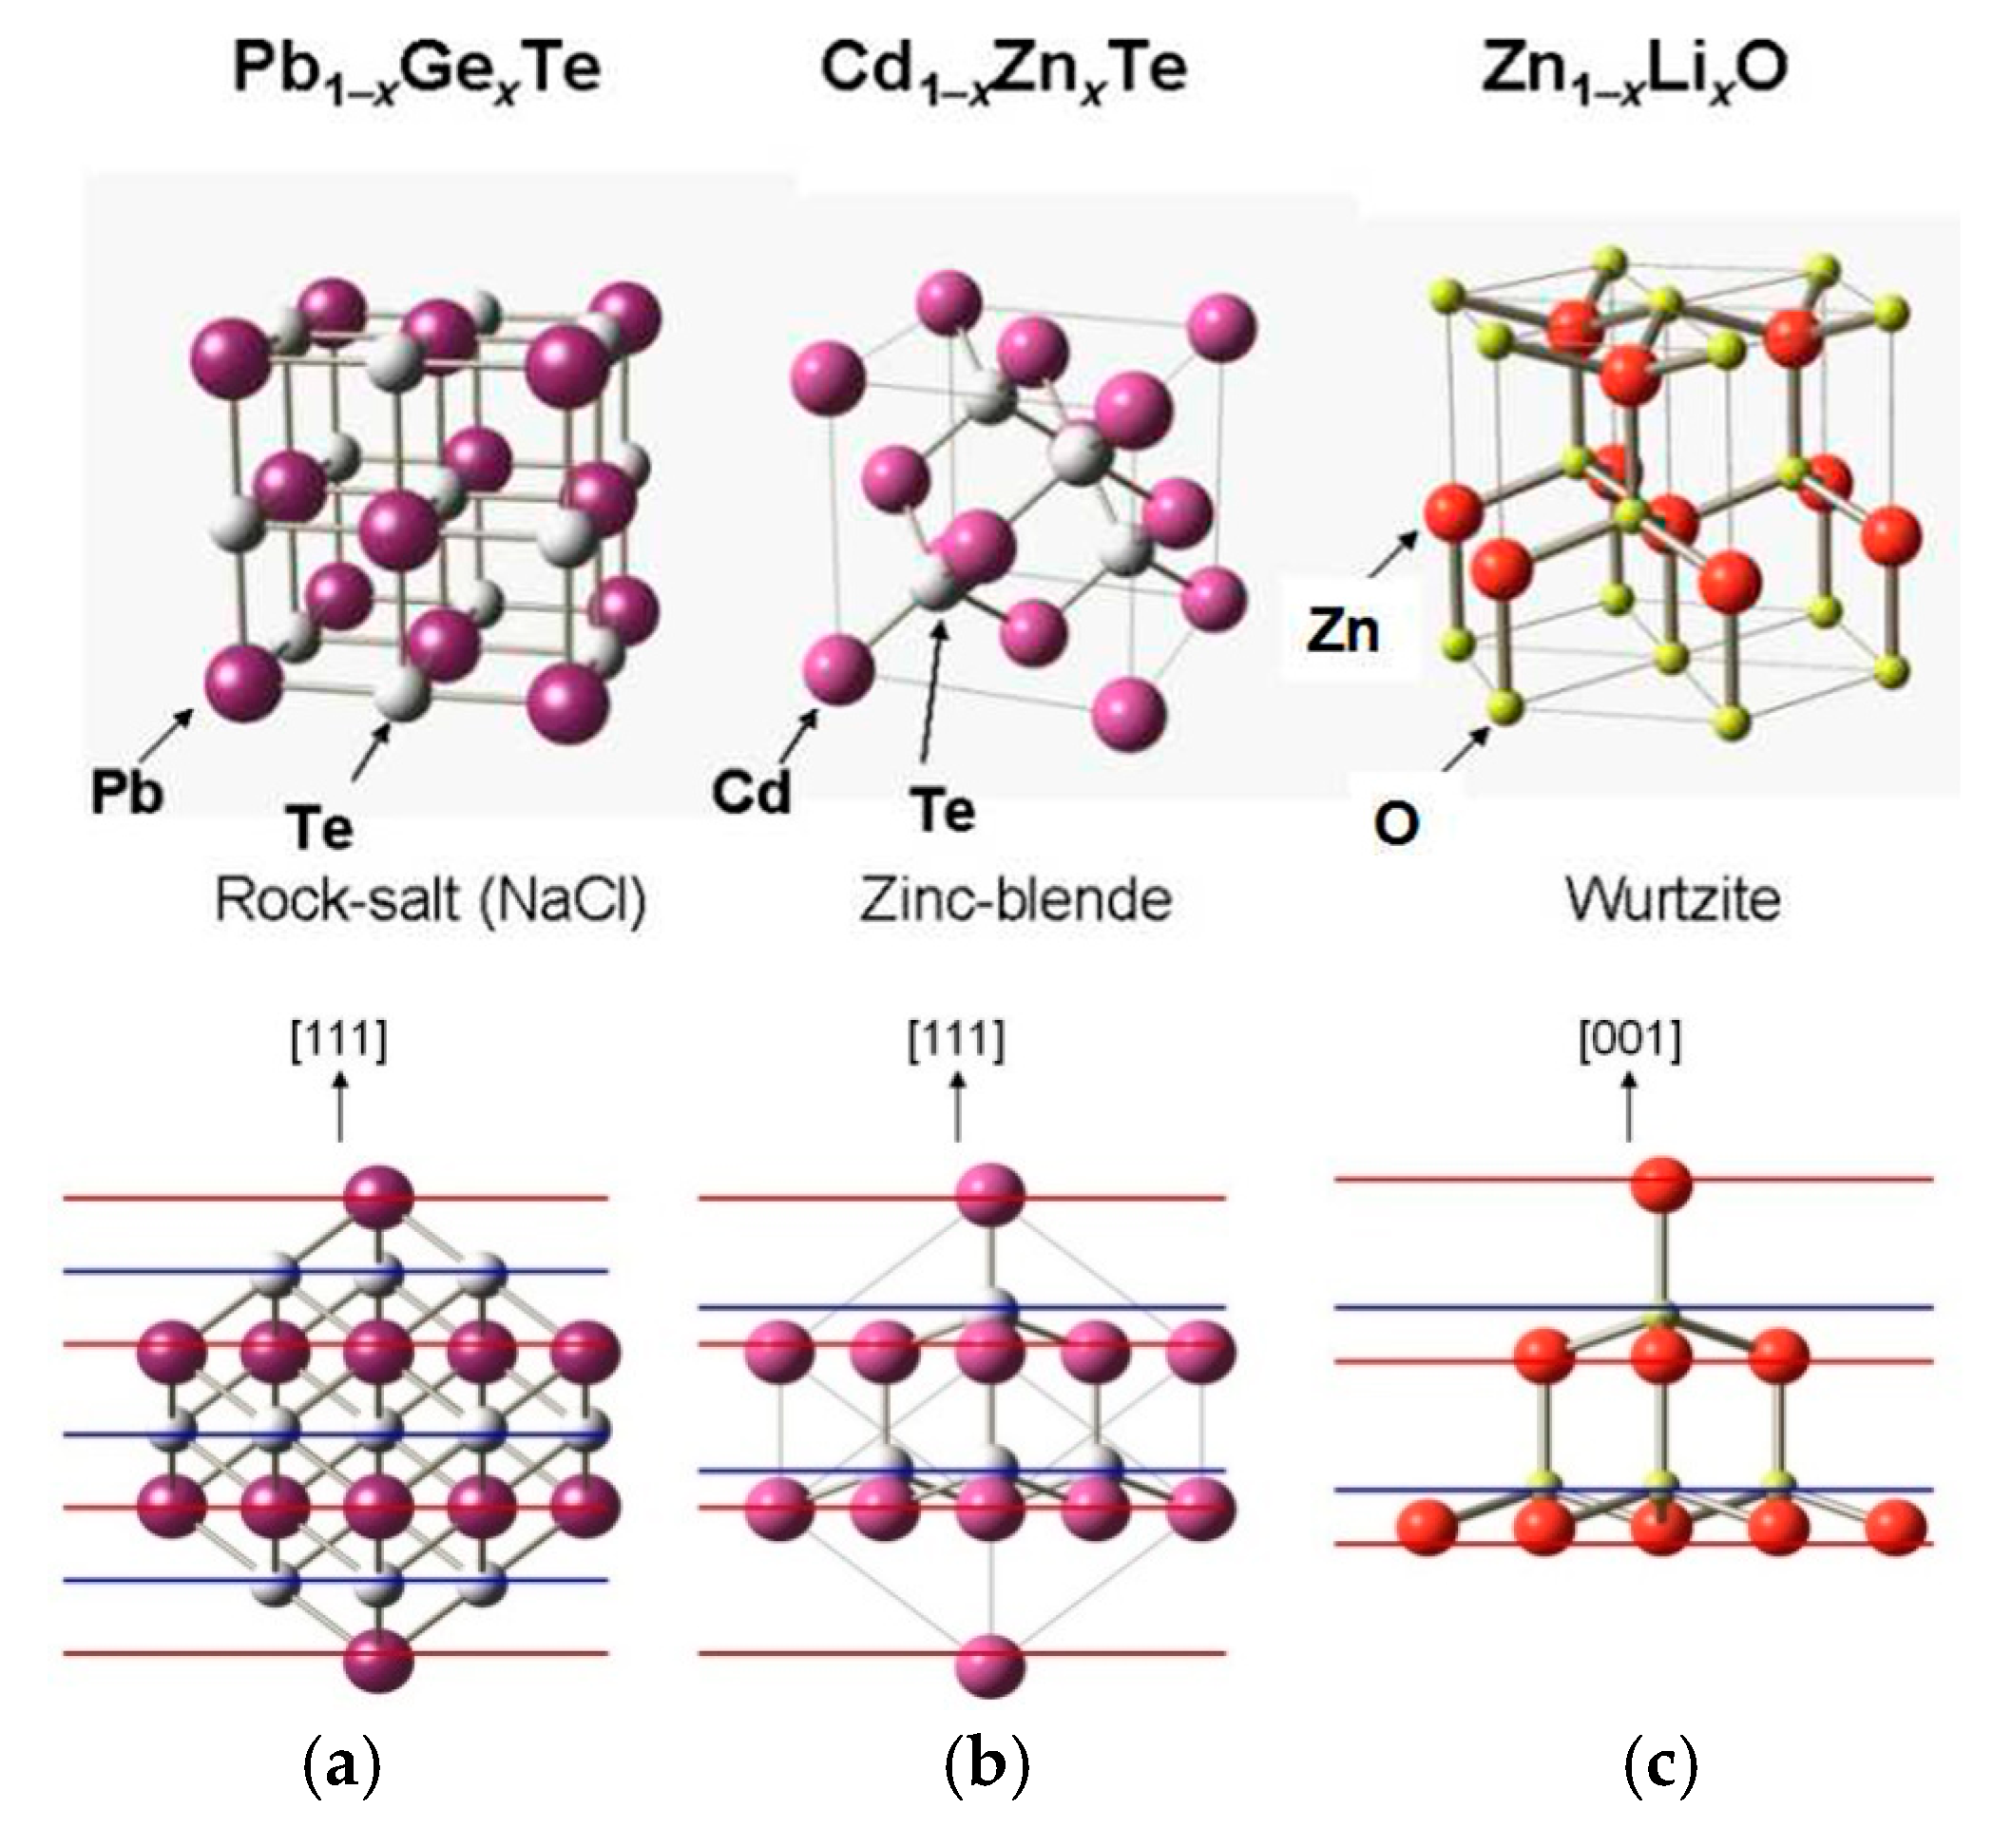
2.1. Narrow-Gap Ferroelectric Semiconductor PbTe

The PbTe-GeTe system has been investigated extensively about its ferroelectricity among IV-VI semiconductors [16], which has a rock-salt type structure (Fm3m, a = 6.46 Å) at room temperature. The energy gap (Eg) is 0.3 eV, which is comparable to the Lorentz field (4π/3)P. The ferroelectricity is observed in solid solution Pb1−xGexTe. The stacking Pb2+ cation and Te2− anion layers dimerize along the rhombohedral [111] direction, as shown in Figure 1. The crystal changes to a rhombohedral structure (R3m) which allows it to exhibit ferroelectric activity Pb1−xGexTe with x = 0.003 shows a large dielectric anomaly at T = 100 K.
The large dielectric anomaly and the existence of the soft mode suggest the ferroelectric activity.

2.2. Wide-Gap Ferroelectric Semiconductor CdTe

Cd1−xZnxTe is a II-VI wide-gap semiconductor with Eg = 1.53 eV. Weil et al. discovered the ferroelectric activity in Cd1−xZnxTe, as shown in Figure 2 [17,21]. The cubic zinc-blende structure (space group F 4   ¯ 3 m , a = 6.486 Å) of pure CdTe crystal changes to a rhombohedral one (R3m, a = 6.401 Å, α = 89.94°) in Cd1−xZnxTe, as shown in Figure 1b. The dielectric anomaly at Tc (393 K) is smaller by two orders than that of typical ferroelectric BaTiO3 (~14,000). The spontaneous polarization is about 5 µC/cm2 along the rhombohedral [111] direction. Doped Zn ions locate at off-center positions [22] which cause rhombohedral distortion of about 0.01 Å in Cd1−xZnxTe [22].
No soft mode has been observed in Cd1−xZnxTe, and the dielectric anomaly is small. Although the behavior of off-center ions plays an important role in this ferroelectricity like Pb1−xGexTe, the occurrence of phase transition seems to be driven in a different way from that of Pb1−xGexTe.

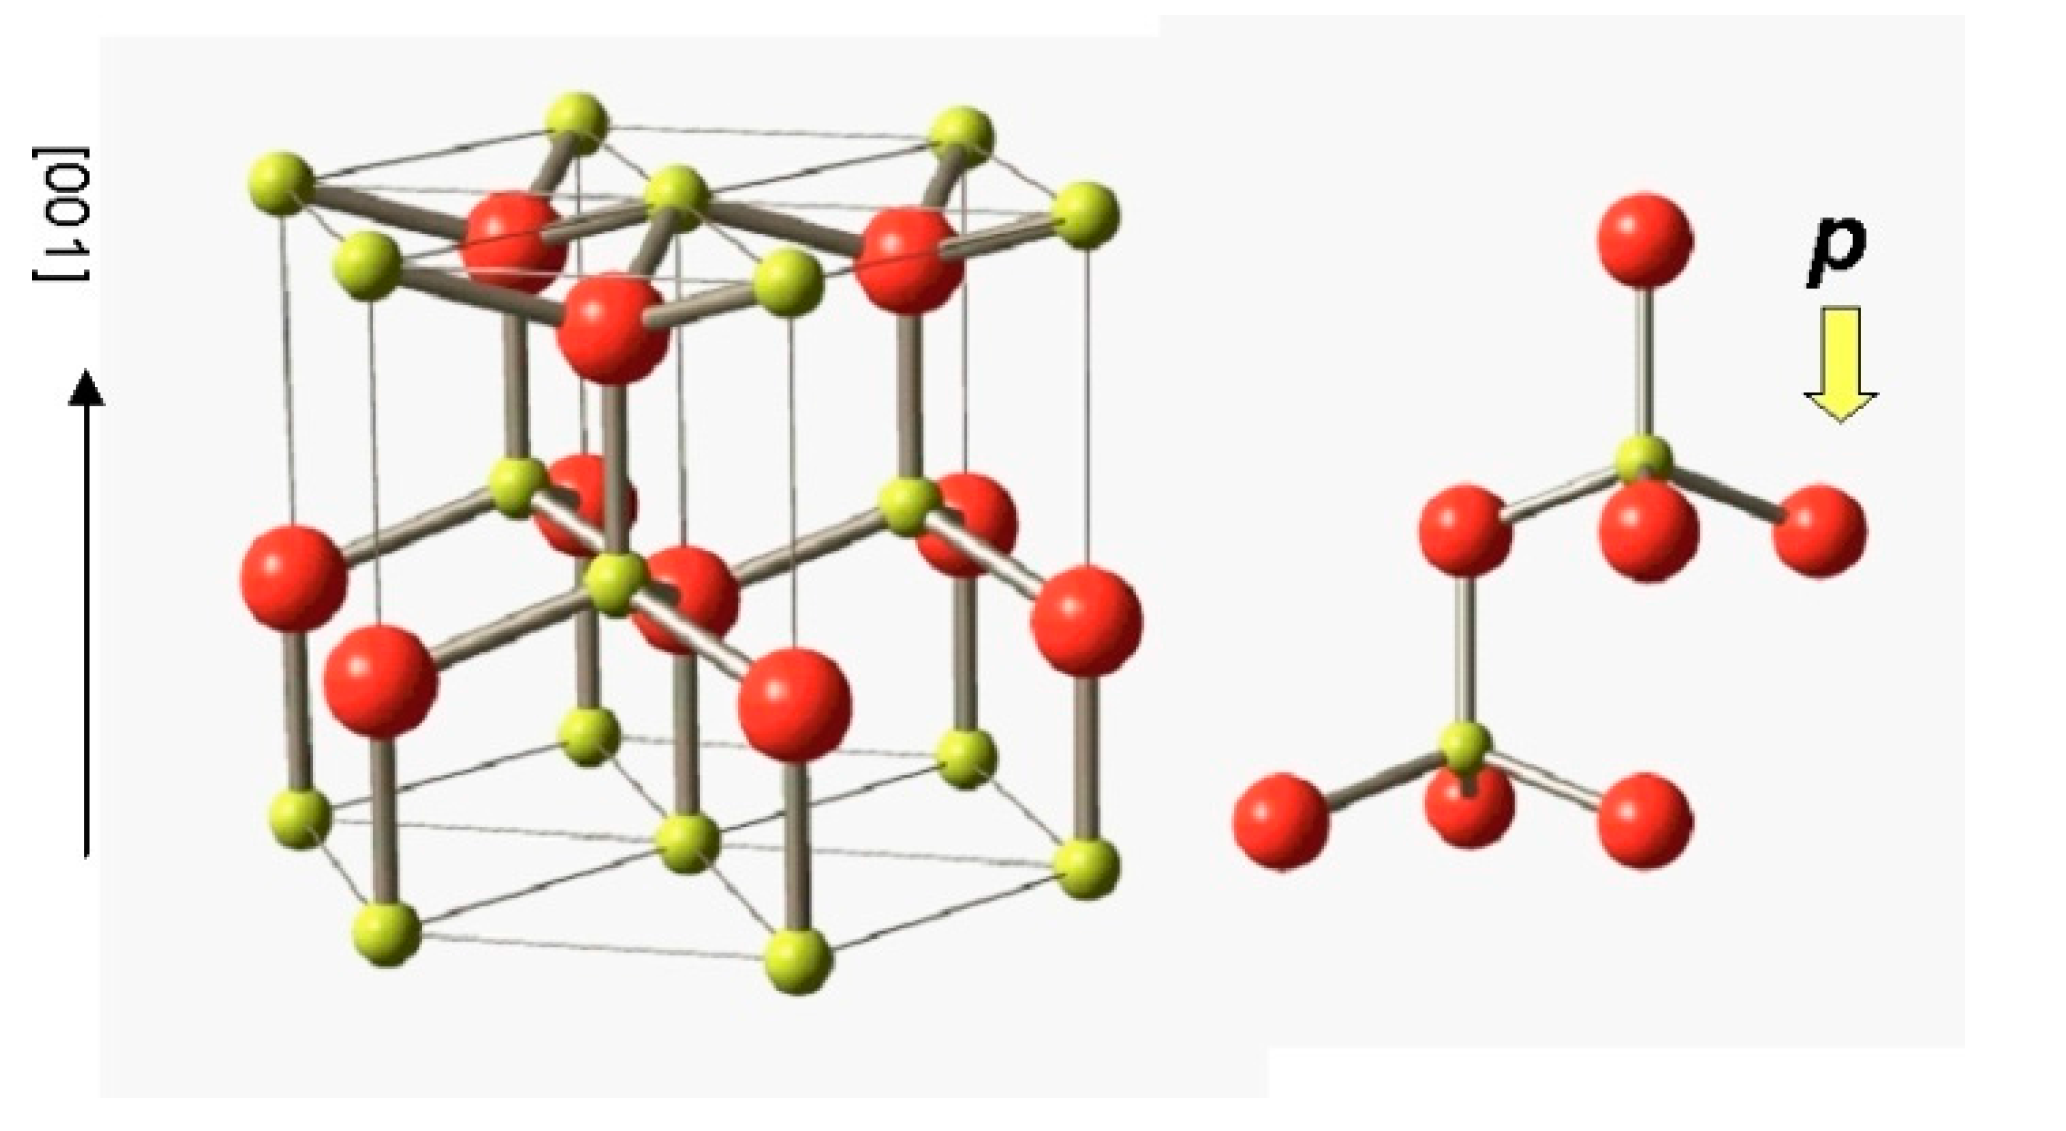
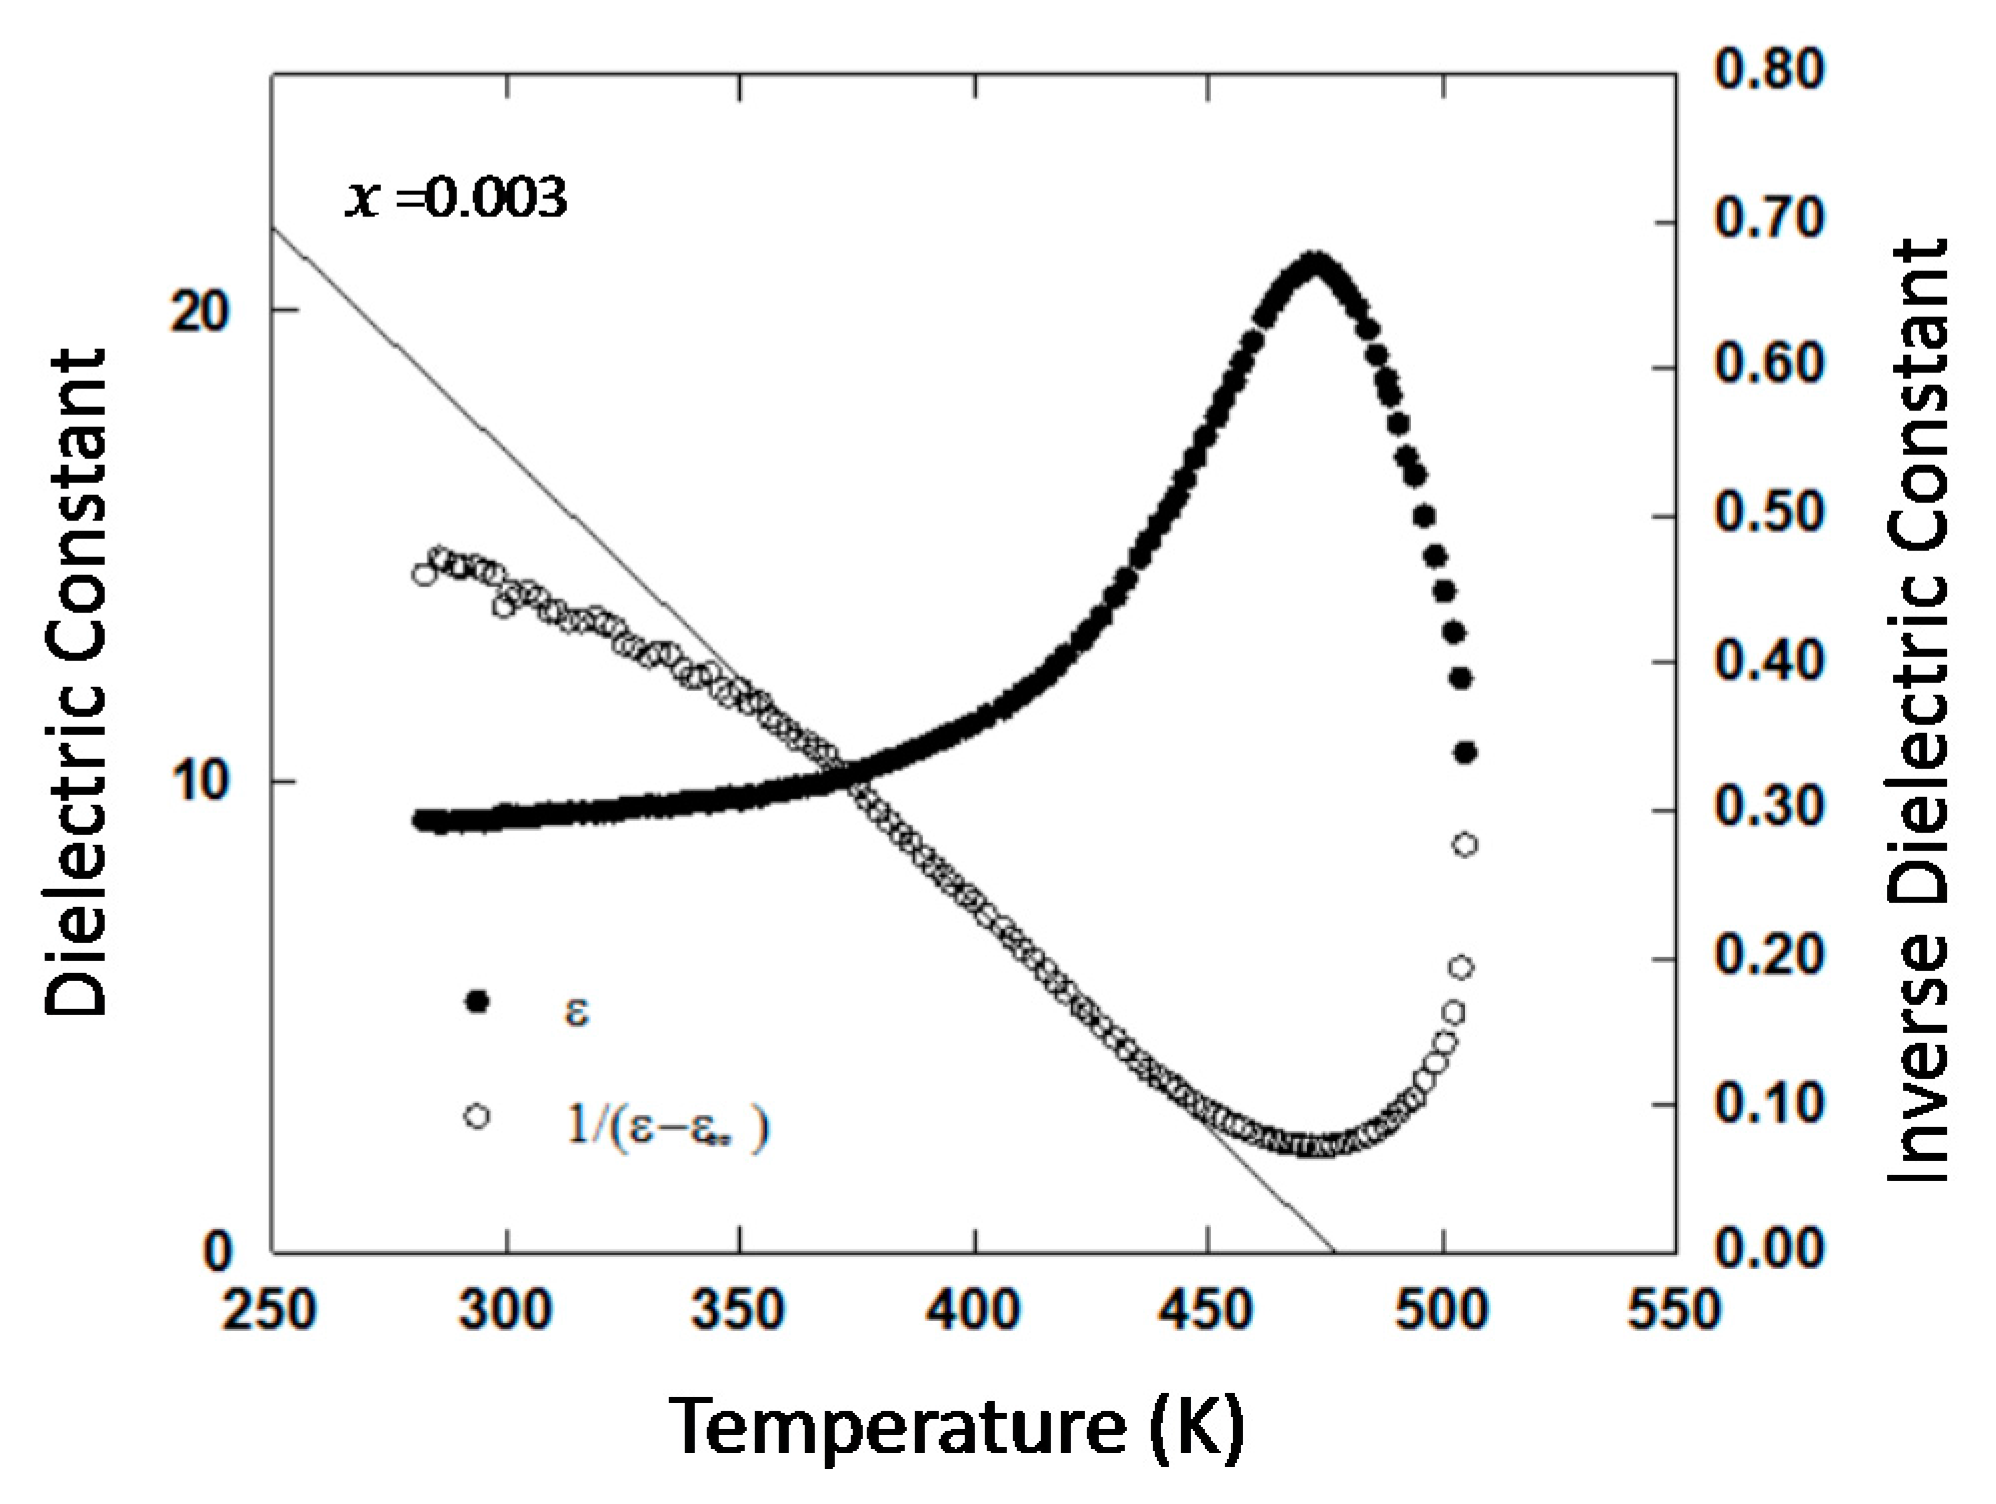
2.3. II-VI Wide-Gap Semiconductor ZnO

Zinc Oxide (ZnO), a II-VI wide-gap semiconductor, is a well-studied electronic material with a large piezoelectric constant [23,24,25,26,27]. ZnO has been studied as materials for solar cells, transparent conductors and blue lasers [28,29]. This crystal has a wurtzite structure (P63mc) (Figure 3). This space group is non-centrosymmetric and is allowed to exhibit ferroelectricity, although no D-E loop has been observed until melting point. Introduction of a small amount of Li-dopants results in the ferroelectricity.
A dielectric anomaly in Zn1−xLixO (x = 0.09) was found at 470 K (Tc) (Figure 4), though pure ZnO shows no anomaly from 20 K to 700 K. The small dielectric anomaly (εmax = 21) is the same order with Cd1−xZnxTe (εmax = 50).
The spontaneous polarization is 0.9 µC/cm2 [30,31]. The phase diagram between Tc and x is shown in Figure 5, which reminds us of a phase diagram of quantum ferroelectrics such as KTa1−xNbxO3 and Sr1−xCaxTiO3. Raman scattering measurements showed no soft modes [32,33].

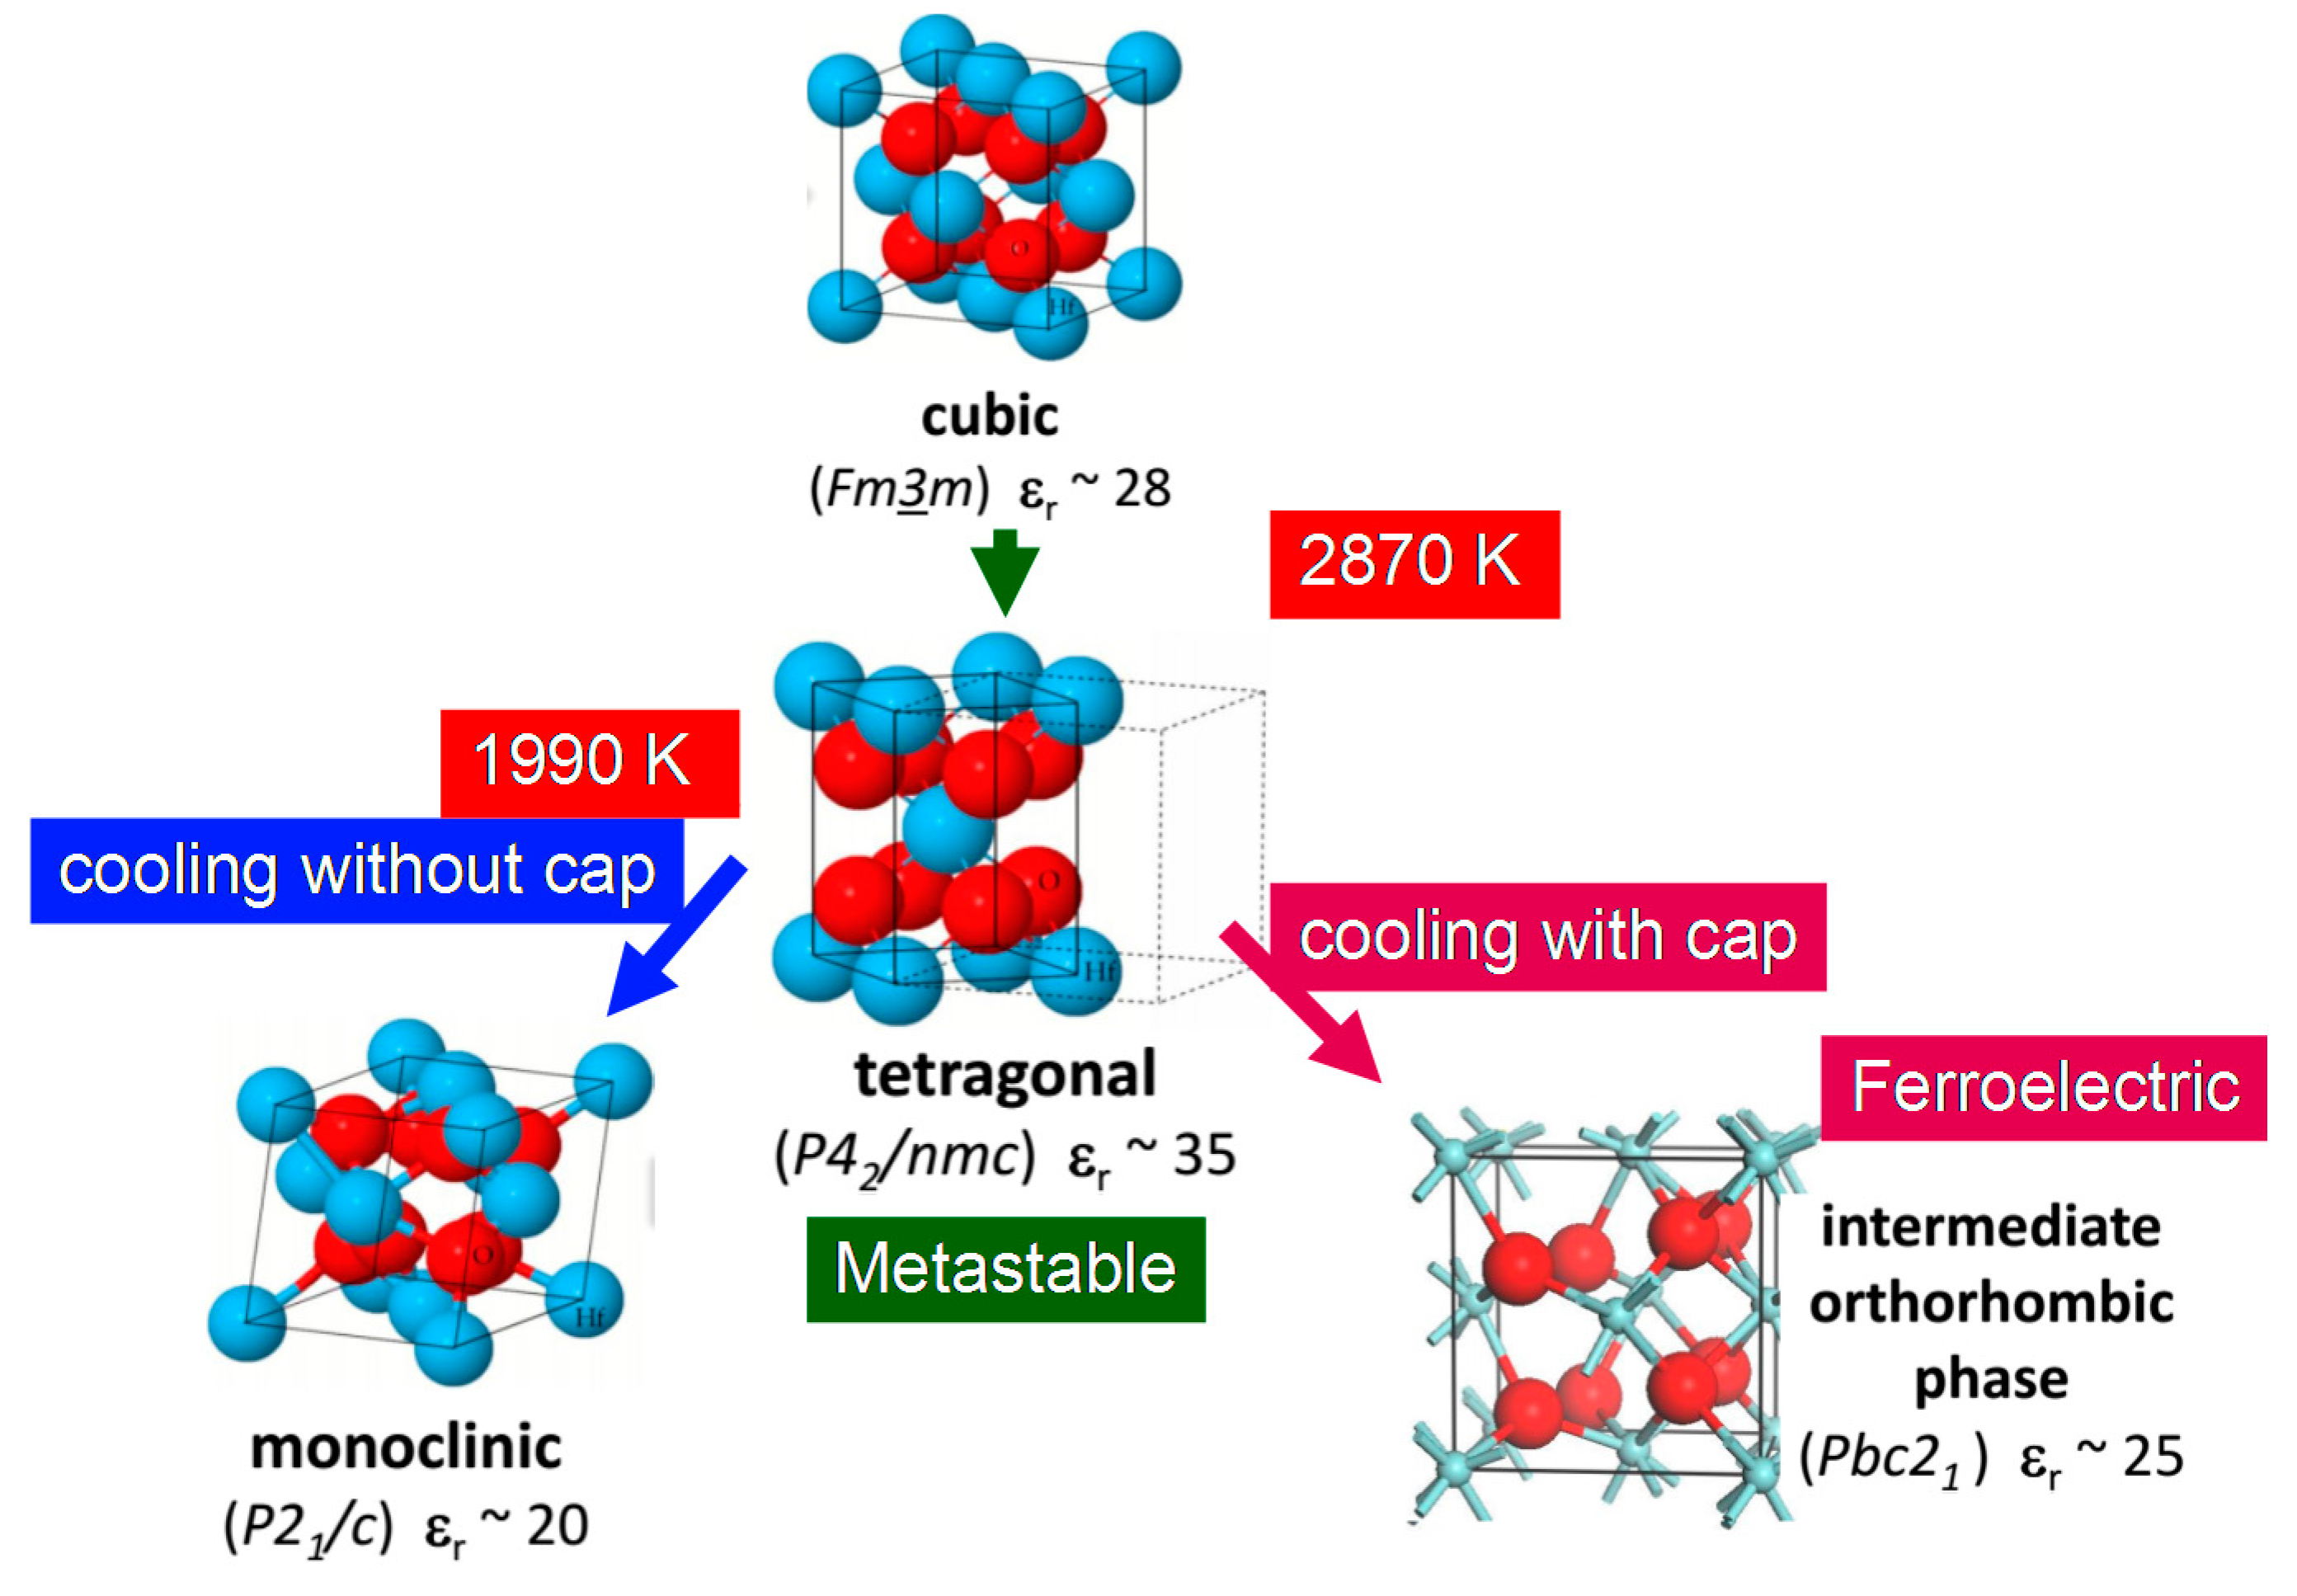
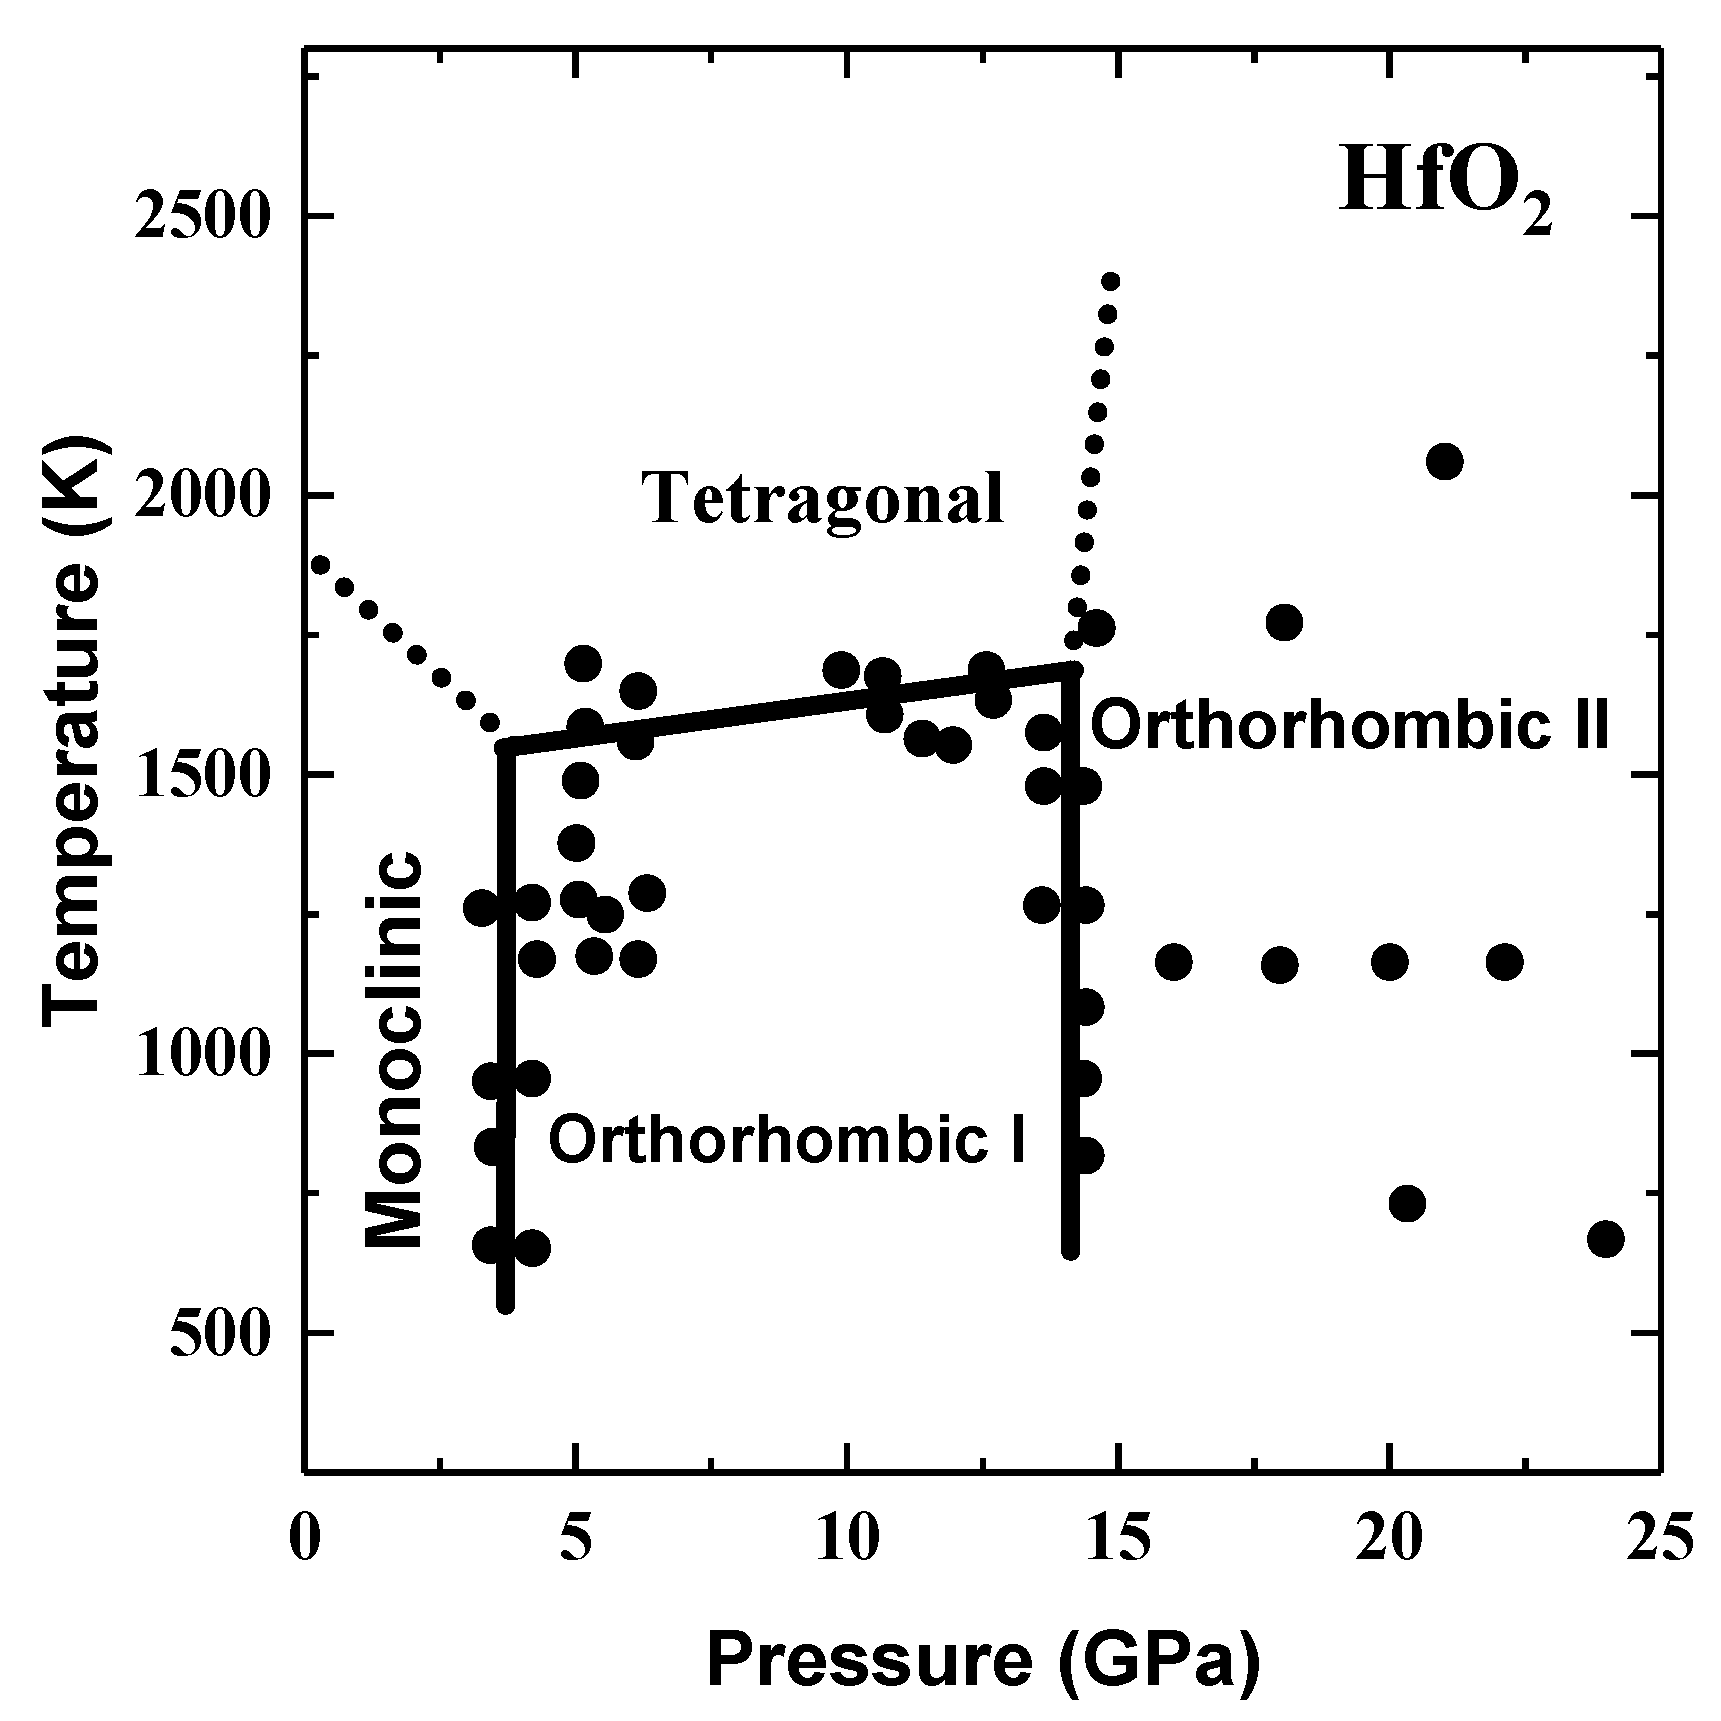
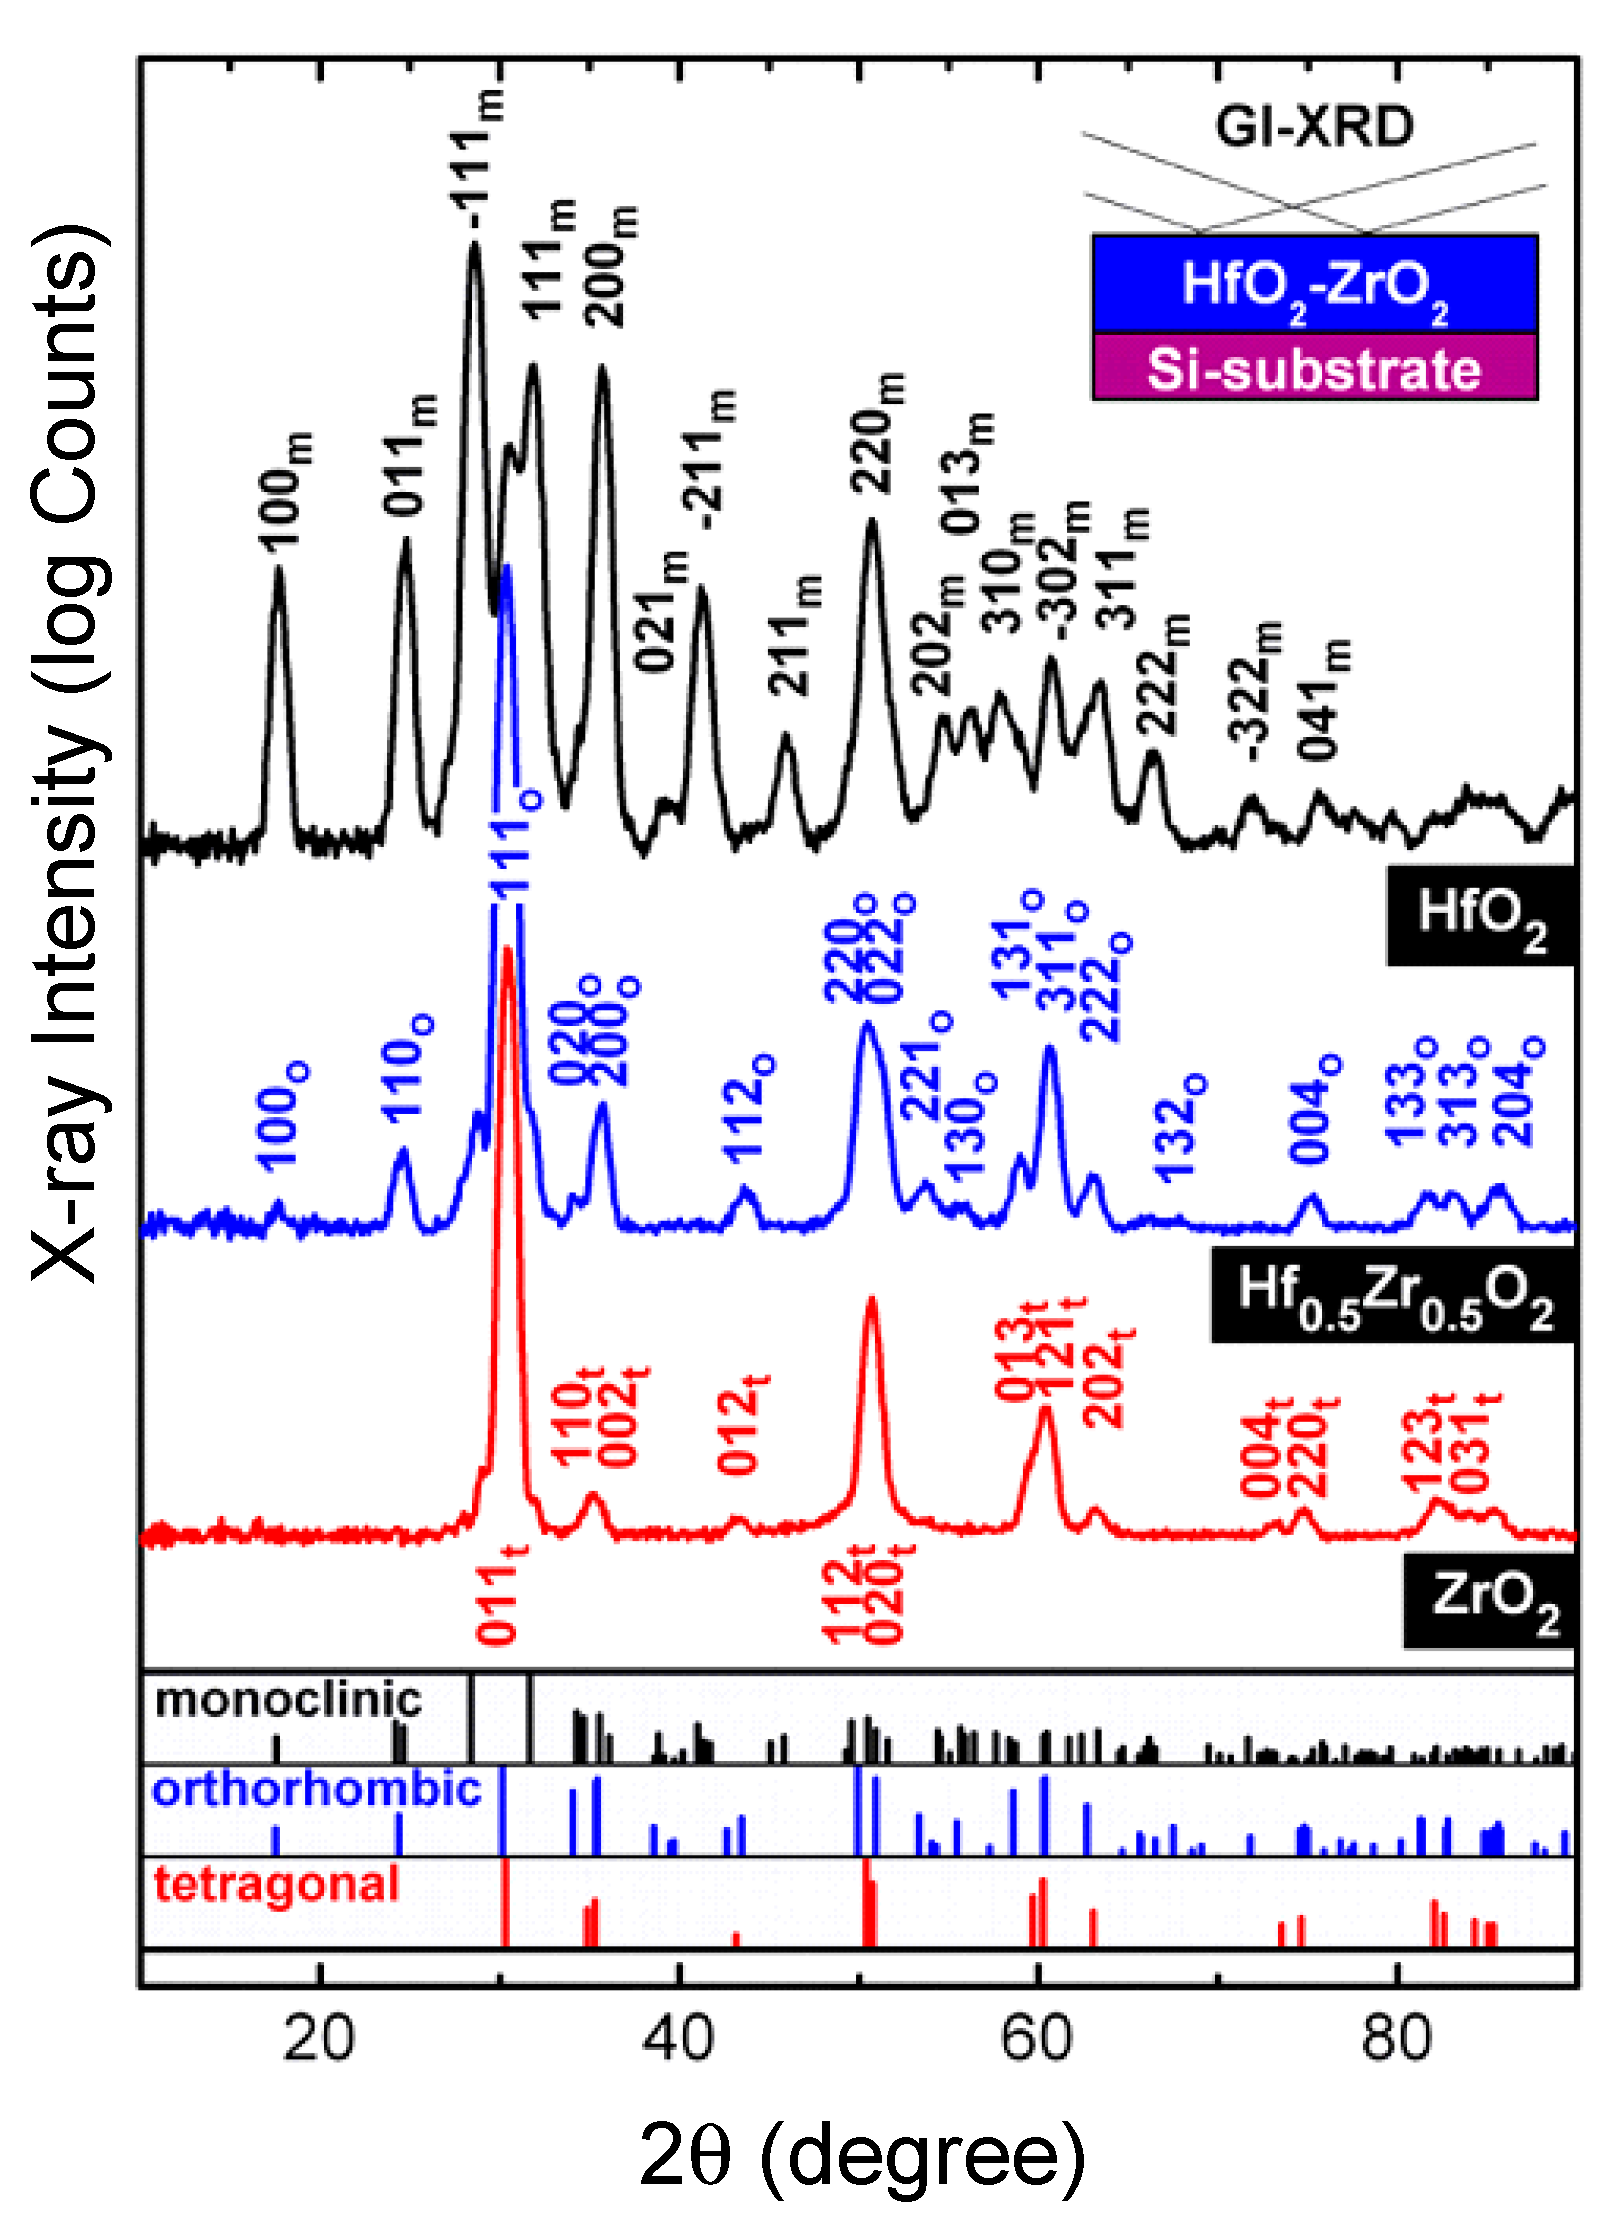
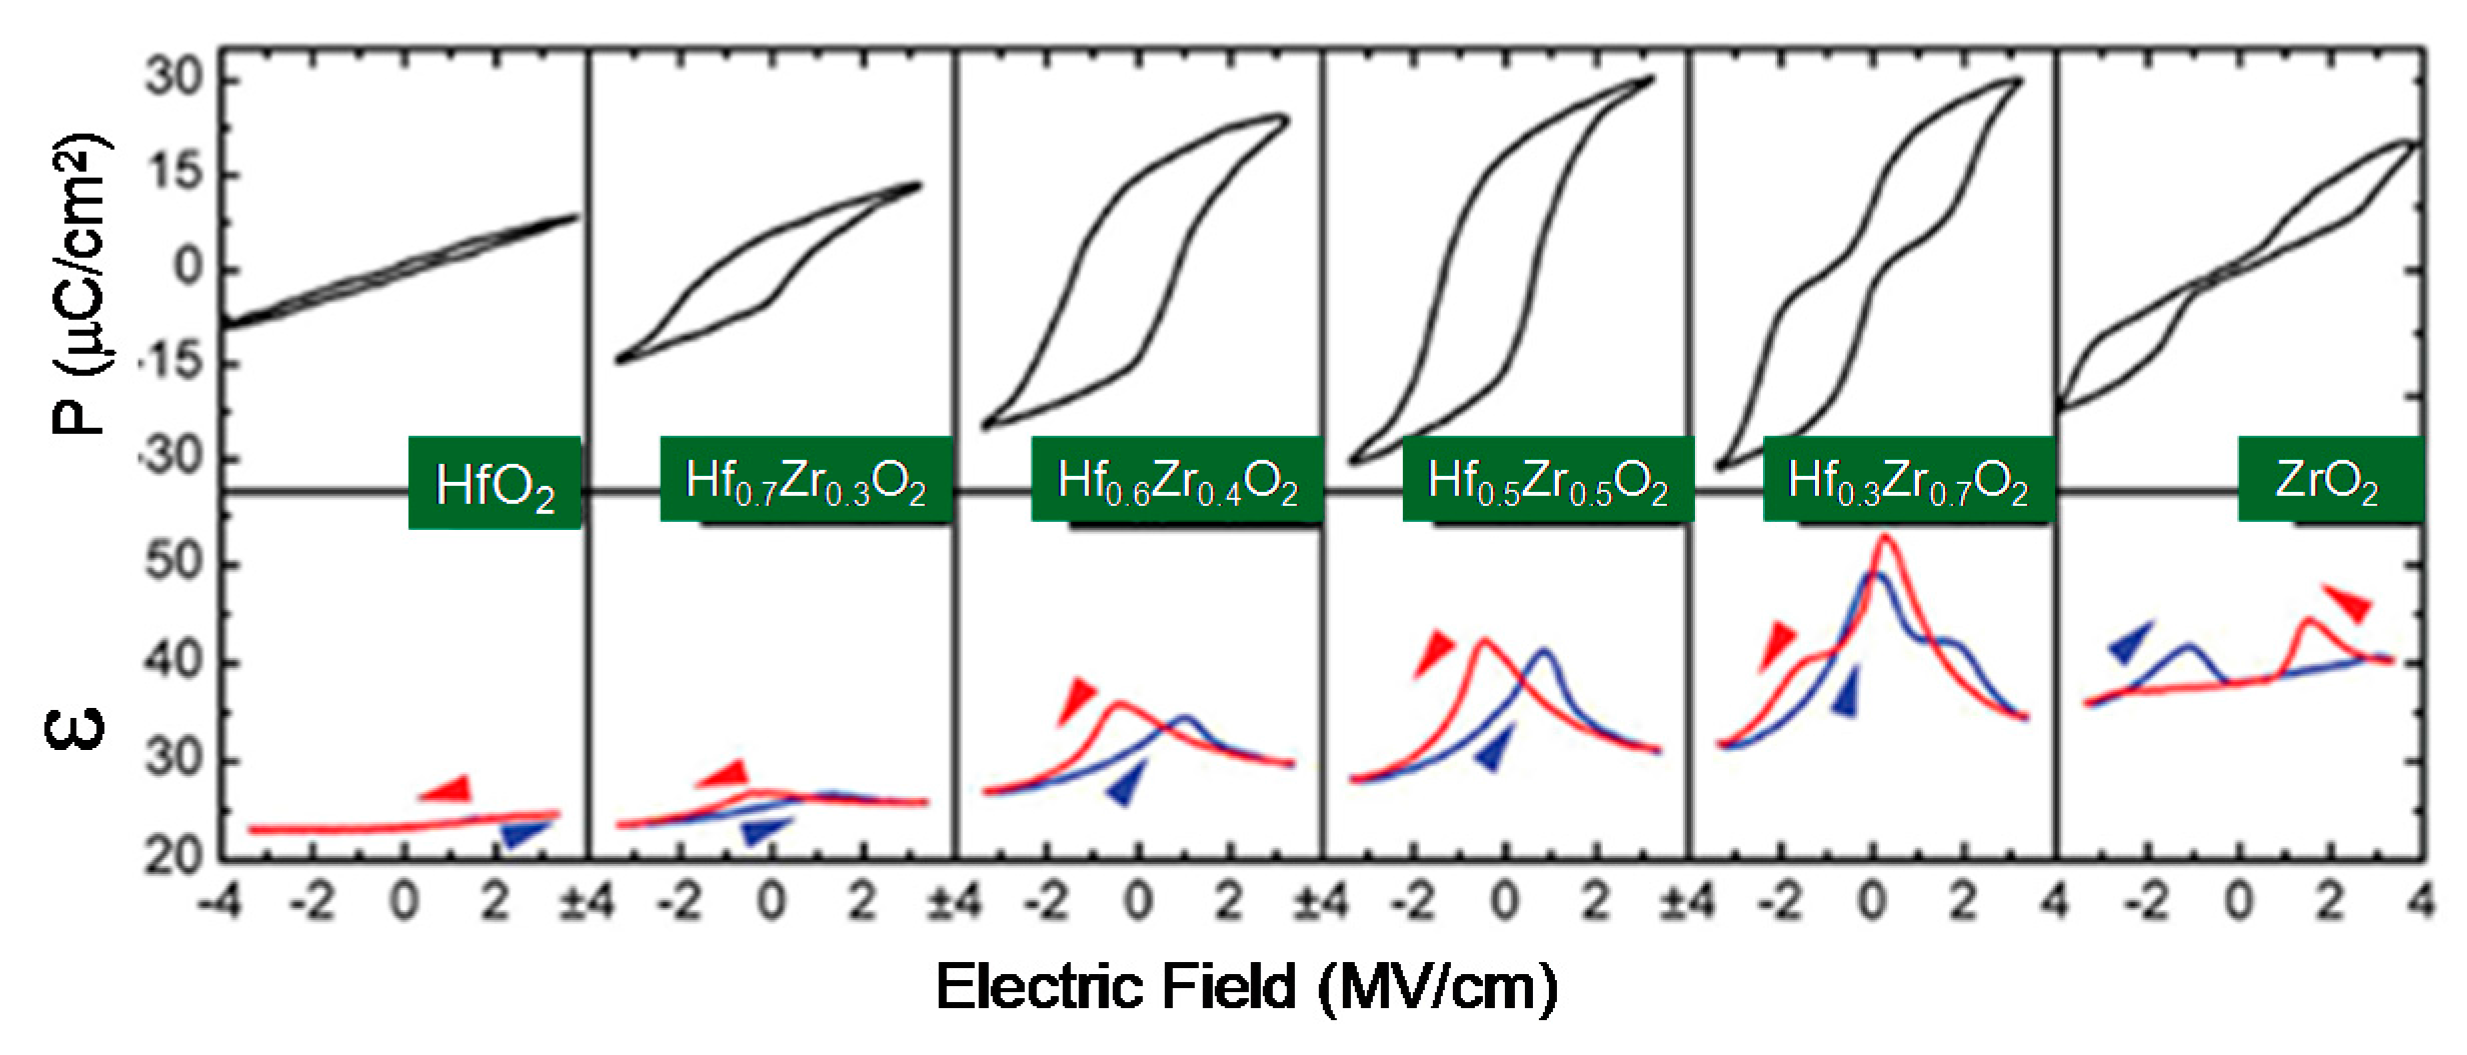
2.4. High-k Materials HfO2 and ZrO2

HfO2 and ZrO2 are well-known high-temperature dielectrics. The thin films of HfO2 and ZrO2 have been studied extensively as a high-k gate dielectric film in CMOS technology. The crystal structure is monoclinic with space group P21/c at room temperature and atmospheric pressure, which transforms to a tetragonal structure (P42/nmc) at ~1990 K, and then to a cubic Auorite structure (Fm3m) at ~2870 K. Other two orthorhombic phases have been reported under high pressure near 4 and 14 GPa [34]. Figure 6 shows a P-T phase diagram of HfO2.
The monoclinic P21/c structure is centrosymmetric, which does not show any ferroelectric activity. Thin films of HfO2 undergo a phase transition to a noncentrosymmetric orthorhombic structure, breaking the symmetry of inversion when the films are doped with Si, Y, Al, or Zr [18,19,35,36,37,38]. The X-ray diffraction patterns of HfO2, Hf0.5Zr0.5O2 and ZrO2 thin films are shown in Figure 7 [38]. Four space groups (Pmn21, Pca21, Pbca, and Pbcm) are proposed for this orthorhombic ferroelectric phase. Among these space groups, it is considered that Pca21 is the most probable. The sequence of phase transitions and crystal structures are shown in Figure 8. The ferroelectricity was confirmed by D-E hysteresis measurements, which revealed Ps of 16 μC/cm2 as shown in Figure 9. The Curie temperature (Tc) was estimated to be about 623 K [39,40].

3. Phenomenological Treatment for the Appearance of Ferroelectricity

Firstly following the Landau theory, we consider the free energy (F) for the paraelectric phase of binary crystals in terms of polarization P as
F = 1/2αP2 + 1/4βP4 + …,
where α, and β are coefficients. In general, the only coefficient α depends on temperature as
α = αo (TTo), αo > 0
In the case for paraelectric dielectrics, the critical temperature To is considered to be lower than 0 K, because of the absence of phase transitions above 0 K. When some dopants are introduced to crystals, some structural changes due to a difference in atomic radii and bonding electrons are modified by dopants. These may induce some local changes in electronic distribution in crystals. These extra contributions could be added to the above free energy as
F = 1/2αP2 + 1/4βP4 + gηP + 1/2α’η2…,
where the last term 1/2α’η2 is the contribution by dopants, and gηP is an interaction term between the host crystal and extrinsic dopants. From the stability condition ∂F/∂η = 0,
η = (g/α’)P,
The above free energy F can be rewritten as
F = 1/2(α − g2/α’)P2 + 1/4βP4
Using Equation (4), we get
(α − g2/α’) = α0 (TTc)
where
Tc = To + g20α’
As the critical temperature Tc increases when the coefficient α’ is positive, it should be possible to undergo a ferroelectric phase transition. Tc shows a rapid increase in the order of 102 K for large g and small α’ in the case of Pb1−xGexTe, Cd1−xZnxTe, and Zn1−xLixO. The appearance of ferroelectricity is realized in the doped binary crystals, while any phase transition does not occur in pure crystals.

4. Microscopic Consideration after Cochran’s Lattice Dynamical Theory

Although the above phenomenological theory can explain well the appearance of ferroelectricity, it is not so easy for us to understand what kind of phenomena occurs in real crystals. For binary crystals such as NaCl, Cochran proposed a lattice dynamical theory to elucidate the origin of ferroelectric phase transition based on the shell model [9,10]. We review simply Cochran’s soft mode theory for ferroelectrics at first.
Cochran calculated the frequencies of transverse and optic phonon modes in a diatomic cubic crystal using a shell model such as NaCl, as illustrated in Figure 10. The shell is originated from some local lattice deformation, electronic overlap forces, or covalency in chemical bonds. The core of the negative ion (charge Xe, mass m2) will interact through an outer shell (charge Ye, mass ~0) with a force constant k. The positive ion (charge Ze, mass m1) interacts with the shell by a short range force through a force constant Ro. The displacements are denoted as u1, v2 and u2 for the positive ion, shell and negative core, respectively.
The frequencies of the transverse and longitudinal optic modes, ωTO and ωLO are calculated as
μ ω T O 2 = R o '   4 π ( ε + 2 ) ( Z e ) 2 9 V
μ ω L O 2 = R o ' +   8 π ( ε + 2 ) ( Z e ) 2 9 V ε
where
R o ' =   k R o k + R o < R o
Z = Z + Y R o k + R o < Z
μ = m 1 m 2 m 1 + m 2
ε and V are a high-frequency dielectric constant and the unit cell volume. Following the Lyddane-Sachs-Teller (LST) relation, the dielectric constant ε is given as
ε ε = ω L O 2 ω T O 2
The ferroelectric phase is realized if ωTO = 0 in Equation (10), because ferroelectric phase transitions generally accompany with a divergence of dielectric constant. The ferroelectricity is induced from the delicate balance between the short-range term Ro’ and the second dipolar Coulomb term in the right side of Equation (10).
Cochran showed that a real alkali halide crystal is not a ferroelectric, because Ro’ is about twice as great as the other while these two contributions are the same order for real alkali halide crystals. This is one reason why the ferroelectricity has been found only in HCl and HBr. Dopants will change local electronic distribution of chemical bond, i.e., the nature of covalency, particularly in mixed bonded crystals. Dopants also force it to displace to off-centered positions and induce local structural distortions. Particularly, the chemical bonds may be affected sensitively by dopants in ZnO, CdTe and HfO2 where the degree of covalency (or iconicity) is nearly half, as shown in Table 3. The balance between the restoring force Ro’ and the dipolar Coulomb force can be modified by dopants, defects or strain.

5. Discussion

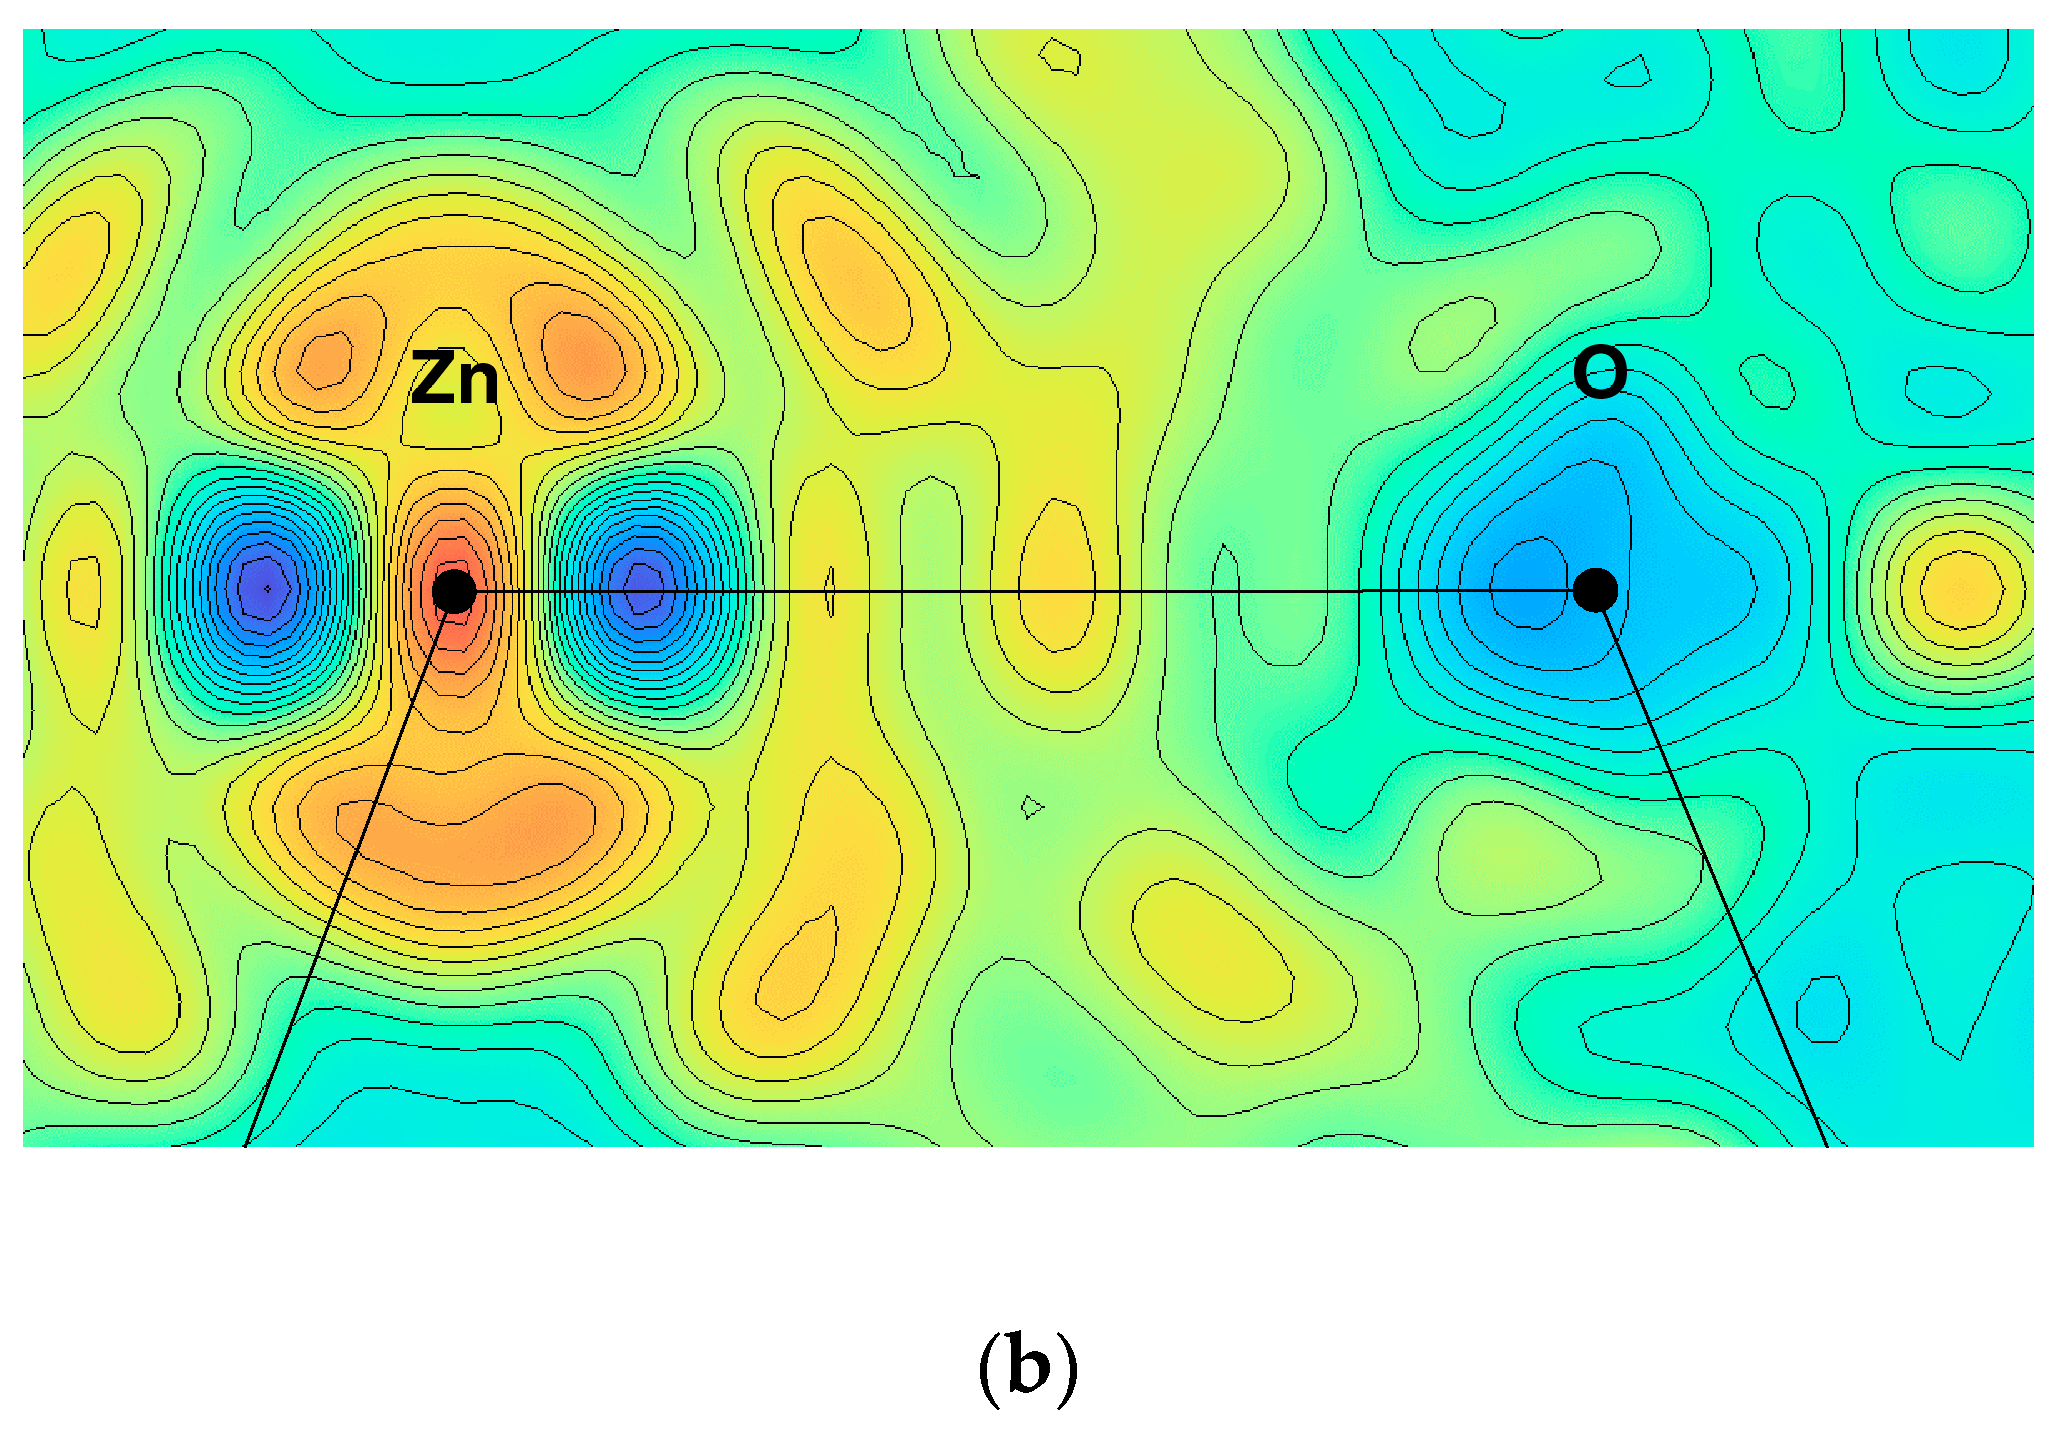
5.1. Electronic Ferroelectricity in ZnO; Effect of Dopants

The replacement of host Zn ions by substitutional Li ions plays a primary role for the appearance of ferroelectricity in ZnO. To clarify the effect of dopants, structural size-mismatch and electronic models are studied: the introduction of small Be2+ ions (ionic radius 0.3 Å) should be effective than Li+ (ionic radius 0.6 Å) and Mg2+ (ionic radius 0.65 Å) ions if the ionic size-mismatch is important for ferroelectricity, while Mg2+ ions (1s22s22p6) should play a different role from the isoelectronic Li+ and Be2+ ions (1 s2) if the electronic configuration is important.
The series of dielectric measurements show that the introduction of Mg2+ ions suppresses Tc [42]. The appearance of ferroelectricity is primarily due to electronic origin.

5.2. Structural Modification by Dopants

The electronic distribution, especially the nature of d-p hybridization of paraelectric pure ZnO and ferroelectric Zn1−xLixO at 19 K, was measured directly by X-ray diffraction. The main difference is observed in electronic distribution around Zn ion, as shown in Figure 11.
The negative distribution is observed around the Zn atom in Zn1−xLixO, whose shape corresponds to Zn-3dz2-orbital. This evidence shows that the Zn 3d-electrons disappear around Zn position in the doped ZnO.
Most crystals have a fraction of covalent and ionic bonding components. ZnO is bonded half by ionic and half by covalent forces, of which delicate balance is slightly changed by Li-dopants without d-electrons. Pure ZnO has large dipole moment [11], while this host dipole could not be reversible by an electric field. In Zn1−xLixO, the dipole is reduced a little bit by the local electronic deformation along the polar (0 0 1) direction; this is, in other words, an introduction of negative dipoles in the host lattice. These negative dipoles are responsible for an electric field and behave as “hole dipoles” which are similar to “hole electrons” in n-type semiconductors. We should call this type of ferroelectrics as “n-type ferroelectrics”, while usual ferroelectrics are “p-type ferroelectrics”.
In the case of Hf1−xZrxO2, the ionic radii (0.83 Å for Hf4+ and 0.84 Å for Zr4+) are almost the same. The main difference is an electronic structure, Hf (−4f14) and Zr (−4p6). As the high dielectric constants in these crystals (ε = 25 for HfO2, ε = 30~46 for ZrO2) mean the large splitting of ωTO and ωLO phonon modes, a ωTO phonon mode is much lower compared with a ωLO (LST relation, Equation (10)). In this sense, HfO2 and ZrO2 are incipient ferroelectrics as SrTiO3. The electronic distribution in the Hf-O bond is perturbed by Zr dopants without f-electrons. This modification may stabilize an orthorhombic polar structure and results in the appearance of ferroelectricity in Hf1−xZrxO2.
The above microscopic consideration gives us one perspective to understand the origin of ferroelectricity in doped binary crystals. If the condition that ωTO approaches to zero at Tc holds exactly, soft mode should be detectable. However, no soft mode has been observed in Cd1−xZnxTe, Zn1−xLixO and Hf1−xZrxO2, except for Pb1−xGexTe. This evidence suggests that the mechanism of the ferroelectric phase transition is not so simple in real crystals which are partially covalent and partially ionic. The small dielectric anomaly in Cd1−xZnxTe, Zn1−xLixO and Hf1−xZrxO2 reminds us of an improper type ferroelectrics, rather than the order-disorder-type and displacive-type of ferroelectrics. This problem has been left for our future studies.

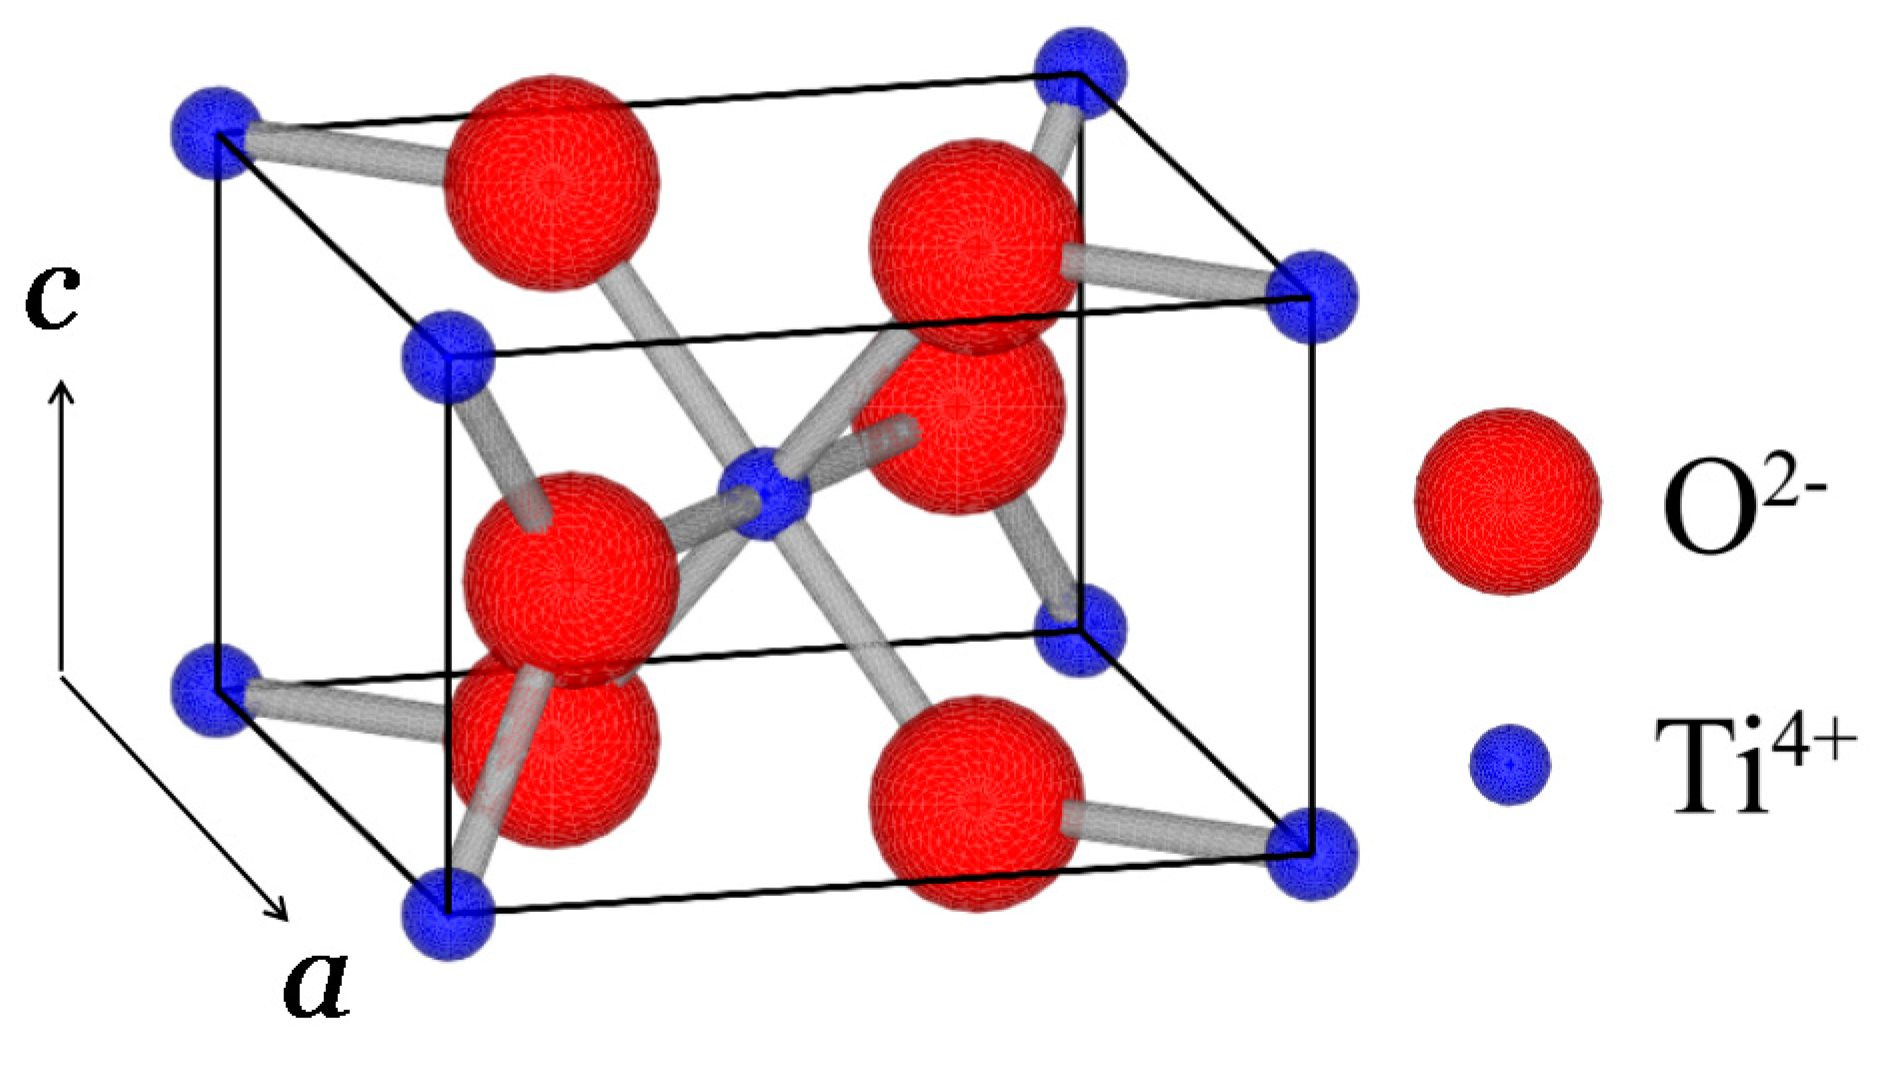
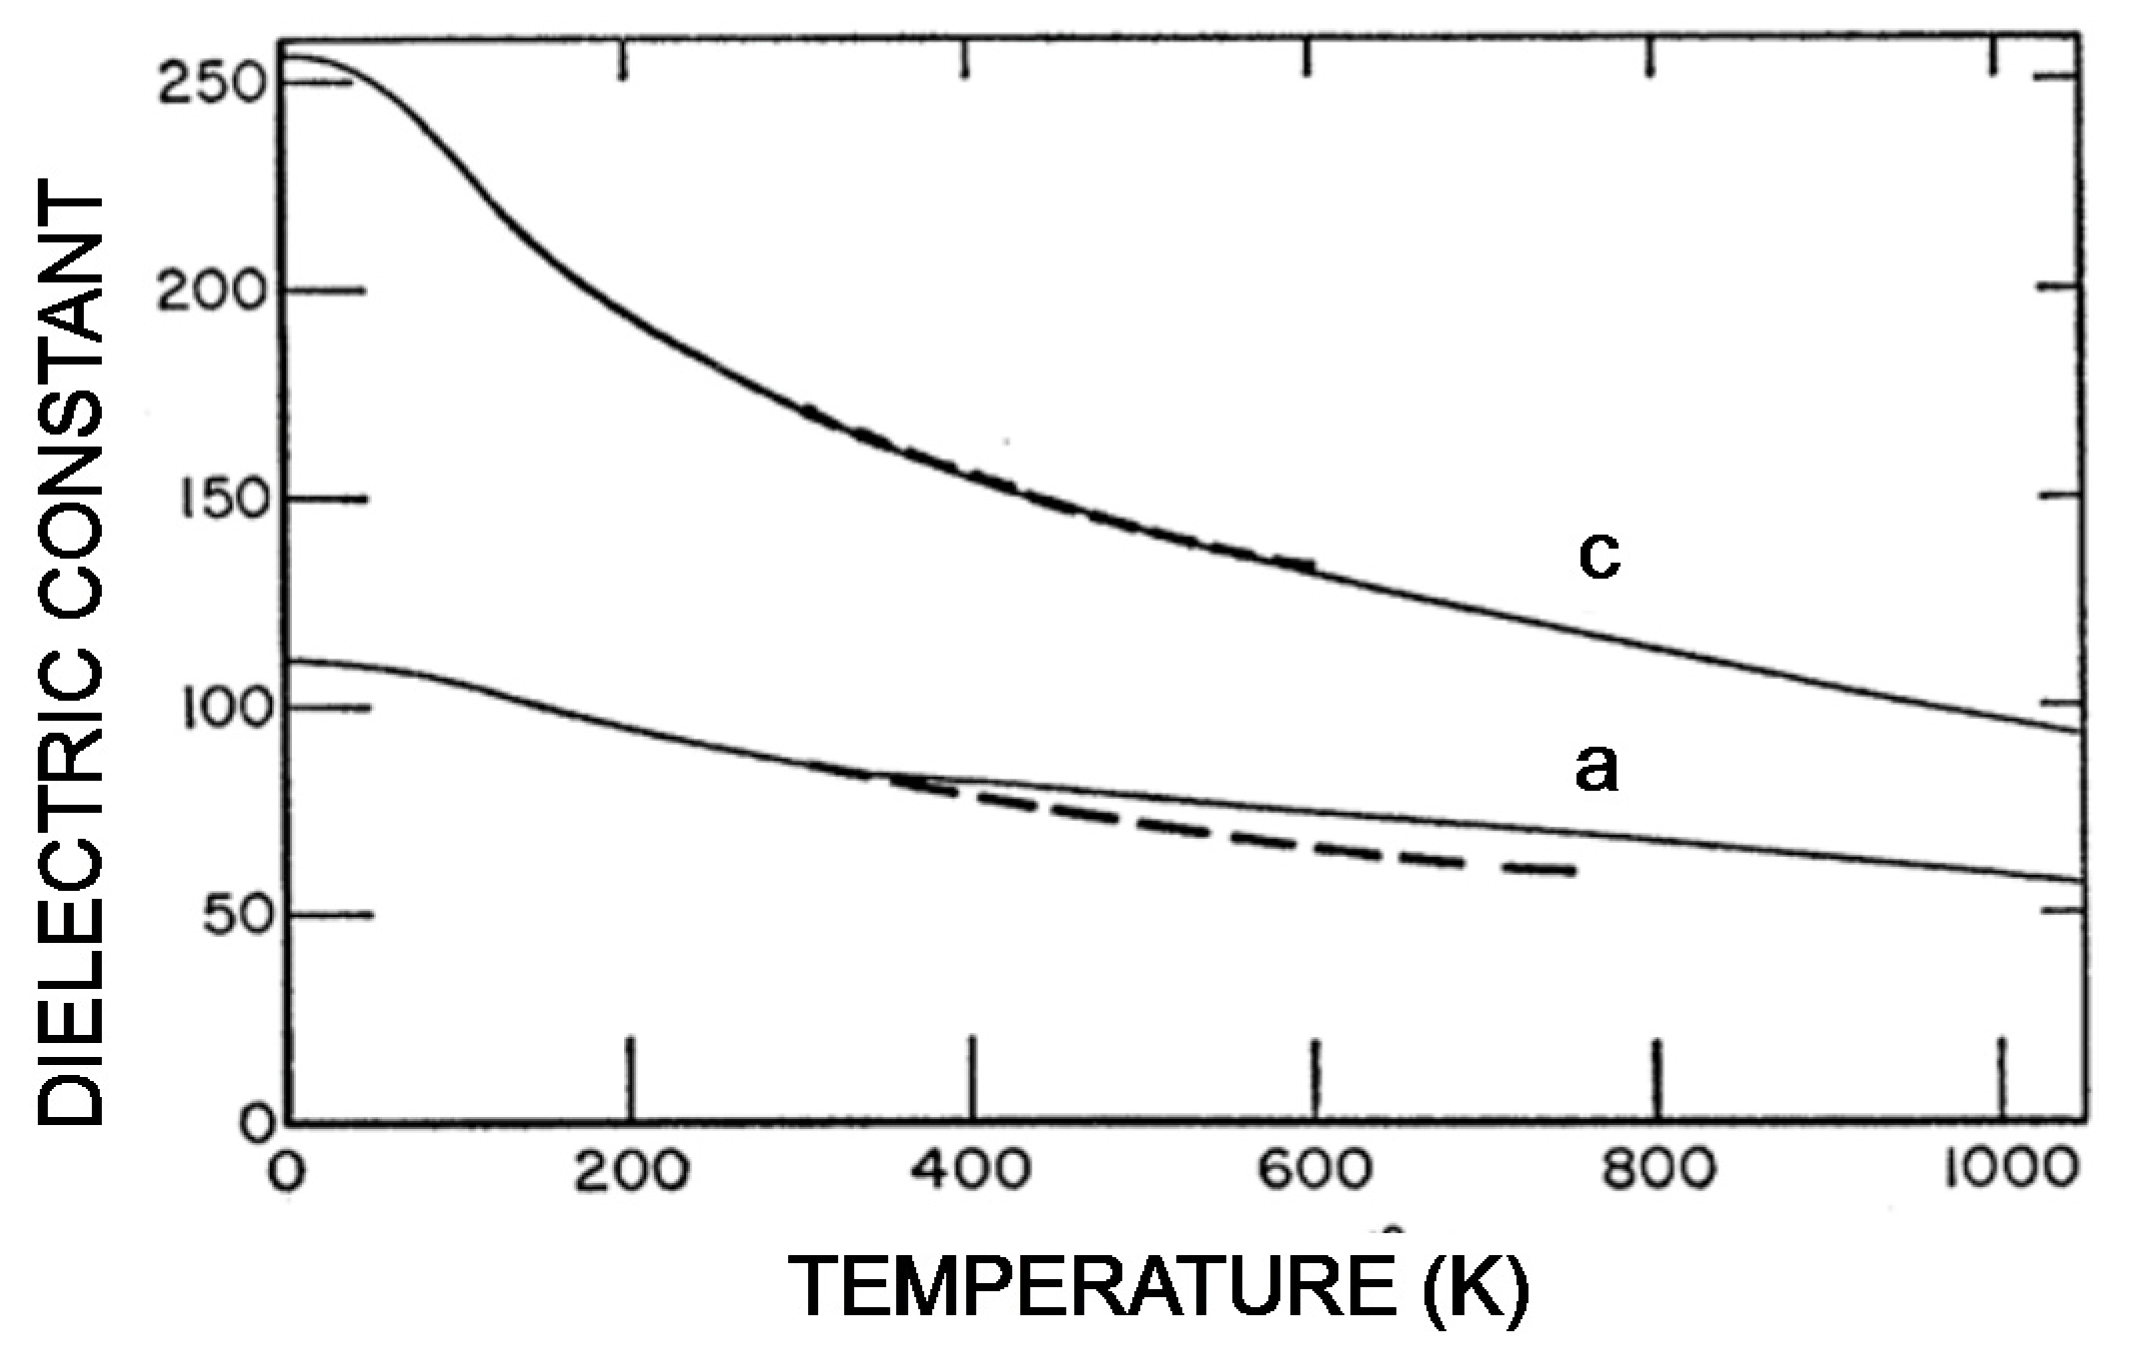
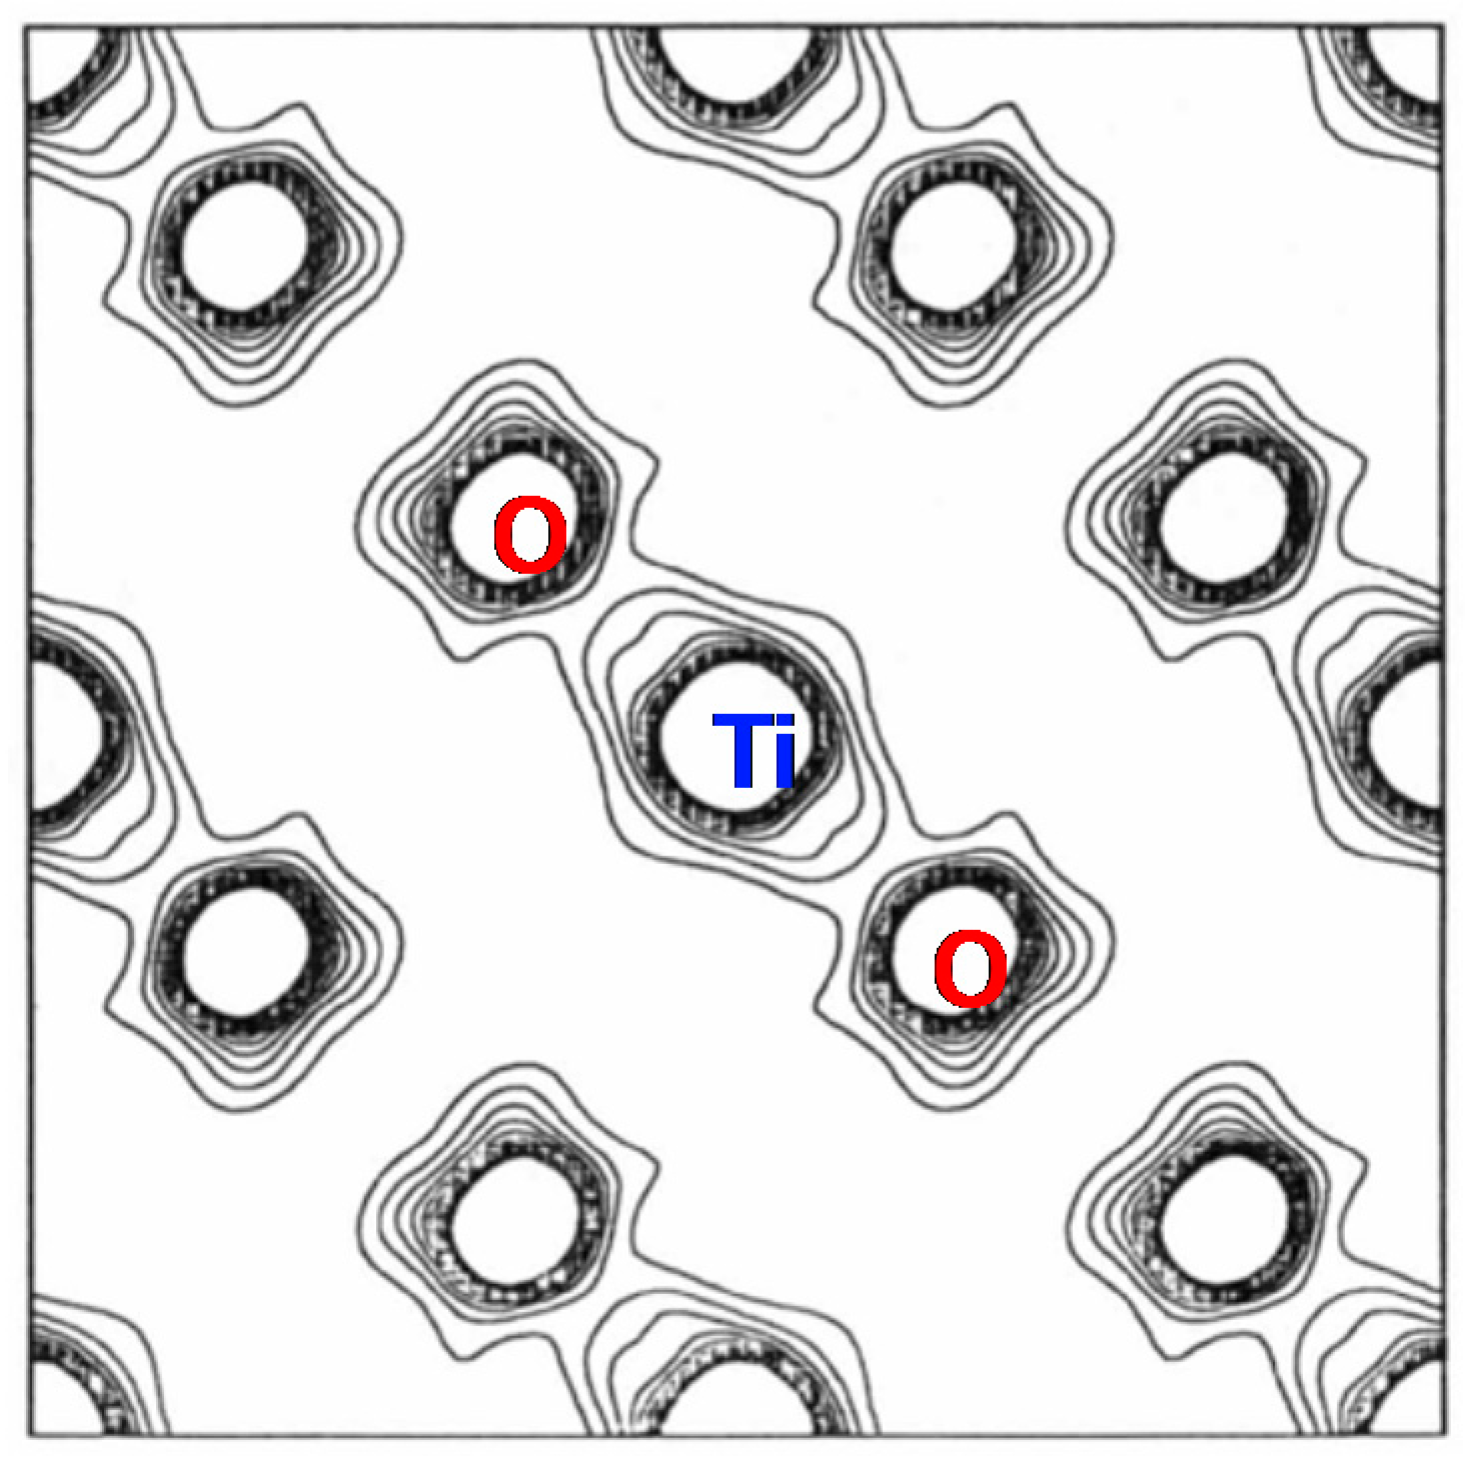
6. Another Possible Ferroelectric TiO2

Rutile TiO2 is studied well by various techniques [43]. The structure is tetragonal with space group P42/mnm (a = 4.593659 (18) and c = 2.958682 (8) Å at 298 K, Z = 2) (Figure 12) [44]. Besides rutile, TiO2 admits another two polymorphic forms in nature, i.e., anatase (I41/amd, a = 3.7845, c = 9.5143 Å, Z = 4) and brookite (Pbca, a = 5.4558, b = 9.1819, c = 5.1429 Å, Z = 8). Rutile TiO2 is the most common of the three polymorphic forms. Under high pressure, TiO2 undergoes a series of structural phase transitions.
Rutile TiO2 has large refractive indices (nc = 2.903, na = 2.616) and large static dielectric constants (εc = 170, εa = 86) at room temperature.
Parker measured the dielectric constant ε of TiO2 which increases with decreasing temperature, but does not show any anomaly from 1.6 to 1060 K, as shown in Figure 13 [45,46]. Pure TiO2 does not show any ferroelectric or antiferroelectric activity. The dielectric constant shows a plateau at low temperatures around 0 K, which reminds us of dielectric behavior in quantum paraelectrics, such as SrTiO3.
Although there had been a long-running discussion concerning the covalency of the bonding in rutile, Gronschorek [47] and Sakata et al. [48] concluded that Ti-O bonding in rutile is largely covalent, as shown in Figure 14. If we can modify the nature of bonding by some dopants or stress, it may be possible to expect the appearance of ferroelectricity.
Recently, Montanari and Harrison proposed by density functional calculations that ferroelectric instability can be possible in rutile TiO2 by applying a negative isotropic pressure [49]. The TO A2u mode, which is the c-axis ferroelectric mode, vanishes at −4 GPa, thereby leading to a crystal instability.
Similar calculations on binary oxides such BaO, CaO, MgO, EuO, SnO2 have been reported recently [50,51], although these crystals are primarily ionic (the degree of ionicity is ~0.8). They showed that ferroelectricity can be induced even in simple alkaline-earth-metal binary oxides by using appropriate epitaxial strains in thin films or in nano-particles.

7. Conclusions

We discussed the origin of ferroelectricity in doped binary crystals, Pb1−xGexTe, Cd1−xZnxTe, Zn1−xLixO, and Hf1−xZrxO2 on the basis of phenomenological and lattice dynamical treatments, while no ferroelectrics have been reported in pure binary crystals except for HCl and HBr. The delicate balance of the short-range restoring force and the long-range dipolar Coulomb force is tuned by dopants, particularly in binary crystals which are half covalent and half ionic. The modification of the electronic distribution in the chemical bond results in the local structural distortion, which may stabilize a non-centrosymmetric polar structure from a paraelectric structure with high-symmetry.
The discovery of ferroelectricity in doped binary crystals shows us a richness of structural science. Moreover, the ferroelectric HfO2 is expected to be a promising candidate for FeRAM and high-speed FET. Ferroelectrics are a group of materials sensitive to small structural changes. We must take into account the electronic contribution in the case of simple binary crystals discussed here. Further precise structural and theoretical studies should be necessary to clarify the possibility of ferroelectricity in other doped binary crystals.

Acknowledgments

This work was partially supported by Grant-in-Aid for Scientific Research (C) from JSPS No. 26400306 and a research granted from The Murata Science Foundation.

Conflicts of Interest

The authors declare no conflict of interest.

References

  1. Auciello, O.; Scott, J.F.; Ramesh, R. Ultrahigh-Intensity Lasers: Physics of the Extreme on a Tabletop. Phys. Today 1998, 51, 22. [Google Scholar] [CrossRef]
  2. Scott, J.F. The physics of ferroelectric ceramic thin films for memory applications. Ferroelectr. Rev. 1998, 1, 1. [Google Scholar] [CrossRef]
  3. Haertling, G.H. Ferroelectric Ceramics: History and Technology. J. Am. Ceram. Soc. 1999, 82, 797–818. [Google Scholar] [CrossRef]
  4. Scott, J.F.; Paz de Araujo, C.A. Ferroelectric memories. Science 1989, 246, 1400–1405. [Google Scholar] [CrossRef] [PubMed]
  5. Uchino, K. Ceramic actuators: Principles and applications. MRS Bull. 1993, 18, 42–48. [Google Scholar] [CrossRef]
  6. Wemple, S.H.; DiDomenico, M., Jr. Oxygen-Octahedra Ferroelectrics. II. Electro-optical and Nonlinear-Optical Device Applications. J. Appl. Phys. 1969, 40, 735. [Google Scholar] [CrossRef]
  7. Hoshino, S.; Shimaoka, S.; Niimura, K. Ferroelectricity in Solid Hydrogen Halides. Phys. Rev. Lett. 1967, 19, 1286. [Google Scholar] [CrossRef]
  8. Cochran, W. Crystal Stability and the Theory of Ferroelectricity. Phys. Rev. Lett. 1959, 3, 412. [Google Scholar] [CrossRef]
  9. Cochran, W. Crystal stability and the theory of ferroelectricity. Adv. Phys. 1960, 9, 387. [Google Scholar] [CrossRef]
  10. Cochran, W. Crystal stability and the theory of ferroelectricity part II. Piezoelectric crystals. Adv. Phys. 1961, 10, 401. [Google Scholar] [CrossRef]
  11. Corso, D.A.; Posternak, M.; Resta, R.; Baldereshi, A. Ab initio study of piezoelectricity and spontaneous polarization in ZnO. Phys. Rev. 1994, B50, 10715. [Google Scholar] [CrossRef]
  12. Tamaki, N.; Onodera, A.; Sawada, T.; Yamashita, H. Measurements of D-E Hysteresis Loop and Ferroelectric Activity in Piezoelectric Li-doped ZnO. J. Korean Phys. 1996, 29, 668. [Google Scholar]
  13. Onodera, A.; Tamaki, N.; Kawamura, Y.; Sawada, T.; Yamashita, H. Dielectric Activity and Ferroelectricity in Piezoelectric Semiconductor Li-Doped ZnO. Jpn. J. Appl. Phys. 1996, 35, 5160. [Google Scholar] [CrossRef]
  14. Onodera, A.; Tamaki, N.; Jin, K.; Yamashita, H. Ferroelectric Properties in Piezoelectric Semiconductor Zn 1-xMxO (M=Li, Mg). Jpn. J. Appl. Phys. 1997, 36, 6008. [Google Scholar] [CrossRef]
  15. Onodera, A.; Takesada, M. Electronic Ferroelectricity in II-VI Semiconductor ZnO. In Advances in Ferroelectrics; INTECH: Rijeka, Croatia, 2012. [Google Scholar]
  16. Bilz, H.; Bussmann-Holder, A.; Jantsch, W.; Vogel, P. Dynamical Properties of IV-VI Compounds; Springer: Berlin, Germany, 1983. [Google Scholar]
  17. Weil, R.; Nkum, R.; Muranevich, E.; Benguigui, L. Ferroelectricity in zinc cadmium telluride. Phys. Rev. Lett. 1989, 62, 2744. [Google Scholar] [CrossRef] [PubMed]
  18. Böscke, T.S.; Müller, J.; Brauhaus, D.; Schröder, U.; Böttger, U. Ferroelectricity in hafnium oxide thin films. Appl. Phys. Lett. 2011, 99, 102903. [Google Scholar] [CrossRef]
  19. Böscke, T.S.; Teichert, S.; Brauhaus, D.; Müller, J.; Schröder, U.; Böttger, U.; Mikolajick, T. Phase transitions in ferroelectric silicon doped hafnium oxide. Appl. Phys. Lett. 2011, 99, 112904. [Google Scholar] [CrossRef]
  20. Mitsui, T.; Tatsuzaki, I.; Nakamura, E. An Introduction to the Physics of Ferroelectrics; Gordon and Breach: New York, NY, USA, 1976; p. 202. [Google Scholar]
  21. Benguigui, L.; Weil, R.; Muranevich, E.; Chack, A.; Fredj, E. Ferroelectric properties of Cd1−xZnxTe solid solutions. J. Appl. Phys. 1993, 74, 513. [Google Scholar] [CrossRef]
  22. Terauchi, H.; Yoneda, Y.; Kasatani, H.; Sakaue, K.; Koshiba, T.; Murakami, S.; Kuroiwa, Y.; Noda, Y.; Sugai, S.; Nakashima, S.; et al. Ferroelectric behaviors in semiconductive Cd1−xZnxTe crystals. Jpn. J. Appl. Phys. 1993, 32, 728. [Google Scholar] [CrossRef]
  23. Klingshirn, C.F.; Meyer, B.K.; Waag, A.; Hoffmann, A.; Geurts, J. Zinc Oxide From Fundamental Properties Towards Novel Applications; Springer: Berlin, Germany, 2010. [Google Scholar]
  24. Yao, T. (Ed.) ZnO Its Most Up-to-Date Technology and Application, Perspectives; CMC Books: Tokyo, Japan, 2007. (In Japanese) [Google Scholar]
  25. Heiland, G.; Mollwo, E.; Stockmann, F. Electronic Processes in Zinc Oxide. Solid State Phys. 1959, 8, 191–323. [Google Scholar] [CrossRef]
  26. Campbell, C. Surface Acoustic Wave Devices and Their Signal Processing Application; Academic Press: San Diego, CA, USA, 1989. [Google Scholar]
  27. Hirshwald, W.; Bonasewicz, P.; Ernst, L.; Grade, M.; Hofmann, D.; Krebs, S.; Littbarski, R.; Neumann, G.; Grunze, M.; Kolb, D.; et al. Current Topics in Materials Science; Kaldis, E., Ed.; North-Holland: Amsterdam, The Netherlands, 1981; Volume 7, p. 148. [Google Scholar]
  28. Tsukazaki, A.; Ohtomo, A.; Onuma, T.; Ohtani, M.; Makino, T.; Sumiya, M.; Ohtani, K.; Chichibu, S.F.; Fuke, S.; Segawa, Y.; et al. Repeated temperature modulation epitaxy for p-type doping and light-emitting diode based on ZnO. Nat. Mater. 2005, 4, 42–46. [Google Scholar] [CrossRef]
  29. Joseph, M.; Tabata, H.; Kawai, T. p-Type Electrical Conduction in ZnO Thin Films by Ga and N Codoping. Jpn. J. Appl. Phys. 1999, 38, L1205. [Google Scholar] [CrossRef]
  30. Onodera, A.; Yoshio, K.; Satoh, H.; Yamashita, H.; Sakagami, N. Li-Substitution Effect and Ferroelectric Properties in Piezoelectric Semiconductor ZnO. Jpn. J. Appl. Phys. 1998, 37, 5315. [Google Scholar] [CrossRef]
  31. Onodera, A.; Tamaki, N.; Satoh, H.; Yamashita, H.; Sakai, A. Novel ferroelectricity in piezoelectric ZnO by Li-substitution. In Dielectric Ceramic Materials: Ceramic Transactions; Nair, K.M., Bhalla, A.S., Eds.; American Ceramic Society: Westerville, OH, USA, 1999; Volume 100, pp. 77–94. [Google Scholar]
  32. Islam, E.; Sakai, A.; Onodera, A. Optical Phonons in Ferroelectric-Semiconductor Zn 0.8Li 0.2O Single Crystal Studied by Micro-Raman Scattering. J. Phys. Soc. Jpn. 2001, 70, 576. [Google Scholar] [CrossRef]
  33. Kagami, D.; Takesada, M.; Onodera, A.; Satoh, H. Photoinduced Effect in Li-doped ZnO studied by Raman Scattering. J. Korean Phys. 2011, 59, 2532. [Google Scholar] [CrossRef]
  34. Ohtaka, O.; Fukui, H.; Kunisada, T.; Fujisawa, T.; Funakoshi, K.; Utsumi, W.; Irifune, T.; Kuroda, K.; Kikegawa, T. Phase relations and volume changes of hafnia under high pressure and high temperature. J. Am. Ceram. Soc. 2001, 84, 1369–1373. [Google Scholar] [CrossRef]
  35. Müller, J.; Schröder, U.; Böscke, T.S.; Müller, I.; Böttger, U.; Wilde, L.; Sundqvist, J.; Lemberger, M.; Kücher, P.; Mikolajick, T.; et al. Ferroelectricity in yttrium-doped hafnium oxide. J. Appl. Phys. 2011, 110, 114113. [Google Scholar] [CrossRef]
  36. Müller, S.; Müller, J.; Singh, A.; Riedel, S.; Sundqvist, J.; Schröder, U.; Mikolajick, T. Incipient Ferroelectricity in Al-Doped HfO2 Thin Films. Adv. Funct. Mater. 2012, 22, 2412–2417. [Google Scholar] [CrossRef]
  37. Müller, J.; Böscke, T.S.; Brauhaus, D.; Schröder, U.; Böttger, U.; Sundqvist, J.; Kücher, P.; Mikolajick, T.; Frey, L. Ferroelectric Zr0.5Hf0.5O2 thin films for nonvolatile memory applications. Appl. Phys. Lett. 2011, 99, 112901. [Google Scholar] [CrossRef]
  38. Müller, J.; Böscke, T.S.; Schröder, U.; Müller, S.; Brauhaus, D.; Böttger, U.; Frey, L.; Mikolajick, T. Ferroelectricity in Simple Binary ZrO2 and HfO2. Nano Lett. 2012, 12, 4318–4323. [Google Scholar] [CrossRef] [PubMed]
  39. Shimizu, T.; Katayama, K.; Kiguchi, T.; Akama, A.; Konno, J.; Sakata, O.; Funakubo, H. The demonstration of significant ferroelectricity in epitaxial Y-doped HfO2 film. Sci. Rep. 2016, 6, 32931. [Google Scholar] [CrossRef] [PubMed]
  40. Shimizu, T.; Katayama, K.; Kiguchi, T.; Akama, A.; Konno, T.J.; Hiroshi Funakubo, H. Growth of epitaxial orthorhombic YO1.5-substituted HfO2 thin film. Appl. Phys. Lett. 2015, 107, 032910. [Google Scholar] [CrossRef]
  41. Phillips, J.C. Bonds and Bands in Semiconductors; Academic Press: New York, NY, USA, 1973. [Google Scholar]
  42. Hagino, S.; Yoshio, K.; Yamazaki, T.; Satoh, H.; Matsuki, K.; Onodera, A. Electronic ferroelectricity in ZnO. Ferroelectrics 2001, 264, 235. [Google Scholar] [CrossRef]
  43. Grants, F.A. Properties of Rutile (Titanium Dioxide). Rev. Mod. Phys. 1959, 31, 646–674. [Google Scholar] [CrossRef]
  44. Abrahams, S.C.; Bernstein, J.L. Rutile: Normal Probability Plot Analysis and Accurate Measurement of Crystal Structure. J. Chem. Phys. 1971, 55, 3206–3211. [Google Scholar] [CrossRef]
  45. Parker, R.A. Static Dielectric Constant of Rutile (TiO2), 1.6–1060°K. Phys. Rev 1961, 124, 1719. [Google Scholar] [CrossRef]
  46. Von Hippel, A.R. Dielectric Materials and Applications; John Wiley & Sons: New York, NY, USA, 1954. [Google Scholar]
  47. Gronschorek, W. X-ray charge density study of rutile (TiO2). Z. Kristallogr. 1982, 160, 187–203. [Google Scholar] [CrossRef]
  48. Sakata, M.; Uno, T.; Takata, M.; Mori, R. Electron Density in Rutile (TiO2) by the Maximum Entropy Method. Acta Crystallogr. 1992, B48, 591–598. [Google Scholar] [CrossRef]
  49. Montanari, B.; Harrison, N.M. Pressure-induced instabilities in bulk TiO2 rutile. J. Phys. Condens. Matter 2004, 16, 273. [Google Scholar] [CrossRef]
  50. Bousquet, E.; Spaldin, N.A.; Ghosez, P. Strain-Induced Ferroelectricity in Simple Rocksalt Binary Oxides. Phys. Rev. Lett. 2010, 104, 037601. [Google Scholar] [CrossRef] [PubMed]
  51. Glinchuk, M.D.; Khist, V.; Eliseev, E.A.; Morozovska, A.N. Ferroic properties of nanosized SnO2. Phase Transit. 2013, 86, 903–909. [Google Scholar] [CrossRef]
Figure 1. Crystal structures of (a) Pb1−xGexTe, (b) Cd1−xZnxTe and (c) Zn1−xLixO. The lower figures are plots of cation (blue lines) and anion (red lines) layers along the polar rhombohedral [111] direction for Pb1−xGexTe and Cd1−xZnxTe, and polar [001] direction for Zn1−xLixO [15].
Crystals 07 00232 g001
Figure 2. Dependence of dielectric constant and inverse dielectric constant in Cd1−xZnxTe (x = 0.1) on temperature [17]. Reprinted figure with permission from R. Weil, R. Nkum, E. Muranevich, and L. Benguigui, Physical Review Letters, 62, 2744, 1989. Copyright (1989) by the American Physical Society.
Crystals 07 00232 g002
Figure 3. Crystal structure of ZnO. The observed polarization (p) is shown by a yellow arrow [15].
Crystals 07 00232 g003
Figure 4. Temperature dependence of the dielectric constant of Zn1−xLixO (x = 0.09) [15].
Crystals 07 00232 g004
Figure 5. Phase diagram of the ferroelectric transition temperature (Tc) vs. Li molar ratio (x) in Zn1−xLixO [15].
Crystals 07 00232 g005
Figure 6. P–T phase diagram of HfO2 [34].
Crystals 07 00232 g006
Figure 7. X-ray diffraction patterns of HfO2, Hf0.5Zr0.5O2 and ZrO2 thin films on silicon substrates. The Bragg reflections are assigned as h k l with suffixes m, o and t, which indicate monoclinic, orthorhombic and tetragonal lattices, respectively [38]. Reprinted with permission from Johannes Müller, Tim S. Böscke, Uwe Schröder, et al., Ferroelectricity in Simple Binary ZrO2 and HfO2, Nano Letters, 2012, 12, 4318–4323. Copyright (2012) American Chemical Society.
Crystals 07 00232 g007
Figure 8. Sequence of phase transitions and crystal structures of HfO2.
Crystals 07 00232 g008
Figure 9. P-E hysteresis loops and dielectric constant (ε) in thin films of HfO2-ZrO2 system [38]. Reprinted with permission from Johannes Müller, Tim S. Böscke, Uwe Schröder, et al., Ferroelectricity in Simple Binary ZrO2 and HfO2, Nano Letters, 2012, 12, 4318–4323. Copyright (2012) American Chemical Society.
Crystals 07 00232 g009
Figure 10. Schematic diagram of a shell model for a diatomic crystal.
Crystals 07 00232 g010
Figure 11. The difference Fourier maps of (a) paraelectric ZnO and (b) ferroelectric Zn1−xLixO at 19 K in the (110) plane with a contour increment of 0.2 e3. The horizontal straight lines from Zn to O ions are the [001] direction. Bluish cold color means negative charge density and reddish warm region is positive charge density.
Crystals 07 00232 g011aCrystals 07 00232 g011b
Figure 12. Crystal structure of Rutile TiO2. Ti (blue) and O (red).
Crystals 07 00232 g012
Figure 13. Temperature dependence of dielectric constant of rutile TiO2 along the a- and c-directions. The solid lines are after Parker [45] and the dashed lines after von Hippel [46].
Crystals 07 00232 g013
Figure 14. Electron density map of rutile TiO2 on the (0 0 2) plane. Charge of 0.4 e Å−3 is observed in Ti-O bond.
Crystals 07 00232 g014
Table 1. Phase diagram of HCl and HBr after Hoshino et al. [7].
Phase III FerroelectricPhase II ParaelectricPhase I Liquid
HClOrthorhombic-Bb21mCubic-Fm3mLiquid
Below 98 K98~159 KAbove 159 K
HBrOrthorhombic-Bb21mPhase IIc Orthorhombic-BbcmPhase IIb CubicPhase IIa Cubic-Fm3mLiquid
Below 90 K90~114 K114~117 K117~186 KAbove 186 K
Table 2. Typical values of the Curie-Weiss constant (C), the dielectric constant around Tcmax), and the spontaneous polarization (Ps) according to the type of ferroelectrics.
Type of FerroelectricsC [K]εmax at TcPs [µC/cm2]Example
Order-disorder1~3 × 1031033~5TGS §
Displacive10510410~30BaTiO3
Improper1010SmallACS #
Electronic-210.9ZnO
§ TGS (NH3CH2COOH)3H2SO4), # ACS ((NH4)2Cd2(SO4)3).
Table 3. Dielectric constant and fractional degree of iconicity after J.C. Phillips, Bonds and Bands in Semiconductors [41].
Materialsε at R.T.Fractional Degree of Ionicity
NaCl5.60.94
MgO10.00.84
ZnO8.80.62
CdTe7.10.67
HfO2250.8
ZrO230~460.8
TiO21700.6
Si3.60

